

 Gary E. J. Bold1
- 1 Department of Physics, University of Auckland, Auckland, New Zealand
- 2 Department of Psychology, University of Auckland, Auckland, New Zealand
- 3 Department of Neurology, University of Washington, Seattle, WA, USA
A comparison is made between the frequency of local minima in the analytic power (AP) of intracranial EEG (ECoG) from waking and unconscious human subjects and the frequency of putative frames of consciousness reported in earlier psychological literature. In ECoG from unconscious subjects, the frequency of deep minima in AP is found to be a linear function of bandwidth. In contrast, in ECoG from conscious subjects, the bandwidth/minima-frequency curve saturates or plateaus at minima frequencies similar to the frequencies of previously reported frames of consciousness. This result is consistent with the hypothesis that local minima in AP may act as the shutter in a cinematographic model of consciousness. The fact that artificially generated samples of black noise with power spectra similar to ECoG data give similar results in the analyses above suggests that the discontinuous nature of consciousness is not due to some specifically biological factor, but is simply a consequence of the physical properties of the 1/f (aka power law) oscillations that are widely found in nature.
Introduction
The idea that an individual’s consciousness is not continuous but occurs as a series of discrete chunks or perceptual moments has a long history. It first appeared nearly 2,000 years ago, as the Buddhist doctrine of ksanikavada (Pruden, 1988; Schweizer, 1994). It was considered and rejected in the late nineteenth century by James (1890). The commercialization of movies in the early twentieth century offered an obvious technological metaphor, which led to a good deal of psychological experimentation in the middle of the twentieth century on the question of whether or not consciousness occurs in cinematographic frames (Augenstine, 1955; Stroud, 1955; Allport, 1968; Efron, 1970). Finally, a serious flurry of activity in the late twentieth and early twenty-first centuries resulted from the publication of a paper by Purves et al. (1996) called “The wagon wheel illusion in movies and reality.”
Purves and colleagues reported that an illusion resembling the one which causes rolling wagon wheels to appear to stop and move backward in old cowboy movies also occurs in real life, under natural light. In movies, the illusion is due to aliasing or undersampling of the wheel’s motion, caused by the fact that silent movies ran at only 16 frames per second (i.e., 62.5 ms per frame), which was found empirically to be the minimum refresh rate necessary for generation of the visual illusion of continuous motion when the subject was moving at the speed of a walking human. Initially it seemed an obvious conclusion that a similar undersampling effect explained the real-life version of the wagon wheel illusion, which in turn implied the existence of discrete perceptual moments similar to the discrete frames of movie footage (Purves et al., 1996; Crick and Koch, 2003; VanRullen and Koch, 2003; Sacks, 2004). However experimental reports soon started appearing which either denied the occurrence of the wagon wheel illusion altogether (Pakarian and Yasamy, 2003) or confirmed the effect but described new experimental evidence that contradicted the aliasing explanation – for example that the apparent reversal of the wheel’s rotation never occurred when the wheel was seen in a mirror (Kline et al., 2004). Controversy erupted (Andrews and Purves, 2005; Andrews et al., 2005; Holcombe et al., 2005) and the argument was never definitively settled.
However, investigations of a more physiological nature – for example, the reports of Lehmann and colleagues that EEG data occur in a series of spatially defined “microstates” (Lehmann, 1971; Lehmann et al., 1987, 1998; Lehmann and Koenig, 1997) – also strongly suggest a discontinuity in consciousness. Similar discrete brain states were reported by Freeman and colleagues(Freeman and Rogers, 2002; Freeman et al., 2003a,b; Freeman, 2004a,b), who showed that the analytic power (AP) of band-pass filtered EEG exhibits a series of local minima or “null spikes” at which the analytic phase of the EEG time series jumps abruptly and the relatively constant spatial electromagnetic pattern seen in any given area of brain changes to a different spatial pattern. These results led Freeman (2006) to hypothesize that the state transitions occurring at AP minima might provide a physiological basis for the frames of a cinematographic consciousness.
With slight modification to emphasize the delineation of frames only by deep minima in AP, this null-spikes-as-shutter hypothesis fits neatly into the electromagnetic field theory of consciousness (Pockett, 1999, 2000, 2002, 2007, 2011, in press). The electromagnetic field theory of consciousness proposes that conscious experiences are identical with certain electromagnetic patterns generated by brain activity. This implies that periods when brain-generated electromagnetic activity falls below some threshold level should correlate with periods when consciousness fails – which is exactly what the modified null-spikes-as-shutter hypothesis proposes.
The idea that electromagnetic activity has to exceed some minimum value in order to subserve consciousness already garners some empirical support from the neuromagnetic experiments of Tononi et al. (1998). In the words of those authors “1. Neural responses to rivalrous visual stimuli occurred in a large number of cortical regions, both when the subject consciously perceived the stimuli and when he did not. 2. Responses evoked by a stimulus over a large portion of the scalp were stronger when the subjects were conscious of it that when they were not.” This indicates that relatively strong electromagnetic activity is a correlate of consciousness.
At this stage it is important to be clear that a minimum amount of electromagnetic activity is proposed by the wider electromagnetic field theory of consciousness and the narrower null-spikes-as-shutter hypothesis as being necessary but not sufficient for consciousness. The most recent formulation of the electromagnetic field theory (Pockett, 2011, in press) also proposes an additional factor as being necessary but not sufficient for consciousness: a particular pattern of LFP-generated electric charge in the radial direction, perpendicular to the surface of the brain. This pattern is not measurable by surface electrodes like those used in the present study, which can only deliver a measure of the overall amplitude of electric transients occurring within a few mm in any direction from each electrode, but its specification of the radial pattern is important, because if voltage clamping of elements of the proposed pattern were to cause changes in consciousness without changes in ongoing neural activity, this would provide strong empirical support for the electromagnetic field theory of consciousness as opposed to the psychoneural identity theory. Even then, however, the electromagnetic field theory would still be in a very early stage of its formulation. A great deal more empirical work would still be necessary to define the factors that are not only necessary but also sufficient for any given conscious experience.
The null-spikes-as-shutter hypothesis refers only to one of a number of factors that put constraints on consciousness. It says that in the absence of enough overall electromagnetic amplitude, it does not matter whether what amplitude you do have is disposed in the correct spatial pattern or not – you can not have consciousness. Of course the converse is not implied: there are a multitude of possible situations where there is too little electromagnetic amplitude to support consciousness and very few of them would ever be able to generate electromagnetic patterns that would be sufficient for consciousness. The point is that the null-spikes-as-shutter hypothesis refers only to one factor that constrains consciousness. It does not claim to specify anything that is even remotely diagnostic of a conscious experience.
That being said, the main aim of the work reported here is to test the validity of the null-spikes-as-shutter hypothesis. According to Popper’s (1995) classic Logik der Forschung, it is not possible to prove a scientific hypothesis – the best that can be done is to fail to falsify it. One way of attempting to falsify the null-spikes-as-shutter hypothesis would be to measure the frequency of deep local minima in the AP of EEG data and compare this with the frequency of the putative frames of consciousness reported in the psychological literature. If the two sets of frequencies proved to be radically different, the null-spikes-as-shutter hypothesis would be falsified. If there were good correlation between the two sets of frequencies, both the idea that consciousness occurs in frames and the hypothesis that AP minima serve to delineate those frames would be supported – though of course not proven.
However, there is one major difficulty associated with doing such a test. The problem is that Rice (1952) showed mathematically that the frequency of local minima in the AP of white noise filtered by an ideal band-pass filter is linearly related to the bandwidth of the filter. Specifically (Rice, 1952 p.9):

Under most conditions EEG more closely resembles brown or black noise than the white noise analyzed by Rice, but both Freeman (2009) and Ruiz et al. (2010) have tested Rice’s relationship empirically and found that, at least for narrow bandwidths, EEG data do conform remarkably well to Eq.1. This makes it difficult to do a clean empirical test of the null-spikes-as-shutter hypothesis, because it is far from clear how (or even whether) the unsampled electromagnetic products of brain activity are intrinsically band limited. A good deal of evidence suggests that various passbands within the gamma range are associated with various kinds of consciousness (e.g., Tallon-Baudry and Bertrand, 1999; Summerfield et al., 2002; Tallon-Baudry, 2009) and ongoing theta (Freeman, 2009; Busch and VanRullen, 2010) or alpha (Varela et al., 1981; Mathewson et al., 2009) oscillations have also been reported to be important in facilitating consciousness. But according to Eq. 1, it is not the center frequency of any filter passband that matters with regard to the frequency of frames, it is the width of the passband – and there is presently no empirical evidence at all to guide the selection of any particular band width for a principled comparison of the frequency of AP minima with the frequency of psychologically measured frames of consciousness.
Here we address this issue by measuring the frequency of deep AP minima in ECoG data from conscious and unconscious subjects, over an extended series of bandwidths and for several different values of required minimum AP. We then compare the results of these measurements with the durations of the putative frames of consciousness reported in the psychological literature. We also repeat these analyses on samples of artificial black noise with the same power density spectra as waking ECoG.
Materials and Methods
Data
Data were recorded from four adult subjects in whom intracranial electrodes had been implanted for the clinical purpose of localizing epileptic foci. The subjects (three female) ranged in age from 23 to 38 years. All had medically refractory, localization-related epilepsy, manifested by complex partial and secondarily generalized seizures, and all were candidates for epilepsy surgery. The subjects were evaluated at the University of Washington Regional Epilepsy Center, based at Harborview Medical Center in Seattle, Washington. Initial non-invasive evaluation included detailed history, clinical examination, standard EEG, magnetic resonance imaging, neuropsychological assessment, and longterm scalp EEG-video monitor studies. After determination that invasive EEG recordings were necessary to localize seizure onsets, each subject underwent longterm intracranial subdural EEG-video monitor recordings, which included placement of a subdural, 64 contact, 8 × 8 grid of electrodes over the convexity of the cerebral hemisphere of interest, supplemented by subdural strip electrodes (6–16 electrodes each) implanted over adjacent cortical regions. The interelectrode distance (center to center) within an individual grid or strip array was 10 mm and the total number of intracranial electrodes ranged from 98 to 128 contacts. The location of the grid in one patient is shown in Figure 1: location in the other three patients was similar. The location of invasive electrodes and length of time deemed necessary for continuous EEG-video recordings were dictated solely by clinical considerations. Each patient gave informed consent prior to invasive EEG recordings, and permission for EEG analysis for research purposes was obtained from the University of Washington Human Subjects Review Committee.
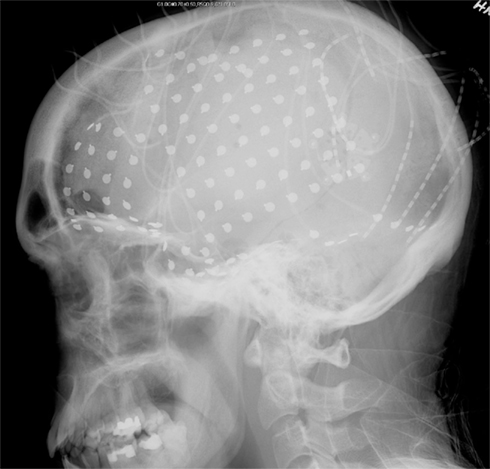
Figure 1. Location of recording electrodes.
Data were recorded at a sampling rate of 500 Hz for two of the subjects and 2000 Hz for the other two, with analog passbands of 1–100 Hz. Since the subjects were routinely videotaped, seizure activity was easily identified from the video as well as from visual inspection of the intracranial EEG records. Waking data were obtained from time periods when the video showed the subject in a state of quiet wakefulness and the EEG data were artifact-free on visual inspection. Postictal recordings were selected from 1 min time periods immediately following a convulsive seizure, when high voltage ictal activity ceases and the EEG appears on visual analysis to be of relatively low amplitude and “quiescent,” with minimal artifact. During this period all subjects were deemed unconscious, on the grounds that they were amnestic and unresponsive to external stimuli (Pockett and Holmes, 2009).
For comparison with these data, power law artificial noise was generated by convolving random noise with a 1/fβ filter, where β = 0 for white noise, 1 for pink noise, 2 for brown noise, and 3 for black noise.
Signal Processing
Signal processing was done in Matlab. ECoG data were visually inspected via plots of the time series at each electrode and the occasional channel containing significant recording artifacts was discarded. The remaining channels were converted to a single spatial ensemble average (SEA) by taking the mean of all channels at each time point. A notch filter was applied to remove the spike of 60 Hz line noise, by Fourier transforming the SEA, replacing the 60 Hz value with the mean of the values in the two adjacent frequency bins and then applying the inverse Fourier transform.
Power density spectra (P) as a function of frequency (f) were computed for the notched SEA data using the Thompson multitaper method (Matlab “pmtm.m”). The power spectra for all four subjects were then averaged and the result plotted on log–log axes. The slope of this plot was determined by fitting a linear regression line to the values log(Pi) and log(fi) (i = 1, 2, …, n) for the frequency range selected, using a weighting scheme designed to compensate for the fact that in a log–log plot there are an exponentially increasing number of points at higher frequencies. Specifically, the regression process solved for the parameters α and β which minimize the weighted least squares residual
where the weight wi is

and σi is the SE for the logarithm of the mean power density obtained from the four individual log–log plots. The  factor effects the compensation for unequally spaced spectral components on the log–log plot. In the case of constant σi, this would ensure that the total weighting for the points in a given frequency range would be proportional to the change in log(f) over that range (and hence the weighting per decade would be constant).
The SE in the slope was calculated using the analytic expression for the slope β recast as a linear combination of the power densities and combining the SEs of the power density components on the assumption that there is no correlation of errors between individual power density components.
The notched SEA time series were then filtered into a series of increasingly wide passbands around a selected center frequency. At very narrow bandwidths, standard FIR filters produced passbands in which the upper and lower frequency transition regions were a substantial fraction of the total bandwidth, which made comparison of our empirical results with Rice’s theoretical equation (which assumes a perfect filter) dubious. We therefore abandoned FIR filtering and instead windowed the FFT-derived frequency spectrum directly, using a window employing a bi-exponential spline around the nominated upper and lower passband indices. End effects were obviated by adding inverted copies of the data to each end of the time series before applying the bi-exponential filter. For each set of filtered data, a time series of AP was then computed by calculating the analytic signal (Matlab “hilbert.m”) and adding the square of the real part of the analytic signal to the square of the imaginary part of the analytic signal. Finally the data extensions were removed.
Deep minima were picked in the resulting AP time series by first picking all minima (by comparing each data point in the time series with the data points on either side of it) and then selecting only those minima the amplitude of which fell below a given threshold, which was expressed in terms of a percentage of the mean amplitude of all minima in that dataset. In a few cases, this algorithm was extended to ignore the larger of two minima bracketing a peak which itself failed to rise above the threshold.
Results
Figure 2 serves as an intuition pump to demonstrate the meaning of AP. The analytic signal of a real data sequence is a complex transform which has a real part identical to the original data and an imaginary part containing the Hilbert transform, which is a version of the original signal phase-shifted by 90°. Analytic power scribes out the envelope of the squared (real + imaginary) parts of the analytic signal. Essentially, AP approaches zero when there is very little deviation of the original signal from zero, in either a positive or negative direction.
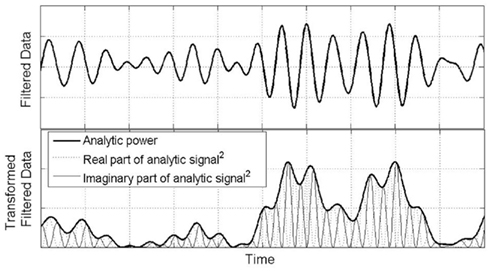
Figure 2. Relationship of analytic power to time series.
Figure 3 shows the power density spectra of raw waking ECoG (Figure 3A) and raw ECoG recorded during the postictal state of unconsciousness (Figure 3B). The mean slope of the log–log plot for all subjects in Figure 3A is −2.93 ± 0.09 (mean ± SD). The slope of the major portion of the log–log plot in Figure 3B is 0.07 ± 0.05.
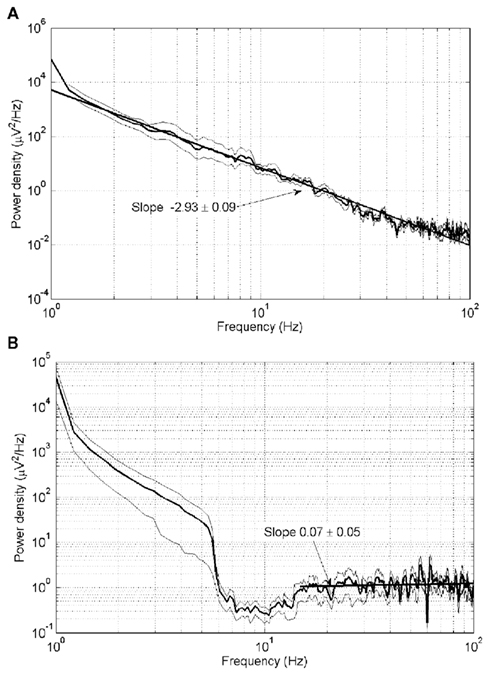
Figure 3. Power density spectra for (A) waking ECoG and (B) postictally unconscious ECoG. Thick lines: mean of all four subjects. Thin lines: plus and minus one SD from the mean.
Figure 4 shows the AP time series of segments of (Figure 4A) waking and (Figure 4B) postictal ECoG data, with circles around the minima picked in our analysis. It can be seen that in waking data (Figure 4A), many of the minima in the AP time series do not approach zero, but appear only as high frequency but low-power blips on the flanks of the much larger low-frequency peaks. In contrast, most of the minima in the AP time series of postictal (unconscious) data (Figure 4B) do approach zero. This is because raw postictal data largely have the flat power spectrum of white noise, in which high frequencies have the same power as low frequencies (see Figure 3B). Therefore in postictal AP data there are no small (low-power), high-frequency blips on the shoulder of large (higher-power), low-frequency peaks.
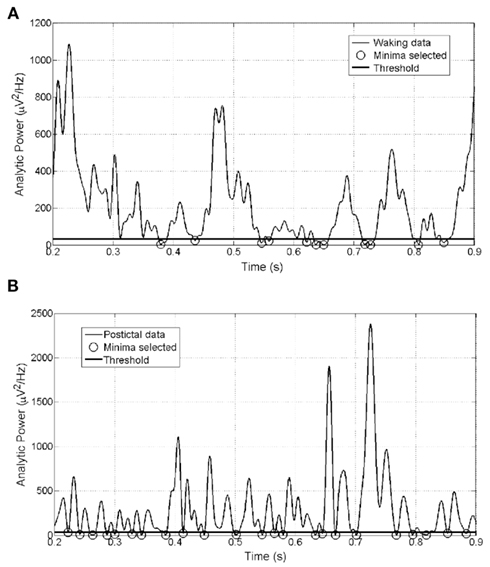
Figure 4. Minima selected in segments of (A) waking and (B) postictally unconscious ECoG from the same subject. Threshold below which minima must fall in order to be counted (horizontal line) set at 30% of the mean amplitude for all minima in this dataset.
A further observation is that at around times 0.64 and 0.73 s in Figure 4A, two local minima are picked which (a) occur very close together in time and (b) bracket a maximum or peak which itself fails to rise above the set threshold (horizontal line). On the rationale that such peaks could no more be expected to subserve consciousness than the minima that delineate them, some of the analyses reported below were repeated using a minima-picking algorithm designed to ignore the larger of two such minima. This involved an exceptionally complex algorithm which tended to cause Matlab to throw out-of-memory errors, and since it was found to make essentially no difference to the results of the further analyzes, these were mostly performed using the simpler minima-picking code described in the Section “Materials and Methods.”
Figure 5 shows how these observations play out into the “Rice curves” of waking and postictal data. It can be seen that above a bandwidth of about 60 Hz, the frequency of AP minima in waking data plateaus or saturates at about 17 Hz (mean of all subjects, with the threshold below which minima have to fall in order to be counted set at 30% of all minima in the dataset in question). In contrast, the frequency of AP minima in postictally unconscious data maintains a rectilinear relationship with bandwidth up to the highest available bandwidth, which in this case was constrained by the setting of the analog low pass filter in the recording apparatus.
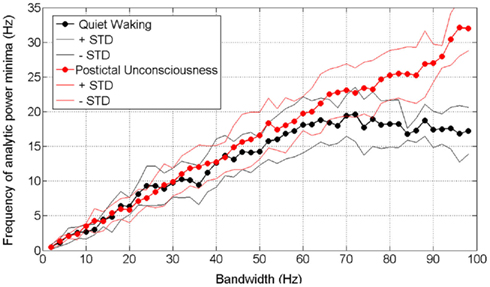
Figure 5. Rice curves for waking and postictally unconscious ECoG data. Analytic power minima with threshold set at 30% (as in Figure 4). Center frequency of all passbands is 50 Hz – thus a bandwidth of 40 Hz on the horizontal axis represents a passband of 30–70 Hz and a bandwidth of 60 Hz represents a passband of 20–80 Hz. Circles represent mean values for all four subjects.
Table 1 illustrates the effect of changing the threshold setting on the frequency at which AP minima saturate, showing individual results for each subject. It can be seen that the SD of the 20 observations in the plateau region of all Rice curves are relatively small, indicating that the plateaux are quite flat. For each subject the mean plateau value increases in a predictable fashion as the threshold is raised, allowing more minima to be counted. For any given subject and setting, the frequency of AP minima in the SEA (shown) was not significantly different from that in data from a random single electrode in the middle of the main grid (p > 0.05, t-test).
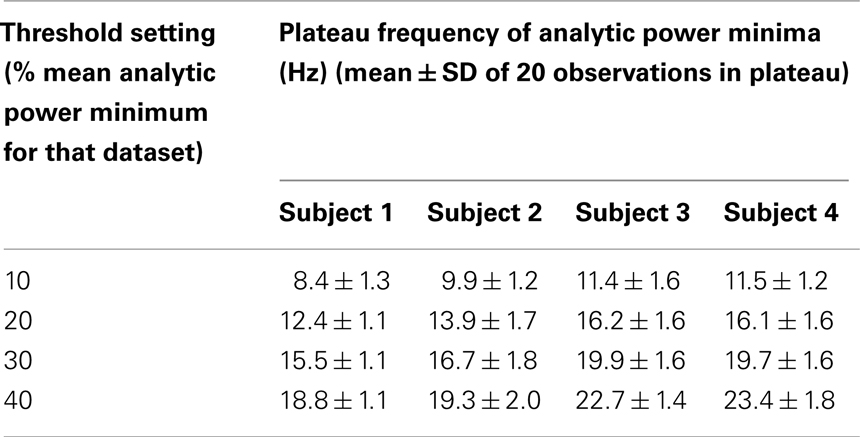
Table 1. Effect of threshold setting on plateau frequency of analytic power minima in waking ECoG.
Artificial noise constructed to have the power density spectra with log–log slopes similar to those of our ECoG data produced Rice curves similar to those of the data.
Discussion
The stated aim of this series of analyses was to investigate the idea that consciousness occurs in frames because AP occurs in frames, by comparing our physiological measurements of AP with the psychological evidence in the literature on frames of consciousness.
Table 2 summarizes the psychological evidence in the literature. Most experiments report that vision occurs in frames lasting between 50 and 100 ms, i.e., at frame frequencies of 10–20 Hz. Table 1 summarizes the frequencies at which deep AP minima plateau in our waking ECoG, with a Rice curve center frequency of 50 Hz (mid-gamma, widely thought to be an important frequency range with regard to consciousness) and the threshold below which an AP minimum had to fall in order to be counted set at between 10 and 40% of the mean minimum in the dataset. The frequency of AP minima plateaus at between 8.4 ± 1.3 Hz (for Subject 1 with the AP minimum threshold set at 10%) and 23.4 ± 1.8 Hz (for Subject 4 with the AP minimum threshold set at 40%). Hence, the frequency of AP minima in ECoG from our waking subjects closely parallels the frequency of frames of visual consciousness reported in the psychological literature – not only over a wide range of bandwidths, but also for a wide range of threshold minimum values (from 10 to 40% of the mean minimum in the dataset).
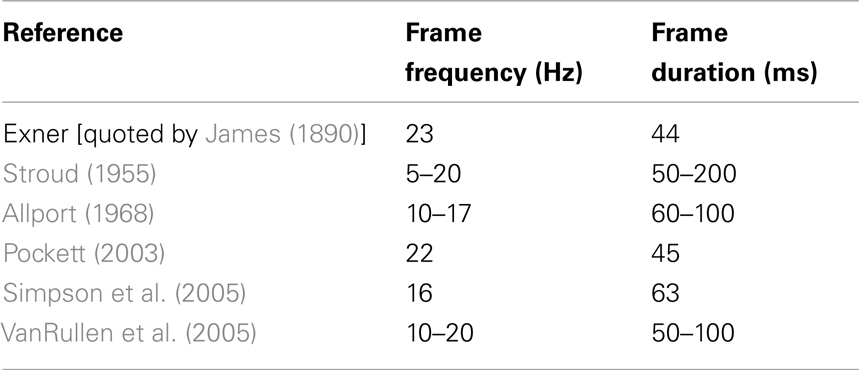
Table 2. Frequencies of frames of visual consciousness in psychological literature.
These results arise from spatially averaged ECoG, recorded from subjects who were not performing a visual task set by the experimenter, but simply resting quietly with eyes open. Thus one question is whether or not the AP minima we measured were merely artifacts of spatial averaging, and another is whether or not we were actually measuring the neural correlates of visual consciousness.
With regard to the first question, individual minima certainly did fall at different times in the SEA and in data from individual electrodes, but the overall values at which minima plateaued in the two datasets were not significantly different. Even individual electrodes in a commercial ECoG grid integrate data from a relatively large area of brain. Whether this is seen as a flaw or an advantage depends on one’s views about the spatial scale that is important in the study of consciousness. Those who believe, with Crick (1994) and others, that the firing of action potentials by single cells is the important thing might well recommend wholesale rejection of the entire literature on the relationship of consciousness to ECoG or scalp EEG. On the other hand, champions of the electromagnetic field theory of consciousness tend to agree with Walter Freeman’s long-held view that the mesoscopic spatial scale is more relevant than either the microscopic or macroscopic scales. On yet another axis, proponents of the global workspace model (Baars, 1988; Dehaene et al., 2006) might prefer the macroscopic scale that is arguably captured by Freeman’s original introduction of the SEA as an object of study. One interesting thing that emerges from our present analysis is that in the matter of the frequency of local minima in AP, there seems to be little difference between the mesoscopic and macroscopic scales.
The second issue about the present analysis is whether or not our data relate specifically to visual consciousness. This question can be subdivided into two parts – first whether the data are specific to consciousness, and secondly whether they are specific to visual consciousness.
The first part of this issue is addressed by our comparison of data from awake and postictally unconscious subjects. We chose the postictal state as the safest possible example of general unconsciousness because all other supposedly unconscious states were not represented by data available to us – and indeed may not be represented in a very secure way by any data.
Unconsciousness is generally inferred if two criteria are met: the subject is (a) unreactive (does not respond to external stimuli) and (b) amnestic (does not remember afterward being conscious at the time in question). With regard to anesthesia, these criteria may on the face of it be fulfilled in most cases, but it can not reasonably be inferred from this that at any given point in time surgical anesthesia has necessarily resulted in unconsciousness. In purely pragmatic terms, the main aims of an anesthetist are threefold: (1) keep the patient alive (2) keep the patient from moving and (3) keep the patient from initiating a malpractice suit. With regard to aim (1), the zone between unconsciousness and death can be hazardously narrow, so it is in everyone’s interest that anesthesia be kept as light as possible. In practice, this means that aim (2) is routinely achieved by the use of neuromuscular blocking agents (Murphy et al., 2002). Without these, patients are often so reactive to surgical stimuli that life becomes difficult for the surgeon. Neuromuscular blocking agents act peripherally at the neuromuscular junction and are well known to paralyze even wide awake individuals, so while their use may result in formal fulfillment of the criterion of unreactivity, it can hardly be concluded that this necessarily means the patient is unconscious. With regard to the anesthetist’s third aim and the second criterion of unconsciousness, it is common practice to add to the anesthetic cocktail one or more drugs that compromise memory formation. Despite this, the incidence of intraoperative awareness with recall is reported to range from 0.2% in non-cardiac, non-obstetric surgery to 11–43% in major trauma surgery (Ghoneim, 2000). Pain is often reported to be absent during such unintended awakenings, since adequate analgesia can exist independently of adequate anesthesia. This is fortunate, because it is arguable that a higher incidence of intraoperative awareness with recall may be prevented only by routine blockade of recall by the previously mentioned memory formation blockers. If a patient wakes up during the operation but fails to remember this afterward, does it matter? In legal terms, probably not. A simple benzodiazepine pre-med effectively inhibits formation of any peri-operative memories.
The other major state in which unconsciousness might be inferred is NREM sleep. But NREM sleep is now known not to be necessarily dream-free (Hobson et al., 2000). Dreams are certainly a form of consciousness, albeit one in which the subject is usually both unreactive and amnestic – so again, where does that leave our two criteria of unconsciousness?
In contrast, the postictal state that occurs during the few minutes after cessation of a generalized tonic–clonic seizure is one in which the patient is unreactive, amnestic, and producing ECoG data with power spectra so completely different from those produced by waking brains (cf Figures 3A,B) or brains in NREM sleep (Freeman et al., 2006) that there seems little possibility of its underpinning any covert form of consciousness. When the subject is in this state, Figure 5 shows that no plateau occurs in the Rice curve. The complete lack of a Rice curve plateau in data from unconscious subjects reinforces the idea that the Rice curve plateau may be the important thing in determining the frame frequency of consciousness.
With regard to the question of whether or not our data relate specifically to visual consciousness: our subjects were certainly not performing visual tasks set by the experimenter. However, the video record showed that they were awake with eyes open, so it is a reasonable inference that they were experiencing visual sensations. The environment was quiet, so they were unlikely to be experiencing auditory sensations (with the possible exception of tinnitus). They were not in pain, so they were probably not experiencing any significant somatosensory sensations. Given that generally only experienced mediators are able to stop thinking completely, our subjects probably were experiencing conscious cognition. But in terms of sensation, vision is likely to have been the overwhelming form of consciousness experienced by our waking subjects. We were not able for clinical reasons to obtain data from grids placed over early visual areas, but the processing of visual information certainly involves activity in very widespread areas of brain, including some areas directly under the electrode grids and strips from which our measurements were taken (Logothetis and Schall, 1989; Leopold and Logothetis, 1996; Sheinberg and Logothetis, 1997; Tononi et al., 1998; Kreiman et al., 2000; Gattass et al., 2005; Quiroga et al., 2005).
Hence we argue that our data are consistent with the hypothesis that
(i) A certain minimum value of AP – for our data probably more than 50 μV2/Hz – is necessary (albeit not sufficient) for visual consciousness and
(ii) Because the AP generated by the waking brain repetitively falls below this minimum at intervals that are on average not shorter than 50–100 ms, visual consciousness occurs in frames or chunks lasing at least 50–100 ms.
In other words, deep minima in brain AP may well act as the shutter in a cinematographic model of consciousness.
The question of whether this AP-related discontinuity of consciousness arises from some specifically biological factor or purely as a consequence of the physical properties of 1/f signals is answered by our examination of artificial 1/f noise. Repeating our analyzes on artificial noise showed that artificial 1/f signals constructed to have the same power spectra as biological data produce the same Rice curves as the biological data. This suggests the following multi-part answer to the question “why is consciousness discontinuous?”:
1. Local AP minima occur in all 1/f (aka power law) spectra, whether or not the generators of those spectra have anything to do with consciousness. Local minima are simply a physical feature of 1/f spectra.
2. All EEG data have 1/f spectra. In data from conscious subjects the exponent of the f is between 2 and 3. In data from our postictally unconscious subjects the exponent of f over most of the frequency spectrum is essentially 0. But in both cases the spectra are 1/f.
3. Hence, the AP time series of all EEG data – irrespective of whether or not they underpin consciousness – have local minima. Brain AP occurs in frames.
4. Therefore, IF (as proposed by both the EM field theory of consciousness and the null-spikes-as-shutters hypothesis) a certain amount of brain-generated AP is necessary for consciousness, consciousness must occur in frames.
5. It is not logical to suggest the converse: that all data with AP minima must have something to do with consciousness.
This answer is supported and extended by a closer look at the Rice curves generated by the different exponents of f in data from conscious and unconscious brains. It can be seen (Figure 5; Table 1) that the duration of the frames of AP in conscious brains saturates or plateaus at approximately the same duration reported by a number of earlier psychological studies on frames of consciousness (Table 2). The psychological studies more or less agree that consciousness comes in frames lasting in the range of 50–100 ms. The Rice curves in the present study plateau at frame durations of about 50–100 ms. This correspondence provides support not only for the null-spikes-as-shutter hypothesis, but also for the wider electromagnetic field theory of consciousness, both of which predict that consciousness should occur in frames because AP occurs in frames. If AP frames in data from conscious brains had turned out to have radically different durations from the frames of consciousness reported by the psychological studies, the null-spikes-as-shutter hypothesis would have been disproved. But they did not – there is rough coincidence between AP frame duration and consciousness frame duration.
In contrast, when the data analyzed in Rice curves come from unconscious brains, no plateau of frame duration is evident. As the data are filtered into increasingly wide passbands, the duration of AP frames just keeps getting shorter. There is no obvious correspondence between the duration of AP frames and the duration of previously reported frames of consciousness. This is obviously a much weaker argument in favor of the theory and hypothesis under investigation, but the non-correspondence is at the very least interesting.
A number of further questions are raised by the above answer to the question “why is consciousness discontinuous?” For example, it would be nice to know the mechanism by which the brain generates 1/f spectra in the first place. It would be even nicer to know exactly what is going on in the brain between the deep local minima in AP that we measure, and how this differs between conscious and unconscious brains.
With regard to the former question, the answer is simply unknown. Power law (aka 1/f) spectra are ubiquitous in nature. They are generated by all manner of processes which on the face of it are completely unrelated. Nobody understands why. In fact, as Ward and Greenwood (2007) put it, “The ubiquity of 1/f noise has been described as one of the oldest puzzles of contemporary physics and science in general.” Certainly the present authors have tried and failed to understand the synaptic mechanisms by which the 1/f spectra of EEG in particular are generated. This failure is probably not surprising, considering that the exact synaptic mechanisms by which any given sample of EEG is generated presently remain obscure.
When it comes to the latter question, the situation is slightly better. With regard to AP, one difference between conscious and unconscious brains is that the intermittently widespread phase synchrony characteristic of waking brains (Pockett et al., 2009) is greatly reduced in unconscious brains (Pockett and Holmes, 2009). Pockett (in press) expands earlier statements of the electromagnetic field theory of consciousness to a model of the shape of conscious as opposed to unconscious brain-generated electromagnetic patterns which transparently explains these and other observations. Further work on the active networks revealed by electrode-to-electrode synchrony measurements in waking and unconscious brains is planned.
Conflict of Interest Statement
The authors declare that the research was conducted in the absence of any commercial or financial relationships that could be construed as a potential conflict of interest.
References
Allport, D. A. (1968). Phemomenal simultaneity and the perceptual moment hypothesis. Br. J. Psychol. 59, 395–406.
Andrews, T., and Purves, D. (2005). The wagon-wheel illusion in continuous light. Trends Cogn. Sci. 9, 261–263.
Andrews, T. J., Purves, D., Simpson, W. A., and VanRullen, R. (2005). The wheels keep turning: reply to Holcombe et al. Trends Cogn. Sci. 9, 560–561.
Augenstine, L. G. (1955). “Evidences of periodicities in human task performance,” in Information Theory in Psychology: Problems and Methods, ed. H. Quastler (Glencoe, IL: Free Press), 208–231.
Busch, N. A., and VanRullen, R. (2010). Spontaneous EEG oscillations reveal periodic sampling of visual attention. Proc. Natl. Acad. Sci. U.S.A. 107, 16048–16053.
Crick, F. (1994). The Astonishing Hypothesis: The Scientific Search for the Soul. New York: Simon and Schuster.
Dehaene, S., Changeux, J.-P., Naccache, L., Sackur, J., and Sergent, C. (2006). Conscious, preconscious and subliminal processing: a testable taxonomy. Trends Cogn. Sci. 10, 204–211.
Freeman, W. J. (2004a). Origin, structure and role of background EEG activity. Part 1 Analytic amplitude. Clin. Neurophysiol. 115, 2077–2088.
Freeman, W. J. (2004b). Origin, structure and role of background EEG activity. Part 2 Analytic phase. Clin. Neurophysiol. 115, 2089–2107.
Freeman, W. J. (2006). A cinematographic hypothesis of cortical dynamics in perception. Int. J. Psychophysiol. 60, 149–161.
Freeman, W. J. (2009). Deep analysis of perception through dynamic structures that emerge in cortical activity from self-regulated noise. Cogn. Neurodyn. 3, 105–116.
Freeman, W. J., Burke, B. C., and Holmes, M. D. (2003a). Aperiodic phase re-setting in scalp EEG of beta-gamma oscillations by state transitions at alpha-theta rates. Hum. Brain Mapp. 19, 248–272.
Freeman, W. J., Holmes, M. D., Burke, B. C., and Vanhatalo, S. (2003b). Spatial spectra of scalp EEG and EMG from awake humans. Clin. Neurophysiol. 114, 1053–1068.
Freeman, W. J., Holmes, M. D., West, G. A., and Vanhatalo, S. (2006). Dynamics of human neocortex that optimizes its stability and flexibility. Int. J. Intell. Syst. 21, 881–901.
Freeman, W. J., and Rogers, L. J. (2002). Fine temporal resolution of analytic phase reveals episodic synchronization by state transitions in gamma EEGs. J. Neurophysiol. 87, 937–945.
Gattass, R., Nascimento-Silva, S., Soares, J. G. M., Lima, B., Jansen, A. K., Diogo, A. C. M., Farias, M. F., Marcondes, M., Botelho, E. P., Mariani, O. S., Azzi, J., and Fiorani, FM. (2005). Cortical visual areas in monkeys: location, topography, connections, columns, plasticity and cortical dynamics. Philos. Trans. R. Soc. B 360, 709–731.
Hobson, J. A., Pace-Schott, E. F., and Stickgold, R. (2000). Dreaming and the brain: toward a cognitive neuroscience of conscious states. Behav. Brain Sci. 23, 793–1121.
Holcombe, A. O., Clifford, C. W. G., Eagleman, D. M., and Pakarian, P. (2005). Illusory motion reversal in tune with motion detectors. Trends Cogn. Sci. 9, 559–560.
Kline, K., Holcombe, A. O., and Eagleman, D. M. (2004). Illusory motion reversal is caused by rivalry, not by perceptual snapshots of the visual field. Vision Res. 44, 2653–2658.
Kreiman, G., Koch, C., and Fried, I. (2000). Catergory-specific visual responses of single neurons in the human medial temporal lobe. Nat. Neurosci. 3, 946–953.
Lehmann, D. (1971). Multichannel topography of human alpha EEG fields. Electroencephalogr. Clin. Neurophysiol. 31, 439–449.
Lehmann, D., and Koenig, T. (1997). Spatio-temporal dynamics of alpha brain electric fields and cognitive modes. Int. J. Psychophysiol. 26, 99–112.
Lehmann, D., Ozaki, H., and Pal, I. (1987). EEG alpha map series: brain micro-states by space-oriented adaptive segmentation. Electroencephalogr. Clin. Neurophysiol. 67, 271–288.
Lehmann, D., Strik, W. K., Henggeler, B., Koenig, T., and Koukkou, M. (1998). Brain electric microstates and momentary conscious mind states as building blocks of spontaneous thinking: I. Visual imagery and abstract thoughts. Int. J. Psychophysiol. 29, 1–11.
Leopold, D. A., and Logothetis, N. K. (1996). Activity changes in early visual cortex reflect monkeys’ percepts during binocular rivalry. Nature 379, 549–553.
Logothetis, N. K., and Schall, J. D. (1989). Neuronal correlates of subjective visual perception. Science 245, 761–763.
Mathewson, K. E., Gratton, G., Fabiani, M., Beck, D. M., and Ro, T. (2009). To see or not to see: prestimulus alpha phase predicts visual awareness. J. Neurosci. 29, 2725–2732.
Murphy, G. S., Szokol, J. W., Vender, J. S., Marymont, J. H., and Avram, M. J. (2002). The use of neuromuscular blocking drugs in adult cardiac surgery: results of a national postal survey. Anesth. Analg. 95, 1534–1539.
Pakarian, P., and Yasamy, M. T. (2003). Wagon-wheel illusion under steady illumination: real or illusory? Perception 32, 1307–1310.
Pockett, S. (1999). Anesthesia and the electrophysiology of auditory consciousness. Conscious. Cogn. 8, 45–61. Available at: http://www.psych.auckland.ac.nz/webdav/site/psych/shared/about/our-people/documents/sue-pockett/TheNatureofConsciousnessAHypothesis.pdf
Pockett, S. (2002). Difficulties with the electromagnetic field theory of consciousness. J. Conscious. Stud. 9, 51–56.
Pockett, S. (2003). How long is “now”? Phenomenology and the specious present. Phenomenol. Cogn. Sci. 2, 55–68.
Pockett, S. (2007). Difficulties with the electromagnetic field theory of consciousness: an update. Neuroquantology 3, 271–275.
Pockett, S. (2011). Initiation of intentional actions and the electromagnetic field theory of consciousness. Humana Mente 15, 159–175.
Pockett, S. (in press). The electromagnetic field theory of consciousness: a testable hypothesis about the characteristics of conscious as opposed to non-conscious fields. J. Conscious. Stud.
Pockett, S., Bold, G. E. J., and Freeman, W. J. (2009). EEG synchrony during a perceptual-cognitive task: widespread phase synchrony at all frequencies. Clin. Neurophysiol. 120, 695–708.
Pockett, S., and Holmes, M. D. (2009). Intracranial EEG power spectra and phase synchrony during consciousness and unconsciousness. Conscious. Cogn. 18, 1049–1055.
Purves, D., Paydarfar, J. A., and Andrews, T. J. (1996). The wagon wheel illusion in movies and reality. Proc. Natl. Acad. Sci. U.S.A. 93, 3693–3697.
Quiroga, R. Q., Reddy, L., Kreiman, G., Koch, C., and Fried, I. (2005). Invariant visual representation by single neurons in the human brain. Nature 435, 1102–1107.
Rice, S. O. (1952). Mathematical Analysis of Random Noise. New York: Monograph B-1589 Bell Telephone Labs Inc., 162.
Ruiz, Y., Pockett, S., Freeman, W. J., Gonzalez, E., and Guang, L. (2010). A method to study global spatial patterns related to sensory perception in scalp EEG. J. Neurosci. Methods 191, 110–118.
Sacks, O. (2004). In the River of Consciousness. New York Review of Books. Available at: http://www.readability.com/read?url=http://www.nybooks.com/articles/archives/2004/jan/15/in-the-river-of-consciousness/?page=2
Schweizer, P. (1994). Momentary consciousness and Buddhist epistemology. J. Indian Philos. 22, 81–91.
Sheinberg, D. L., and Logothetis, N. K. (1997). The role of temporal cortical areas in perceptual organization. Proc. Natl. Acad. Sci. U.S.A. 94, 3408–3413.
Simpson, W. A., Shahani, U., and Manahilov, V. (2005). Illusory percepts of moving patterns due to discrete temporal sampling. Neurosci. Lett. 375, 23–27.
Stroud, J. M. (1955). “The fine structure of psychological time,” in Information Theory in Psychology: Problems and Methods, ed. H. Quastler (Glencoe, IL: Free Press), 174–207.
Summerfield, C., Jack, A. I., and Burgess, A. P. (2002). Induced gamma activity is associated with conscious awareness of pattern masked nouns. Int. J. Psychophysiol. 44, 93–100.
Tallon-Baudry, C. (2009). The roles of gamma-band oscillatory synchrony in human visual cognition. Front. Biosci. 14, 321–332.
Tallon-Baudry, C., and Bertrand, O. (1999). Oscillatory gamma activity in humans and its role in object representation. Trends Cogn. Sci. 3, 151–162.
Tononi, G., Srinivasan, R., Russell, D. P., and Edelman, G. M. (1998). Investigating neural correlates of conscious perception by frequency-tagged neuromagnetic responses. Proc. Natl. Acad. Sci. U.S.A. 95, 3198–3203.
VanRullen, R., and Koch, C. (2003). Is perception discrete or continuous? Trends Cogn. Sci. 7, 207–213.
VanRullen, R., Reddy, L., and Koch, C. (2005). Attention-driven discrete sampling of motion perception. Proc. Natl. Acad. Sci. U.S.A. 102, 5291–5296.
Varela, F. J., Toro, A., John, E. R., and Schwartz, E. L. (1981). Perceptual framing and cortical alpha rhythm. Neuropsychologia 19, 675–686.
Keywords: ECoG, intracranial EEG, analytic power, discontinuous consciousness, cinematographic consciousness, 1/f noise
Citation: Pockett S, Brennan BJ, Bold GEJ and Holmes MD (2011) A possible physiological basis for the discontinuity of consciousness. Front. Psychology 2:377. doi: 10.3389/fpsyg.2011.00377
Received: 17 October 2011; Accepted: 29 November 2011;
Published online: 16 December 2011.
Edited by:
Olivia Carter, University of Melbourne, AustraliaCopyright: © 2011 Pockett, Brennan, Bold and Holmes. This is an open-access article distributed under the terms of the Creative Commons Attribution Non Commercial License, which permits non-commercial use, distribution, and reproduction in other forums, provided the original authors and source are credited.
*Correspondence: Susan Pockett, Department of Psychology, University of Auckland, Private Bag 92019, Auckland, New Zealand. e-mail:cy5wb2NrZXR0QGdtYWlsLmNvbQ==