 Arjen Alink1,2,3*
 Felix Euler1,2
 Elena Galeano1
 Alexandra Krugliak3,4
 Wolf Singer1,2,5,6
 Axel Kohler1,2,7
- 1 Department of Neurophysiology, Max Planck Institute for Brain Research, Frankfurt am Main, Germany
- 2 Brain Imaging Center, Goethe University, Frankfurt am Main, Germany
- 3 Cognition and Brain Sciences Unit, Medical Research Council, Cambridge, UK
- 4 Department of Cognitive Neuroscience, Faculty of Psychology and Neuroscience, Maastricht University, Maastricht, Netherlands
- 5 Frankfurt Institute for Advanced Studies, Goethe University, Frankfurt am Main, Germany
- 6 Ernst Strüngmann Institute in Cooperation with Max Planck Society, Frankfurt am Main, Germany
- 7 Department of Psychiatric Neurophysiology, University of Bern, Bern, Switzerland
In this study, it is demonstrated that moving sounds have an effect on the direction in which one sees visual stimuli move. During the main experiment sounds were presented consecutively at four speaker locations inducing left or rightward auditory apparent motion. On the path of auditory apparent motion, visual apparent motion stimuli were presented with a high degree of directional ambiguity. The main outcome of this experiment is that our participants perceived visual apparent motion stimuli that were ambiguous (equally likely to be perceived as moving left or rightward) more often as moving in the same direction than in the opposite direction of auditory apparent motion. During the control experiment we replicated this finding and found no effect of sound motion direction on eye movements. This indicates that auditory motion can capture our visual motion percept when visual motion direction is insufficiently determinate without affecting eye movements.
Introduction
Each of our senses provides us with qualitatively different impressions about the objects and events that surround us. Frequently, events elicit impressions in more than one sensory modality. For example, the event of someone walking toward you can be perceived by seeing the person moving toward you as well by hearing the sound of footsteps getting louder. An interesting question that arises here is how an observer combines visual and auditory signals into a unified multisensory percept. In the current study, we attempted to address this question for the integration of auditory and visual motion signals.
Psychophysical studies have shown that moving visual stimuli can substantially alter the way in which we perceive auditory motion. For example, it has been demonstrated that visual motion can induce an auditory motion after-effect (Kitagawa and Ichihara, 2002) and that visual motion can capture the perceived direction of moving sounds (Soto-Faraco et al., 2002, 2003, 2004, 2005; Sanabria et al., 2007). The findings of studies investigating effects of moving sounds on perceived visual motion have been somewhat inconsistent. Several studies showed little to no effect of sound motion on perceived visual motion (Soto-Faraco et al., 2003; Alais and Burr, 2004), while Meyer and Wuerger (2001) did observe a bias in visual motion perception toward the direction of sound motion when visual motion direction was ambiguous. In addition, auditory motion has been shown to enhance the sensitivity to visual motion when auditory and visual signals share the same direction and location (Wuerger et al., 2003; Meyer et al., 2005) or when visual motion has biological properties (Brooks et al., 2007; Arrighi et al., 2009). Moreover, it has been demonstrated that moving sounds can cause one to perceive a static visual stimulus as moving (Hidaka et al., 2009, 2011; Teramoto et al., 2010) and prolong binocular-dominance periods for moving visual stimuli with a congruent motion direction (Conrad et al., 2010). None of these studies, however, has measured eye movements. Eye movements have been shown to influence how ambiguous visual and tactile motion is perceived (Laubrock et al., 2005; Carter et al., 2008). Therefore, it is possible that previously shown effects of sound motion on visual motion perception are mediated by direction specific effects of sound motion on eye movements.
The main finding of this study is that ambiguous visual apparent motion stimuli are perceived more often as moving in the same than the opposite direction as simultaneously presented auditory motion. Alike Meyer and Wuerger (2001), we observed a maximal effect of sound motion direction on visual motion perception when visual motion direction was maximally ambiguous. The findings of the main experiment were replicated by the control experiment during which we also measured eye movements of our participants. We did not observe an effect of sound motion direction on eye movements, providing first direct evidence that capture of visual motion by auditory motion cannot be explained by concomitant eye movements.
Materials and Methods
Participants
Nineteen healthy volunteers participated in the main experiment (age range, 20–31 years; 11 females) and 10 participants took part in the control experiment (20–47 years, 8 females). All participants had normal hearing and normal or corrected-to-normal vision and gave their informed consent after being introduced to the experimental procedure in accordance with the Declaration of Helsinki.
Stimuli and Procedure
Main experiment
Participants were seated in a darkened room 2.2 m away from a white wall on which a beamer (Acer, PD322, 60 Hz) projected the visual stimulus with a width of 44.5° and a height of 33.4°. The background color of the stimulus was gray (luminance = 6.2 cd/m2) and the stimulus contained a black aperture (luminance = 0.8 cd/m2) in its center, which had a radius of 5.6°. On the horizontal midline of the stimulus, four black speakers (Trust 5.1 Surround Speaker Set SP-6210) were attached to the wall. The far-left speaker was located 20.7° left from the image center and the mid-left speaker 6.9° left from the image center. The far-right speaker was located 20.7° right from the image center and the mid-right speaker 6.9° right from the image center. The inter-speaker distances were 13.8° between all adjacent speakers. All images and sounds were generated using Presentation software (version 12.2, Neurobehavioral Systems, Inc.).
During each trial we presented visual apparent motion stimuli in the aperture that were similar to those employed by Williams et al. (2003). Hence, in the aperture we presented visual stimuli consisting of columns of gray disks (radius = 0.3°, luminance = 6.2 cd/m2) with a fixed inter-column distance of 1.8° and a fixed inter-row distance of 2.1°. A visual apparent motion stimulus consisted of two images. The first image was presented for 200 ms with a randomized horizontal position of the disk columns and was followed by a second image that had the disk columns shifted to the right. The degree of the rightward shift varied from 8/30 of the inter-column distance to 22/30 of the inter-column distance in steps of 1/30. This resulted in 15 types of visual apparent motion. Based on the nearest-neighbor principle for the binding occurring during visual apparent motion (Shechter et al., 1988; Dawson, 1991), we expected participants to consistently perceive rightward visual apparent motion for an 8/30 shift while consistently perceiving leftward visual apparent motion for a 22/30 shift. A 15/30 shift was expected to equally often induce a left and rightward visual apparent motion percept (see Figure 1).
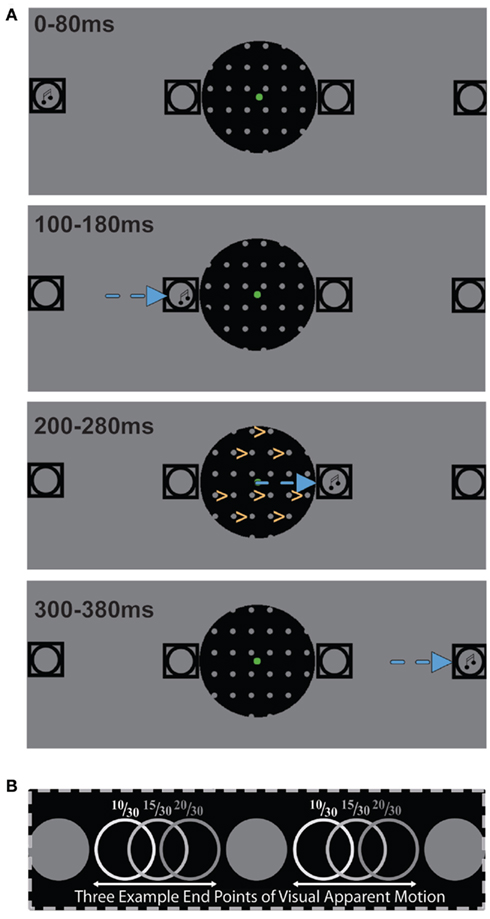
Figure 1. (A) A schematic depiction of the stimuli employed in this study illustrating a rightward auditory motion trial during which the participant perceived rightward visual apparent motion. Squares depict the four speaker locations and the musical note symbols represent the location at which a sound is being presented. The direction of auditory apparent motion is depicted by the blue arrows and the direction of visual apparent motion by yellow arrows. (B) An illustration of three possible endpoints of visual apparent motion whose position is expressed as the distance from the nearest left starting point divided by the inter-column distance. The 10/30 endpoints most likely induce rightward visual apparent motion and the 20/30 endpoints most likely induce leftward visual apparent motion while the 15/30 endpoints are as likely to induce left as rightward visual apparent motion.
Trials contained one visual apparent motion stimulus. At the end of each trial, participants indicated in a two-alternative forced-choice regime which visual motion direction they had seen by pressing the left and right mouse button when they perceived left and rightward visual motion, respectively. Responses were made using a conventional PC mouse. During the response period, the gray disks disappeared and the next trial would start 500 ms after a response was made. Participants were instructed to fixate the green disk that persisted throughout the entire session at the center of the image (radius = 0.4°, luminance = 11.3 cd/m2).
Visual apparent motion was presented in three different auditory conditions. During the no-sound condition, visual apparent motion was presented without auditory stimulation. During the left and rightward auditory motion conditions, visual apparent motion was presented in conjunction with auditory apparent motion stimuli. Leftward auditory motion trials contained white-noise bursts (82–85 dB) which were presented for 80 ms with an inter-stimulus interval of 20 ms at the far-right, mid-right, mid-left, and far-left speaker consecutively and vice versa for rightward auditory motion trials. Critically, the third sound was presented simultaneously with the onset of the second visual apparent motion component, which leads to an overlap of perceived visual and auditory motion in space and time.
In total, each participant was presented 10 times with each of the 15 visual apparent motion stimuli for each trial type in each of two sessions (900 trials in total). The order of trials was fully randomized. On average each session took around 15 min and participants were allowed to take a short break in between the two sessions. Participants were told before the experiment that sounds would be presented during the experiment but that they were irrelevant for the visual motion task.
Control experiment
Participants were seated in a dimly lighted room 55.5 cm away from a 19″ Samsung LCD monitor (width: 37.3°, height of 30.2°) that was part of an SMI Remote eye-tracking Device (RED 4.2-911-138). During the experiment they rested their heads on a chin and forehead rest to ensure a constant eye-to-screen distance. The eye tracker measured the location and radius of the left and right pupil at 50 Hz using two infrared light sources and an infrared camera. The horizontal and vertical gaze position was calculated based on the average left and right pupil position. We used SMI’s eye tracker software iView X (v2.8) and calibrated the eye tracker using the standard RED nine-point calibration procedure.
The same type of visual stimulus was presented on this screen as during the main experiment. The size of the stimuli, however, differed. The radius of the aperture was 9.3°, the gray disks had a radius of 0.5°, the inter-column distance of the disk array was 3.0°, the inter-row distance of the disks was 3.5°, and the green fixation disk had a radius of 0.6°. During this experiment we used a 5.1 speaker set (Creative Inspire 16160); we placed four satellite speakers on a line 5 cm in front of the LCD monitor that ran parallel to the monitor. The speakers were set up at a height that put them on the same level as the horizontal midline of the LCD monitor. The far-left speaker was located 49.2° left from the center of the monitor and the mid-left speaker 16.4° left from the center of the monitor. The far-right speaker was located 49.2° right from the center of the monitor and the mid-right speaker 16.4° right from the center of the monitor. The inter-speaker distance was 32.8° between all adjacent speakers. We used the same noise bursts as during the main experiment (82–85 dB) and the timing of the sounds and visual stimuli was the same as for the main experiment. All visual stimuli and sounds were generated using Presentation software (version 14.1, Neurobehavioral Systems, Inc.).
Participants received the same task instructions as for the main experiment. We increased the number of stimuli per trial type to 30 (1350 trials in total). Subjects completed all trials during one session that took about 1 h.
Behavioral Analysis
Behavioral data from the main and the control experiment was analyzed in the same way. For each participant, we calculated the percentage of rightward visual apparent motion reports for each of the rightward shifts separately for the three main conditions. We fitted a logistic psychometric function to this data for each participant and condition separately (Draper and Smith, 1981). The tails of each logistic function were fixed to 0 and 100%, respectively. An exemplary participant’s data and its fitted curves are shown in Figure 2. The fitted logistic function for the no-sound condition was used to estimate the shift that induced left and rightward visual apparent motion with an equal probability without auditory influences. This was realized by determining the shift at which the no-sound curve intersected with a 50% level of rightward visual apparent motion perception (V50 of the logistic function). This shift we refer to as the bistability shift and we determined this shift for each participant separately.
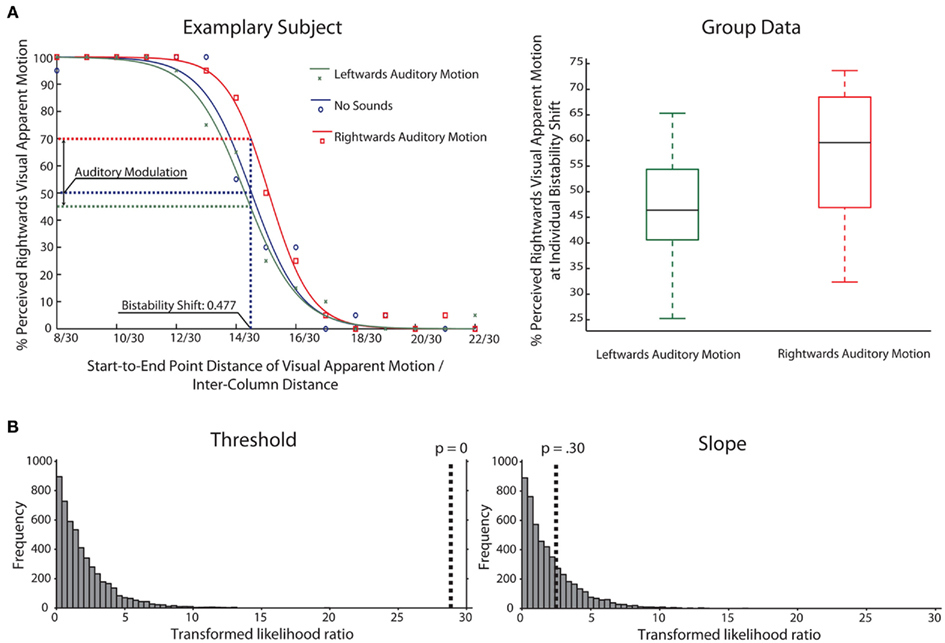
Figure 2. (A) Left: This figure contains the plotted data for an exemplary participant (main experiment) and the fitted logistic functions for all three conditions. The visual apparent motion percept of this participant was estimated to be bistable for a shift of 0.477 of the inter-column distance. For this bistability shift the participant was estimated to perceive the visual apparent motion stimulus as moving rightward in 70% of the rightward auditory motion trials and in 46% of the leftward auditory motion trials. Right: Box-and-whisker diagrams depicting the group data for the main experiment for the percent perceived rightward visual apparent motion at the bistability shift which was estimated on an individual level. (B) Results of bootstrapping analysis (N = 5000) for group data comparing different models for thresholds and slopes in the three conditions (Leftward, No-Sound, Rightward). The histogram shows the distribution of likelihood ratios for the simulated data (see Materials and Methods for details). The dotted line indicates the likelihood ratio for the actual data. The results indicate that assuming varying thresholds for the three conditions is a more adequate model than a fixed threshold for all three conditions (left panel), whereas this is not the case for slope (right panel).
The main aim of this study was to test whether the direction of auditory motion affects the ratio of perceived left and rightward visual apparent motion when visual apparent motion is bistable. To this end, we estimated the proportion at which participants perceived rightward visual motion for the two main auditory conditions when a visual stimulus is presented using the individually defined bistability shift. This was realized by fitting two logistic functions to the data from left and rightward auditory motion trials for each participant separately and comparing the amplitude of these curves for the bistability shift (see Figure 2). If our hypothesis is correct, then these values should be higher than 50% for the rightward auditory motion condition and lower than 50% for the leftward auditory motion condition. We assessed the effect of auditory motion direction on the percentage reported rightward visual apparent motion during bistable visual stimulation in a repeated-measures analysis of variance (ANOVA) and subsequent paired t-tests. We furthermore assessed in another ANOVA the effect of auditory motion direction on the threshold and slope of the fitted logistic functions.
As an alternative analysis approach on the group level, we used a bootstrap technique implemented in the “Palamedes” toolbox for Matlab (Prins and Kingdom, 2009). Data of participants were combined for estimates of the psychometric functions for the three conditions leftward, no-sound, and rightward resulting in 380 trials (19 participants times 20 trials) per aspect-ratio value for the main experiment and 300 (10 participants times 30 trials) for the control experiment. The toolbox contains a function “PAL_PFLR_ModelComparison” that allows for comparisons between models with varying constraints on the model parameters for the different conditions. In our case, we wanted to know whether a model with differing thresholds or slopes would demonstrate a more adequate fit to the data than a model with fixed parameters across conditions. As in the other analyses, the logistic function was used as model function. We used the “Palamedes” toolbox to obtain maximum-likelihood estimates in order to identify the best-fitting parameters. Guess and lapse rates were fixed at 0 for the fitting procedures. For model comparison with the “PAL_PFLR_ModelComparison” function, likelihood ratios between the unconstrained and constrained model for the observed data are compared to a distribution of likelihood ratios obtained via Monte-Carlo simulations from the constrained model. We used 5000 simulations for our calculations and performed model comparisons for threshold and slope using all three conditions as well as pair-wise comparisons between conditions for the threshold parameter.
Results
Behavioral Results
Main experiment
The average rightward shift at which the visual apparent motion stimulus was estimated to be bistable was 0.495 (SD = 0.0126) of the inter-column distance. An ANOVA showed that the direction of auditory motion significantly affected the percentage of trials in which a bistable visual stimulus was seen as moving rightward (F = 7.8, p < 0.003 Greenhouse–Geisser). The bistable visual stimulus was estimated to be perceived as moving rightward in 57.2% (SD = 13.0%) of the rightward auditory motion trials while being perceived as moving rightward only in 47.0% (SD = 11.2%) of the leftward auditory motion trials. Paired t-tests showed that bistable visual apparent motion induced a rightward visual motion percept more often during rightward auditory motion trials as compared to leftward auditory motion trials (t = 4.3, p < 0.001 two-sided) and no-sound trials (t = 2.4, p < 0.03 two-sided). The difference between the leftward auditory motion condition and the no-sound condition, however, did not reach significance (t = 1.2, p = 0.26).
Auditory stimulation was found to have an effect on the threshold of the fitted logistic function (F = 7.6, p < 0.004 Greenhouse–Geisser) but not on the logistic function’s slope (F = 0.431, p = 0.65 Greenhouse–Geisser). The V50 of the logistic function was 0.492 (SD = 0.0155), 0.495 (SD = 0.0126), and 0.505 (SD = 0.0146) of the inter-column distance for the leftward auditory motion condition, the no-sound condition, and the rightward auditory motion condition, respectively. The differences in threshold between the left and rightward auditory motion condition and between the rightward auditory motion condition and the no-sound condition reached significance (respectively: t = 3.5, p < 0.004 two-sided; t = 2.5, p < 0.03 two-sided) while the difference between the leftward auditory motion condition and the no-sound condition was not significant (t = 1.2, p = 0.24 two-sided). These findings indicate that the effects of auditory motion found in our main analysis are due to a shift of the sigmoidal psychometric function without a change of slope.
To confirm our results with an alternative analysis approach, we used a bootstrap technique implemented in the “Palamedes” toolbox (Prins and Kingdom, 2009). In short, the toolbox compares different models fitted to the psychophysical data and obtains significance values through Monte-Carlo simulations (see Materials and Methods for details and Kingdom and Prins, 2010). In our case, we compared models where either threshold or slope values were fixed across conditions (corresponding to the Null Hypothesis that all thresholds/slopes are equal across conditions) to models where parameters could vary freely between conditions. The models were compared on the group level, combining all participants’ data for a pooled estimate.
There was a highly significant effect for the threshold parameter (p < 0.001; in fact, none of the simulated values was larger than the observed value, making p effectively 0, see Figure 2), meaning that assuming the same threshold for the different conditions was an inadequate model of the observed data. Performing the model comparison for pairs of conditions, simulations showed that the threshold for the rightward condition was different from both the leftward and no-sound condition (p < 0.001). But no difference between leftward and no-sound conditions was found (p = 0.30) confirming the above mentioned analyses. In contrast, for the slope parameter, assuming the same slope values across conditions was an adequate model of the observed data (p = 0.30).
Control experiment
The average rightward shift at which the visual apparent motion stimulus was estimated to be bistable was 0.497 (SD = 0.0105) of the inter-column distance. An ANOVA showed that the direction of auditory motion significantly affected the percentage of trials in which a bistable visual stimulus was seen as moving rightward (F = 34.6 p < 0.001 Greenhouse–Geisser). The bistable visual stimulus was estimated to be perceived as moving rightward in 68.5% (SD = 15.0%) of the rightward auditory motion trials while being perceived as moving rightward only in 42.8% (SD = 11.7%) of the leftward auditory motion trials. Paired t-tests showed that bistable visual apparent motion induces a rightward visual motion percept more often during rightward auditory motion trials as compared to leftward auditory motion trials (t = 5.9, p < 0.001 two-sided) and no-sound trials (t = 3.9, p < 0.005 two-sided). The difference between the leftward auditory motion condition and the no-sound condition, however, did not reach significance (t = 1.9, p = 0.09).
Auditory stimulation was found to have an effect on the threshold of the fitted logistic function (F = 12.3, p < 0.002 Greenhouse–Geisser) but not on the logistic function’s slope (F = 1.4, p = 0.27 Greenhouse–Geisser). The V50 of the logistic function was 0.493 (SD = 0.0134), 0.497 (SD = 0.0105), and 0.510 (SD = 0.009) of the inter-column distance for the leftward auditory motion condition, the no-sound condition, and the rightward auditory motion condition, respectively. The differences in threshold between the left and rightward auditory motion condition and between the rightward auditory motion condition and the no-sound condition reached significance (respectively: t = 4.1, p < 0.004 two-sided; t = 3.3, p < 0.02 two-sided) while the difference between the leftward auditory motion condition and the no-sound condition was not significant (t = 1.7, p = 0.13 two-sided).
As for the main experiment, we also applied the bootstrapping approach to the data of the control experiment. In the model comparison, there was a highly significant effect of the threshold parameter (p < 0.001; again, none of the simulated values was larger than the observed value, making p effectively 0, see Figure 3), meaning that assuming the same threshold for the different conditions was an inadequate model of the observed data. Performing the model comparison for pairs of conditions, simulations showed that the threshold for the rightward condition was different from both the leftward and no-sound condition (p < 0.001). The difference between leftward and no-sound conditions was marginally significant (p = 0.05). In the control experiment, there was also a significant effect of the slope parameter (p = 0.003). The slope was steeper for the rightward condition than the leftward (p = 0.001) or no-sound condition (p = 0.007); there was no slope difference between the leftward and no-sound condition (p = 0.53).
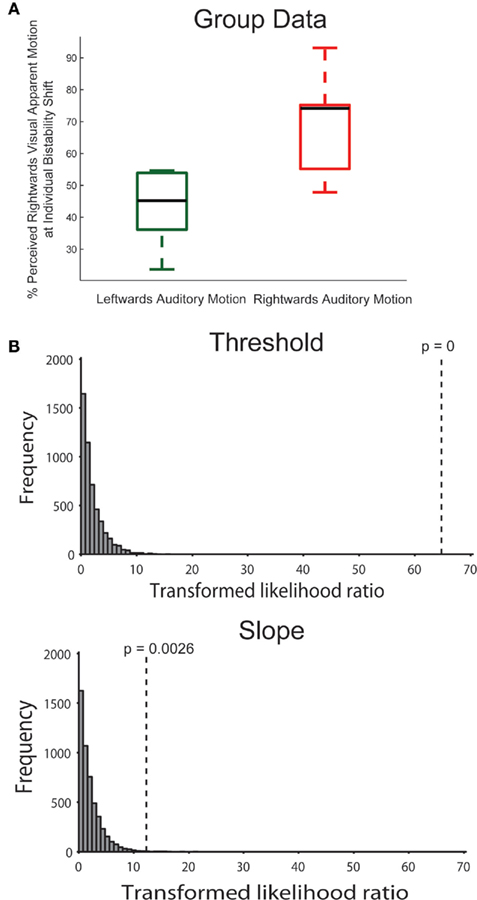
Figure 3. (A) Same as Figure 2A right but showing the results for the control experiment. (B) In the control experiment, the bootstrapping analysis (see Figure 2B) confirmed the threshold effect. Additionally, this analysis identified a difference in the slope parameter of the psychometric function.
Eye-Tracking Analysis and Results
We analyzed horizontal and vertical gaze angle for epochs from 400 ms before trial onset until 1300 ms after trial onset using custom-made Matlab code. Time points were labeled as blinks if the pupil diameter was smaller than one fourth of the median pupil diameter or when the vertical gaze position deviated more than six visual degrees from the fixation dot. These time points and the time within 60 ms from these time points were treated as missing values and excluded from subsequent analyses. To correct for imperfections of the calibration we redefined the horizontal and vertical gaze angle for the fixation dot for each participant as the mean of all of the participant’s valid horizontal and vertical gaze angles.
For each participant and condition we calculated fixation performance by determining the percentage of time that his or her gaze angle deviated less than 1° visual angle from the fixation dot position. On average fixation performance was 71.0, 70.4, and 71.3% for the no-sound, leftward, and rightward auditory motion conditions respectively. Two-sided paired sample t-tests indicated that there was no significant effect of condition on fixation performance (p > 0.05 for all comparisons). We also created density plots for each condition after combining the data across all 10 participants (Figure 4A). These density plots also did not show any effect of condition on the distribution of gaze angle.
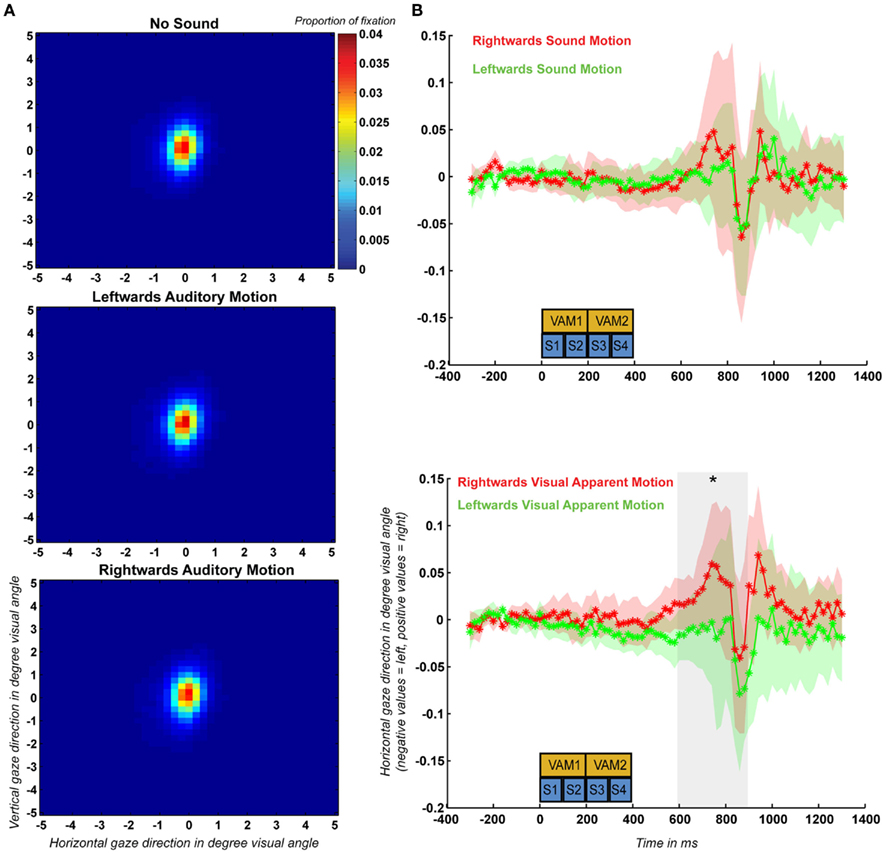
Figure 4. (A) Spatial distribution of fixation recorded during the control experiment based on the eye-tracking data of all 10 participants plotted separately for the no-sound, leftward auditory motion, and rightward auditory motion conditions. (B) Mean and SEM (across participants) of the event-related horizontal eye movements (ERHEMs) computed for trials during which participants were presented with left and rightward auditory motion stimuli (upper graph) and mean and SEM of the ERHEMs computed for trials during which participants perceived left and rightward visual apparent motion (lower graph). The blue boxes (S1–S4) indicate the time at which the four sounds were presented during a trial and the yellow boxes (VAM1–VAM2) indicate the timing of the first and second visual apparent motion stimuli. The gray transparent box in the upper part indicates the time period (600–900 ms) during which there was a significant effect of visual apparent motion percept.
Additionally, we computed average event-related horizontal eye movements (ERHEMs) for each subject, sound condition, and visual apparent motion percept. First, we determined whether ERHEMs differ between trials during which participants were presented with left and rightward moving sounds. To determine this independently from the effect of visual apparent motion percept we averaged the ERHEMs for left and rightward visual apparent motion percept trials separately for the ERHEMs based on left and rightward moving sound trials. This resulted in an ERHEM for left and rightward sound motion for each subject (see Figure 4B for the grand mean and SEM). We tested for each 100 ms time bin after trial onset if there was a significant difference between the ERHEMs using a two-sided paired sample t-test (p < 0.05) across participants. We did not observe a significant difference between these two ERHEMs for any of the 100-ms time bins which suggests that sound motion direction had no effect on horizontal gaze angle.
Second, we assessed if ERHEMs differed between trials during which subjects perceived right and leftward visual apparent motion. To determine this independently from effects of sound condition we averaged the ERHEMs for the left and rightward sound conditions separately for the ERHEMs based on left and rightward visual apparent motion trials. This resulted in an ERHEM for left and rightward visual apparent motion percept for each subject (see Figure 4B for the grand mean and SEM). We observed a significant effect of visual apparent motion percept for the three time bins between 600 and 900 ms after trial onset. During this period, participant’s gaze was on average shifted more to the right when participants perceived rightward visual apparent motion as compared to when they perceived leftward visual apparent motion. Note that this effect occurs 200 ms after all sounds and visual apparent motion stimuli were presented.
Discussion
The results of the main experiment show that the presence of rightward auditory motion causes visual stimuli to be perceived more often as moving rightward when the visual stimulus direction is ambiguous. Furthermore, we observed an increased likelihood of perceiving leftward visual motion when comparing trials containing leftward and rightward auditory motion. However, the ratio of left and rightward visual apparent motion perception was not found to differ between trials during which leftward auditory motion was presented and trials without auditory stimulation.
The findings of the main experiment were replicated by the control experiment during which we also measured eye movements. Again, visual motion perception was influenced in the direction of auditory motion. In addition to a threshold shift, there was also a hint toward a steeper slope of the psychometric function in the rightward condition. Concerning eye movements, we observed a shift in average horizontal gaze direction in the direction of the perceived visual apparent motion. This effect occurred only after all visual stimuli and sounds had been presented. After factoring out the effect of visual apparent motion percept, sound direction on its own was not found to have an effect on horizontal gaze direction. Therefore, it appears unlikely that the effect of sound motion on visual apparent motion perception observed in this study is mediated by sound-evoked eye movements.
Our findings are in contrast to claims made by previous studies that visual motion can capture auditory motion but not the other way around (Soto-Faraco et al., 2002, 2003, 2004, 2005; Sanabria et al., 2007). The lack of evidence in these studies for an effect of auditory motion on visual motion perception is most likely due to the fact that those studies employed visual stimuli that more reliably conveyed information about the direction of motion than the auditory stimuli. If audiovisual integration is based on Bayesian inference (Battaglia et al., 2003; Deneve and Pouget, 2004; Knill and Pouget, 2004), then bistable visual motion stimuli can be expected to be more susceptible to auditory influences than visual stimuli with unequivocal motion direction.
Our findings further support the emerging view that auditory motion stimuli can affect visual motion perception (Meyer and Wuerger, 2001; Meyer et al., 2005; Brooks et al., 2007; Freeman and Driver, 2008; Hidaka et al., 2009, 2011; Conrad et al., 2010; Teramoto et al., 2010). We propose that such an effect of moving sounds on visual motion perception results from sounds affecting neural activity in the visual cortex. This would be in line with the finding that auditory motion enhances visual responses in the visual motion complex hMT/V5+ when its direction is congruent with that of visual motion stimuli (Alink et al., 2008). Moreover, this result is supported by more recent studies showing that the direction of moving sounds can be decoded from activation patterns in the visual cortex of sighted (Alink et al., in press) and blind subjects (Wolbers et al., 2010) and that hMT/V5+ of congenitally blind subjects responds selectively to sound motion (Saenz et al., 2008; Bedny et al., 2010). Whether such effects of sound motion on the visual cortex actually contribute to the quality of auditory motion perception remains to be shown. One way of addressing this question would be assessing the effect of disruptive transcranial magnetic stimulation over hMT/V5+ on auditory motion perception.
To summarize, the current study shows that the direction of auditory motion can bias the direction of our visual motion percept when visual motion direction is ambiguous. We did not observe an effect of sound motion direction on eye movements. Therefore, it appears that the effect of sound motion on visual motion perception takes place at a perceptual level rather than being induced by changes in eye position. Such a perceptual interaction is in line with several neurophysiological findings indicating that sound motion affects activation in the visual cortex.
Conflict of Interest Statement
The authors declare that the research was conducted in the absence of any commercial or financial relationships that could be construed as a potential conflict of interest.
Acknowledgments
Research funded by Netherlands Organisation for Scientific Research (NWO), Grant number: 825.10.023.
References
Alais, D., and Burr, D. (2004). No direction-specific bimodal facilitation for audiovisual motion detection. Brain Res. Cogn. Brain Res. 19, 185–194.
Alink, A., Euler, F., Kriegeskorte, N., Singer, W., and Kohler, A. (in press). Auditory motion direction encoding in auditory cortex and high-level visual cortex. Hum. Brain Mapp. doi: 10.1002/hbm.21263
Alink, A., Singer, W., and Muckli, L. (2008). Capture of auditory motion by vision is represented by an activation shift from auditory to visual motion cortex. J. Neurosci. 28, 2690.
Arrighi, R., Marini, F., and Burr, D. (2009). Meaningful auditory information enhances perception of visual biological motion. J. Vis. 9, 1–7.
Battaglia, P. W., Jacobs, R. A., and Aslin, R. N. (2003). Bayesian integration of visual and auditory signals for spatial localization. J. Opt. Soc. Am. A 20, 1391–1397.
Bedny, M., Konkle, T., Pelphrey, K., Saxe, R., and Pascual-Leone, A. (2010). Sensitive period for a multimodal response in human visual motion area MT/MST. Curr. Biol. 20, 1900–1906.
Brooks, A., Van Der Zwan, R., Billard, A., Petreska, B., Clarke, S., and Blanke, O. (2007). Auditory motion affects visual biological motion processing. Neuropsychologia 45, 523–530.
Carter, O., Konkle, T., Wang, Q., Hayward, V., and Moore, C. (2008). Tactile rivalry demonstrated with an ambiguous apparent-motion quartet. Curr. Biol. 18, 1050–1054.
Conrad, V., Bartels, A., Kleiner, M., and Noppeney, U. (2010). Audiovisual interactions in binocular rivalry. J. Vis. 10, 1–15.
Dawson, M. R. W. (1991). The how and why of what went where in apparent motion: modeling solutions to the motion correspondence problem. Psychol. Rev. 98, 569–603.
Deneve, S., and Pouget, A. (2004). Bayesian multisensory integration and cross-modal spatial links. J. Physiol. Paris 98, 249–258.
Freeman, E., and Driver, J. (2008). Direction of visual apparent motion driven solely by timing of a static sound. Curr. Biol. 18, 1262–1266.
Hidaka, S., Manaka, Y., Teramoto, W., Sugita, Y., Miyauchi, R., Gyoba, J., Suzuki, Y., and Iwaya, Y. (2009). Alternation of sound location induces visual motion perception of a static object. PLoS ONE 4, e8188. doi: 10.1371/journal.pone.0008188
Hidaka, S., Teramoto, W., Sugita, Y., Manaka, Y., Sakamoto, S., Suzuki, Y., and Coleman, M. (2011). Auditory motion information drives visual motion perception. PLoS ONE 6, e17499. doi: 10.1371/journal.pone.0017499
Kingdom, F. A. A., and Prins, N. (2010). Psychophysics: A Practical Introduction. London: Academic Press.
Knill, D. C., and Pouget, A. (2004). The Bayesian brain: the role of uncertainty in neural coding and computation. Trends Neurosci. 27, 712–719.
Laubrock, J., Engbert, R., and Kliegl, R. (2005). Microsaccade dynamics during covert attention. Vision Res. 45, 721–730.
Meyer, G. F., and Wuerger, S. M. (2001). Cross-modal integration of auditory and visual motion signals. Neuroreport 12, 2557.
Meyer, G. F., Wuerger, S. M., Röhrbein, F., and Zetzsche, C. (2005). Low-level integration of auditory and visual motion signals requires spatial co-localisation. Exp. Brain Res. 166, 538–547.
Prins, N., and Kingdom, F. A. A. (2009). Palamedes: Matlab Routines for Analyzing Psychophysical Data. Available at: http://www.palamedestoolbox.org
Saenz, M., Lewis, L. B., Huth, A. G., Fine, I., and Koch, C. (2008). Visual motion area MT+/V5 responds to auditory motion in human sight-recovery subjects. J. Neurosci. 28, 5141.
Sanabria, D., Spence, C., and Soto-Faraco, S. (2007). Perceptual and decisional contributions to audiovisual interactions in the perception of apparent motion: a signal detection study. Cognition 102, 299–310.
Shechter, S., Hochstein, S., and Hillman, P. (1988). Shape similarity and distance disparity as apparent motion correspondence cues. Vision Res. 28, 1013–1021.
Soto-Faraco, S., Kingstone, A., and Spence, C. (2003). Multisensory contributions to the perception of motion. Neuropsychologia 41, 1847–1862.
Soto-Faraco, S., Lyons, J., Gazzaniga, M., Spence, C., and Kingstone, A. (2002). The ventriloquist in motion: illusory capture of dynamic information across sensory modalities. Brain Res. Cogn. Brain Res. 14, 139–146.
Soto-Faraco, S., Spence, C., and Kingstone, A. (2004). Cross-modal dynamic capture: congruency effects in the perception of motion across sensory modalities. J. Exp. Psychol. Hum. Percept. Perform. 30, 330–345.
Soto-Faraco, S., Spence, C., and Kingstone, A. (2005). Assessing automaticity in the audiovisual integration of motion. Acta Psychol. (Amst.) 118, 71–92.
Teramoto, W., Manaka, Y., Hidaka, S., Sugita, Y., Miyauchi, R., Sakamoto, S., Gyoba, J., Iwaya, Y., and Suzuki, Y. (2010). Visual motion perception induced by sounds in vertical plane. Neurosci. Lett. 479, 221–225.
Williams, Z. M., Elfar, J. C., Eskandar, E. N., Toth, L. J., and Assad, J. A. (2003). Parietal activity and the perceived direction of ambiguous apparent motion. Nat. Neurosci. 6, 616–623.
Wolbers, T., Zahorik, P., and Giudice, N. A. (2010). Decoding the direction of auditory motion in blind humans. Neuroimage 56, 681–687.
Keywords: audiovisual, multisensory integration, motion capture, Bayesian, bistable, eye movement
Citation: Alink A, Euler F, Galeano E, Krugliak A, Singer W and Kohler A (2012) Auditory motion capturing ambiguous visual motion. Front. Psychology 2:391. doi: 10.3389/fpsyg.2011.00391
Received: 14 June 2011; Accepted: 12 December 2011;
Published online: 02 January 2012.
Edited by:
Angelo Maravita, University of Milano Bicocca, ItalyReviewed by:
Olivia Carter, University of Melbourne, AustraliaSophie Wuerger, The University of Liverpool, UK
Copyright: © 2012 Alink, Euler, Galeano, Krugliak, Singer and Kohler. This is an open-access article distributed under the terms of the Creative Commons Attribution Non Commercial License, which permits non-commercial use, distribution, and reproduction in other forums, provided the original authors and source are credited.
*Correspondence: Arjen Alink, Cognition and Brain Sciences Unit, Medical Research Council, 15 Chaucer Road, Cambridge CB2 7EF, UK. e-mail:YXJqZW4uYWxpbmtAbXJjLWNidS5jYW0uYWMudWs=