

- Department of Psychology, Neuroscience and Behaviour, McMaster University, Hamilton, ON, Canada
Cues to pitch include spectral cues that arise from tonotopic organization and temporal cues that arise from firing patterns of auditory neurons. fMRI studies suggest a common pitch center is located just beyond primary auditory cortex along the lateral aspect of Heschl’s gyrus, but little work has examined the stages of processing for the integration of pitch cues. Using electroencephalography, we recorded cortical responses to high-pass filtered iterated rippled noise (IRN) and high-pass filtered complex harmonic stimuli, which differ in temporal and spectral content. The two stimulus types were matched for pitch saliency, and a mismatch negativity (MMN) response was elicited by infrequent pitch changes. The P1 and N1 components of event-related potentials (ERPs) are thought to arise from primary and secondary auditory areas, respectively, and to result from simple feature extraction. MMN is generated in secondary auditory cortex and is thought to act on feature-integrated auditory objects. We found that peak latencies of both P1 and N1 occur later in response to IRN stimuli than to complex harmonic stimuli, but found no latency differences between stimulus types for MMN. The location of each ERP component was estimated based on iterative fitting of regional sources in the auditory cortices. The sources of both the P1 and N1 components elicited by IRN stimuli were located dorsal to those elicited by complex harmonic stimuli, whereas no differences were observed for MMN sources across stimuli. Furthermore, the MMN component was located between the P1 and N1 components, consistent with fMRI studies indicating a common pitch region in lateral Heschl’s gyrus. These results suggest that while the spectral and temporal processing of different pitch-evoking stimuli involves different cortical areas during early processing, by the time the object-related MMN response is formed, these cues have been integrated into a common representation of pitch.
Introduction
Pitch is the perceptual correlate of stimulus frequency, and is important across a number of domains. Pitch can be used to convey prosodic and semantic information in speech (e.g., Frick, 1985; see Moore, 2008 for a review), and is central to music perception. In addition, pitch information provides one of the primary cues for separating overlapping sounds and attributing them to their correct sources in a complex soundscape (Bregman, 1990). Sounds with pitch typically contain energy at a fundamental frequency and at harmonics at integer multiples of the fundamental frequency. Normally, the different frequency components are integrated into a single percept whose pitch corresponds to the fundamental frequency. In fact, even if the energy at the fundamental frequency is not present in the stimulus, the pitch percept corresponding to that frequency remains. This phenomenon is known as the pitch of the missing fundamental, and it emphasizes that pitch extraction is a complex process that depends on spectrotemporal processing of information contained in the sound stimulus. The mechanisms of pitch extraction can be studied using a variety of stimuli that evoke pitch sensations.
At the level of the cochlea, frequency information is represented in two ways. Physical characteristics of the basilar membrane, such as the variation in stiffness along its length, give rise to a place-based representation (Von Bekesy, 1960). Energy at different frequencies causes maximal displacement of the membrane at different locations along its length, generating a tonotopic organization such that high frequencies are represented near the base of the cochlea, while low frequencies are represented more apically. The mechanical energy contained in the sound wave is converted to an electrical signal via the depolarization of inner hair cells such that tonotopic organization is maintained in the auditory nerve, through subcortical nuclei, and into primary auditory cortex (e.g., see Formisano et al., 2003; Humphries et al., 2010 for reviews). The second frequency representation is based on the periodicity of action potentials in auditory nerve fibers. Because inner hair cells depolarize when the basilar membrane is maximally displaced, firing across a population of auditory nerve fibers occurs at time intervals that represent the inverse of the frequency of the acoustic signal (e.g., Delgutte and Cariani, 1992; Cedolin and Delgutte, 2005, 2007).
The neural mechanisms that underlie pitch perception are not yet entirely understood. One class of models is based on place or tonotopic information. For example, Goldstein (1973) described a place-based model in which the harmonic structure of an acoustic stimulus could be matched to a harmonic template to extract pitch. However, such models have at least two inherent limitations. The first is that such a mechanism would require resolution of individual harmonics, but studies have shown that listeners can identify the pitch of complex harmonic stimuli even when the spectral content of those stimuli is confined to the region where harmonics are unresolved (de Boer, 1976). The second limitation of models that rely solely on place cues is that, although the tonotopicity of the basilar membrane may allow for the extraction of place cues at low intensities, these tonotopic maps have been shown to degrade progressively with increasing stimulus intensity beginning at auditory thresholds (Moore, 2003). A second class of models is based on the temporal firing code, suggesting that the tonotopic organization of the auditory system may not be required for pitch extraction. Rather, these theories suggest that pitch extraction depends on a mechanism that takes advantage of the distribution of inter-spike intervals in the auditory nerve to calculate the fundamental frequency of a complex auditory stimulus (e.g., Cariani and Delgutte, 1996). These theories account for the limitations of spectral models, as the temporal code could represent the fundamental frequency of a harmonic complex sound even if only unresolvable harmonics were present in the stimulus, and such models are more robust to changes in sound level. However, purely temporal models of pitch perception cannot explain why the salience of harmonic stimuli containing resolvable harmonics exceeds the salience of stimuli containing exclusively unresolved harmonics (Houstma and Smurzynski, 1990; Shackleton and Carlyon, 1994). Thus, current working models of pitch extraction typically take into account both the cues arising from the tonotopy of the auditory system and the temporal fine structure in the signal, signal envelope cues, or both (e.g., Oxenham et al., 2009; Moore and Gockel, 2011; Santurette and Dau, 2011).
Although a substantial literature has developed examining these models, how and where spectral and temporal frequency information is combined to give rise to the percept of pitch is still largely unknown. Although frequency is analyzed subcortically, pitch does not appear to be represented until at least the level of primary auditory cortex. For example, Gockel et al. (2011) failed to find a representation of pitch in the frequency following response (FFR) elicited from subcortical nuclei. Electrophysiological recordings in animal models (Merzenich and Brugge, 1973; Merzenich et al., 1974) and functional imaging studies in humans (Lauter et al., 1985; Pantev et al., 1988) have shown that primary auditory cortex contains a tonotopic frequency organization, with neurons selectively responsive to high-frequency sounds located medially on the superior temporal plane, and those responsive to low-frequency sounds located more laterally. Using magnetoencephalography (MEG), Pantev et al. (1996) found that neural populations in A1 were responsive to the fundamental frequency of a complex stimulus containing harmonics of that fundamental, but no energy at f0 itself. They concluded that the tonotopic organization of A1 is based on periodicity rather than frequency, suggesting that primary auditory cortex contains the first representation of stimulus pitch. However, it has since been suggested that the response recorded by Pantev et al. (1996) may have been in response to the distortion product commonly found at f0 in missing fundamental stimuli, or to a band of masking noise that was centered at this frequency (Walker et al., 2011). Moreover, electrophysiological recordings in awake macaques have failed to find any individual neurons in A1 that are responsive to the pitch of the missing fundamental (Schwarz and Tomlinson, 1990). Instead, it appears that pitch is first represented beyond primary auditory cortex.
Physiological recordings from a region just beyond primary auditory cortex at the anterolateral low-frequency border of A1 in the marmoset have identified a restricted region of cells responsive to pure tones and complex tones of the same pitch (Bendor and Wang, 2005). The search for an equivalent neural population in human cortex has predominantly employed iterated rippled noise (IRN), a class of stimuli created by delaying a copy of a noise waveform and adding it back to the original noise. When this process is repeated a number of times, the resultant stimulus exhibits temporal regularity at the period of the delay, which is heard as a pitch equal to the inverse of that delay (e.g., a delay of 5 ms results in a perceived pitch of 200 Hz; Patterson et al., 1996). IRN stimuli can be high-pass filtered to remove all of the energy in the region of the resolvable harmonics, leaving a high-frequency spectrum that resembles white noise, although with an increasing number of iterations it will contain some unresolved spectral information. These filtered IRN stimuli still elicit a pitch percept, suggesting that the introduction of temporal regularity by the iterated delay-and-add process provides cues to pitch that are predominantly represented by a temporal code. Thus, IRN stimuli primarily engage the temporal pitch mechanism, and provide a useful comparison for stimuli with more salient spectral cues such as pure tones or complex harmonic sounds.
Collectively, PET and fMRI studies using IRN stimuli to investigate pitch processing in humans have suggested that the pitch center is located along the lateral aspect of Heschl’s gyrus (Griffiths et al., 1998; Patterson et al., 2002; Hall et al., 2005). However, it has been rightly suggested that in order for a single area of cortex to be considered a true pitch center, it must respond to all pitch-evoking stimuli. Using a wider variety of stimulus types, Hall and Plack (2009) found that although Heschl’s gyrus was indeed responsive to IRN stimuli, responses from this region to other pitch-evoking stimuli were largely variable both between conditions and between listeners. They found that the most overlap in regions of activation across different types of pitch-evoking stimuli was not located along Heschl’s gyrus, but rather along the planum temporale (PT). This led to the suggestion that lateral Heschl’s gyrus is selectively responsive to the physical characteristics of IRN rather than the pitch percept it creates, and that the PT is the most likely candidate for a common pitch center. However, recent studies have implicated lateral Heschl’s gyrus in response to a variety of pitch-evoking stimuli, including tones in noise, Huggins pitch, and binaural band-pitch stimuli (Puschmann et al., 2010), harmonic complexes (Penagos et al., 2004), and click trains (Gutschalk et al., 2004). Thus, the question of where a common pitch-processing center might exist remains an issue of much debate.
Studies aiming to examine a common pitch representation in human auditory cortex have overwhelmingly relied on the high spatial resolution of functional imaging techniques like fMRI (Patterson et al., 2002; Penagos et al., 2004; Hyde et al., 2008; Hall and Plack, 2009; Puschmann et al., 2010; Barker et al., 2011a). These methods are well-suited to localizing neural populations generating specific responses, but they are unable to reveal detail with respect to the temporal sequence of events involved in the processing of pitch-evoking stimuli. One might expect that early processing of spectral and temporal cues is accomplished in separate areas, but that an integrated pitch percept is later generated in a common area. The finer temporal resolution of electroencephalography (EEG) is better suited to address this question, as the relative timing of components from event-related potentials (ERPs) can help index stages of processing.
Acoustic stimuli evoke a characteristic sequence of ERPs including long-latency, cortically generated components such as the P1 and N1. The P1 response is observed as a frontally positive-going deflection with a peak occurring roughly 50 ms after the onset of the acoustic stimulus. The generators of this component are thought to reside in primary auditory cortex, located predominantly in intermediate sections of Heschl’s gyrus (Godey et al., 2001; Yvert et al., 2005). Conversely, the N1 component is seen as a frontally negative-going deflection peaking roughly 100 ms after stimulus onset, and is thought to have multiple generators in secondary auditory areas including lateral Heschl’s gyrus and PT (Godey et al., 2001; Yvert et al., 2005). In addition to these potentials, there are also components that arise from violations of expectations for sound features, such as the mismatch negativity (MMN). The MMN is elicited in response to an infrequent deviant auditory stimulus occurring within a sequence of repeating standard stimuli, such as when a stimulus with one pitch is repeated from trial to trial, but is occasionally replaced by a stimulus with different pitch (e.g., Näätänen et al., 1978, 2007; Picton et al., 2000). This response is thought to reflect the updating of auditory memory caused by a mismatch between the deviant auditory signal and the sensory-memory of the standard stimulus. Based on a review of the literature, Näätänen and Winkler (1999) have suggested that while N1 likely reflects simple feature detection, the MMN likely operates on perceptible auditory objects (see also Sussman et al., 1998; Takegata et al., 1999, 2001; Winkler et al., 2005). In the case of pitch perception, this means that while the N1 and MMN components may share overlapping generators (Picton et al., 2000), N1 is likely generated before the formation of a single pitch percept whereas MMN is generated after the formation of a single pitch percept based on all the available cues. Furthermore, the location of MMN activity in the brain is slightly different depending on whether the feature being modified is pitch, duration, or sound location (Giard et al., 1995). Thus, MMN is sensitive enough to employ for examining the location of an integrated pitch percept. By comparing the P1, N1, and MMN elicited by pitch-evoking stimuli containing either primarily spectral or primarily temporal cues, we can determine at what stage of auditory processing these different codes for pitch are combined into a common pitch representation. Moreover, by contrasting the N1 and MMN responses, we can compare the representation of pitch-evoking stimuli in secondary auditory areas before and after the stimulus features are combined into a pitch percept.
An important consideration that is often overlooked in the literature on pitch processing is the effect of pitch saliency on the measurement of neural signatures of the percept. It has been suggested rightly that in order for an area of cortex to be considered a true pitch center, it must show a graded response to acoustic stimuli such that the response increases with increased pitch saliency (Hall and Plack, 2009). A number of researchers have measured fMRI responses to stimuli of varying pitch saliency in an effort to isolate areas of auditory cortex that would satisfy this criterion (Hall et al., 2005; Hall and Plack, 2009; Puschmann et al., 2010; Barker et al., 2011a). Furthermore, using MEG, Krumbholz et al. (2003) found that pitch onset responses are correlated with pitch saliency even when measured independently from sound onset by transitioning from white noise to iterated noise with a very similar spectrum. However, studies comparing stimuli with different cues to pitch (spectral, temporal, binaural) typically fail to equate the pitch saliency across the different stimulus types. By failing to equate saliency across different pitch-evoking stimuli, these studies introduce an additional confound in that different areas of auditory cortex may make different contributions to pitch representation depending on pitch saliency. Indeed, in an attempt to observe the effect of pitch saliency on fMRI recordings, Penagos et al. (2004) elicited responses to complex stimuli that differed in their harmonic structure such that some contained harmonics in low spectral regions (340–1100 Hz: the strong pitch condition) while others contained harmonics in high spectral regions (1200–2000 Hz: the weak pitch condition). These contrasts differed in both pitch saliency and spectral content, and control contrasts revealed that activity in anterolateral auditory cortex was sensitive to saliency and not to other differences between these stimuli. This result indicates that the responses of pitch-sensitive regions depend on pitch saliency. Barker et al. (2011a) measured discrimination thresholds for each of the stimulus types used in their experiment (pulse trains and complex tones comprised of unresolved harmonics) and determined that they were linearly related to the degree of regularity in the stimulus. However, they did not report whether saliency differed between stimulus types, nor did they control for saliency during fMRI recording.
Thus, to accurately locate areas of overlapping activity across stimuli containing different cues to pitch using functional imaging, the saliency of the pitch percept must be controlled. This consideration is equally important for ERP analysis of pitch perception. Processing-related components such as the MMN have been shown to differ in amplitude and latency depending on the complexity of the stimulus and the difficulty of the discrimination (e.g., see Picton et al., 2000). For example, the latency of the MMN elicited by stimuli that differ in periodicity pitch is longer than the MMN evoked by an equivalent frequency change in pure tone stimuli, suggesting that the extraction of periodicity-based pitch requires more complex processing than extraction of spectral pitch (Winkler et al., 1997). Picton et al. (2000) have suggested, further, that in order to determine the relative timing for discrimination of different types of auditory features, it is essential to measure MMN latencies when the difficulties of the discriminations are equivalent.
In the present study, we compare responses to two different stimulus types that evoke pitch sensations, IRN and complex tone stimuli containing unresolved harmonic components. Furthermore, we matched them for the saliency of their perceived pitch (see Materials and Methods for details). We compare the amplitude and latency of cortically generated ERPs including components thought to be generated before (P1, N1) and after (MMN) a pitch percept is extracted. We use dipole-fitting methods to determine the locations of the neural sources of these components, and make comparisons across stimuli to investigate when and where a common representation of pitch might exist in auditory cortex.
Materials and Methods
Participants
Twelve normal hearing adults participated (three males, mean age = 21.8 years ± 1.67). All of the subjects participated in each condition of the experiment. After the nature of the study was described, each subject gave informed consent to participate, and filled in a short survey outlining their hearing and musical history. No subject reported any history of hearing impairment. No participants were highly musically trained (mean = 3.1 ± 2.8 years of formal instruction) and no significant correlations were found between amount of musical training and any of the measures reported below (p > 0.2 for all correlations). The study procedures were approved the McMaster Research Ethics Board.
Stimuli
Two types of stimuli were created for this experiment: high-pass filtered IRN stimuli and high-pass filtered harmonic complexes. All stimuli were created using Adobe Audition, were 450 ms in duration, employed 10 ms linear onset and offset ramps, and were presented at 70 dBA.
Iterated rippled noise stimuli were created by generating a sample of frozen white noise, and adding it to itself following a delay equal to the inverse of the frequency of the desired pitch percept (for a schematic illustration, see Figure 1). This process was repeated a total of 16 times, as pitch perception for IRN stimuli has been shown to plateau at 16 iterations; further iterations do not increase pitch salience (Patterson et al., 1996). The delay time was set to either 6 ms, in order to create a signal with a perceived pitch of 167 Hz, or 5 ms, in order to create a signal with a perceived pitch of 200 Hz. To ensure equal power across the length of the stimuli, the first and last 100 ms (which contain a gradual increase and decrease in power, respectively, resulting from the iterative delay-and-add process) were removed. The IRN stimuli were then high-pass filtered at 2600 Hz (high-ordered Butterworth filter), representing the 13th harmonic of the 200-Hz stimulus, to remove spectral content in the range of the resolvable harmonics. IRN stimuli have characteristic ripples in their power spectra at low frequencies; high-pass filtering in this way removes these spectral pitch cues.
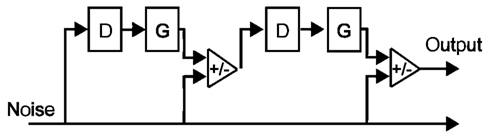
Figure 1. Schematic diagram of the delay (D), gain (G), and add networks used to generate the type of IRN stimuli used in the present study (adapted from Yost, 1996). A sample of white noise is added (G = 1) to itself following some delay. This process is repeated a number of times, and the resulting stimulus has a perceivable pitch component at the inverse of the delay (1/D).
Complex harmonic stimuli with fundamental frequencies of 167 and 200 Hz were generated by adding harmonics of equal intensity from the fundamental frequency to 20 kHz. These harmonic stimuli were high-pass filtered at 2600 Hz such that the pitch-evoking information was constrained to the same spectral area as in the IRN stimuli. Despite having spectral information limited to the region typically considered to contain primarily unresolved harmonics, these complexes evoked a stronger pitch sensation than the IRN stimuli, likely because their spectral peaks were more defined (see Figure 2). To equate saliency between the stimulus types, these complexes were presented in white noise at an intensity that was determined as follows. Six listeners with musical experience (mean = 10.8 years of formal instruction) were recruited to participate in a pitch-saliency matching exercise. Participants with musical training were chosen as they readily understood the concept of pitch strength. Given that both stimulus types were novel, it is unlikely that relative pitch saliency would differ between participants with and without musical training. The participants listened to the IRN stimulus and compared it to the complex harmonic stimulus in a white noise masker, each presented over Sennheiser HDA 200 headphones. They were asked to “adjust the intensity of the noise masker until the strength of the perceived pitch was equal between their newly created combination and the pitch-matched IRN stimulus.” They were able to hear each stimulus as many times as needed, and the matching exercise concluded when they determined that they had created the best possible match. The signal-to-noise ratio (SNR) was recorded for each of the two stimuli (30.3 ± 2.1 dB for the 167-Hz stimulus and 28.0 ± 1.5 dB for the 200-Hz stimulus). These SNRs were applied to the level of white noise added to the complex harmonic stimuli. Inter-subject reliability was high for this exercise (standard error = 0.92 dB) suggesting that this type of perceptual matching exercise was reliable for matching pitch saliency between stimulus types.
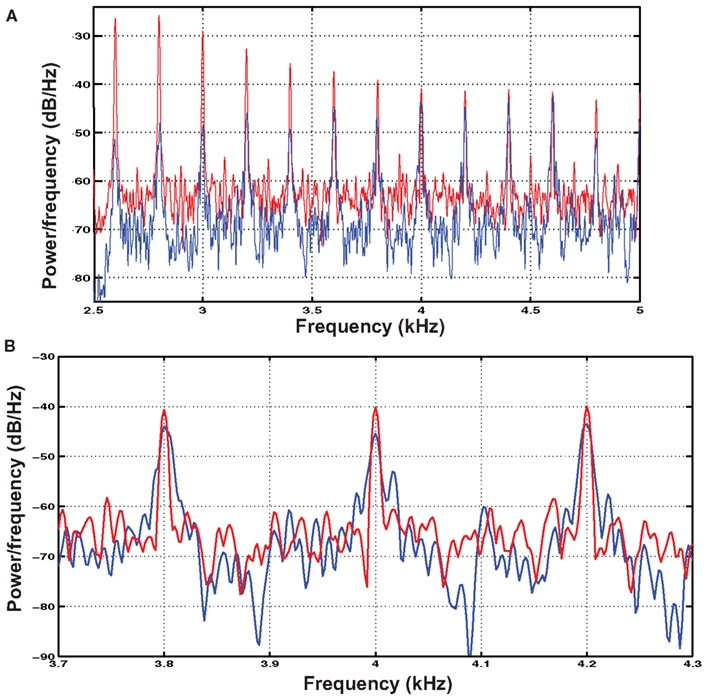
Figure 2. (A) Shows the power spectra calculated using Welch’s method for the IRN (blue) and complex harmonic (red) 200 Hz stimuli used in the experiment. The spectra were calculated with a 11025-point Hamming window applied with a 10925-point overlap. (B) Shows a zoomed-in view of three of the upper harmonics of the stimuli, illustrating the difference between the “rippled noise” spectrum and a complex waveform made up of discrete harmonics. In particular, the harmonics of the complex waveform are higher in amplitude and more defined in that they show sharper peaks whereas those of the IRN stimuli are more spread out in frequency.
Power spectra for the IRN and complex tone stimuli are shown in Figure 2A. Following 16 iterations of the process used to generate IRN sounds, some spectral information emerges in their power spectra. However, close examination of the information contained at these spectral peaks reveals that while the harmonic stimuli contain distinct peaks at harmonics of the fundamental frequency, the spectral cues contained in the IRN stimuli are much less clearly defined (Figure 2B). It is also possible that cochlear interactions may introduce some spectral cues to IRN stimuli at the position on the basilar membrane corresponding to the fundamental frequency. This would not be the case for the harmonic complexes as they were presented in broadband noise to equate for pitch saliency. However, potential difference tones corresponding to the fundamental frequency in the case of the IRN stimuli would be of low amplitude. Furthermore, it has been demonstrated using a low-pass noise masker that the effects of IRN in lateral HG cannot be explained by a response to distortion products (Hall and Plack, 2009).
Procedure
Participants were seated comfortably in a sound attenuating room, and EEG signals were collected using a 128-channel EGI HydroCel GSN electrode net connected to NetStation 4.2 software. Data from each of the 128 electrodes were digitized at 1000 Hz with a vertex reference and bandpass filter of 0.1–400 Hz, while electrode impedance was maintained below 50 kΩ (the EGI system is high impedance). In each condition, a traditional oddball paradigm was employed whereby the standard stimulus (perceived pitch of 167 Hz) was presented on 85% of trials, and a deviant (oddball) stimulus (perceived pitch of 200 Hz) was presented on the remaining 15% of trials. All stimuli were delivered to a speaker positioned 1 m in front of the listener using a presentation program written in E-prime. Each participant heard both the IRN and complex harmonic stimulus conditions in different blocks of trials, and the order of presentation was randomized. In each of the two blocks, participants heard a total of 750 stimuli (638 standard and 112 deviant) at an SOA of 800 ms. The whole recording lasted roughly 20 min. Participants watched a silent movie for the duration of the experiment and were asked to minimize movements and eye blinks during testing phases.
Analysis
Data were resampled offline at 200 Hz, converted to an average reference, and bandpass filtered between 0.5 and 20 Hz with a roll-off of 24 dB/octave. For each condition, ERPs to the deviant and standard stimuli (excluding those standards that immediately followed a deviant) were averaged separately for each individual, using EEProbe software. Filtered continuous data were segmented into 500 ms epochs containing a 100-ms baseline and 400 ms post-stimulus onset. This epoch contained all of the components of interest (P1, N1, and MMN), and eliminated any possible stimulus-offset responses that were not of interest in the present study. EEG responses exceeding ±120 μV were considered artifact, thus any epoch in which the response from any electrode exceeded this limit was removed before averaging. Difference waves were created for each subject by subtracting the standard waveform from the deviant waveform. Finally, data from all subjects were averaged to create grand average waveforms. To visualize the waveforms, 72 electrodes were selected and divided into four groupings in each hemisphere, and averaged within each grouping to represent brain responses recorded at the frontal (16 electrodes), central (20 electrodes), parietal (18 electrodes), and occipital (18 electrodes) regions (Figure 3). This virtual electrode montage has been used successfully in previous EEG studies to illustrate the average responses observed across scalp regions (e.g., He and Trainor, 2009; Trainor et al., 2011; Marie and Trainor, 2012).
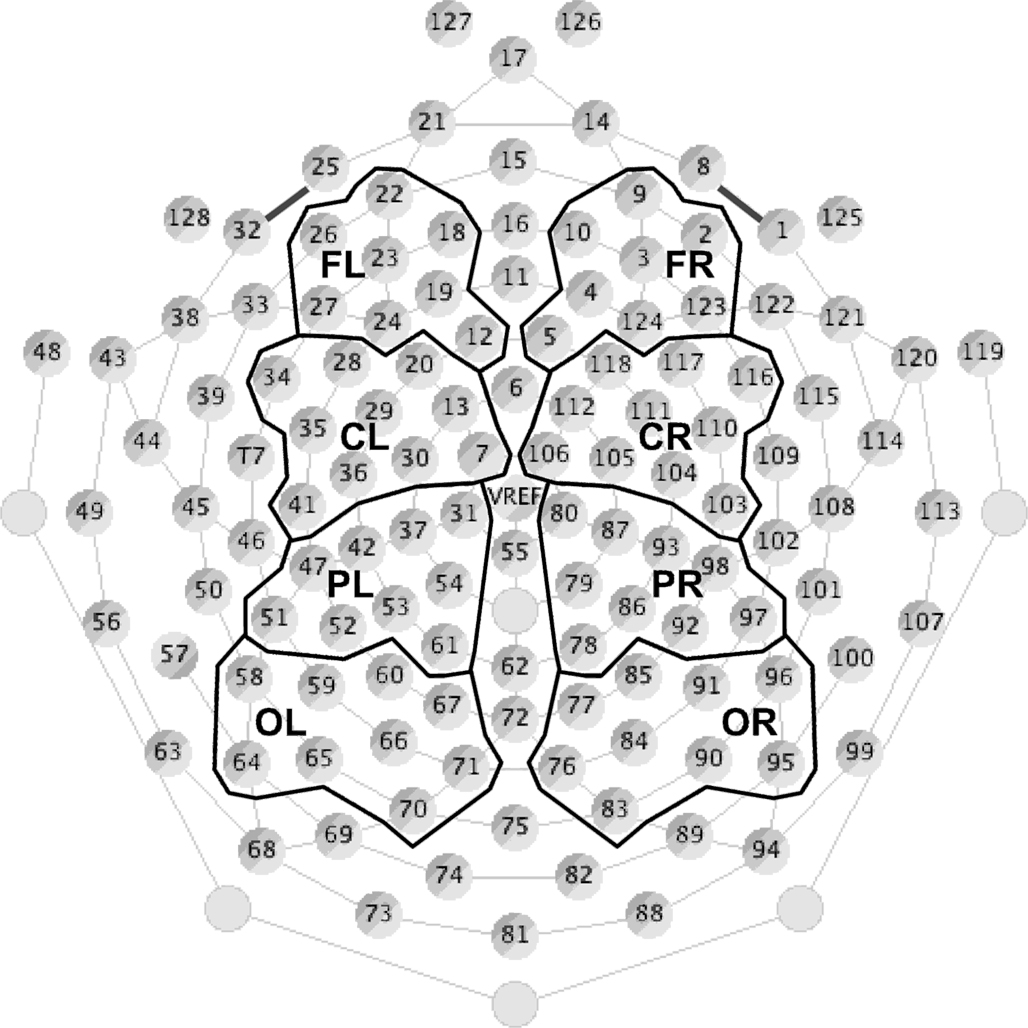
Figure 3. Electrode groupings (see Materials and Methods for details). Seventy-two of 128 electrodes were divided into four groups (frontal, central, parietal, and occipital) for each hemisphere. Each group contained between 16 and 20 electrodes that were averaged together to represent EEG responses from that scalp region. The remaining channels around the perimeter of the net were excluded from analysis to avoid artifacts resulting from muscle activity in the face and neck, and channels along the midline were removed to allow for comparison between hemispheres.
The peak latency and amplitude of the P1, N1, and MMN components were measured in each subject at each of the scalp regions defined in Figure 3. P1 and N1 were defined as the first positive and negative-going deflections in the frontal and central regions, respectively (with polarity reversed in the parietal and occipital regions), and were measured in each individual in response to the standard stimulus in each stimulus condition (IRN and complex harmonic). MMN was defined as the largest negative peak between 100 and 300 ms at the frontal and central regions (with polarity again reversed in the parietal and occipital regions), and was measured from the difference wave (deviant-standard) for each individual for each stimulus condition. P1, N1, and MMN were largest at the frontal regions, so six separate analyses of variance (ANOVA) were conducted on the peak amplitude and latency at frontal regions for each component to test whether they varied across condition and hemisphere.
Source analyses were performed to compare the locations of the generators of the P1, N1, and MMN components across stimulus conditions as follows. Regional sources, each containing three orthogonal dipoles, were fit for each component in each subject using the four-shell ellipsoid model included in the Brain Electrical Source Analysis (BESA) software package. Two sources were fixed to the eyes to account for any residual muscle-related activity that was not eliminated during artifact rejection. An additional regional source was then fit in the auditory cortex of each hemisphere, and the two were constrained to be symmetric between hemispheres. The 3D location of the symmetrical sources was determined by the inverse solutions generated by BESA. Participants for whom these regional sources accounted for less than 85% of the variance in the field patterns for one or more components were excluded from further analysis (in the remaining 8 of 12 subjects, this fitting paradigm accounted for a mean variance of 95, 92, and 92% in the P1, N1, and MMN components, respectively). It has been suggested that in addition to generators in auditory cortex, frontal areas may contribute to the MMN response; however the fitting of an additional pair of regional sources did not significantly reduce the residual variance.
Results
Group average ERP waveforms for each of the electrode groups across stimulus conditions are presented in Figure 4. P1 and N1 reverse polarity between frontal and occipital regions, indicative of activity originating in auditory cortex. Separate repeated-measures ANOVAs examined P1 and N1 peak amplitude and latency in response to the standard stimuli, as measured in the frontal regions of each listener. For each analysis, within-subject factors included stimulus type (IRN, complex) and hemisphere (left, right). The order of stimulus blocks was treated as a between-subjects factor, and was shown to have no effect on the amplitude or latency of the P1 and N1 components. There were no significant effects of hemisphere or stimulus type on P1 or N1 amplitude. For latency, there was also no significant effect of hemisphere for either component (p = 0.95 and p = 0.37 for P1 and N1 respectively), but there was a significant effect of stimulus type for both P1 latency [F(1, 11) = 19.83, p = 0.001] and N1 latency [F(1, 11) = 73.04, p < 0.001]. Both the P1 and N1 components occurred later in response to the IRN stimuli than to the complex harmonic stimuli, suggesting that the extraction of stimulus features takes more time in the IRN condition. Analyses were also conducted to examine peak amplitudes and latencies of the P1 and N1 components in response to deviant stimuli, and results were similar. N1 latency again demonstrated a significant effect of stimulus type [F(1, 11) = 24.55, p < 0.001]. For P1 latency, the trend was in the same direction as for standards, but failed to reach significance (p = 0.28), most likely because there were few deviant stimuli presented.
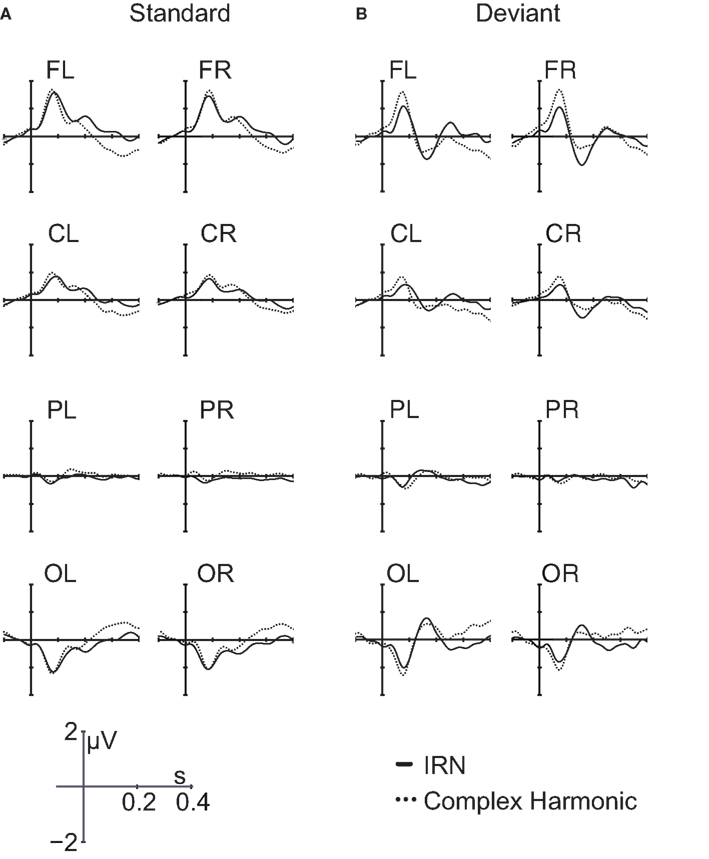
Figure 4. Grand average waveforms in response to IRN and complex harmonic stimuli for standard trials (A) and deviant trials (B) for all eight scalp regions.
Figure 5 compares the grand average difference waves (deviant-standard) showing the MMN elicited by pitch changes in the IRN and complex harmonic stimuli. The front-to-back reversal is consistent with a generator in auditory cortex. Within-subject t-tests revealed latencies at which the difference waveforms were significantly different from zero (i.e., latencies at which the response to the deviant stimulus was significantly different from that to the standard, as shown by the bars beneath the waveforms in Figure 5). Separate repeated-measures ANOVAs examined MMN peak amplitude and latency, as measured in the frontal regions of each listener. For each analysis, within-subject factors were stimulus type (IRN, complex) and hemisphere (left, right). The order of stimulus blocks was again treated as a between-subjects factor, and was shown to have no effect on MMN amplitude or latency. For MMN latency, unlike P1 and N1 components, stimulus type had no significant main effect [F(1, 11) = 0.33, p = 0.58]. However, the amplitude of the MMN was larger for IRN stimuli than for complex harmonic stimuli [F(1, 11) = 13.89, p = 0.003]. The increased MMN amplitude in the IRN condition suggests that more neurons were recruited for analysis of pitch in the IRN case than in the case of the complex harmonic stimuli, but the time taken to form a pitch percept was similar.
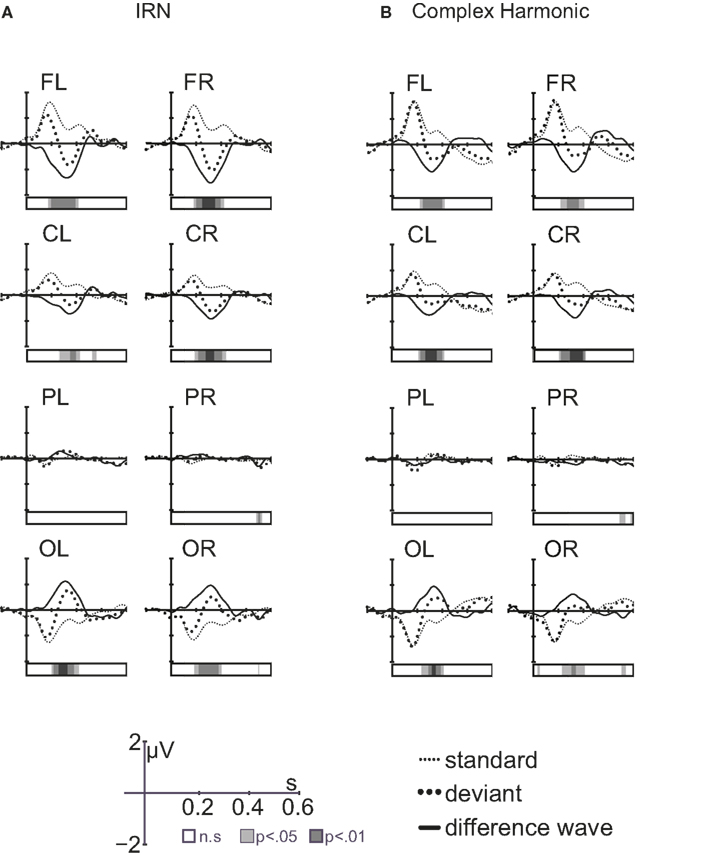
Figure 5. Grand average waveforms [standard response, deviant response, and difference wave (deviant-standard)] for IRN stimuli (A) and complex harmonic stimuli (B). The bars under the waveforms show latencies at which the amplitude of the difference wave was significantly different from zero.
Figure 6 depicts the regional sources fit for the P1, N1, and MMN components of the grand average waveforms for each stimulus condition using inverse solutions generated by BESA. The locations of symmetric dipoles fit using this method were recorded for each component in each participant for each stimulus condition. Within-subject t-tests were performed to determine whether the location of these source estimates differed between stimulus types. While no significant differences were observed in the rostrocaudal (p = 0.37 and p = 0.31 for P1 and N1, respectively) or mediolateral (p = 0.80 and p = 0.77 for P1 and N1, respectively) planes, both the P1 and N1 components generated in response to the complex harmonic stimuli were determined to have originated from sources dorsal to those generated in response to the IRN stimuli [t(7) = 5.90, p = 0.001 for P1, t(7) = 5.56, p = 0.001 for N1]. Conversely, source estimates of the MMN component for IRN and complex harmonic stimuli were not shown to differ significantly along the dorsoventral [t(7) = 1.71, p = 0.13], rostrocaudal [t(7) = 0.03, p = 0.97], or mediolateral [t(7) = 0.49, p = 0.64] planes. Thus these source models reveal differences between the P1 and N1 components elicited in response to IRN versus complex harmonic stimuli, while failing to find a difference between stimulus types for MMN. Collectively, these data suggest that the pitch representations elicited by IRN and complex harmonic stimuli are processed in different cortical areas in primary auditory cortex (indexed by P1) and early processing in secondary auditory areas (indexed by N1). However, the MMN components elicited in response to each stimulus type had a common source in secondary auditory cortex. While our source analysis does not allow us to determine the precise anatomical location of the MMN response to pitch, the data suggest it is located between the regions generating P1 and N1 (see Figure 7), consistent with a source in the area in lateral Heschl’s gyrus that has been revealed by fMRI studies using stimuli with a variety of cues to pitch (Griffiths et al., 1998; Patterson et al., 2002; Gutschalk et al., 2004; Penagos et al., 2004; Hall et al., 2005; Puschmann et al., 2010).
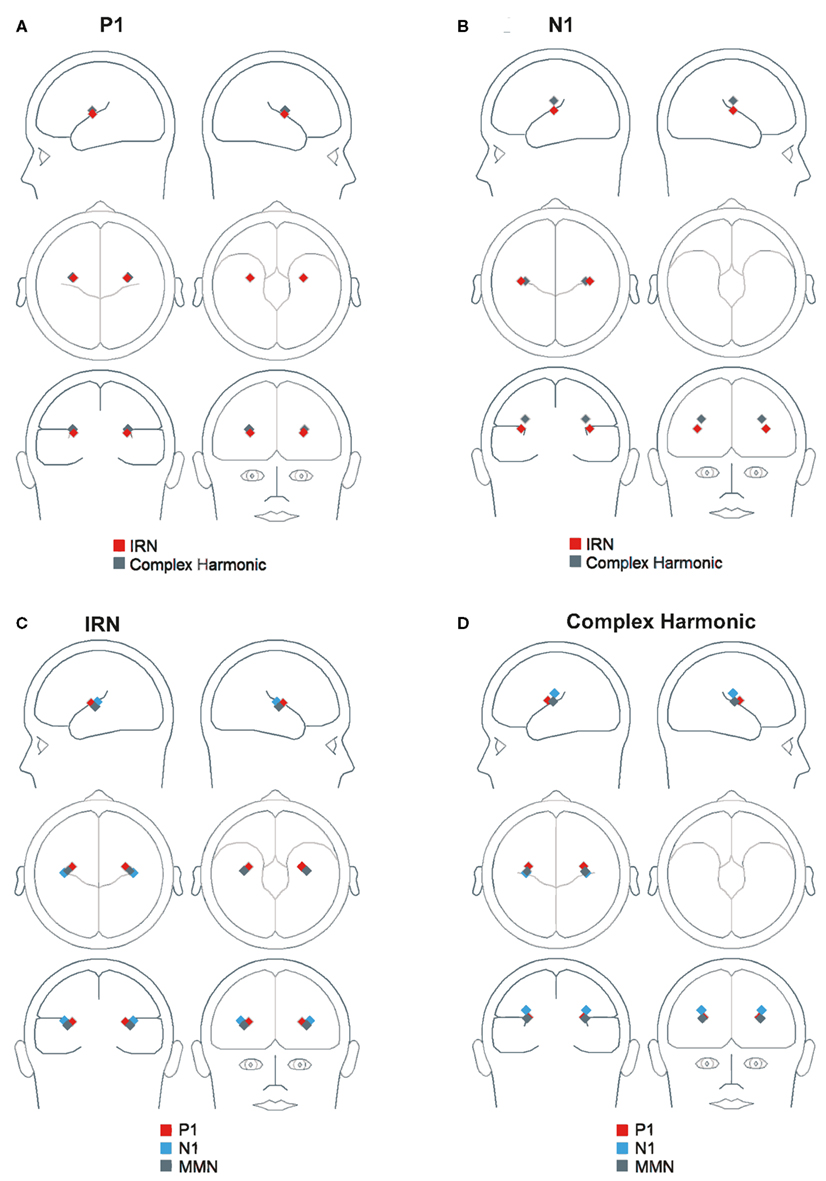
Figure 6. Three-dimensional locations of symmetric regional sources fit using inverse solutions generated by BESA. (A) Shows the location of P1 in both stimulus conditions. (B) Shows the location of N1 in both stimulus conditions. (C,D) Show the location of P1, N1, and MMN in the IRN and complex harmonic conditions, respectively.
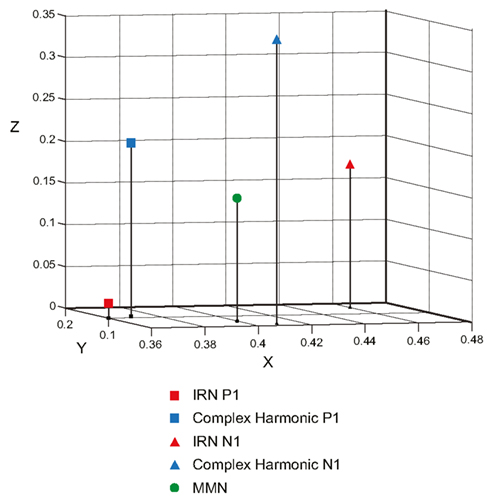
Figure 7. Three-dimensional scatterplot showing the Cartesian coordinates of the P1 and N1 components elicited by the IRN and complex harmonic stimuli, as well as the common MMN elicited by both stimulus types. In the BESA Cartesian coordinate system, the X-axis passes through the Left Pre-Auricular point (LPA) and Right Pre-Auricular point (RPA) with right being the positive direction. The Y-axis passes through the nasion, with rostral being positive. The Z-axis is orthogonal to the X- and Y-axes, with dorsal being the positive direction. Components shown are all located in the right hemisphere, while symmetric sources in the left hemisphere have been omitted for clarity.
Discussion
In the current experiment, we recorded participants’ ERP responses to occasional pitch changes in high-pass filtered IRN and complex harmonic stimuli matched for perceptual pitch saliency. We used the fact that different ERP components reflect different stages of processing to investigate when and where in auditory cortex different cues to pitch might be integrated into a common representation. Particularly useful for this question is the fact that P1 (around 50 ms after stimulus onset, originating in primary auditory cortex) and N1 (around 100 ms after stimulus onset, originating in secondary auditory cortex) responses are thought to reflect early feature processing whereas MMN (around 150 ms) is thought to operate on perceptible auditory objects (Näätänen and Winkler, 1999). Specifically, we found no difference in the amplitude of P1 and N1 responses across stimuli, but both P1 and N1 responses occurred earlier for complex harmonic than IRN stimuli, suggesting somewhat different processes at work for different cues to pitch at these stages of processing. The converse was true for MMN, with responses to pitch changes not different in latency, but larger for IRN than complex harmonic stimuli, suggesting that although more neurons might be recruited for the analysis of sounds with less spectral pitch information, the timing of the formation of an integrated pitch percept appears to be similar for sounds regardless of spectral and temporal cues. In any case, the most important findings were in the results of the regional source estimation analyses. As expected, P1 sources were located more rostral and dorsal than sources for N1, consistent with P1 originating in primary auditory cortex and N1 in secondary auditory cortex. Furthermore, for both P1 and N1, source locations were highly significantly different for the IRN and complex harmonic stimuli. This difference suggests that at these pre-object integration stages of processing, different features of the stimuli give rise to processing in somewhat different brain regions. On the other hand, there was no significant difference between the source locations of the MMN for the IRN and complex harmonic stimuli. This suggests that at this stage of processing an integrated pitch perception is formed, regardless of the particular pitch cues present. It is important to note that the P1 and N1 components elicited in response to standard and deviant stimuli of the same stimulus type are expected to be very similar. It is possible that they reflect in part, processing of non-pitch features (Barker et al., 2011b). However, neural activity related to these features should be largely eliminated in the difference wave, and the MMN component should reflect primarily pitch processes. Therefore, the fact that we see no latency or source localization difference for the MMN response between stimulus types, despite different latencies and source localizations for the P1 and N1 components suggests a common process of object formation. Furthermore, the MMN response to pitch change was located between the locations of the P1 and N1 generators, which is consistent with fMRI studies indicating the existence of a pitch center located adjacent to primary auditory cortex along the lateral aspect of Heschl’s gyrus. In sum, different cues to pitch appear to be processed in somewhat different regions during early cortical processing, but by about 155 ms after stimulus onset, an integrated pitch percept is formed regardless of particular cues to pitch, as indexed by the MMN response.
The fine temporal resolution of EEG recording allows examination of individual stages of auditory processing that differ on a millisecond scale. However, the spatial resolution of this method is not as good as that of functional imaging methods such as fMRI, as the locations of cortical activity must be modeled on the basis of electrical field distributions at the scalp. Source location estimation is accomplished through inverse modeling, in which source locations are estimated and the pattern of activity that they would generate at the head surface is calculated. An iterative process is employed whereby the sources are moved in location and orientation until the surface pattern best matches that measured during the experiment (see Baillet et al., 2001; Micheyl et al., 2004; Hallez et al., 2007 for reviews). With such a process, there are multiple solutions for any particular component and stimulus condition. Consequently, the source estimate represents the solution that accounts for the greatest amount of variance in the data rather than a direct recording of electrical activity. Although this does offer a limitation in terms of localizing component sources, the dipole-fitting method used in the present study was sufficient to spatially resolve responses from primary and secondary auditory cortices (as represented by the P1 and N1 components). Moreover, it was sufficient to show highly significant differences within auditory areas across stimulus types (e.g., differences in both P1 and N1 sources for IRN compared to complex harmonic stimuli). Thus, finding a common source location for the MMN component across stimulus types is unlikely due to insufficient spatial resolution.
The pitch salience of the stimuli in the current experiment was perceptually equated, but there were minor differences in the spectral content as the white noise masker in the complex harmonic condition contained energy at low frequencies that was not present in the IRN stimulus. However, it has been demonstrated previously that pitch-related areas of auditory cortex respond to the salience of the perceived pitch rather than to other stimulus differences. For example, Penagos et al. (2004) contrasted fMRI responses to stimuli that differed either in spectral content alone or in both spectral content and pitch saliency and found that spectral inequality did not result in any differential activation in lateral Heschl’s gyrus. Moreover, based on the tonotopic organization of auditory cortex, one would expect slight differences in spectral content to shift source estimates of the P1 and N1 components mediolaterally (Humphries et al., 2010), rather than dorsoventrally as observed in the current study. Thus, the differences in P1 and N1 sources revealed in the present study most likely reflect differential processing of sound features, such as the relative salience of different pitch cues, rather than minor differences in spectral content.
There is some evidence that the right auditory cortex is specialized for the processing of pitch. Lesion studies suggest that patients with surgical excisions of the right, but not left auditory cortex show deficits in perceiving the missing fundamental (Zatorre, 1988), in processing complex spectral structure (Sidtis and Volpe, 1988) and in discriminating melodic pitch patterns (Zatorre, 1985, 1988). These findings have been supported by recent functional imaging studies demonstrating that the auditory areas in the right hemisphere are selectively activated in both pitch perception (Hyde et al., 2008) and production tasks (Perry et al., 1999). Zatorre (2002) has suggested that this functional asymmetry may represent a tradeoff in processing such that the auditory cortical systems in the two hemispheres have evolved complementary specializations. Our study did not demonstrate any appreciable hemispheric differences, which at first glance seems discordant with these findings. However, there are two important experimental parameters that warrant consideration here: the difficulty of the discrimination and the complexity of the task. In an fMRI study of pitch processing, Hyde et al. (2008) demonstrated a right hemisphere advantage in discriminating pitch changes between 6.25 and 200 cents. However, they noted that BOLD response in the left PT increased for the larger pitch changes. Hyde et al. suggested that both hemispheres likely contribute to pitch discrimination, with the right hemisphere advantage being most evident for fine frequency discriminations. Thus, the finding in the present study of a bilateral response is consistent with Hyde et al., as we used a relatively large pitch change (167–200 Hz represents a change of more than 300 cents). It is also possible that the right hemisphere advantage in pitch processing is task dependant. For example, Johnsrude et al. (2000) found that patients with excisions that encroached on lateral Heschl’s gyrus in the right hemisphere were impaired in detecting the direction of a pure tone frequency change, but simple frequency discrimination for those same stimuli was unaffected in these patients. The passive pitch discriminations measured in our experiment did not require detection of the direction of pitch change, and therefore likely would have diminished any right hemisphere advantage.
Modern theories of pitch extraction typically include both spectral and temporal pitch cues, but the details of how and when the two pitch codes are combined into a common representation of the percept are still largely unknown. Temporal integration windows widen throughout the ascending auditory pathway (Walker et al., 2011) and, accordingly, it has been demonstrated that the conversion of temporal pitch cues into a more stable code occurs at or before the level of primary auditory cortex (Griffiths et al., 1998), possibly in the inferior colliculus (Langner and Schreiner, 1988). On the other hand, spectral pitch cues are well represented in the tonotopic organization of the auditory system that exists at least into primary auditory cortex (Humphries et al., 2010). While fMRI is well-suited to localize pitch-responsive areas of cortex with good spatial resolution, it can tell us little about the temporal sequence involved in pitch processing. In the present study, we have used EEG to show that early cortical processing of different sound features, such as the relative salience of different pitch cues, is accomplished in somewhat different areas in primary and secondary auditory cortex, while at a later stage (about 150 ms after stimulus onset), an integrated pitch percept appears to emerge in a common processing area. In future studies it would be interesting to use measures with good temporal resolution such as EEG or MEG in order to compare the extraction of pitch percepts across a wide range of stimuli that contain a variety of cues to pitch.
Conflict of Interest Statement
The authors declare that the research was conducted in the absence of any commercial or financial relationships that could be construed as a potential conflict of interest.
Acknowledgments
The authors thank Elaine Whiskin for help with data collection, Chris McAllister for help preparing figures, and Dan Bosnyak for helpful comments during manuscript preparation. This research was funded by a grant to Laurel J. Trainor from the Canadian Institutes of Health Research.
References
Baillet, S., Mosher, J. C., and Leahy, R. M. (2001). Electromagnetic brain mapping. IEEE Signal Process. Mag. 18, 14–30.
Barker, D., Plack, C. J., and Hall, D. A. (2011a). Human auditory cortical responses to pitch and to pitch strength. Neuroreport 22, 111–115.
Barker, D., Plack, C. J., and Hall, D. A. (2011b). Reexamining the evidence for a pitch-sensitive region: a human fMRI study using iterated ripple noise. Cereb. Cortex 22, 745–753.
Bendor, D., and Wang, X. (2005). The neuronal representation of pitch in primate auditory cortex. Nature 436, 1161–1165.
Bregman, A. S. (1990). Auditory Scene Analysis: The Perceptual Organization of Sound. Cambridge, MA: The MIT Press.
Cariani, P., and Delgutte, B. (1996). Neural correlates of the pitch of complex tones. I. Pitch and pitch saliency. J. Neurophysiol. 76, 1698–1716.
Cedolin, L., and Delgutte, B. (2005). Pitch of complex tones: rate-place and interspike interval representations in the auditory nerve. J. Neurophysiol. 94, 347–362.
Cedolin, L., and Delgutte, B. (2007). “Spatio-temporal representation of the pitch of complex tones in the auditory nerve,” in Hearing – From Sensory Processing to Perception, eds B. Kollmeier, V. Hohmann, U. Langemann, M. Mauermann, S. Uppenkamp and J. Verhey (Berlin: Springer-Verlag), 61–70.
de Boer, E. (1976). “On the “residue”, and auditory pitch perception,” in Handbook of Auditory Physiology, eds W. D. Keidel and W. D. Neff (Berlin: Springer-Verlag), 479–583.
Delgutte, B., and Cariani, P. (1992). “Coding of the pitch of harmonic and inharmonic complex tones in the interspike intervals of auditory nerve fibers,” in The Processing of Speech, ed. M. E. H. Schouten (Berlin: Mouton-De Gruyter), 37–45.
Formisano, E., Kim, D., Di Salle, F., van de Moortele, P., Ugurbil, K., and Goebel, R. (2003). Mirror-symmetric tonotopic maps in human primary auditory cortex. Neuron 40, 859–869.
Frick, R. W. (1985). Communicating emotion: the role of prosodic features. Psychol. Bull. 97, 412–429.
Giard, M. H., Lavikainen, J., Reinikainen, K., Bertrand, O., Pernier, J., and Näätänen, R. (1995). Separate representation of stimulus frequency, intensity, and duration in auditory sensory memory: an event-related potential and dipole-model study. J. Cogn. Neurosci. 7, 133–143.
Gockel, H. E., Carlyon, R. P., Mehta, A., and Plack, C. J. (2011). The frequency following response for dichotic pitch stimuli: no evidence for pitch encoding. J. Acoust. Soc. Am. 129, 2592–2592.
Godey, B., Schwartz, D., de Graaf, J. B., Chauvel, P., and Liegeois-Chauvel, C. (2001). Neuromagnetic source localization of auditory evoked fields and intracerebral evoked potentials: a comparison of data in the same patients. Clin. Neurophysiol. 112, 1850–1859.
Goldstein, J. L. (1973). An optimum processor theory for the central formation of the pitch of complex tones. J. Acoust. Soc. Am. 54, 1496–1516.
Griffiths, T. D., Buchel, C., Frackowski, R. S. J., and Patterson, R. D. (1998). Analysis of temporal structure in sound by the human brain. Nat. Neurosci. 1, 422–427.
Gutschalk, A., Patterson, R. D., Scherg, M., Uppenkamp, S., and Rupp, A. (2004). Temporal dynamics of pitch in human auditory cortex. Neuroimage 22, 755–766.
Hall, D. A., Barrett, D. J. K., Akeroyd, M. A., and Summerfield, A. Q. (2005). Cortical representations of temporal structure in sound. J. Neurophysiol. 94, 3181–3191.
Hall, D. A., and Plack, C. J. (2009). Pitch processing sites in the human auditory brain. Cereb. Cortex 19, 576–585.
Hallez, H., Vanrumste, B., Grech, R., Muscat, J., De Clercq, W., Vergult, A., D’Asseler, Y., Camilleri, K. P., Fabri, S. G., Huffel, S. V., and Limahieu, I. (2007). Review on solving the forward problem in EEG source analysis. J. Neuroeng. Rehabil. 4:46. doi:10.1186/1743-0003-4-46
He, C., and Trainor, L. J. (2009). Finding the pitch of the missing fundamental in infants. J. Neurosci. 29, 7718–7722.
Houstma, A. J. M., and Smurzynski, J. (1990). Pitch identification and discrimination for complex tones with many harmonics. J. Acoust. Soc. Am. 87, 304–310.
Humphries, C., Liebenthal, E., and Binder, J. R. (2010). Tonotopic organization of human auditory cortex. Neuroimage 50, 1202–1211.
Hyde, K. L., Peretz, I., and Zatorre, R. J. (2008). Evidence for the role of the right auditory cortex in fine pitch resolution. Neuropsychologia 46, 632–638.
Johnsrude, I. S., Penhune, V. B., and Zatorre, R. J. (2000). Functional specificity in the right human auditory cortex for perceiving pitch direction. Brain 123, 155–163.
Krumbholz, K., Patterson, R. D., Seither-Preisler, A., Lammertmann, C., and Lütkenhöner, B. (2003). Neuromagnetic evidence for a pitch processing centre in Heschl’s gyrus. Cereb. Cortex 13, 765–772.
Langner, G., and Schreiner, C. E. (1988). Periodicity coding in the inferior colliculus of the cat. I. Neuronal mechanisms. J. Neurophysiol. 60, 1799–1822.
Lauter, J. L., Herscovitch, P., Formby, C., and Raichle, M. E. (1985). Tonotopic organization in human auditory cortex revealed with positron emission tomography. Hear. Res. 20, 199–205.
Marie, C., and Trainor, L. J. (2012). Development of simultaneous pitch encoding: infants show a high voice superiority effect. Cereb. Cortex. doi:10.1093/cercor/bhs050
Merzenich, M. M., and Brugge, J. F. (1973). Representation of the cochlear partition on the superior temporal plane of the macaque monkey. Brain Res. 50, 275–296.
Merzenich, M. M., Knight, P. L., and Roth, G. L. (1974). Representation of cochlea within auditory cortex in the cat. J. Neurophysiol. 38, 231–249.
Micheyl, C. M., Murray, M. M., Lantz, G., Gonzalez, S., Spinelli, L., and de Peralta, R. G. (2004). EEG source imaging. Clin. Neurophysiol. 115, 2195–2222.
Moore, B. C. J. (2003). An Introduction to the Psychology of Hearing, 5th Edn. London: Emerald Group Publishing.
Moore, B. C. J. (2008). The role of temporal fine structure processing in pitch perception, masking, and speech perception for normal-hearing and hearing-impaired people. J. Assoc. Res. Otolaryngol. 9, 399–406.
Moore, B. C. J., and Gockel, H. E. (2011). Resolvability of components in complex tones and implications for theories of pitch perception. Hear. Res. 276, 88–97.
Näätänen, R., Gaillard, A. W. K., and Mantysalo, S. (1978). Early selective-attention effect on evoked potential reinterpreted. Acta Psychol. (Amst.) 42, 313–329.
Näätänen, R., Paavilainen, P., Rinne, T., and Alho, K. (2007). The mismatch negativity (MMN) in basic research of central auditory processing: a review. Clin. Neurophysiol. 118, 2544–2590.
Näätänen, R., and Winkler, I. (1999). The concept of auditory stimulus representation in cognitive neuroscience. Psychol. Bull. 125, 826–859.
Oxenham, A. J., Micheyl, C., and Keebler, M. V. (2009). Can temporal fine structure represent the fundamental frequency of unresolved harmonics. J. Acoust. Soc. Am. 125, 2189–2199.
Pantev, C., Elbert, T., Ross, B., Eulitz, C., and Terhardt, E. (1996). Binaural fusion and the representation of virtual pitch in human auditory cortex. Hear. Res. 100, 164–170.
Pantev, C., Hoke, M., Lehnertz, K., Lutkenhoner, B., Anoglanakis, G., and Wittkowski, W. (1988). Tonotopic organization of the human auditory cortex revealed by transient auditory evoked magnetic fields. Electroencephalogr. Clin. Neurophysiol. 69, 160–170.
Patterson, R. D., Handel, S., Yost, W. A., and Datta, A. J. (1996). The relative strength of the tone and noise components in iterated rippled noise. J. Acoust. Soc. Am. 100, 3286–3294.
Patterson, R. D., Uppenkamp, S., Johnsrude, I. S., and Griffiths, T. D. (2002). The processing of temporal pitch and melody information in auditory cortex. Neuron 36, 767–776.
Penagos, H., Melcher, J. R., and Oxenham, A. J. (2004). A neural representation of pitch salience in nonprimary human auditory cortex revealed with functional magnetic resonance imaging. J. Neurosci. 24, 6810–6815.
Perry, D. W., Zatorre, R. J., Petrides, M., Alivisatos, B., Meyer, E., and Evans, A. C. (1999). Localization of cerebral activity during simple singing. Neuroreport 10, 3979–3984.
Picton, T. W., Alain, C., Otten, L., and Ritter, W. (2000). Mismatch negativity: different water in the same river. Audiol. Neurootol. 5, 111–139.
Puschmann, S., Uppenkamp, S., Kollmeier, B., and Thiel, C. M. (2010). Dichotic pitch activates pitch processing centre in Heschl’s gyrus. Neuroimage 49, 1641–1649.
Santurette, S., and Dau, T. (2011). The role of temporal fine structure information for the low pitch of high-frequency complex tones. J. Acoust. Soc. Am. 129, 282–292.
Schwarz, D. W., and Tomlinson, R. W. (1990). Spectral response patterns of auditory cortex neurons to harmonic complex tones in alert monkey (Macaca mulatta). J. Neurophysiol. 64, 282–298.
Shackleton, T. M., and Carlyon, R. P. (1994). The role of resolved and unresolved harmonics in pitch perception and frequency modulation discrimination. J. Acoust. Soc. Am. 95, 3529–3540.
Sidtis, J. J., and Volpe, B. T. (1988). Selective loss of complex-pitch of speech discrimination after unilateral lesion. Brain Lang. 34, 235–245.
Sussman, E., Gomes, H., Nousak, J. M. K., Ritter, W., and Vaughan, H. G. Jr. (1998). Feature conjunctions and auditory sensory memory. Brain Res. 793, 95–102.
Takegata, R., Huotilainen, M., Rinne, T., Näätänen, R., and Winkler, I. (2001). Changes in acoustic features and their conjunctions are processed by separate neural populations. Neuroreport 12, 525–529.
Takegata, R., Paavilainen, P., Näätänen, R., and Winkler, I. (1999). Independent processing of changes in auditory single features and feature conjunctions in humans as indexed by the mismatch negativity. Neurosci. Lett. 2, 109–112.
Trainor, L. J., Lee, K., and Bosnyak, D. J. (2011). Cortical plasticity in 4-month-old infants: specific effects of experience with musical timbres. Brain Topogr. 24, 192–203.
Walker, K. M. M., Bizley, J. K., King, A. J., and Schnupp, J. W. H. (2011). Cortical encoding of pitch: recent results and open questions. Hear. Res. 271, 74–87.
Winkler, I., Czigler, I., Sussman, E., Horváth, J., and Balázs, L. (2005). Preattentive binding of auditory and visual stimulus features. J. Cogn. Neurosci. 17, 320–339.
Winkler, I., Tervaniemi, M., and Näätänen, R. (1997). Two separate codes for missing-fundamental pitch in the human auditory cortex. J. Acoust. Soc. Am. 102, 1072–1082.
Yvert, B., Fischer, C., Bertrand, O., and Montysalo, J. (2005). Localization of human supratemporal auditory areas from intracerebral auditory evoked potentials using distributed source models. Neuroimage 28, 140–153.
Zatorre, R. J. (1985). Discrimination and recognition of tonal melodies after unilateral cerebral excisions. Neuropsychologia 23, 31–41.
Zatorre, R. J. (1988). Pitch perception of complex tones and human temporal-lobe function. J. Acoust. Soc. Am. 84, 566–572.
Keywords: pitch, EEG, mismatch negativity, iterated rippled noise
Citation: Butler BE and Trainor LJ (2012) Sequencing the cortical processing of pitch-evoking stimuli using EEG analysis and source estimation. Front. Psychology 3:180. doi: 10.3389/fpsyg.2012.00180
Received: 22 December 2011; Accepted: 16 May 2012;
Published online: 26 June 2012.
Edited by:
Micah M. Murray, Université de Lausanne, SwitzerlandReviewed by:
Barbara Tillmann, Centre National de la Recherche Scientifique, FranceDeborah Hall, NIHR National Biomedical Research Unit in Hearing, UK
Copyright: © 2012 Butler and Trainor. This is an open-access article distributed under the terms of the Creative Commons Attribution Non Commercial License, which permits non-commercial use, distribution, and reproduction in other forums, provided the original authors and source are credited.
*Correspondence: Laurel J. Trainor, Auditory Development Lab, Department of Psychology, Neuroscience and Behaviour, McMaster University, 1280 Main Street West, Hamilton, ON, Canada L8S4L8. e-mail:bGp0QG1jbWFzdGVyLmNh