- 1 Department of Psychological Sciences, Birkbeck College, University of London, London, UK
- 2 Department of Psychology, University of Oklahoma, Norman, OK, USA
The pre-decisional process of hypothesis generation is a ubiquitous cognitive faculty that we continually employ in an effort to understand our environment and thereby support appropriate judgments and decisions. Although we are beginning to understand the fundamental processes underlying hypothesis generation, little is known about how various temporal dynamics, inherent in real world generation tasks, influence the retrieval of hypotheses from long-term memory. This paper presents two experiments investigating three data acquisition dynamics in a simulated medical diagnosis task. The results indicate that the mere serial order of data, data consistency (with previously generated hypotheses), and mode of responding influence the hypothesis generation process. An extension of the HyGene computational model endowed with dynamic data acquisition processes is forwarded and explored to provide an account of the present data.
Hypothesis generation is a pre-decisional process by which we formulate explanations and beliefs regarding the occurrences we observe in our environment. The hypotheses we generate from long-term memory (LTM) bring structure to many of the ill-structured decision making tasks we commonly encounter. As such, hypothesis generation represents a fundamental and ubiquitous cognitive faculty on which we constantly rely in our day-to-day lives. Given the regularity with which we employ this process, it is no surprise that hypothesis generation forms a core component of several professions. Auditors, for instance, must generate hypotheses regarding abnormal financial patterns, mechanics must generate hypotheses concerning car failure, and intelligence analysts must interpret the information they receive. Perhaps the clearest example, however, is that of medical diagnosis. A physician observes a pattern of symptoms presented by a patient (i.e., data) and uses this information to generate likely diagnoses (i.e., hypotheses) in an effort to explain the patient’s presenting symptoms. Given these examples, the importance of developing a full understanding of the processes underlying hypothesis generation is clear, as the consequences of impoverished or inaccurate hypothesis generation can be injurious.
Issues of temporality pervade hypothesis generation and its underlying information acquisition processes. Hypothesis generation is a task situated at the confluence of external environmental dynamics and internal cognitive dynamics. External dynamics in the environment dictate the manifestation of the information we acquire and use as cues to retrieve likely hypotheses from LTM. Internal cognitive dynamics then determine how this information is used in service of the generation process and how the resulting hypotheses are maintained over the further course of time as judgments and decisions are rendered. Additionally, these further internal processes are influenced by and interact with the ongoing environmental dynamics as new information is acquired. These complicated interactions govern the beliefs (i.e., hypotheses) we entertain over time. It is likely that these factors interact in such a manner that would cause the data acquisition process to deviate from normative prescriptions.
Important to the present work is the fact that data acquisition generally occurs serially over some span of time. This, in turn, dictates that individual pieces of data are acquired in some relative temporal relation to one another. These constraints, individual data acquisition over time and the relative ordering of data, are likely to have significant consequences for hypothesis generation processes. Given these basic constraints, it is intuitive that temporal dynamics must form an integral part of any comprehensive account of hypothesis generation processes. At present there exists only a scant amount of data concerning the temporal dynamics of hypothesis generation. Thus, the influences of the constraints operating over these processes are not yet well understood. Until such influences are addressed more deeply at an empirical and theoretical level, a full understanding of hypothesis generation processes will remain speculative.
The empirical paradigm used in the following experiments is a simulated diagnosis task comprised of two main phases. The first phase represents a form of category learning in which the participant learns the conditional probabilities of medical symptoms (i.e., data) and fictitious diseases (i.e., hypotheses), from experience over time by observing a large sample of hypothetical pre-diagnosed patients. The second phase of the task involves presenting symptoms to the participant whose task it is to generate (i.e., retrieve) likely disease states from memory. At a broader level, such experiments involving a learning phase followed by a decision making phase have been utilized widely in previous experiments (e.g., McKenzie, 1998; Cooper et al., 2003; Nelson et al., 2010; Sprenger and Dougherty, 2012). In the to-be-presented experiments, we presented the symptoms sequentially and manipulated the symptom’s sequence structures in the “decision making phase.” As the data acquisition unfolds over time, the results of these experiments provide insight into the dynamic data acquisition and hypothesis generation processes operating over time that are important for computational models.
In this paper, we present a novel extension of an existing computational model of hypothesis generation. This extension is designed to capture the working memory dynamics operating during data acquisition and how these factors contribute to the process of hypothesis generation. Additionally, two experiments exploring three questions of interest to dynamic hypothesis generation are described whose results are captured by this model. Experiment 1 utilized an adapted generalized order effects paradigm to assess how the serial position of an informative piece of information (i.e., a diagnostic datum), amongst uninformative information (i.e., non-diagnostic data), influences its contribution to the generation process. Experiment 2 investigated (1) how the acquisition of data inconsistent with previously generated hypotheses influences further generation and maintenance processes and (2) if generation behavior differs when it is based on the acquisition of a set of data vs. when those same pieces of data are acquired in isolation and generation is carried out successively as each datum is acquired. This distinction underscores different scenarios in which it is advantageous to maintain previously acquired data vs. previously generated hypotheses over time.
HyGene: A Computational Model of Hypothesis Generation
HyGene (Thomas et al., 2008; Dougherty et al., 2010), short for hypothesis generation, is a computational architecture addressing hypothesis generation, evaluation, and testing. This framework has provided a useful account through which to understand the cognitive mechanisms underlying these processes. This process model is presented in Figure 1.
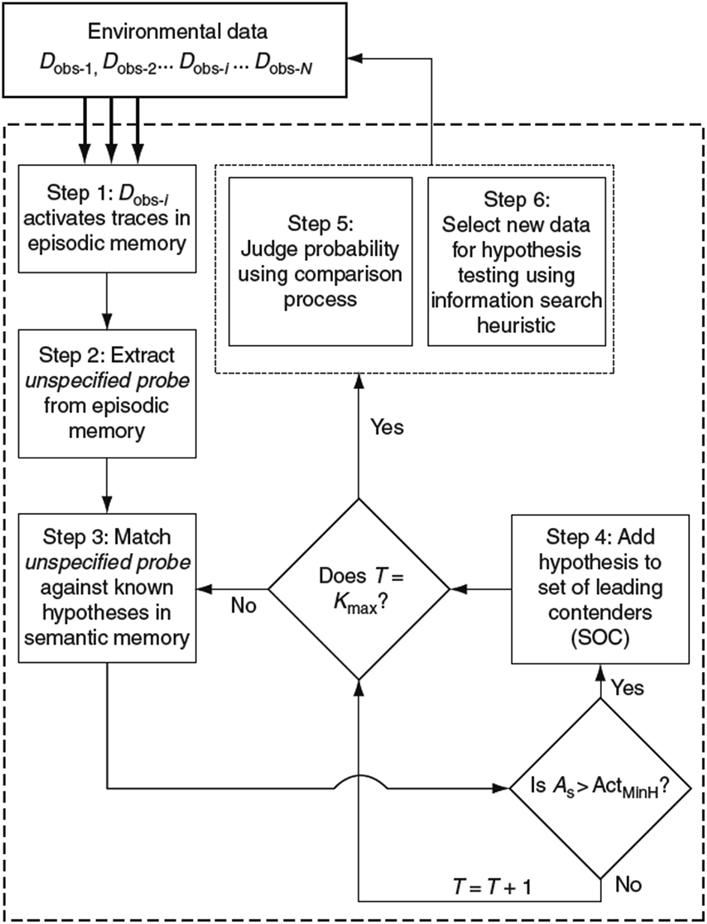
Figure 1. Flow diagram of the HyGene model of hypothesis generation, judgment, and testing. As, semantic activation of retrieved hypothesis; ActMinH, minimum semantic activation criterion for placement of hypothesis in SOC; T, total number of retrieval failures; and Kmax, number of retrieval failures allowed before terminating hypothesis generation.
HyGene rests upon three core principles. First, as underscored by the above examples, it is assumed that hypothesis generation represents a generalized case of cued recall. That is, the data observed in the environment (Dobs), which one would like to explain, act as cues prompting the retrieval of hypotheses from LTM. For instance, when a physician examines a patient, he/she uses the symptoms expressed by the patient as cues to related experiences stored in LTM. These cues activate a subset of related memories from which hypotheses are retrieved. These retrieval processes are indicated in Steps 1, 2, and 3 shown in Figure 1. Step 1 represents the environmental data being matched against episodic memory. In step 2, the instances in episodic memory that are highly activated by the environmental data contribute to the extraction of an unspecified probe representing a prototype of these highly activated episodic instances. This probe is then matched against all known hypotheses in semantic memory as indicated in Step 3. Hypotheses are then sampled into working memory based on their activations resulting from this semantic memory match.
As viable hypotheses are retrieved from LTM, they are placed in the Set of Leading Contenders (SOC) as demonstrated in Step 4. The SOC represents HyGene’s working memory construct to which HyGene’s second principle applies. The second principle holds that the number of hypotheses that can be maintained at one time is constrained by cognitive limitations (e.g., working memory capacity) as well as task characteristics (e.g., divided attention, time pressure). Accordingly, the more working memory resources that one has available to devote to the generation and maintenance of hypotheses, the greater the number of additional hypotheses can be placed in the SOC. Working memory capacity places an upper bound on the amount of hypotheses and data that one will be able to maintain at any point in time. In many circumstances, however, attention will be divided by a secondary task. Under such conditions this upper bound is reduced as the alternative task siphons resource that would otherwise allow the population of the SOC to its unencumbered capacity (Dougherty and Hunter, 2003a,b; Sprenger and Dougherty, 2006; Sprenger et al., 2011).
The third principle states that the hypotheses maintained in the SOC form the basis from which probability judgments are derived and provide the basis from which hypothesis testing is implemented. This principle underscores the function of hypothesis generation as a pre-decisional process underlying higher-level decision making tasks. The tradition of much of the prior research on probability judgment and hypothesis testing has been to provide the participant with the options to be judged or tested. HyGene highlights this as somewhat limiting the scope of the conclusions drawn from such procedures, as decision makers in real world tasks must generally generate the to-be-evaluated hypotheses themselves. As these higher-level tasks are contingent upon the output of the hypothesis generation process, any conclusions drawn from such experimenter-provided tasks are likely limited to such conditions.
Hypothesis Generation Processes in HyGene
The representation used by HyGene was borrowed from the multiple-trace global matching memory model MINERVA II (Hintzman, 1986, 1988) and the decision making model MINERVA-DM (Dougherty et al., 1999)1. Memory traces are represented in the model as a series of concatenated minivectors arbitrarily consisting of 1, 0, and −1 s where each minivector represents either a hypothesis or a piece of data (i.e., a feature of the memory). Separate episodic and semantic memory stores are present in HyGene which are made up of separate instances of such concatenated feature minivectors. While semantic memory contains prototypes of each disease, episodic memory contains individual traces for every experience the model acquires.
Retrieval is initiated when Dobs are matched against each of data minivectors in episodic LTM. This returns an LTM activation value for each trace in episodic LTM whereby greater overlap of features present in the trace and present in the Dobs results in greater activation. A threshold is applied to these episodic activation values such that only traces with long-term episodic activation values exceeding this threshold contribute to additional processing in the model. A prototype is extracted from this subset of traces which is then used as a cue to semantic memory for the retrieval of hypotheses. We refer to this cue as the unspecified probe. This unspecified probe is matched against all hypotheses in semantic memory which returns an activation value for each known hypothesis. The activation values for each hypothesis serve as input into retrieval through sampling via Luce’s choice rule. Generation proceeds in this way until a stopping rule is reached based on the total number of resamples of previously generated hypotheses (i.e., retrieval failures).
In its current form, the HyGene model is static with regards to data acquisition and utilization. The model receives all available data from the environment simultaneously and engages in only a single iteration of hypothesis generation. Given the static nature of the model, each piece of data used to cue LTM contributes equally to the recall process. Based on effects observed in related domains, however, it seems reasonable to suspect that all available data do not contribute equally in hypothesis generation tasks. For example, Anderson (1965), for instance, observed primacy weightings in an impression formation task in which attributes describing a person were revealed sequentially. Moreover, recent work has demonstrated biases in the serial position of data used to support hypothesis generation tasks (Sprenger and Dougherty, 2012). By ignoring differential use of available data in the generation process, HyGene, as previously implemented, ignores temporal dynamics influencing hypothesis generation tasks. In our view, what is needed is an understanding of working memory dynamics as data acquisition, hypothesis generation, and maintenance processes unfold and evolve over time in hypothesis generation tasks.
Dynamic Working Memory Buffer of the Context-Activation Model
The context-activation model of memory (Davelaar et al., 2005) is one of the most comprehensive models of memory recall to date. It is a dual-trace model of list memory accounting for a large set of data from various recall paradigms. Integral to the model’s behavior are the activation-based working memory dynamics of its buffer. The working memory buffer of the model dictates that the activations of the items in working memory systematically fluctuate over time as the result of competing processes described by Eq. 1.
Equation 1: activation calculation of the context-activation model
The activation level of each item, xi, is determined by the item’s activation on the previous time step, self-recurrent excitation that each item recycles onto itself α, inhibition from the other active items β, and zero-mean Gaussian noise N with standard deviation σ. Lastly, λ is the Euler integration constant that discretizes the differential equation. Note, however, that as this equation is applied in the present model, noise was only applied to an item’s activation value once it was presented to the model2.
Figure 2 illustrates the interplay between the competitive buffer dynamics in a noiseless run of the buffer when four pieces of data have been presented to the model successively. The activation of each datum rises as it is presented to the model and its bottom-up sensory input contributes to the activation. These activations are then dampened in the absence of bottom-up input as inhibition from the other items drive activation down. Self-recurrency can keep an item in the buffer in the absence of bottom-up input, but this ability is in proportion to the amount of competition from other items in the buffer. The line at 0.2 represents the model’s working memory threshold. In the combined dynamic HyGene model (utilizing the dynamics of the buffer to determine the weights of the data) this WM threshold separates data that are available to contribute to generation (>0.2) from those that will not (<0.2). That is, if a piece of data’s activation is greater than this threshold at the time of generation then it contributes to the retrieval of hypotheses from LTM and is weighted by its amount of activation. However, if, on the other hand, a piece of data falls below the WM threshold then it is weighted zero and as a result does not contribute to the hypothesis retrieval.
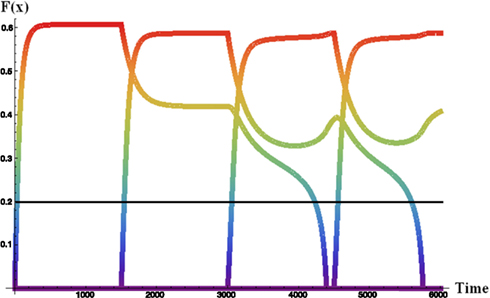
Figure 2. Noiseless activation trajectories for four sequentially received data in the dynamic activation-based buffer. Each item presented to the buffer for 1500 iterations. F(x) = memory activation.
The activations of individual items are sensitive the amount of recurrency (alpha) and inhibition (beta) operating in the buffer. Figure 3 demonstrates differential sensitivity to values of alpha and beta by item presentation serial position (1 through 4 in this case). This plot was generated by running the working memory buffer across a range of alpha and beta values for 50 runs at each parameter combination. Each panel presents the activation of an item in a four-item sequence after the final item has been presented. The activation levels vary with serial position, as shown by the differences among the four panels and with the value of the alpha and beta parameters, as shown within each panel. It can be seen that items one and two are mainly sensitive to the value of alpha. As alpha is increased, these items are more likely to maintain high activation values at the end of the data presentation. Item three demonstrates a similar pattern under low values of beta, but under higher values of beta this item only achieves modest activation as it cannot overcome the strong competition exerted by item one and two. Item four demonstrates a pattern distinct from the others. Like the previous three items the value of alpha limits the influence of beta up to a certain point. At moderate to high values of alpha, however, beta has a large impact on the activation value of the fourth item. At very low values of beta (under high alpha) this item is able to attain high activation, but quickly moves to very low activation values with modest increases in beta. These modest increases in beta are enough to make the competition from the three preceding items severe enough that the fourth item cannot overcome it.
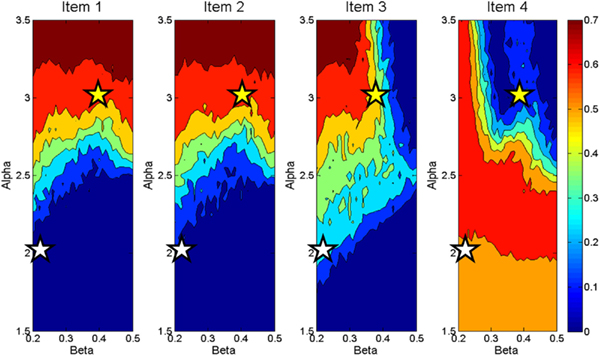
Figure 3. Contour plot displaying activation values of four items at end of data presentation across a range of Beta (X axes) and Alpha (Y axes) demonstrating differences in activation weight gradients produced by the working memory buffer.
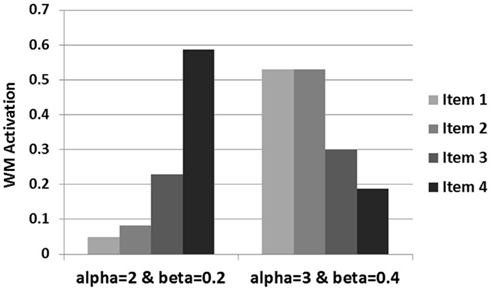
Taken as a whole, these plots describe differences in the activation gradients (profiles of activation across all four items) taken on by the buffer across various values of alpha and beta. For instance, the stars in the plot represent two different settings of alpha and beta which result in different activation gradients across the items. The settings of alpha = 2 and beta = 0.2 represented by the white stars, for instance, represent an instance of recency in the item activations. That is, the earlier items have only slight activation, the third item modest activation, and the last item is highly active relative to the others. Tracing the activations across the settings of alpha = 3 and beta = 0.4 represented by the yellow stars, on the other hand, shows a primacy gradient in which the earlier items are highly active, item three is less so, and the last item’s activation is very low. As will be seen, this pattern of activation values across different values of alpha and beta will become important for the computational account of Experiment 2. At a broader level, however, this plot shows possible activation gradients that can be obtained with the working memory buffer. In general, the activation gradients produce recency, but primacy gradients are also possible. Additionally, there are patterns of activation across items that the buffer cannot produce. For instance an inverted U shape of item activations would not result from the buffer’s processes.
These dynamics are theoretically meaningful as they produce data patterns which item-based working memory buffers (e.g., SAM; Raaijmakers and Shiffrin, 1981) cannot account for. For example, the buffer dynamics of the context-activation model dictate that items presented early in a sequence will remain high in activation (i.e., remain in working memory) under fast presentation rates. That is, under fast presentation rates the model predicts a primacy effect. Such effects have been observed in cued recall (Davelaar et al., 2005), free recall (Usher et al., 2008), and in a hypothesis generation task (Lange et al., 2012). Given these findings and the unique ability of the activation-based buffer to account for these effects, we have selected the activation-based buffer as our starting point for endowing the HyGene model with dynamic data acquisition processes.
A Dynamic Model of Hypothesis Generation: Endowing HyGene with Dynamic Data Acquisition
The competitive working memory processes of the context-activation model’s dynamic buffer provide a principled means for incorporating fine-grained temporal dynamics into currently static portions of HyGene. As a first step in incorporating the dynamic working memory processes of the working memory buffer, we use the buffer as a means to endow HyGene with dynamic data acquisition. In so doing, the HyGene architecture gains two main advantages. As pointed out by Sprenger and Dougherty (2012), any model of hypothesis generation seeking to account for situations in which data are presented sequentially needs a means of weighting the contribution of individual data. In using the buffer’s output as weights on the generation process we provide such a weighting mechanism. Additionally, as a natural consequence of utilizing the buffer to provide weights on data observed in the environment, working memory capacity constraints are imposed on the amount of data that can contribute to the generation process. As data acquisition was not a focus of the original instantiation of HyGene, capacity limitations in this part of the generation process were not addressed. However, recent data suggest that capacity constraints operating over data acquisition influence hypothesis generation (Lange et al., 2012). Lastly, at a less pragmatic level, this integration provides insight into the working memory dynamics unfolding throughout the data acquisition period thereby providing a window into processing occurring over this previously unmodeled epoch of the hypothesis generation process.
In order to endow HyGene with dynamic data acquisition, each run of the model begins with the context-activation model being sequentially presented with a series of items. In the context of this model these items are the environmental data the model has observed. The activation values for each piece of data at the end of the data acquisition period are then used as the weights on the generation process. A working memory threshold is imposed on the data activations such that data with activations falling below 0.2 are weighted with a zero rather than their actual activation value3. Specifically, the global memory match performed between the current Dobs and episodic memory in HyGene is weighted by the individual item activations in the dynamic working memory buffer (with the application of the working memory threshold). As each trace in HyGene’s episodic memory is made up of concatenated minivectors, each representing a particular data feature (e.g., fever vs. normal temperature), this weighting is applied in a feature by feature manner in the global matching process. From this point on in the model everything operates in accordance with the original instantiation of HyGene. That is, a subset of the highly activated traces in episodic memory is then used as the basis for the extraction of the unspecified probe. This probe is then matched against semantic memory from which hypotheses are serially retrieved into working memory for further processing.
In order to demonstrate how the integrated dynamic HyGene model responds to variation in the buffer dynamics a simulation was run in which alpha and beta were manipulated at the two levels highlighted above in Figure 3. In this simulation, the model was sequentially presented with four pieces of data. Only one of these pieces of data was diagnostic whereas the remaining three were completely non-diagnostic. An additional independent variable in this simulation was the serial position in which the diagnostic piece of data was placed. Displayed in Figure 4 is the model’s generation of the most likely hypothesis (i.e., the hypothesis suggested by the diagnostic piece of data) across that data’s serial position plotted by the two levels of alpha (recurrent activation) and beta (global lateral inhibition). What this plot demonstrates, in effect, is how the contribution of each data’s serial position to the model’s generation process is influenced by alpha and beta. As displayed on the left side of the plot, at the lower value of alpha there are clear recency effects. This is due to the buffer dynamics which under these settings predict an “early in – early out” cycling of items through the buffer as shown in Figure 2. The recency effects emerge as earlier data are less likely to reside in the buffer at the time of generation than later data. It should be noted that these parameters (alpha = 2, beta = 0.2) have been used in previous work accounting for the data from multiple list recall paradigms (Davelaar et al., 2005). By means of preview, we utilize the model’s prediction of recency under these standard parameter settings in guiding our expectations and the implementation of Experiment 1.
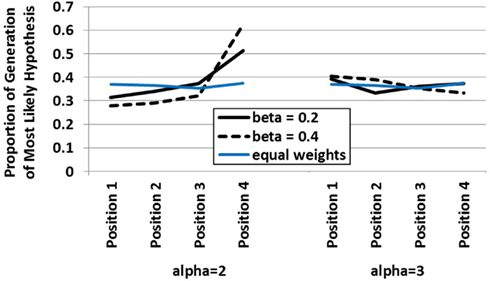
Figure 4. Influence of data serial position on the hypothesis generation behavior of the dynamic HyGene model at two levels of alpha and beta (and the performance of an equal weighted model in blue). Data plotted represents the proportion of simulation runs on which the most likely hypothesis was generated.
Under the higher value of alpha however, recency does not obtain. In this case, the serial position function flattens substantially as the increased recurrency allows more items to be available to contribute to generation at the end of the sequential data presentation. That is, even when the diagnostic datum appears early, it is maintained long enough in the buffer to be incorporated into the cue to episodic memory. Under the higher value of beta, we see this flattening out transition to a mild primacy gradient. This results from the increased inhibition making it more difficult for the later items to gain enough activation in working memory to contribute to the retrieval process. The greater amount of inhibition essentially renders the later items uncompetitive as they face more competition than they are able, in general, to overcome. Figure 4 additionally plots a line in blue demonstrating the generation level of the static HyGene model in which, rather than utilizing the weights produced by the buffer, each piece of data was weighted equally with a value of one. It can be seen that this line of performance is intermediate under low alpha, but somewhat consistent with the high alpha condition in which more data contribute to the generation process more regularly.
Experiment 1: Data Serial Position
Order effects are pervasive in investigations of memory and decision making (Murdock, 1962; Weiss and Anderson, 1969; Hogarth and Einhorn, 1992; Page and Norris, 1998). Such effects have even been obtained in a hypothesis generation task specifically. Although observed under different conditions than addressed by the present experiment, Sprenger and Dougherty, 2012, Experiments 1 and 3) found that people sometimes tend to generate hypotheses suggested by more recent cues.
The generalized order effect paradigm was developed by Anderson (1965, 1973) and couched within the algebra of information integration theory to derive weight estimates for individual pieces of information presented in impression formation tasks (e.g., adjectives describing a person). This procedure involved embedding a fixed list of information with a critical piece of information at various serial positions. The differences in the serial position occupied by the piece of critical information thus defined the independent variable, and given that all other information was held constant between conditions, the differences in final judgment were attributable to this difference in serial position. The present experiment represents an adaptation of this paradigm to assess the impact of data serial position on hypothesis generation.
Method
Participants
Seventy-two participants from the University of Oklahoma participated in this experiment for course credit.
Design and procedure
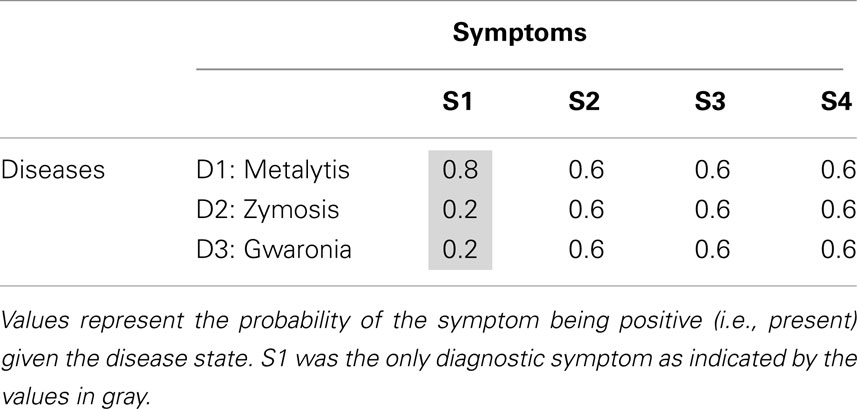
The design of Experiment 1 was a one-way within-subjects design with symptom order as the independent variable. The statistical ecology for this experiment, as defined by the conditional probabilities between the various diseases and symptoms, is shown in Table 1. Each of the values appearing in this table represents the probability that the symptom will be positive (e.g., fever) given the disease [where the complementary probability represents the probability of the symptom being negative (e.g., normal temperature) given the disease]. The only diagnostic (i.e., informative) symptom is S1 whereas the remaining symptoms, S2–S4, are non-diagnostic (uninformative).
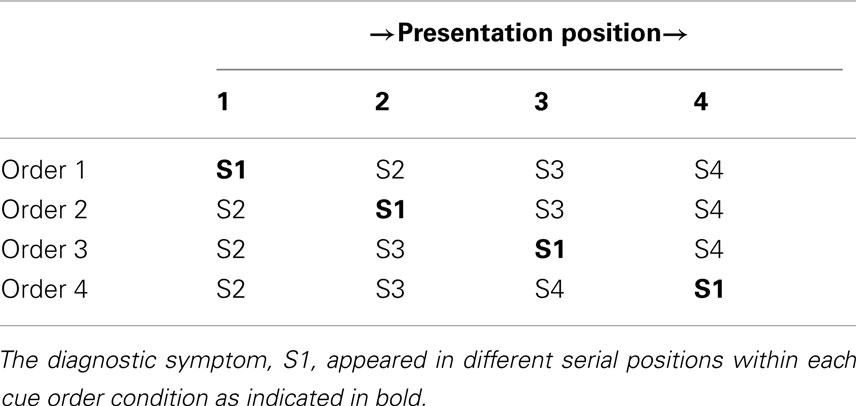
Table 2 displays the four symptom orders. Each of these orders was identical (S2 → S3 → S4) except for the position of S1 within them. All participants received and judged all four symptom orders.
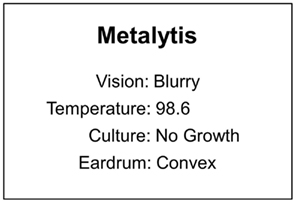
There were three main phases to the experiment, an exemplar training phase to learn the contingencies displayed in Table 1, a learning test to allow discrimination of participants that had learned in the training from those that had not, and an elicitation phase in which the symptom order manipulation was applied in a diagnosis task in which the patient’s symptoms were presented sequentially. The procedure began with the exemplar training phase in which a series of hypothetical pre-diagnosed patients was presented to the participant in order for them to learn, through experience, the contingencies between the diseases and symptoms. Each of these patients was represented by a diagnosis at the top of the screen and a series of test results (i.e., symptoms) pertaining to the columns of S1, S2, S3, and S4 as can be seen in the example displayed by Figure 5.
Each participant saw 50 exemplars of each disease for a total of 150 exemplars, thus making the base rates of the diseases equal. The specific results of these tests respected the probabilities in Table 1. The exemplars were drawn in blocks of 10 in which the symptoms would be drawn from the fixed distribution of symptom states given that disease. These symptom states were sampled independently without replacement from exemplar to exemplar. Therefore over the 10 exemplars presented in each individual disease block, the symptoms observed by the participant perfectly represented the distribution of symptoms for that disease. The disease blocks were randomly sampled without replacement which was repeated after the third disease block was presented. Thus, over the course of training the participants were repeatedly presented with the exact probabilities displayed in Table 1. Each exemplar appeared on the screen for a minimum of 5000 ms at which point they could continue studying the current exemplar or advance to the next exemplar by entering (on the keyboard) the first letter of the current disease exemplar. This optional prolonged studying made the training pseudo-self-paced. Prior to beginning the exemplar training phase, the participants were informed that they had an opportunity to earn a $5.00 gift card to Wal-Mart if they performed well enough in the task.
The diagnosis test phase directly followed exemplar training. This test was included to allow discrimination of participants that learned the contingencies between the symptoms and the diseases in the training phase4. The participants were presented with the symptoms of a series of 12 patients (four of each disease) as defined principally by the presence or absence of S1. That is, four of the patients had S1 present (suffering from Metalytis) and the remaining eight had S1 absent (four suffering from Zymosis and four suffering from Gwaronia). The remaining symptoms for the four patients of each disease were the same across the three diseases. On one patient these symptoms were all positive. On the remaining three patients one of these symptoms (S2, S3, S4) was selected without replacement to be absent while the other two were present. Note that as S2, S3, and S4 were completely non-diagnostic as the presence or absence of their symptoms does not influence the likelihood of the disease state. The disease likelihood is completely dependent on the state of S1. The symptoms of each of the patients were presented simultaneously on a single screen. The participants’ task was to correctly diagnose the patients with the disease of greatest posterior probability given their presenting symptoms. No feedback on this test performance was provided. As only S1 was diagnostic, the participants’ scores on this test were tallied based on their correct discrimination of each patient as Metalytis vs. Gwaronia or Zymosis. There were 12 test patients in this diagnosis test. If the participant scored greater than 60% on a diagnosis test they were awarded the gift card at the end of the experiment5. Prior to the end of the experiment, the participants were not informed of their performance on the diagnosis test. The participant then completed a series of arithmetic distracters in order to clear working memory of information processed during the diagnosis test phase. The distracter task consisted of a series of 15 arithmetic equations for which the correctness or incorrectness was to be reported (e.g., 15/3 + 2 = 7? Correct or Incorrect?). This distracter task was self-paced.
The elicitation phase then proceeded. First, the diagnosis task was described to the participants as follows: “You will now be presented with additional patients that need to be diagnosed. Each symptom of the patient will be presented one at a time. Following the last symptom you will be asked to diagnose the patient based on their symptoms. Keep in mind that sometimes the symptoms will help you narrow down the list of likely diagnoses to a single disease and other times the symptoms may not help you narrow down the list of likely diagnoses at all. It is up to you to determine if the patient is likely to be suffering from 1 disease, 2 diseases, or all 3 diseases. When you input your response make sure that you respond with the most likely disease first. You will then be asked if you think there is another likely disease. If you think so then you will enter the next most likely disease second. If you do not think there is another likely disease then just hit the Spacebar. You will then have the option to enter a third disease or hit the Spacebar in the same manner. To input the diseases you will use the first letter of the disease, just as you have been during the training and previous test.”
The participant was then presented with the first patient and triggered the onset of the stream of symptoms themselves when they were ready. Each of the four symptoms was presented individually for 1.5 s with a 250 ms interstimulus interval following each symptom. The order in which the symptoms were presented was determined by the order condition as shown in Table 2. Additionally, all of the patient symptoms presented in this phase positive (i.e., present, as the values in Table 2 represent the likelihood of the symptoms being present given the disease state). The Bayesian posterior probability of D1 was 0.67 whereas the posterior probability of either D2 or D3 was 0.17. Following the presentation of the last symptom the participant responded to two sets of prompts: the diagnosis prompts (as previously described in the instructions to the participants) and a single probability judgment of their highest ranked diagnosis. The probability judgment was elicited with the following prompt: “If you were presented 100 patients with the symptoms of the patient you just observed how many would have [INSERT HIGHEST RANKED DISEASE]?” The participant was then presented with the remaining symptom orders in the same manner with distracter tasks intervening between each trial. The first order received by each participant was randomized between participants and the sequence of the remaining three orders was randomized within participants. Eighteen participants received each symptom order first.
Hypotheses and Predictions
A recency effect was predicted on the grounds that more recent cues would be more active in working memory and contribute to the hypothesis generation process to a greater degree than less recent cues. Given that the activation of the diagnostic symptom (S1) in working memory at the time of generation was predicted to increase in correspondence with its serial position, increases in the generation of Metalytis were predicted to be observed with greater recency of S1. As suggested by Figure 2, the context-activation model, under parameters based on previous work in list recall paradigms (Davelaar et al., 2005) predicts this generally recency effect as later items are more often more active in memory at the end of list presentation. Correspondingly, decreases in the generation of the alternatives to Metalytis were expected with increases in the serial position of S1. This prediction stems directly from the buffer activation dynamics of the context-activation model.
Results
The main DV for the analyses was the discrete generation vs. non-generation of Metalytis as the most likely disease (i.e., first disease generated). All participants were included in the analyses regardless of performance in the diagnosis test phase and there were no differences in results based on learning. Carry-over effects were evident as demonstrated by a significant interaction between order condition and trial, χ2(3) = 12.68, p < 0.0166. In light of this, only the data from the first trial for each participant was subjected to further analysis as it was assumed that this was the only uncontaminated trial for each subject. Nominal logistic regression was used to examine the effect of data serial position on the generation of Metalytis (the disease with the greatest posterior probability given the data). A logistic regression contrast test demonstrated a trend for the generation of Metalytis as it was more often generated as the most likely hypothesis with increases in the serial position of the diagnostic data, χ2(1) = 4.32, p < 0.05. The number of hypotheses generated between order conditions did not differ, F(3,68) = 0.567, p = 0.64, , ranging from an average of 1.67–1.89 hypotheses. There were no differences in the probability judgments of Metalytis as a function of data order when it was generated as the most likely hypothesis (with group means ranging from 56.00 to 67.13), F(3,33) = 0.66, p = 0.58, .
Simulating Experiment 1
To simulate Experiment 1, the model’s episodic memory was endowed with the Disease-Symptom contingencies described in Table 1. On each trial, each symptom was presented to the buffer for 1500 iterations (mapping onto the presentation duration of 1500 ms) and the order of the symptoms was manipulated to match the symptom orders used in the experiment. 1000 iterations of the entire simulation were run for each condition7. The primary model output of interest was the first hypothesis generated on each trial. As is demonstrated in Figure 6, the model is able to capture the qualitative trend in the empirical data quite well. Although the rate of generation is slightly less for the model, the model clearly captures the recency trend as observed in the empirical data. Increased generation of the most likely hypothesis corresponded to the recency of the diagnostic datum. This effect is directly attributable to the buffer activation weights being applied to the generation process. Although Figure 10 will become more pertinent later, the left hand side of this figure demonstrates the recency gradient in the data activation weights produced by the model under these parameter settings. Inspection of the average weights for the first two data acquired show them to be below the working memory threshold of 0.2. Therefore, on a large proportion of trials the model relied on only the third and fourth piece of data (or just the last piece). This explains why the model performs around chance under the first two data orders and only deviates under orders three and four. Additionally, it should be noted that the model could provide a suitable quantitative fit to the empirical data by incorporating an assumption concerning the rate of guessing in the task or potentially by manipulating the working memory threshold. Although the aim of the current paper is to capture the qualitative effects evidenced in the data, future work may seek more precise quantitative fits.
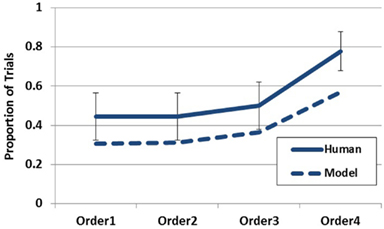
Figure 6. Empirical data (solid line) and model data (dashed line) for Experiment 1 plotting the probability of reporting D1 (Metalytis) as most likely across order conditions. Error bars represent standard errors of the mean.
Discussion
The primary prediction of the experiment was confirmed. The generation of the most likely hypothesis increased in correspondence with increasing recency of the diagnostic data (i.e., symptom). This finding clearly demonstrates that not all available data contribute equally to the hypothesis generation process (i.e., some data are weighted more heavily than others) and that the serial position of a datum can be an important factor governing the weight allocated to it in the generation process. Furthermore, these results are consistent with the notion that the data weightings utilized in the generation process are governed by the amount of working memory activation possessed by each datum.
There are, however, two alternative explanations for the present finding to consider that do not necessarily implicate unequal weightings of data in working memory as governing generation. First, it could be the case that all data resident in working memory at the time of generation were equally weighted, but that the likelihood of S1 dropping out of working memory increased with its distance in time from the generation prompt. Such a discrete utilization (i.e., all that matters is that data are in or out of working memory regardless of the activation associated with individual data) would likely result in a more gradual recency effect than seen in the data. Future investigations measuring working memory capacity could provide illuminating tests of this account. If generation is sensitive to only the presence or absence of data in working memory (as opposed to graded activations of the data in working memory) it could be expected that participants with higher capacity would be less biased by serial order (as shown in Lange et al., 2012) or would demonstrate the bias at a different serial position relative to those with lower capacity.
A second alternative explanation could be that the participants engaged in spontaneous rounds of generation following each piece of data as it was presented. Because the hypothesis generation performance was only assessed after the final piece of data in the present experiment, such “step-by-step” generation would result in stronger generation of Metalytis as the diagnostic data is presented closer to the end of the list. For instance, if spontaneous generation occurs as each piece of data is being presented, then when the diagnostic datum is presented first, there remains three more rounds of generation (based on non-diagnostic data in this case) that could obscure the generation of the initial round. As the diagnostic data moves closer to the end of the data stream the likelihood that that particular round of generation will be obscured by forthcoming rounds diminishes. It is likely that the present data represents a mixture of participants that engaged in such spontaneous generation and those that did not engage in generation until prompted. This is likely the reason for the quantitative discrepancy between the model and empirical data. Future investigations could attempt to determine the likelihood that a participant will engage in such spontaneous generation and the conditions making it more or less likely.
The probability judgments observed in the present experiments did not differ across order conditions. Because the probability judgments were only elicited for the highest ranked hypothesis, the conditions under which the probability judgments were collected were highly constrained. It should be noted that the focus of the present experiment was to address generation behavior and the collection of the judgment data was ancillary. An independent experiment manipulating serial order in the manner done here and designed explicitly for the examination of judgment behavior would be useful for examining the influence of specific data serial positions on probability judgments. This would be interesting as HyGene predicts the judged probability of a hypothesis to be directly influenced by the relative support for the hypotheses currently in working memory. In so far as serial order influences the hypotheses generated into working memory, effects of serial position on probability judgment are likely to be observed as well.
The goal of Experiment 1 was to determine how relative data serial position affects the contribution of individual data to hypothesis generation processes. It was predicted that data presented later in the sequence would be more active in working memory and would thereby contribute more to the generation process based on the dynamics of the context-activation buffer. Such an account predicts a recency profile for the generation of hypotheses from LTM. This effect was obtained and is well-captured by our model in which such differences in the working memory activation possessed by individual data govern the generation process. Despite these positive results, however, the specific processes underlying this data are not uniquely discernible in the present experiment as the aforementioned alternative explanations likely predict similar results. Converging evidence for the notion that data activation plays a governing role in the generation process should be sought.
Experiment 2: Data Maintenance and Data Consistency
When acquiring information from the world that we may use as cues for the generation of hypotheses we acquire these cues in variously sized sets. In some cases we might receive several pieces of environmental data over a brief period, such as when a patient rattles off a list of symptoms to a physician. At other times, however, we receive cues in isolation across time and generate hypotheses based on the first cue and update this set of hypotheses as further data are acquired, such as when an underlying cause of car failure reveals itself over a few weeks. Such circumstances are more complicated as additional processes come into play as further data are received and previously generated hypotheses are evaluated in light of the new data. Hogarth and Einhorn (1992) refer to this task characteristic as the response mode.
In the context of understanding dynamic hypothesis generation this distinction is of interest as it contrasts hypothesis generation following the acquisition of a set of data with a situation in which hypotheses are generated (and updated or discarded) while further data is acquired and additional hypotheses generated. An experiment manipulating this response mode variable in a hypothesis generation task was conducted by Sprenger and Dougherty, 2012, Experiment 3) in which people hypothesized about which psychology courses were being described by various keywords. The two response modes are step-by-step (SbS), in which a response is elicited following each piece of incoming data, and end-of-sequence (EoS), in which a response is made only after all the data has been acquired as a grouped set. Following the last piece of data, the SbS conditions exhibited clear recency effects whereas EoS conditions, on the other hand, did not demonstrate reliable order effects. A careful reader may notice a discrepancy between the lack of order effects in their EoS condition and the recency effect in the present Experiment 1 (which essentially represents an EoS mode condition). In the Sprenger and Dougherty experiment, the participants received nine cues from which to generate hypotheses as opposed to the four cues in our Experiment 1. As the amount of data in their experiment exceeded working memory capacity (more severely) it is likely that the cue usage strategies utilized by the participants differed between the two experiments. Indeed, it is important to gain a deeper understanding of such cue usage strategies in order to develop a better understanding of dynamic hypothesis generation.
The present experiment compared response modes to examine differences between data maintenance prior to generation (EoS mode) and generation that does not encourage the maintenance of multiple pieces of data (SbS mode). Considered in another light, SbS responding can be thought of as encouraging an anchoring and adjustment process where the set of hypotheses generated in response to the first piece of data supply the set of beliefs in which forthcoming data may be interpreted. The EoS condition, on the other hand, does not engender such belief anchoring as generation is not prompted until all data have been observed. As such, the SbS conditions provide investigation of a potential propensity to discard previously generated hypotheses and/or generate new hypotheses in the face of inconsistent data.
Method
Participants
One hundred fifty-seven participants from the University of Oklahoma participated in this experiment for course credit.
Design and procedure
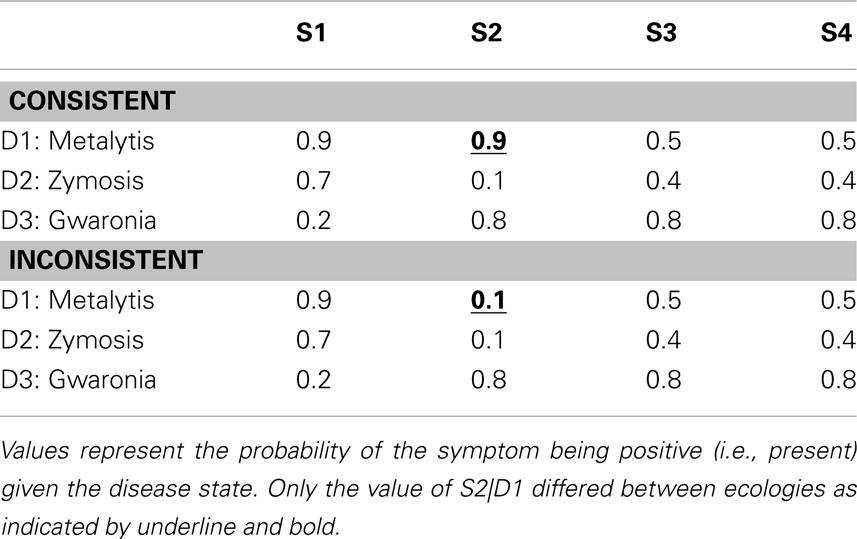
As previously mentioned, the first independent variable was the timing of the generation and judgment promptings provided to the participant as dictated by the response mode condition. This factor was manipulated within-subject. The second independent variable, manipulated between-subjects, was the consistency of the second symptom (S2) with the hypotheses likely to be entertained by the participant following the first symptom. This consistency or inconsistency was manipulated within the ecologies learned by the participants as displayed in Table 3. In addition, this table demonstrates the temporal order in which the symptoms were presented in the elicitation phase of this experiment (i.e., S1 → S2 → S3 → S4). Note that only positive symptom (i.e., symptom present) states were presented in the elicitation phase. The only difference between the ecologies was the conditional probability of S2 being positive under D1. This probability was 0.9 in the “consistent ecology” and 0.1 in the “inconsistent ecology.” Given that S1 should prompt the generation of D1 and D2, this manipulation of the ecology can be realized to govern the consistency of S2 with the hypothesis(es) currently under consideration following S1. This can be seen in Table 4 displaying the Bayesian posterior probabilities for each disease following each symptom. Seventy-nine participants were in the consistent ecology condition and 78 participants were in the inconsistent ecology condition. Response mode was counter-balanced within ecology condition.
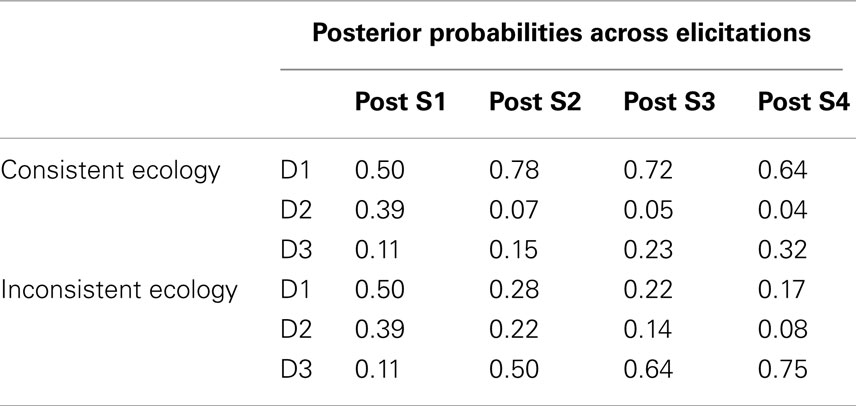
Table 4. Bayesian posterior probabilities as further symptoms are acquired within each ecology of Experiment 2.
The procedure was much like that of Experiment 1: exemplar training to learn the probability distributions, a test to verify learning (for which a $5.00 gift card could be earned for performance greater than 60%)8, and a distractor task prior to elicitation. The experiment was again cast in terms of medical diagnosis where D1, D2, and D3 represented fictitious disease states and S1–S4 represented various test results (i.e., symptoms).
There were slight differences in each phase of the procedure however. The exemplars presented in the exemplar training phase of were simplified and consisted of the disease name and a single test result (as opposed to all four). This change was made in an effort to enhance learning. Exemplars were blocked by disease such that a disease was selected at random without replacement. For each disease the participant would be presented with 40 exemplars selected at random without replacement. Therefore over the course of these 40 exemplars the entire (and exact) distribution of symptoms would be presented for that disease. This was then done for the remaining two diseases and the entire process was repeated two more times. Therefore the participant observed 120 exemplars per disease (inducing equal base rates for each disease) and observed the entire distribution three times. Each exemplar was again pseudo-self-paced and displayed on the screen for 1500 ms per exemplar prior to the participant being able to proceed to the next exemplar by pressing the first letter of the disease. Patient cases in the diagnosis test phase presented with only individual symptoms as well. Each of the eight possible symptom states were individually presented to the participants and they were asked to report the most likely disease given that particular symptom. Diseases with a posterior probability greater than or equal to 0.39 were tallied as correct responses.
In the elicitation phase, the prompts for hypothesis generation were the same as those used in Experiment 1, but the probability judgment prompt differed slightly. The judgment prompt used in the present experiment was as follows: “How likely is it that the patient has [INSERT HIGHEST RANKED DISEASE]? (Keep in mind that an answer of 0 means that there is NO CHANCE that the patient has [INSERT HIGHEST RANKED DISEASE] and that 100 means that you are ABSOLUTELY CERTAIN that the patient has [INSERT HIGHEST RANKED DISEASE].) Type in your answer from 1 to 100 and press Enter to continue.” Probability judgments were taken following each generation sequence in the SbS condition (i.e., there were four probability judgments taken, one for the disease ranked highest on each round of generation).
Hypotheses and predictions
The general prediction for the end-of-sequence response mode was that recency would be demonstrated in both ecologies as the more recent symptoms should contribute more strongly to the generation process as seen in Experiment 1. Therefore, greater generation of D3 relative to the alternatives was expected in both ecologies. The focal predictions for the SbS conditions concerned the generation behavior following S2. It was predicted that participants in the consistent ecology would generate D1 to a greater extent than those in the inconsistent ecology who were expected to purge D1 from their hypothesis set in response to its inconsistency with S2. It was additionally predicted that those in the inconsistent ecology would generate D3 to a greater extent at this point than those in the consistent ecology as they would utilize S2 to repopulate working memory with a viable hypothesis.
Results
As no interactions with trial order were detected, both trials from each subject were used in the present analyses and no differences in results were found with differences in learning. The main dependent variable analyzed for this experiment was the hypothesis generated as most likely on each round of elicitation. All participants were included in the analyses regardless of performance in the diagnosis test phase. In order to test if a recency effect obtained following the last symptom (S4), comparisons between the rates of generation of each disease were carried out within each of the four ecology-by-response mode conditions. Within the step-by-step conditions the three diseases were generated at different rates in the consistent ecology according to Cochran’s Q Test, χ2(2) = 9.14, p < 0.05, but not in the inconsistent ecology χ2(2) = 1, p = 0.61. In the end-of-sequence conditions, significant differences in generation rates were revealed in both the consistent ecology, χ2(2) = 17.04, p < 0.001, and the inconsistent ecology, χ2(2) = 7.69, p < 0.05.
As D2 was very unlikely in both ecologies the comparison of interest in all cases is between D1 and D3. This pairwise comparison was carried out within each of the ecology-by-response mode conditions and reached significance only in the EoS mode in the consistent ecology, χ2(1) = 6.79, p < 0.01, as D1 was generated to a greater degree than D3 according to Cochran’s Q Test. These results, displayed in Figure 7, demonstrate the absence of a recency effect in the present experiment. This difference between the EoS and SbS ecology is additionally observed by comparing rates of D1 generation across the entire design demonstrating a main effect of ecology, χ2(1) = 8.87, p < 0.01, but no effect of mode, χ2(1) = 0.987, p = 0.32, and no interaction, χ2(1) = 0.554, p = 0.457.
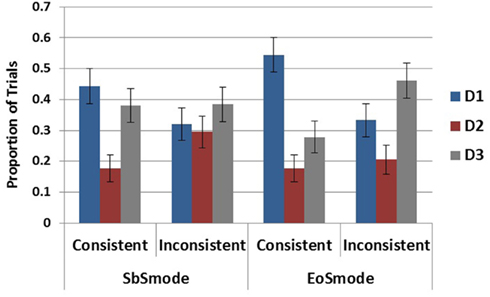
Figure 7. Proportion of generation for each disease by response mode and ecology conditions. Error bars represent standard errors of the mean.
To test the influence of the inconsistent cue on the maintenance of D1 (the most likely disease in both ecologies following S1) in the SbS conditions, elicitation round (post S1 and post S2) was entered as an independent variable with ecology and tested in a 2 × 2 logistic regression. As plotted in Figure 8, this revealed a main effect of elicitation round, χ2(1) = 10.51, p < 0.01, an effect of ecology, χ2(1) = 6.65, p < 0.05, and a marginal interaction, χ2(1) = 3.785, p = 0.052. When broken down by ecology it is evident that the effect of round and the marginal interaction were due to the decreased generation of D1 following S2 in the inconsistent ecology, χ2(1) = 10.51, p < 0.01, as there was no difference between rounds in the consistent ecology, χ2(1) = 0.41, p = 0.524.
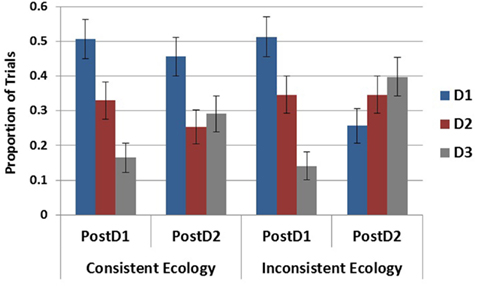
Figure 8. Proportion of generation for each disease within the SbS condition following S1 and S2. Error bars represent standard errors of the mean.
This same analysis was done with D3 to examine potential differences in its rate of generation over these two rounds of generation. This test revealed a main effect of elicitation round, χ2(1) = 12.135, p < 0.001, but no effect of ecology, χ2(1) = 1.953, p = 0.162, and no interaction, χ2(1) = 1.375, p = 0.241.
Simulating Experiment 2
To model the EoS conditions, the model was presented all four symptoms in sequence and run in conditions in which the model was endowed with either the consistent or inconsistent ecology. This simulation was run for 1000 iterations in each condition. As is intuitive from the computational results of Experiment 1, when the model is run with the same parameters utilized in the previous simulation it predicts greater generation for D3 in both ecologies (i.e., recency) which was not observed in the present experiment. However, the model is able to capture the data of the EoS mode quite well by increasing the amount of recurrent activation that each piece of data recycles onto itself (alpha parameter) and the amount of lateral inhibition applied to each piece of data (beta parameter) as it is acquired prior to generation. These results appear alongside the empirical results in Figure 9. Although the model is able the capture the qualitative pattern in the data in the inconsistent ecology reasonably well with either set of parameters, the model produces divergent results under the two alpha and beta levels in the consistent ecology. Only when recurrency and inhibition are increased does the model capture the data from both ecologies.
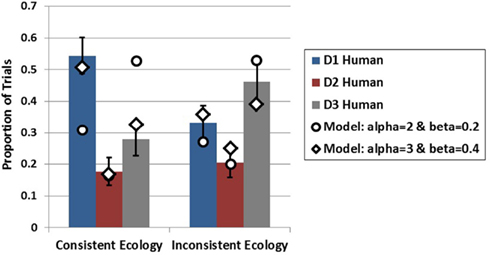
Figure 9. Empirical data (bars) from Experiment 2 for the EoS conditions in both ecologies plotted with model data (diamonds and circles) at two levels of alpha and beta. Error bars represent standard errors of the mean.
Examination of how the data activations are influenced by the increased alpha and beta levels reveals the underlying cause for this difference in generation. As displayed in Figure 10, there is a steep recency gradient for the data activations under alpha = 2 and beta = 0.2 (parameters from Experiment 1), but there is a markedly different pattern of activations under alpha = 3 and beta = 0.49. Most notably, these higher alpha and beta levels cause the earlier pieces of data to reach high levels of activation which then suppress the activation levels of later data. This is due to the competitive dynamics of the buffer which restrict rise of activation for later items under high alpha and beta values resulting in a primacy gradient in the activation values as opposed to the recency gradient observed under the lower values.
To capture the SbS conditions for generation following S1 and generation following S2, the model was presented with different amounts of data on different trials. Specifically, the model was presented with S1 only, capturing the situation in which only the first piece of data had been received, or the model was presented with S1 and S2 successively in order to capture the SbS condition following the second piece of data. This was done for both ecologies in order to assess the effects of data inconsistency on the model’s generation behavior10. As can be seen in Figure 11 the model is able to capture the empirical data quite well following S1 while providing a decent, although imperfect, account of the post S2 data as well11. Focally, the model as implemented captures the influences of S2 on the hypothesis sets generated in response to S1. Following S2 in the inconsistent ecology D1 decreases substantially capturing its purging from working memory. Additionally, the increases in the generation of D3 are present in both ecologies.
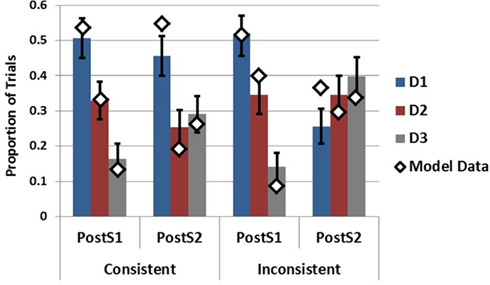
Figure 11. Empirical data (bars) from Experiment 2 in the SbS conditions following S1 and S2 plotted with model data (diamonds). Error bars represent standard errors of the mean.
Discussion
The present experiment has provided a window into two distinct processing dynamics. The first dynamic under investigation was how generation differs when based on the acquisition of a set of data (EoS condition) vs. when each piece of data is acquired in isolation (SbS condition). The generation behavior between these conditions was somewhat similar overall, as neither D1 nor D3 dominated generation in three of the four conditions. The EoS consistent ecology condition, however, was clearly dominated by D1. This result obtained in contrast to the prediction of recency in the EoS conditions, which would have been evidenced by higher rankings for D3 (for both ecologies).
The divergence between the recency effect in Experiment 1 and the absence of recency effect in the EoS conditions of Experiment 2 is surprising. In order for the model to account for the amelioration of the recency effect an adjustment was made to the alpha and beta parameters governing how much activation each piece of data is able to recycle onto itself and the level of competition thereby eliminating the recency gradient in the activations. Moreover, the last piece of data did not contribute as often or as strongly to the cue to LTM under these settings. Therefore, rather than a recency effect, the model suggests a primacy effect whereby the earlier cues contributed more to generation than the later cues. As we have not manipulated serial order in the present experiment, it is difficult to assert a primacy effect based on the empirical data alone. The model’s account of the current data, however, certainly suggests that a primacy gradient is needed to capture the results. Additionally, a recent experiment in a similar paradigm utilizing an EoS response mode demonstrated a primacy effect in a diagnostic reasoning task (Rebitschek et al., 2012) suggesting that primacy may be somewhat prevalent under EoS data acquisition situations.
As for why the earlier cues may have enjoyed greater activation in the present experiment relative to Experiment 1 we need to consider the main difference between these paradigms. The largest difference was that in the present experiment each piece of data present in the ecology carried a good amount of informational value whereas in Experiment 1 80% of the data in the ecology was entirely non-diagnostic. It is possible that this information rich vs. information scarce ecological difference unintentionally led to a change in how the participants allocated their attention over the course of the data streams between the two experiments. As all of the data in Experiment 2 was somewhat useful, the participants may have used this as a cue to utilize as much of the information as possible thereby rehearsing/reactivating the data as much as possible prior to generation. In contrast, being in the information scarce ecology of Experiment 1 would not have incentivized such maximization of the data activations for most of the data. Future experiments could address how the complexity of the ecology might influence dynamic attentional allocation during data acquisition.
The second dynamic explored was how inconsistent data influences the hypotheses currently under consideration. In the step-by-step conditions it was observed that a previously generated hypothesis was purged from working memory in response to the inconsistency of a newly received cue. This can be viewed as consistent with an extension of the consistency checking mechanism employed in the original HyGene framework. The present data suggests that hypotheses currently under consideration are checked against newly acquired data and are purged in accordance with their degree of (in)consistency. This is different from, although entirely compatible with, the operation of the original consistency checking mechanism operating over a single round of hypothesis generation. The consistency checking operation within the original version of HyGene checks each hypothesis retrieved into working memory for its consistency with the data used as a cue to its retrieval as the SOCs is populated. The consistency checking mechanism exposed in the present experiment, however, suggests that people check the consistency of newly acquired data against hypotheses generated from previous rounds of generation as well. If the previously generated hypotheses fall below some threshold of agreement with the newly acquired data they are purged from working memory. Recent work by Mehlhorn et al. (2011) also investigated the influence of consistent and inconsistent cues on the memory activation of hypotheses. They utilized a clever adaptation of the lexical decision task to assess the automatic memory activation of hypotheses as data were presented and found memory activation sensitivity to the consistency of the data. As the present experiment utilized overt report, these findings complement one another quite well as automatic memory activation can be understood as a precursor to the generation of hypotheses into working memory. The present experiment additionally revealed that S2 was used to re-cue LTM as evidenced by increased generation of D3 following S2. In contrast to the prediction that this would occur only in the inconsistent ecology, this recuing was observed in both ecologies. Lastly, although the model as currently implemented represents a simplification of the participant’s task in the SbS conditions, it was able to capture these effects.
General Discussion
This paper presented a model of dynamic data acquisition and hypothesis generation which was then used to account for data from two experiments investigating three consequences of hypothesis generation being extended over time. Experiment 1 varied the serial position of a diagnostic datum and demonstrated a recency effect whereby the hypothesis implied by this datum was generated more often when the datum appeared later in the data stream. Experiment 2 examined how generation might differ when it is based on isolated data acquired one at a time (step-by-step response mode) vs. when generation is based upon the acquisition of the entire set of data (end-of-sequence response mode). Secondly, the influence of an inconsistent cue (conflicting with hypotheses suggested by the first datum) was investigated by manipulating a single contingency of the data-hypothesis ecology in which the participants were trained. It was found that the different response modes did not influence hypothesis generation a great deal as the two most likely hypotheses were generated at roughly the same rates in most cases. The difference that was observed however was that the most likely hypothesis was favored in the EoS condition within the consistent ecology. This occurred in contrast to the prediction of recency for both EoS conditions, thereby suggesting that the participants weighted the data more equally than in Experiment 1 or perhaps may have weighted the earlier cues slightly more heavily. Data from the SbS conditions following the acquisition of the inconsistent cue revealed that this cue caused participants to purge a previously generated hypothesis from working memory that was incompatible with the newly acquired data. Moreover, this newly acquired data was utilized to re-cue LTM. Interestingly, this re-cueing was demonstrated in both ecologies and was therefore not contingent on the purging of hypotheses from working memory.
Given that the EoS conditions of Experiment 2 were procedurally very similar to the procedure used in Experiment 1 it becomes important to reconcile their contrasting results. As discussed above, the main factor distinguishing these conditions was the statistical ecology defining their respective data-hypothesis contingencies. The ecology of the first experiment contained mostly non-diagnostic data whereas each datum in the ecology utilized in Experiment 2 carried information as to the relative likelihood of each hypothesis. It is possible that this difference of relative information scarcity and information richness influenced the processing of the data streams between the two experiments. In order to capture the data from Experiment 2 with our model, the level of recurrent activation recycled by each piece of data was adjusted upwards and lateral inhibition increased thereby giving the early items a large processing advantage over the later pieces of data. Although post hoc, this suggests the presence of a primacy bias. It is then perhaps of additional interest to note that the EoS results resemble the SbS results following D2 and this is particularly so within the consistent ecology. This could be taken to suggest that those in the EoS condition were utilizing the initial cues more greatly than the later cues. Fisher (1987) suggested that people tend to use a subset of the pool of provided data and estimated that people generally use two cues when three are available and three cues when four are available. Interestingly the model forwarded in the present paper provides support for this estimate as it used three of the four available cues in accounting for the EoS data in Experiment 2. While the utilization of three as opposed to four data could be understood as resulting from working memory constraints, the determinants of why people would fail to utilize three pieces of data when only three data are available is less clear. Future investigation of the conditions under which people underutilize available data in three and four data-hypothesis generation problems could be illuminating for the working memory dynamics of these tasks.
It is also important to compare the primacy effect in the EoS conditions with the results of Sprenger and Dougherty (2012) in which the SbS conditions revealed recency (Experiments 1 and 3) and no order effects were revealed in the EoS conditions (only implemented in Experiment 3). As for why the SbS results of the present experiment do not demonstrate recency as in their Experiments 1 and 3 is unclear. The ecologies used in these experiments were quite different, however, and it could be the case that the ecology implemented in their experiment was better able to capture this effect. Moreover, they explicitly manipulated data serial order and it was through this manipulation that the recency effect was observed. As serial order was not manipulated in the present experiment we did not have the opportunity to observe recency in the same fashion and instead relied on relative rates of generation given one data ordering. Perhaps the manipulation of serial order within the present ecology would uncover recency as well.
In comparing the present experiment to the procedure of Sprenger and Dougherty’s Experiment 3 a clearer reason for diverging results is available. In their experiment, the participants were presented with a greater pool of data from which to generate hypotheses, nine pieces in total. Participants in the present experiment, on the other hand, were only provided with four cues. It is quite possible that people’s strategies for cue usage would differ between these conditions. Whereas the present experiment provided enough data to fill working memory to capacity (or barely breach it), Sprenger and Dougherty’s experiment provided an abundance of data thereby providing insight into a situation in which the data could not be held in working memory at once. It is possible that the larger pool of data engendered a larger pool of strategies to be employed than in the present study. Understanding the strategies that people employ and the retrieval plans developed under such conditions (Raaijmakers and Shiffrin, 1981; Gillund and Shiffrin, 1984; Fisher, 1987) as well as how these processes contrast with situations in which fewer cues are available is a crucial aspect of dynamic memory retrieval in need of better understanding.
The model presented in the present work represents a fusion of the HyGene model (Thomas et al., 2008) with the activation dynamics of the context-activation model of memory (Davelaar et al., 2005). As the context-activation model provides insight into the working memory dynamics underlying list memory tasks, it provides a suitable guidepost for understanding some of the likely working memory dynamics supporting data acquisition and hypothesis generation over time. The present model acquires data over time whose activations systematically ebb and flow in concert with the competitive buffer dynamics borrowed from the context-activation model. The resulting activation levels possessed by each piece of data are then used as weights in the retrieval of hypotheses from LTM. In addition to providing an account of the data from the present experiments this model has demonstrated further usefulness by suggesting potentially fruitful areas of future investigation.
The modeling presented here represents the first step of a work in progress. As we are working toward a fully dynamical model of data acquisition, hypothesis generation, maintenance, and use in decision making tasks, additional facets clearly still await inclusion. Within the current implementation of the model it is only the environmental data that are subject to the working memory activation dynamics of the working memory buffer. In future work, hypotheses generated into working memory (HyGene’s SOCs) will additionally be sensitive to these dynamics. This will provide us with the means of fully capturing hypothesis maintenance dynamics (e.g., step-by-step generation) that the present model ignores. Moreover, by honoring such dynamic maintenance processes we may be able to address considerations of what information people utilize at different portions of a hypothesis generation task. For instance, when data is acquired over long lags (e.g., minutes), it is unclear what information people use to populate working memory with hypotheses at different points in the task. If someone is reminded of the diagnostic problem they are trying to solve, do they recall the hypotheses directly (e.g., via contextual retrieval) or do they sometimes recall previous data to be combined with new data and re-generate the current set of hypotheses? Presumably both strategies are prevalent, but the conditions under which they are more or less likely to manifest is unclear. It is hoped that this more fully specified model may provide insight into situations favoring one over the other.
As pointed out by Sprenger and Dougherty (2012) a fuller understanding of hypothesis generation dynamics will entail learning about how working memory resources are dynamically allocated between data and hypotheses over time. One-way that this could be achieved in the forthcoming model would be to have two sets of information available for use at any given time, one of which would be the set of relevant data (RED) and the other would be the SOC hypotheses. The competitive dynamics of the buffer could be brought to bear between these sets of items by allowing them to inhibit one another, thereby instantiating competition between the items in these sets for the same limited resource. Setting up the model in this or similar manners would be informative for addressing dynamic working memory tradeoffs that are struck between data and hypotheses over time.
In addition, this more fully elaborated model could inform maintenance dynamics as hypotheses are utilized to render judgments and decisions. The output of the judgment and decision processes could cohabitate the working memory buffer and its maintenance and potential influence on other items’ activations could be gauged across time. Lastly, as the model progresses in future work it will be important and informative to examine the model’s behavior more broadly. For the present paper we have focused on the first hypothesis generated in each round of generation. The generation behavior of people and the model of course furnishes more than one hypothesis into working memory. Further work with this model has the potential to provide a richer window into hypothesis generation behavior by taking a greater focus on the full hypothesis sets considered over time.
Developing an understanding of the temporal dynamics governing the rise and fall of beliefs over time is a complicated problem in need of further investigation and theoretical development. This paper has presented an initial model of how data acquisition dynamics influence the generation of hypotheses from LTM and two experiments considering three distinct processing dynamics. It was found that the recency of the data, sometimes but not always, biases the generation of hypotheses. Additionally, it was found that previously generated hypotheses are purged from working memory in light of new data with which they are inconsistent. Future work will develop a more fully specified model of dynamic hypothesis generation, maintenance, and use in decision making tasks.
Conflict of Interest Statement
The authors declare that the research was conducted in the absence of any commercial or financial relationships that could be construed as a potential conflict of interest.
Footnotes
- ^For a more thorough treatment of HyGene’s computational architecture please see Thomas et al. (2008) or Dougherty et al. (2010).
- ^This was done from the pragmatic view that the buffer cannot apply noise to an item representation that does not yet exist in the environment or in the system. A full and systematic analysis of how this assumption affects the behavior of the buffer has not been carried out as of yet, but in the context of the current simulations preliminary analysis suggests that this change affects the activation values produced by the buffer only slightly.
- ^This working memory threshold has been carried over from the context-activation model as it proved valuable for that model’s account of data from a host of list recall paradigms (Davelaar et al., 2005).
- ^Previous investigations in our lab utilizing exemplar training tasks have demonstrated variation in conclusions drawn from results conditionalized on such learning data against entire non-conditionalized data set. Therefore including this learning test allows us a check on the presence of such discrepancies in addition to obtaining data that may inform how greater or lesser learning influences the generation process.
- ^Thirty-five participants (48%) exceeded this 60% criterion.
- ^This carry-over effect was not entirely surprising as the same symptom states were presented for every patient and our manipulation of serial order was likely transparent on later trials.
- ^The parameters used for this simulation were the following. Original HyGene parameters: L = 0.85, Ac = 0.1, Phi = 4, KMAX = 8. Context-activation model parameters: Alpha = 2.0, Beta = 0.2, Lambda = 0.98, Delta = 1. Note, these parameters were based on values utilized in previous work and were not chosen based on fitting the model to the current data.
- ^Eighty-eight participants (56%) exceeded this 60% criterion.
- ^These parameter values were based on a grid search to examine the neighborhood of values capturing the qualitative patterns in the data and not based on a quantitative fit to the empirical data.
- ^This is, of course, a simplification of the participant’s task in the SbS condition. This is addressed in the general discussion.
- ^This simulation was run with alpha = 3 and beta = 0.4.
References
Anderson, N. H. (1965). Primacy effects in personality impression formation using a generalized order effect paradigm. J. Pers. Soc. Psychol. 2, 1–9.
Cooper, R. P., Yule, P., and Fox, J. (2003). Cue selection and category learning: a systematic comparison of three theories. Cogn. Sci. Q. 3, 143–182.
Davelaar, E. J., Goshen-Gottstein, Y., Ashkenazi, A., Haarmann, H. J., and Usher, M. (2005). The demise of short term memory revisited: empirical and computational investigations of recency effects. Psychol. Rev. 112, 3–42.
Dougherty, M. R. P., Gettys, C. F., and Ogden, E. E. (1999). A memory processes model for judgments of likelihood. Psychol. Rev. 106, 180–209.
Dougherty, M. R. P., and Hunter, J. E. (2003a). Probability judgment and subadditivity: the role of WMC and constraining retrieval. Mem. Cognit. 31, 968–982.
Dougherty, M. R. P., and Hunter, J. E. (2003b). Hypothesis generation, probability judgment, and working memory capacity. Acta Psychol. (Amst.) 113, 263–282.
Dougherty, M. R. P., Thomas, R. P., and Lange, N. (2010). Toward an integrative theory of hypothesis generation, probability judgment, and hypothesis testing. Psychol. Learn. Motiv. 52, 299–342.
Fisher, S. D. (1987). Cue selection in hypothesis generation: Reading habits, consistency checking, and diagnostic scanning. Organ. Behav. Hum. Decis. Process. 40, 170–192.
Gillund, G., and Shiffrin, R. M. (1984). A retrieval model for both recognition and recall. Psychol. Rev. 91, 1–67.
Hintzman, D. L. (1986). “Schema Abstraction” in a multiple-trace memory model. Psychol. Rev. 93, 411–428.
Hintzman, D. L. (1988). Judgments of frequency and recognition memory in a multiple-trace memory model. Psychol. Rev. 95, 528–551.
Hogarth, R. M., and Einhorn, H. J. (1992). Order effects in belief updating: the belief-adjustment model. Cogn. Psychol. 24, 1–55.
Lange, N. D., Thomas, R. P., and Davelaar, E. J. (2012). “Data acquisition dynamics and hypothesis generation,” in Proceedings of the 11th International Conference on Cognitive Modelling, eds N. Rußwinkel, U. Drewitz, J. Dzaack, H. van Rijn, and F. Ritter (Berlin: Universitaetsverlag der TU), 31–36.
McKenzie, C. R. M. (1998). Taking into account the strength of an alternative hypothesis. J. Exp. Psychol. Learn. Mem. Cogn. 24, 771–792.
Mehlhorn, K., Taatgen, N. A., Lebiere, C., and Krems, J. F. (2011). Memory activation and the availability of explanations in sequential diagnostic reasoning. J. Exp. Psychol. Learn. Mem. Cogn. 37, 1391–1411.
Nelson, J. D., McKenzie, C. R. M., Cottrell, G. W., and Sejnowski, T. J. (2010). Experience matters: information acquisition optimizes probability gain. Psychol. Sci. 21, 960–969.
Page, M. P. A., and Norris, D. (1998). The primacy model: a new model of immediate serial recall. Psychol. Rev. 105, 761–781.
Raaijmakers, J. G. W., and Shiffrin, R. M. (1981). Search of associative memory. Psychol. Rev. 88, 93–134.
Rebitschek, F., Scholz, A., Bocklisch, F., Krems, J. F., and Jahn, G. (2012). “Order effects in diagnostic reasoning with four candidate hypotheses,” in Proceedings of the 34th Annual Conference of the Cognitive Science Society, eds N. Miyake, D. Peebles, and R. P. Cooper (Austin, TX: Cognitive Science Society) (in press).
Sprenger, A., and Dougherty, M. P. (2012). Generating and evaluating options for decision making: the impact of sequentially presented evidence. J. Exp. Psychol. Learn. Mem. Cogn. 38, 550–575.
Sprenger, A., and Dougherty, M. R. P. (2006). Differences between probability and frequency judgments: the role of individual differences in working memory capacity. Organ. Behav. Hum. Decis. Process. 99, 202–211.
Sprenger, A. M., Dougherty, M. R., Atkins, S. M., Franco-Watkins, A. M., Thomas, R. P., Lange, N. D., and Abbs, B. (2011). Implications of cognitive load for hypothesis generation and probability judgment. Front. Psychol. 2:129. doi:10.3389/fpsyg.2011.00129
Thomas, R. P., Dougherty, M. R., Sprenger, A. M., and Harbison, J. I. (2008). Diagnostic hypothesis generation and human judgment. Psychol. Rev. 115, 155–185.
Usher, M., Davelaar, E. J., Haarmann, H., and Goshen-Gottstein, Y. (2008). Short term memory after all: comment on Sederberg, Howard, and Kahana (2008). Psychol. Rev. 115, 1108–1118.
Keywords: hypothesis generation, temporal dynamics, working memory, information acquisition, decision making
Citation: Lange ND, Thomas RP and Davelaar EJ (2012) Temporal dynamics of hypothesis generation: the influences of data serial order, data consistency, and elicitation timing. Front. Psychology 3:215. doi: 10.3389/fpsyg.2012.00215
Received: 24 January 2012; Accepted: 09 June 2012;
Published online: 29 June 2012.
Edited by:
David Albert Lagnado, University College London, UKReviewed by:
Richard P. Cooper, Birkbeck College, UKDaniel Navarro, University of Adelaide, Australia
Amber M. Sprenger, University of Maryland College Park, USA
Copyright: © 2012 Lange, Thomas and Davelaar. This is an open-access article distributed under the terms of the Creative Commons Attribution Non Commercial License, which permits non-commercial use, distribution, and reproduction in other forums, provided the original authors and source are credited.
*Correspondence: Nicholas D. Lange, Department of Psychological Sciences, Birkbeck College, University of London, Malet Street, London WC1E 7HX, UK. e-mail:bmRsYW5nZUBnbWFpbC5jb20=

 Rick P. Thomas2
