 Michela Balsamo
 Aristide Saggino
 Leonardo Carlucci
- School of Medicine and Health Sciences, Università degli Studi G. d’Annunzio Chieti e Pescara, Chieti, Italy
A number of assessment instruments have been developed as efficacy measures of geriatric depression in clinical trials but most showed several weaknesses, such as time-consuming administration, development and validation in younger populations, and lack of discrimination between anxiety and depression. Among the extant self-report measures of depression, the 21-item Teate Depression Inventory (TDI; Balsamo and Saggino, 2013), developed via Rasch analysis, showed a satisfactory level of diagnostic accuracy, and allowed the reduction of false positives in test scoring in adult population. The present study explored the potential improvement in the psychometric performance of the TDI in the elderly by item refinement through Rasch analysis in a sample of 836 elderly people (49.5% males; mean age = 73.28; SD = 6.56). A resulting shorter version was composed of the best-fitting and discriminative nine items from the full form. The Teate Depression Inventory (TDI-E) (E for elderly) presented good internal construct validity, with unidimensional structure, local dependency, good reliability (person separation index and Cronbach’s alpha), and no signs of differential item functioning or measurement bias due to gender and age (65 vs. 75+ years). Cut-off points and normative data provided could enhance the clinical usefulness of the TDI-E, which seems to be a promising valid and reliable tool for the screening of geriatric depression, with less risk of finding false positives due to overlapping of depression in elderly with other comorbid conditions.
Introduction
Depression in Elderly and Its Measurement
Among older adults, depression is a common with more persistent and debilitating consequences than other forms of psychological distress condition (Arean and Ayalon, 2005; Friedman et al., 2007; Gilchrist and Gunn, 2007; Rodda et al., 2011; Sözeri-Varma, 2012). Among these, diminished cognitive, physical, and social functioning, increasing of risk of morbidity, general self-neglect, dependence by the others and mortality are those mainly noteworthy (Unützer et al., 2000, 2002; Fiske et al., 2009; Grover and Malhotra, 2015; Kennedy et al., 2016).
Late-life depression is characterized by different ways of presentation with respect to depression earlier in the lifespan (Koenig et al., 1993). Elderly depressed people are more likely to be affected by concomitant medical illness and psychiatric problems that can complicate their detection and therapy. For example, the presence of somatic and dementing disorders, the comorbidity with anxiety and physical complaints, may be misattributed to depression or vice versa (Lyness et al., 1995; Beekman et al., 2000; Friedman et al., 2007; Gilchrist and Gunn, 2007; Sözeri-Varma, 2012; Kennedy et al., 2016). For 516 depressed patients aged 70 years and older, suffered from a concomitant medical illness (e.g., weight loss, somatic anxiety, middle insomnia, and work impairment) eight items of the Hamilton Rating Scale for Depression (HAMD, Hamilton, 1960) may be elevated by the concurrent somatic disorder (Linden et al., 1995). Thus, the detection and assessment of elderly depression could be overlooked, misunderstood, or even misattributed because its symptoms can be easily confused with those of medical problems (e.g., fatigue, loss of involvement, pleasure, and interest in sexual activity, trouble sleeping, appetite, or weight change) and/or with natural cognitive functioning decline, including problems of concentration and memory, and/or with the senescence, an irreversible decline in mental and physical capabilities, as well as with some anxiety symptoms, including the hypochondriasis (Clark and Watson, 1991; Lyness et al., 1995). Ideally, depression assessment should be restricted to items that avoid confounding by medicall illness.
Lastly, items tapping pessimism, reduced actvity or interest, thoughts of death, possible suicidal intention, and meaning of the life have a different meaning for those approaching the end of their life, compared to younger individuals (Cusin et al., 2009). Probably, problems of unique interpretation could only be addressed if an experienced interviewer administers the scale of depression, but this turns out to be the case (Balsamo et al., 2018).
Given its costly and wide-ranging implications and the different psychopathological expression, sound and specific measurement of late-life depression is mandatory to improve the recognition and treatment of depressed elderly patients.
Current Self-Report Instruments on Geriatric Depression
A number of self-report measures developed in the adult population have been used to assess the incidence and intensity of depression symptoms and to monitor anti-depressant treatment progresses in the elderly (Andersen, 1999). Indeed, despite the differences in depressive symptoms between adult and geriatric population, the primary outcome measures used for the antidepressant trials in the people aged 65 years or older are still the self-report instruments developed in the adult population, such as the Beck Depression Inventory-II (BDI-II; Beck et al., 1996), the Center for Epidemiological Studies Depression Scale (CES-D, Radloff, 1977), and the HAM-D (Bent-Hansen et al., 2003; Roose et al., 2004; Sheikh et al., 2004; Wohlreich et al., 2004).
Nevertheless, controversies are emerged about their psychometric quality in the elderly because of some relevant shortcomings, such as time-consuming administration, vulnerability to misinterpretation and response biases, questionable structure of their response formats, and dependence of their scores on cultural factors (Balsamo and Saggino, 2007). For example, according to methodological studies, the number of items could be shortened by about 70% without compromising the measurement properties substantially (Moran et al., 2001). For the extant depression scales, it was highlighted that short forms with as few as nine items performed in ways very similar to the full version, while a version composed of only five items had a detectable difference from the full version (Cheung et al., 2007). Shorter form of the extant depression scales currently used for elderly should permit to decrease the overall time testing, in order to reduce the survey fatigue or boredom that older participants may feel, mostly when taking longer measures made up of many similar or repetitive items (Balsamo et al., 2018).
Moreover, some of these scales vary in terms of their primary content focus and their coverage of the core symptoms of depressive symptomatology. This aspect, which cast doubt on their content validity, could result in the under-recognition of depressive symptoms (Faravelli et al., 1986; Balsamo and Saggino, 2007).
Among the scales designed with the specific aim of screening depression in the elderly, the 30-item GDS was the gold standard (Yesavage et al., 1982). However, it has been repeatedly criticized (e.g., Friedman et al., 2005), mainly because of its length (Jongenelis et al., 2005; Chachamovich et al., 2010). The 15-item GDS-SF, extracted by the full-length form based on the base of diagnostic accuracy criteria (Yesavage and Sheikh, 1986), was also criticized (Chiang et al., 2009; Mitchell et al., 2010a,b; Wongpakaran et al., 2019) because of its lacking unidimensional nature. Indeed, two- and three-factor models emerged in different samples of elderly (Incalzi et al., 2003; Brown et al., 2007). Moreover, several items (i.e., #2, #3, and #10) were found to have a low clinical validity since did not contribute to the construct of geriatric depression and to be more related to subjective aspects of depression (e.g., life satisfaction or cognitive impairment) (Tang et al., 2005; Chiang et al., 2009; Wongpakaran et al., 2019). Further, some daunting multidimensional issues, such as differential item function (DIF), item misfit and redundancy, have been highlighted through IRT approach (Tang et al., 2005; Chachamovich et al., 2010; Wongpakaran et al., 2019). The development of the GDS brief forms (GDS-10, -6, -5, -4, and -1; Mitchell et al., 2010a,b) raised supplementary problems, including the difficulty to compare scores across different cultures and languages. In addition, the forced binary (yes or no) response format potentially provides no indication about the relative intensity or frequency of depression symptoms experienced by elderly (Castle and Engberg, 2004). Thus, to avoid these unidimensional and diagnostic problems, the GDS-SF is usually included together with other methods of screening for depression in a wide range clinical assessment for geriatric sample (Chiang et al., 2009).
Summing up, a brief, specific and unidimensional method of assessment of the severity of depressive symptoms in older adults seems to be the answer to the main challenges posed by the measurement of depression in this population (Balsamo et al., 2018). The different presentation of the depressive psychopathology between adults and elderly imposes different and specific measures in these populations. Measures specifically designed to measure depression in older adults result to lack of unidimensionality, i.e., an important requirement for calculating and interpreting a total score of an instrument (Lichtenberg, 2010; Ziegler and Hagemann, 2015). As a result, special emphasis should be laid on the investigation of the unidimensional structure of the scales used in the elderly general population.
Additionally, in most epidemiological studies, more females than males were diagnosed with depression (Albert, 2015), although these reported rates might be due to the use of generic diagnostic criteria and psychometric instruments that are not sensitive to depression in men (Oliffe and Phillips, 2008). As regards, age, there is some concern that older adults can obtain inflated scores on self-report depression instruments, which stem from non-depressive sources (e.g., medical problems) (e.g., Joiner et al., 2005). About this, it is worth noting that there is a difference between young- and old-old subjects groups (Garfein and Herzog, 1995; Mehta et al., 2008). Therefore, a further open question remains whether bias-free dimensional assessment of depression, independent of age, somatic morbidity, and gender, is feasible in the elderly general population.
Rasch measurement model is a powerful modern approach to develop unidimensional and bias-free instruments in health sciences. It examines both the scale and individual item performance in depth, leading to measures of depression, which are sample free and item free, and without DIF due to gender and age (Embretson and Reise, 2000). To our knowledge, no Rasch-based self-report measure of geriatric depression was developed. Up to the present, few IRT models have been applied only in the shortening process of extant few measures of depression used in the elderly, developed within classical test theory (CTT). The deriving advantage was to provide an improvement in the psychometric performance by item refinement, e.g., by revealing item redundancy, so that these instruments could be shortened without information loss (Tang et al., 2005; Lamoureux et al., 2009; Chachamovich et al., 2010; Forkmann et al., 2013; Spangenberg et al., 2015).
The Teate Depression Inventory
Among the extant self-report measures of depression used in older people, the 21-item Teate Depression Inventory (TDI; Balsamo and Saggino, 2013) was developed within Rasch logistic approach of responses. The TDI had shown to have an excellent Person Separation Index (PSI), no bias due to item-trait interaction, and control of major response sets (Innamorati et al., 2013, 2014; Balsamo et al., 2013a,b, 2014, 2015a,b,c, 2016, 2019; Saggino et al., 2017; Carlucci et al., 2018a,b). Three cut-off scores were recommended in terms of sensitivity, specificity, and classification accuracy for screening for varying levels (minimal, mild, moderate, and severe) of depression severity in a group of patients diagnosed with major depressive disorder (Balsamo and Saggino, 2014). More recently, applying the Bayes’ theorem, the TDI showed to allow significant reduction of false positives in test scoring in clinical and non-clinical samples (Tommasi et al., 2018). Indeed, it was found to overcome the 50% level of diagnostic accuracy, unlike the BDI, the HAMD, the Zung Self-Rating Depression Scale (ZSDS; Zung, 1965), and the CES-D, because of a good procedure to select test items and subjects with clearly defined pathological symptoms.
About the pitfalls in the measurement of the geriatric-specific characteristics of late-life depression, the TDI significantly related to measures of anxiety and depression in expected directions and showed promise discriminating depression from anxiety (Picconi et al., 2018a,b). As such, it displayed significantly (p < 0.01) higher correlation with depression measure (GDS) compared with the anxiety measure, both trait and state, both cognitive and somatic scales, in a sample of 396 community-dwelling middle aged and elderly adults (Balsamo et al., 2015b).
Regarding the sex, the performance of the TDI has been found to be sufficiently insensitive for gender biases in a sample of 529 subjects (229 psychiatric outpatients and 300 healthy community-dwelling adults). Indeed, all items showed no difference due to gender, except for the item #10. It could represent an advantage over the extant depression questionnaires (like the BDI-II), that included several items showing DIF dependent of the respondent’s sex since they might substantially interfere with the valid interpretation of instrument’s sum score (Santor et al., 1994; Forkmann et al., 2009; da Rocha et al., 2013).
Regarding the impact of the somatic multimorbidity on the measurement of depression, the TDI was a unidimensional screening instrument of depression that included no items referring to somatic complaints (sleep and appetite disturbances). Present in an initial set of items, they did not fit the Rasch model because of no additional information provided to estimate the person’s depression level. The lack of these items results to be consistent with the confounding of comorbidity that may be expected when applied to other diagnostic groups and can result in false positives (Thombs et al., 2007; Gibbons et al., 2011; da Rocha et al., 2013), as well as more useful for assessing depression in somatically ill patients, as are most of the elderly. Indeed, total scores of existing depression scales containing somatic items could be biased if those were filled from patients suffering from somatic illnesses because they did not reflect depression severity.
Although these compelling psychometric characteristics, the length of the TDI could be a limitation, which hinders its widespread use in elderly population. Reading and filling out its 21 items can be stressful for some older respondents, as well as not very useful for practitioners interested in measuring multiple constructs or repeated measurement of constructs, in the presence of time constraints. Moreover, even if the TDI is a Rasch-based measure, it is preferable to verify its psychometric functioning in a special population, like that of the elderly. Indeed, although Rasch analysis specifies that item parameters be sample free, constant item parameters imply a constant construct while different item parameters across samples of the relevant population could imply that the construct has changed, as Linacre (1996) outlined. Depressive psychopathology among elderly patients has been shown to be different in some aspects from younger individuals. Thus, given the construct of depression could change in different populations, it is desirable to test the TDI performance in the elderly population, which is different from the adult population, for which the TDI was developed.
Another point worth nothing concerns the availability of age-relevant norms in assessing mental health disorders among older adults (Therrien and Hunsley, 2012). Specific cut-off point represents a point of demarcation along continuum to address clinical decision and to identify good candidates for psychological treatments or protocols by clinicians interested to routinely screen their older patients for depression. This is particularly useful in clinical research, where the number of patients who receive the same intervention is usually limited. Only some depression measures currently used for measuring geriatric depression cut off points were computed. As regards the norms, few self-report instruments showed adequate normative data for elderly, which limited their clinical value (Breeman et al., 2015). With the growing number of older adults who is requiring mental health services, the diagnosis and treatment selection is helped by assessment data; thus, it is mandatory to have measures that are normed for an older population (Edelstein et al., 2007).
The Present Study
The present study aims at shortening and adapting the TDI to the elderly population using Rasch analysis with special emphasis on its unidimensional structure and DIF due to gender and age. Adherence of the brief TDI for elderly to Rasch model assumptions was determined with the analysis of Rasch model and item fit, unidimensionality, local dependency (LD) (principal component factor analysis of the residuals and correlation matrix of residuals), reliability (PSI and Cronbach’ alpha), and DIF with regard to participants’ age (65 vs. 75+ years) and gender.
A secondary aim was to examine the choice of cut-point to identify older people as depressed for screening and diagnostic purposes.
Finally, norm values were calculated. Based on the individual raw sum scores, each person’s latent trait score θ was calculated and transformed linearly into percentiles, z values (mean = 0; SD = 1) and t values (mean = 50; SD = 10).
Methods
Participants and Procedure
The sample included 836 elderly participants, of whom 49.5% were males. They were, on average, 73.28 (SD =6.56) years. Included in the sample was a subsample of 80 elderly clinical depressed participants (69% males) with an average of 72.60 years (SD = 5.44) years. No statistical differences were found in age variable between clinical vs. nonclinical group (t834 = −1.207, p = 0.304). Non-clinical participants have been enrolled by licensed psychologists at various community centers; groups; associations, senior citizens’ Universities in Central and Southern Italy. They were preliminarily screened for psychiatric illness with a short interview. Only individuals evidencing no current psychopathology, no history of psychiatric hospitalization, and no cognitive impairment or neurological diseases (e.g., dementia, Parkinson, and Alzheimer’s disease) were included in the non-clinical sample. Depressed participants were extracted from the standardization sample (Balsamo and Saggino, 2013). They were recruited from mental health counseling services and from private centers by clinical psychologists and psychotherapists. Eligible depressed participants were screened for major depressive disorders using the Structured Clinical Interview for the Diagnostic and Statistical Manual of Mental Disorders Axis I (SCID-I; First et al., 1997). Only participants who met the Diagnostic and Statistical Manual of Mental Disorders criteria (5th ed.; DSM–5; American Psychiatric Association, 2013) for a primary diagnosis of depression were included in the clinical subsample.
The study was reviewed and approved by the Department of Psychological Sciences, Health and Territory, University of Chieti, Italy, Review Board. All our procedures were in accordance with the ethical standards of the 1964 Declaration of Helsinki and its later amendments. Written informed consent was obtained from all individual participants included in the study.
Measure
Teate Depression Inventory
The Teate Depression Inventory (TDI) was composed of 21 items that aimed to assess symptoms of major depression during the past 2 weeks (Balsamo and Saggino, 2013). Participants responded on a five-point Likert scale ranging from “never” to “always.” Total scores were created by first reverse-coding several items and then summing single items. Higher total scores indicate more severe depressive symptoms.
Data Analysis
The analysis plan consisted of two consecutive steps: initial evaluation of unidimensionality of the TDI using Mokken analysis and evaluation of Rasch model assumptions.
Firstly, a Mokken analysis was carried out within the framework of IRT in order to assess the assumption of unidimensionality. Following Sijtsma et al. (2011) recommendations, unidimensionality for polytomous-item measures was investigated through the Automated Item Selection Procedure (AISP) algorithm developed in Mokken package of R, using recommended value of c = 0.3 and α = 0.05 (Molenaar and Sijtsma, 2000). The AISP algorithm aimed at partition a set of items (or a set of unscalable items) into Mokken scales (Mokken, 1971; Sijtsma and Molenaar, 2002). Mokken scale is defined by a set of dichotomously scored items for which, given a lower bound “c,” all inter-item covariances are positive and scalability coefficients (Hi/H) were set ≥ c > 0. This definition can be extended to polytomous scored items. To date, values of 0.3 < Hi/H < 0.4 identified weak scalability; values of 0.4 < Hi/H < 0.5 as moderate, and values of Hi/H > 0.5 as strong scalability (Mokken, 1971).
Next, in line with the previous literature on the TDI (Balsamo and Saggino, 2013; Balsamo et al., 2014), data were fitted to the Rasch measurement model using RUMM2030 (Andrich et al., 2010). According to the Rasch model, probability of a person endorsing a dichotomic item was a logistic function of the difference between the person’s abilities and the item difficulty (Rasch, 1960). Because the Rasch model was originally developed for intelligence and attainment tests, the “item difficulty” (Rasch, 1960) can be “translated” as and the severity of depression expressed by the item, i.e., the probability (expressed in logits) to endorse a high category of an item: for “difficult” items this probability would be lower than for “easy” items, relative to the individual person measure. Similarly, person’s abilities are referred to as the latent trait score or person measure. If the Rasch model holds, persons and items can be scaled along a single linear latent continuum (i.e., depression). Since the TDI was conceived as a polytomous scales, an extended parameterization of the Rasch model for dichotomous responses (the Rating Scale Model, RSM) was used to fit the logistic function between the severity of depression and the severity of depression expressed by the items (Andiel, 1995). Like the Rasch model, the RSM and others extended models for polytomous scales (i.e., the Partial Credit Model) can be categorized as generalized linear model (GLM), with random effects modeling for the subject ability (Raju et al., 2014).
Data were found to fit Rasch model when the observed patterns of response are close to the expected model and satisfy a series of assumptions: local independency, response category ordering, lack of item bias or DIF, overall model and individual item fit, and reliability. Rasch analysis represents an iterative process where an initial observed pattern of response was tailored to ensure the overall fit of the data to the model. In this view, a series of sequential steps and fit indices has been estimated. In details:
1. assumption of stochastic ordering of the items along the whole latent trait was determined by a series of fit statistics within adequate ranges (Andrich, 1988): (1) chi-squared statistics (χ2) and probability () should be not significant at level α = 0.05 with Bonferroni adjustment (also named item-trait interaction); (2) items with fit residual values >|2.5| (95% CI) should be discharged from the model; (3) summary item and person fit residual statistics should be approximated to the normal z distribution with mean = 0 and SD = |1| (or approximately |1.4|);
2. monotonicity for polytomous items was assessed by the inspection of the ordered items category thresholds. Thresholds represent the transition point between categories. When ordered, the amount of the probability of the category response itself leads to an amount of the latent trait (i.e., depression);
3. assumption of local response independency was assessed performing a Principal Component Factor Analysis of the Residuals (PCFAR; Smith and Miao, 1994; Linacre, 1998). Local independence implies that when controlling for the main Rasch dimension, no high or substantial residual correlations between the items shall remain. Hence, high residual correlation values (higher than the absolute value > 0.2; Marais, 2013) revealed that performance on the items was accounted for by a third trait dimension (Lee, 2004; Baghaei, 2008), displaying LD issue or multidimensionality. In addition, LD inflated reliability and affected parameters estimation (Wright, 1996);
4. DIF for age (60–75 years/over 75) and gender (males/females) person factors was also evaluated for each item by the two-way ANOVA (α = 0.05 with Bonferroni adjustment). DIF or item bias may occur systematically in responses based on characteristics of the respondents (trait) (uniform DIF) and varying along the construct (non-uniform DIF). In this study both, the uniform and non-uniform DIF issues were assessed;
5. afterward, strict unidimensionality was tested on the shortened set of items using the Smith’ test of unidimensionality implemented in the RUMM 2030. A series of independent t test was performed in order to compare person estimates from two sets of items, composed, respectively, of items with positive and negative factor loadings (λ ≥ |0.30|) on the first principal components analysis of the residuals (Smith, 2002). If more than 5% of these t tests was found to be significant, the resulting scale was labeled as multidimensional;
6. reliability and scale targeting were evaluated in order to assess the measurement validity of the final model. Reliability has been evaluated using the PSI. Values of PSI from 0.70 to 0.85 identified the minimum requirement for group and individual person measurement; a PSI > 0.85 was considered excellent (Nunnally, 1978). In addition, the internal consistency of the scale was examined by Cronbach’s α. Targeting was measured by comparing graphically the mean location score obtained for the participants with that of the items: good values should be located in the center of the scale, close to the zero. Targeting of the person-item threshold distribution assesses how well individual item difficulties and individual person abilities can be matched on a common logit scale (Andrich, 1988) and how are the ceiling and floor effects (Tennant et al., 2004).
Next, following Davis et al. (2008), a regression analysis was performed to determine how well the resulting Rasch interval scale predicted the TDI scores, as conventionally computed using Likert interval scale (e.g., the raw summed scores of all the items), by fitting a cubic model.
To facilitate the clinical use of the TDI short version, norms values were computed. Person’s latent trait scores (θ, expressed in logits) were transformed to an interval-metric scale using the original TDI 0–4 range scores (Tennant and Conaghan, 2007; Lundgren-Nilsson et al., 2013). This transformation is allowed since “Rasch model is capable of constructing linear measures from counts of qualitatively ordered observations, provided the structure of quantity is present in the data” (Salzberger, 2010). Next, the trait scores (θ) were transformed linearly into percentiles, z and t values.
Further, the receiver operating characteristic (ROC) curve analysis (Gleitman, 1986) with the Youden index (J) method was employed in order to detect the cut-off score, potentially useful in determining clinically depressed elderly. In this case, the optimal cut-off score represents the J function of the difference between true positive rate and false positive rate over all possible cut-point values. In the present sample, the prevalence rate of depression was 10.4% (N = 80). The performance of a diagnostic variable was quantified by computing the area under the curve (AUC; Bradley, 1997). Optimal values of AUC ranged from 0 “weak performance” to 1 “perfect performance” (Hanley and McNeil, 1982), with a value of >0.70 as recommended (Swets et al., 2000).
Results
Mokken Analysis
After rescoring those formulated in reversed mode, all the TDI items were submitted to Mokken analysis, in order to test the unidimensionality assumption. The AISP revealed that all the TDI items loaded on a single latent dimension. The inter-item covariances were found positive, thus satisfied the first criterion of the Mokken scale. Next, all the item scalability coefficients (Hi) ranged from 0.350 (weak) to 0.470 (moderate); hence, the second criterion of a Mokken scale has been satisfied. The scalability coefficient for the entire TDI scale (H), equals to 0.409, showed a moderate scalability. Then, the assumption of unidimensionality was met for the 21 items of the TDI.
Rasch Analysis
The initial Rasch model was run with all the 21 items of the TDI exhibiting, an excellent PSI of 0.91. No floor and ceiling effects have been found. However, the initial model showed a poor overall model fit [χ2 = 309.57(189), p < 0.001], and four items displayed disordered thresholds. The mean fit residual was 0.773 (SD = 2.066), indicating that the items did not fit the model properly, with an observed modest local response dependency. Out of the 21 items, six exhibited misfit criteria, including large fit residuals (±2.5) and significant χ2 probabilities (p < 0.0001) with Bonferroni adjustment.
Since our goal was to develop a brief measure of depression for elderly people, attempts were made to improve fit to the initial model, by collapsing categories to achieve sequential order in items with disordered thresholds. The remaining items showed properly ordered thresholds, and all response categories were retained.
After collapsing item thresholds and ordering categories, the results showed non-considerable change (see Model #2 in Table 1). Thus, shortening of the TDI has been continued toward a final model, using an iterative strategy. Firstly, LD was pursued by deleting the pairs of items with correlations exceeding 0.3 were taken to indicate dependency. Items misfitting were removing item-by-item if displayed fit residuals outside the acceptable range (±2.5) and/or χ2 probability value of the individual item fit was significant. Lastly, item bias or DIF for age and gender was also evaluated to determine if it was contributing to the misfit of items.
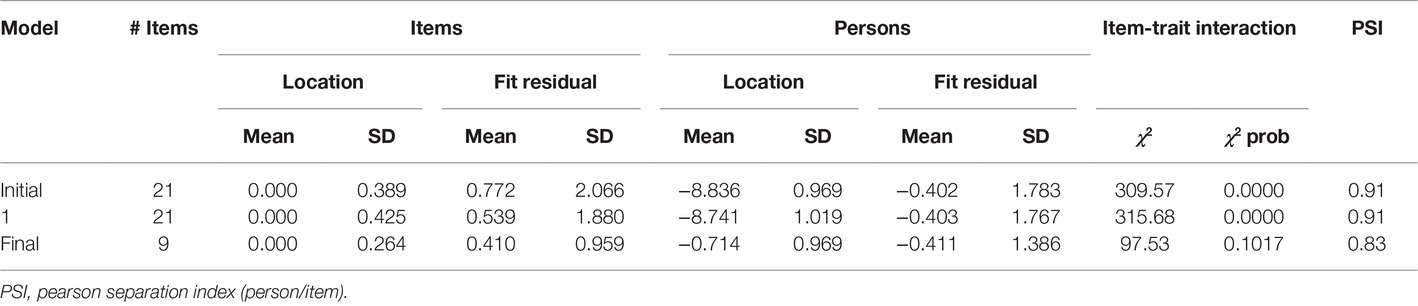
Table 1. Summary fit statistics for Rasch analyses.
After removing item by item all misfitting items by the 21-item set, best model fit (with Bonferroni adjustment) was achieved by a final nine-item set, named the Teate Depression Inventory (TDI-E) (E for elderly) (Table 2). The final solution showed good fit to model expectations, with a not significant item-trait interaction index [χ2 = 97.53(81), p = 0.101]. Its item mean was 0.00 and SD = 0.264. No local response dependency was observed within the nine-item TDI model, as revealed by the inspection of the PCA residual correlations matrix. All item thresholds were found ordered, excepting for item #6. For achieving its sequential order, the “rarely” and “sometimes” response categories were collapsed. An inspection of the category response frequencies revealed that elderly participants chosen these two categories with the same probability (rarely = 14.64%; sometimes = 15.24%).
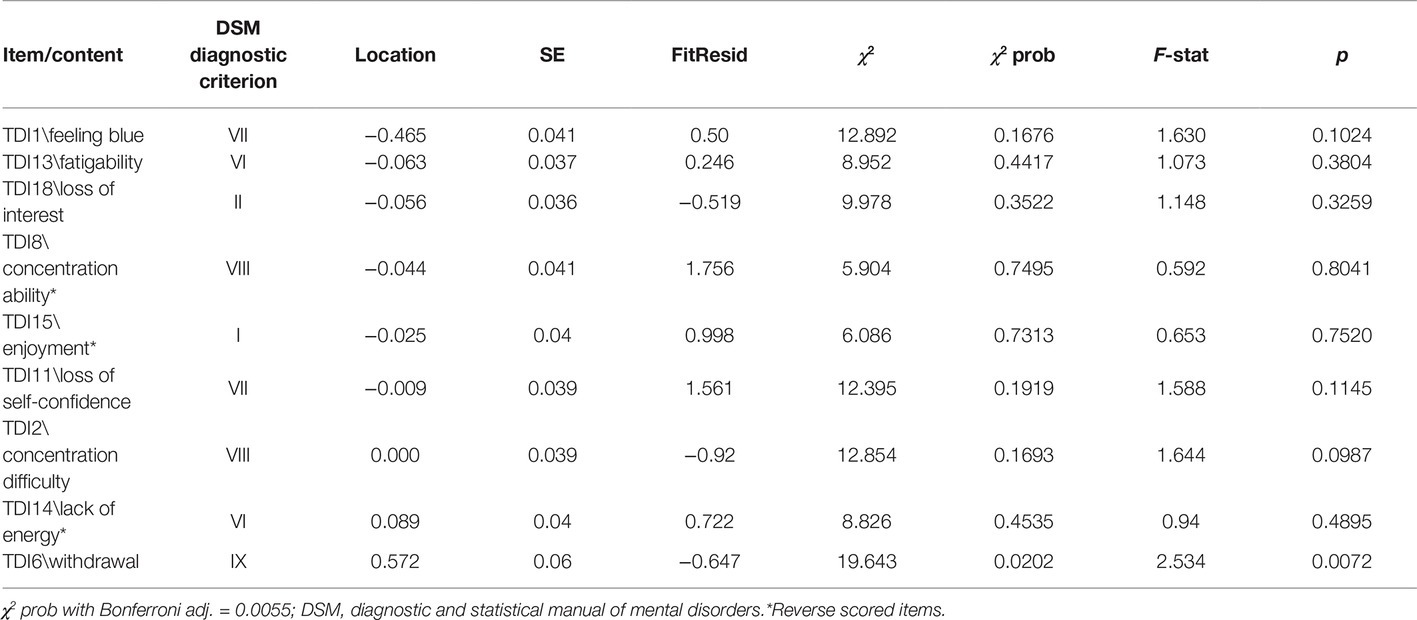
Table 2. Final model with nine items.
There was no DIF for both gender or age, based on Bonferroni adjusted p’s. Strict unidimensionality test (Smith, 2002) performed on the TDI-E showed that only the 5% (CI: 3.5–6.5%) of the paired t tests fell outside the 95% confidence interval, hence the assumption of unidimensionality held. The PSI of 0.83 indicated an adequate person separation reliability (Andrich, 1982) and also suggested that the power to detect items that do not fit the model was good. The TDI-E also showed high internal consistency (Cronbach’s α = 0.85).
The shortened scale displayed an unbalanced person-item targeting to the left side of the person threshold distribution plot (easier questions or greater severity of depression to endorse the item), with a percentage of extreme scores <5%. No floor and ceiling effects have been found. However, the TDI-E was well targeted to the clinical sample, with the means of the person being 0.435 (SD = 1.01) on the logit scale (Figure 1).
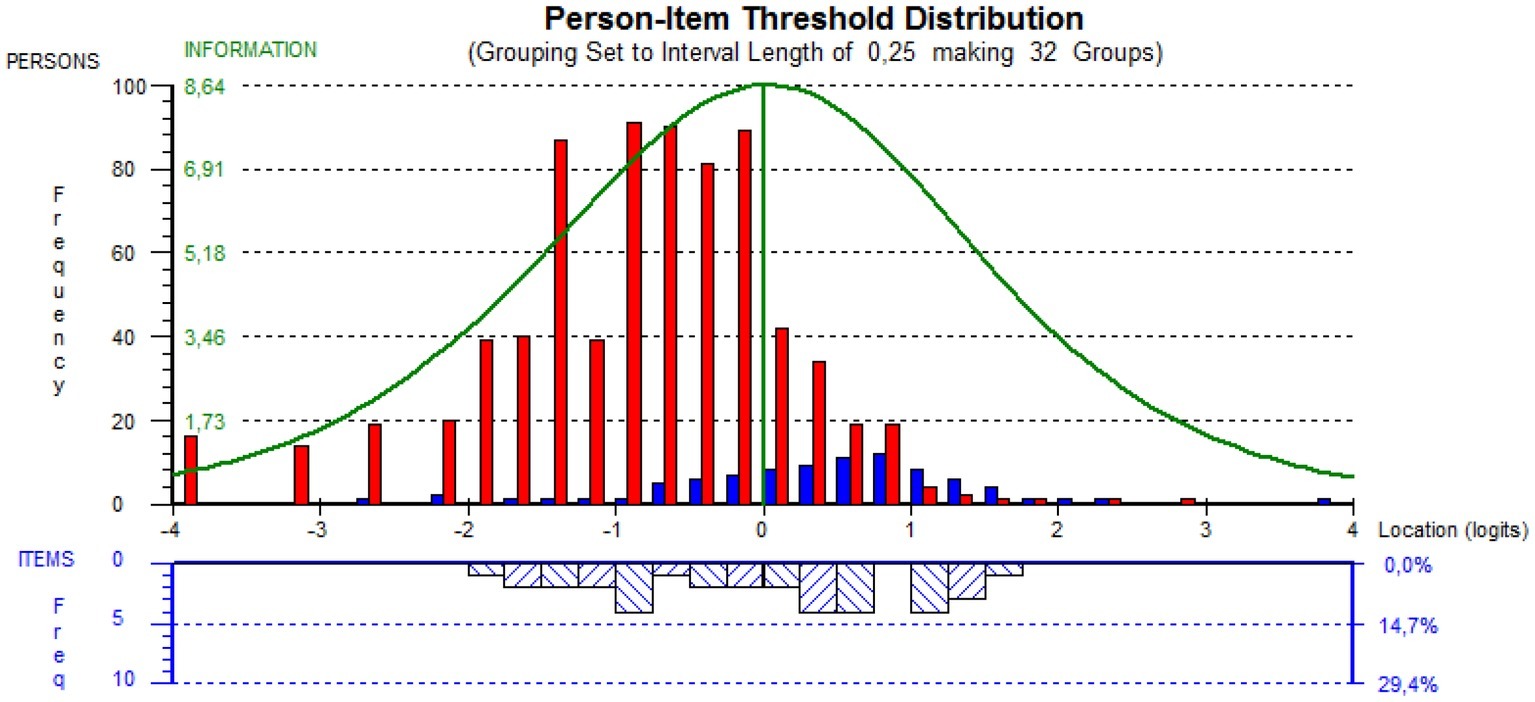
Figure 1. Targeting of person and item. Red bars, non-clinical; blue bars, clinical.
Given the drastic scale reduction of the TDI (leading from 21 to 9 items), it was evaluated how the Rasch scale predicted the summed score of the selected nine items. Results from regression analysis supported the appropriateness of the cubic function into predicted Rasch-based scores in relation to the summed score. Summary and coefficient estimates for the raw scores were displayed in Table 3.
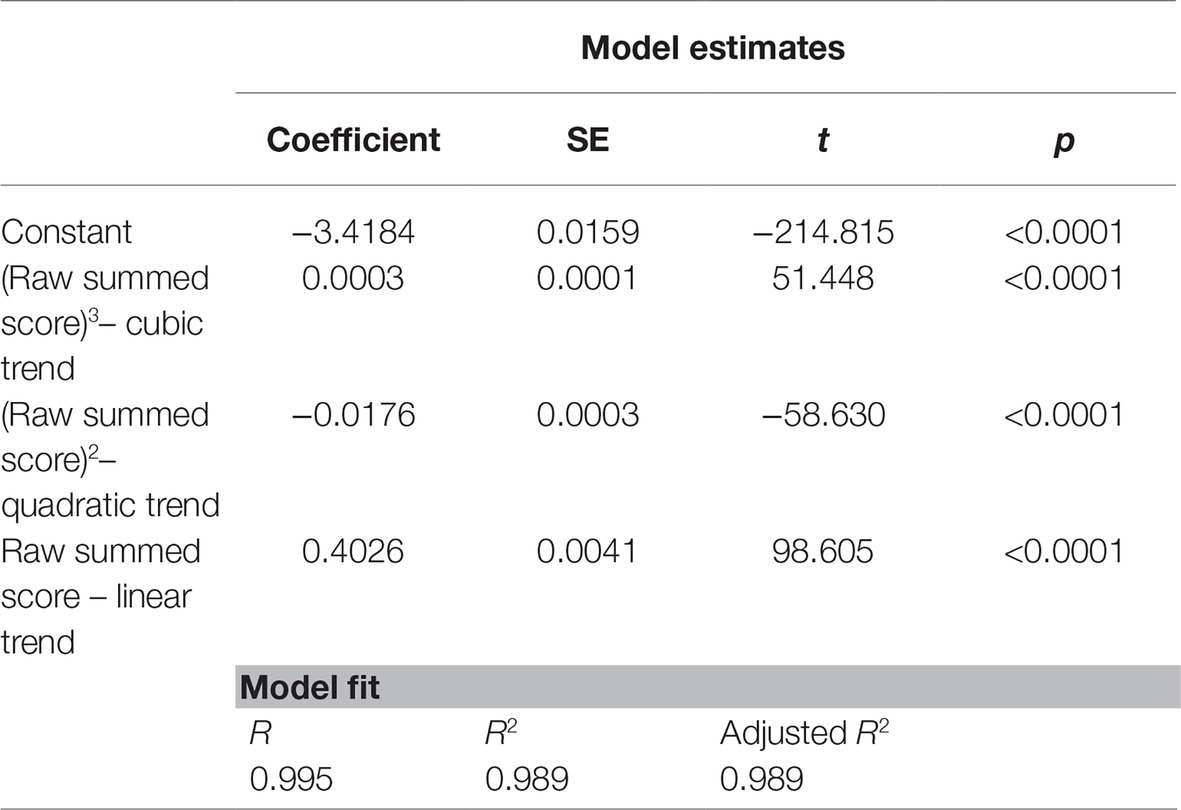
Table 3. Logits scores regressed by raw summed score for the nine items model.
Next, since Rasch model conformity of the TDI-E has been confirmed, norm values were determined. As no DIFs for gender and age groups were found, the score of the TDI-E resulted to be independent from gender and age. Norms values were displayed in Table 4. Rasch-based scores for all the raw summed score shave been estimated by transforming the Person’s latent trait scores (θ) to their interval scale equivalent scores (or Rasch interval scale). This transformation is valid if no missing value was observed in the TDI items. Practically, a raw summed score of 10 (θ = −0.86) on the TDI-E is equivalent to a Rasch interval score of 1.58, with a Z value of −0.49 (31st percentile) and a T score of 45.
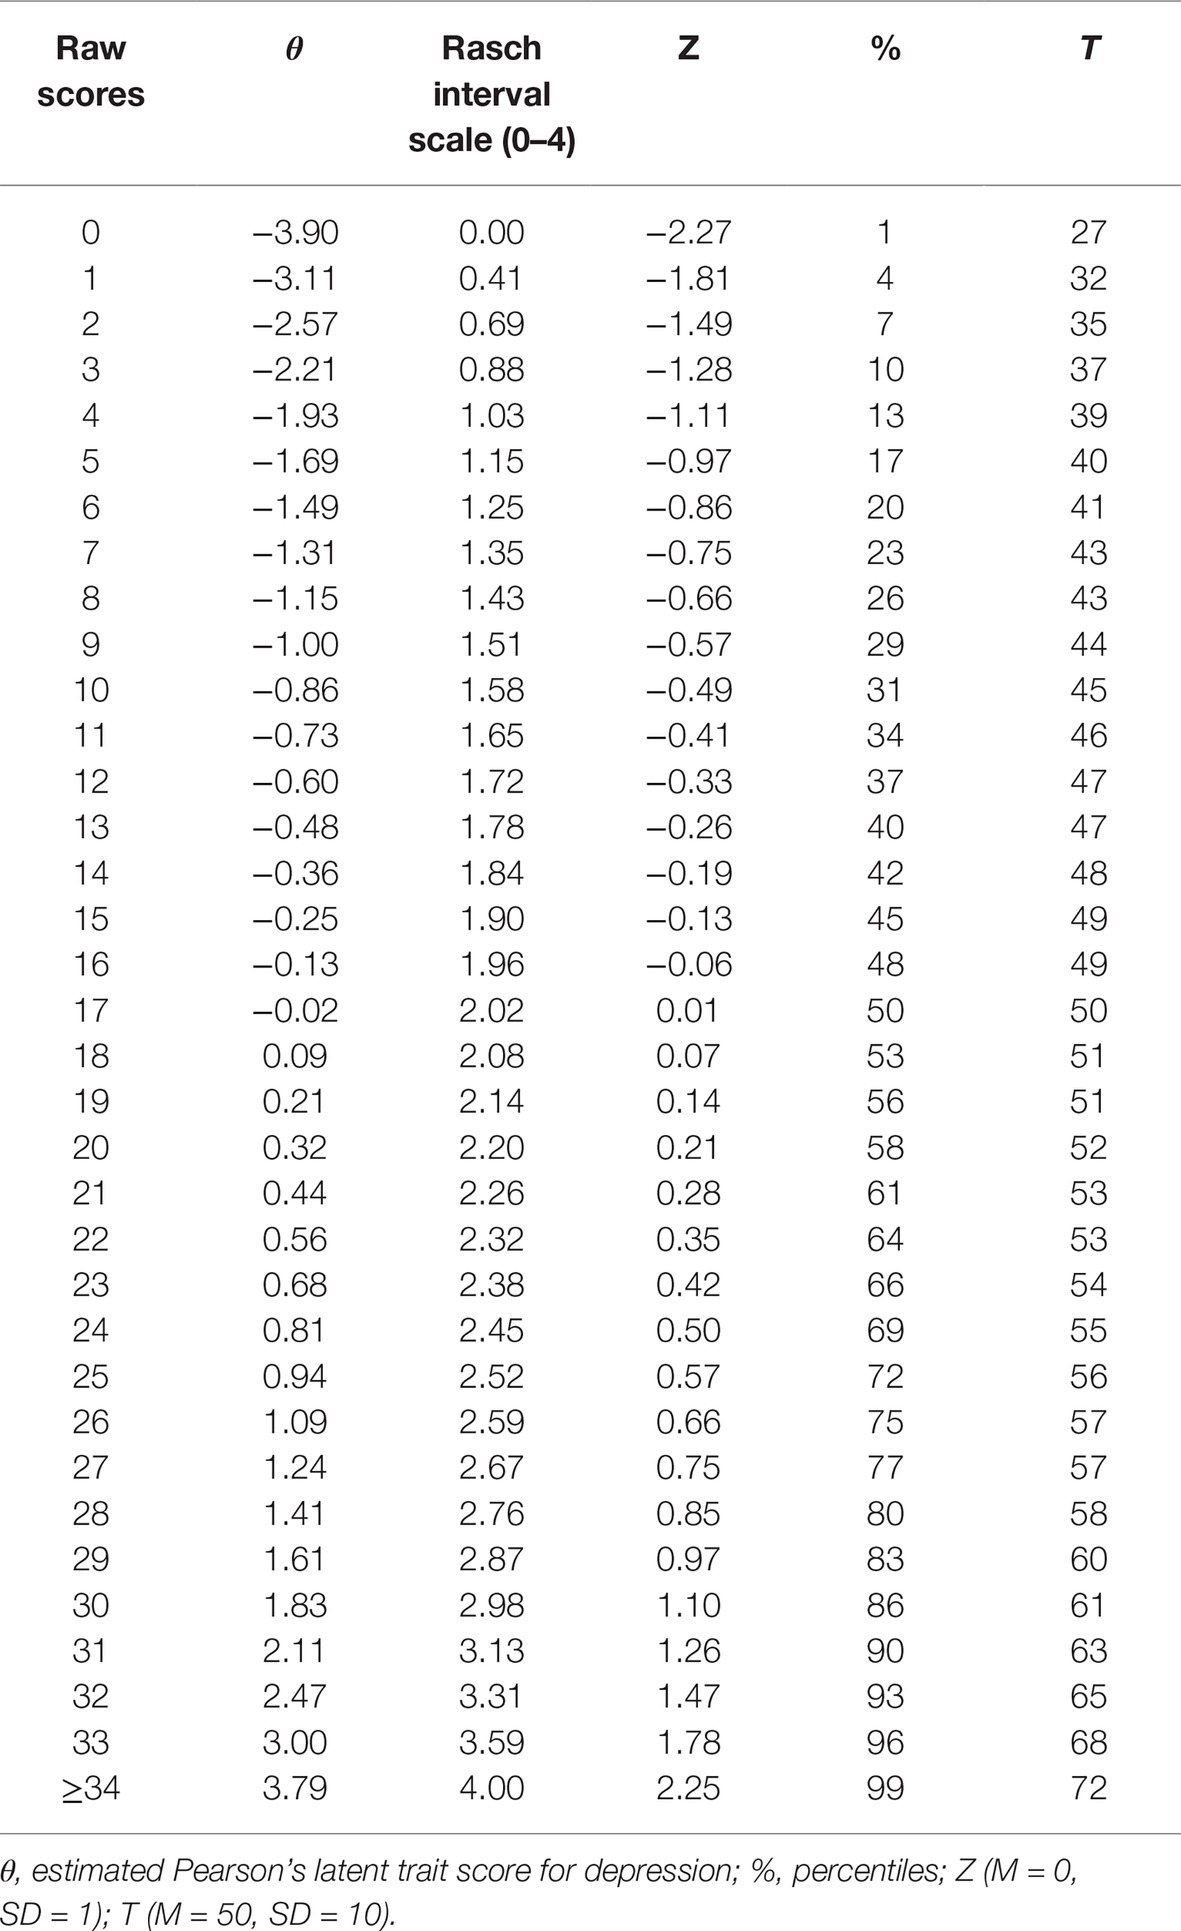
Table 4. Transformation of raw score to Rasch-based scores.
Receiver Operating Characteristic Curve Analysis
A ROC curve analysis was performed to compare the non-depressed elderly group vs. the depressed group. Results indicated that the nine-item TDI scale was able to discriminate the two groups being examined. In details, the optimal cut-off point useful for the screening and diagnostic purposes was detected. The AUC for the TDI-E total score was 0.833 (95% CI of 0.806–0.858), suggesting good discrimination between the groups. The Youden index (0.54, CI 0.42–0.62) for the TDI-E total score was observed at a score of 18 points, corresponding to a sensitivity of 69% and specificity of 85%. Positive and negative predictive power were 35.5 and 96%, respectively, and overall diagnostic efficiency was 84%. Alternative cut-off values (see Table 5), were also estimated via BCa bootstrapped 95% CI (Efron and Tibshirani, 1993; Zhou et al., 2002). For instance, a cut-off of >11 could be employed for the screening purpose, corresponding to a sensitivity of 90.8% and specificity of 57.3%. Positive and negative predictive powers were 18.4 and 98%.
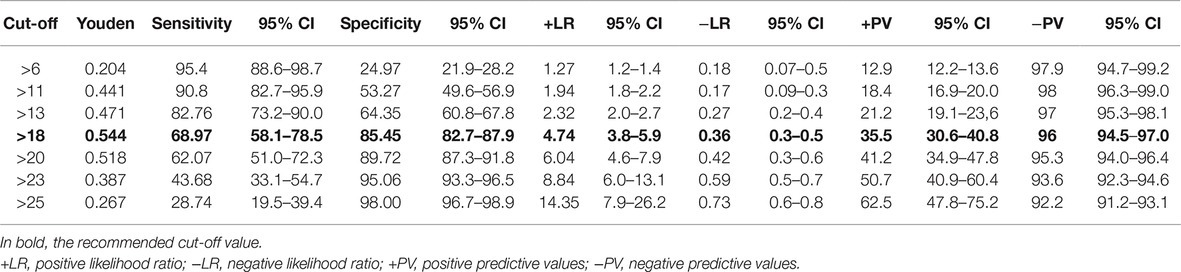
Table 5. Alternative cut-off values for the TDI-E.
Discussion
An appropriate answer to the several issues posed by challenges to measurement of late-life depression could reside in a self-reported measurement late-life depression, with the characteristics of brevity, specificity, and unidimensionality (Balsamo et al., 2018).
Concerning the brevity, it is well known that brief tools in primary care would be very useful for general practitioners, who are scarce of time and their high frequent patients may be elderly (Luber et al., 2001; Frank et al., 2018).
Several briefer versions of the GDS, the gold standard measure for depression in the elderly, have been developed. However, they have not been shown to be exempt from weakness. For example, in a meta-analytic study on their diagnostic accuracy, there was inconsistency in the items that contributed to these briefer versions and there are no standardized cut-off scores. This cast doubt on the validity of their scores, as well as on their diagnostic performance (Pocklington et al., 2016).
Concerning the unidimensionality, extant scales currently used in the elderly general population has been found lacking because some items related to a different latent trait, such as physical illness, were included (Osman et al., 2004; Storch et al., 2004; Crockett et al., 2005). As a result, using a single total score could result in its unclear interpretation. For example, two patients with the same summed score might differ in terms of the relative severity and frequency of different components of depression; thus, a treatment targeting only one of these aspects would be harder to detect in its effect. By applying the Rasch analysis, it is possible to develop unidimensional and bias-free measures of depression in the elderly general population.
The TDI is a newly developed Rasch-based measure of depression. Given the necessity of brevity of measurement in older adults, Rasch analysis was employed to develop a briefer measure of geriatric depression from the Rasch-based 21-item TDI. Given the differences in depressive symptoms between geriatric and adult populations, this study aimed at evaluating its performance in this specific population.
Mokken and Rasch Analyses
In line with the previous literature, Mokken analysis of the TDI items showed that they mapped on to the depression trait, with medium scalability coefficients. To select items from the 21-item TDI with best measurement properties for composing a briefer, homogeneous, and unidimensional scale of geriatric depression, a Rasch analysis was performed. A shortened measure with nine items was derived. The newly developed TDI-E included items covering a wide range of diagnostic criteria of the DSM-5 for the major depressive episode (for a comprehensive review of the criteria, see Balsamo et al., 2014). Like the TDI, the TDI-E covered the same patterns of difficulties, within the range ± 1 logit. Item #1 (“I felt down”) resulted to be the easiest to endorse, while item #6 (“I felt the desire to retire and disappear”) was found the most difficult to endorse. This result was in accordance with previous literature (e.g., Lewinsohn et al., 2003), according to which depressed mood is the common symptom of depression, more so than anhedonia and other symptoms. Similarly, wish to die was considered a component of suicidal desire, an extremely important indicator of dangerousness across categories of mental disorders, including depression (Joiner et al., 2005). All the TDI-E items displayed no significant differences in the thresholds distances, suggesting that respondents discriminated properly between response options. Only item #6 showed two collapsed categories to achieve sequential order. As suggested by Bode (1997), ambivalent categories in rating scale (e.g., “do not know”) often share more noise than information and should be threatened as missing data, so the pivot point for collapsing categories may be in the middle of uncertain categories. Notably, elderly respondents with reduced working memory capacity were more prone to answer “do not know” or to choose ambivalent categories in difficult questions, compared to respondents with higher cognitive abilities (Knäuper et al., 1997, 2016).
Like the TDI, the TDI-E demonstrated no DIF with regard to participants’ age (65 vs. 75+ years) and gender. This means that all the TDI-E items performed equivalently for males and females, and for young old and old-old subjects (Garfein and Herzog, 1995; Mehta et al., 2008).
Prior evidence demonstrated that females showed an elevated risk of major depressive episode, and this risk increase in elderly females (+65 years) (Angst et al., 2002; Kessler et al., 2010). Potentially, this unbiased version of the TDI could allow an easy and efficient assessment of depression among elderly, thus avoiding the extensive use of differentiated norms (e.g., by gender or age) that are complex and may be difficult to communicate to general audiences or within a multidisciplinary team of experts.
The present study supported unidimensional construct of geriatric depression of the TDI-E. As revealed by the strict test of unidimensionality, neither subset of item from the factorial analysis of the residuals showed a significant difference on person estimates from the nine-item measure. Reliability, as measured by the PSI, was 0.83, an acceptable level especially for individual level data, which indicated not too large reduction from the PSI of 21-item TDI (0.96). A significant reduction of PSI values in short self-report measures derived from long self-report measures was expected (Davis et al., 2008; Shea et al., 2009). Unlike coefficient Cronbach’s alpha, the PSI was not affected (or inflated) by the test length (Mallinson et al., 2004). Nevertheless, a limited and homogenous range of items, e.g., items with a close range of abilities, potentially resulted in decreasing of variability detected or in an increasing the amount of error, leading to a decrease in reliability (Mallinson et al., 2004). The reliability issue could represent a limitation for the present study, since a small set of items has been selected from a homogenous sample of participants (mostly healthy), which potentially weakens the ability of the scale to differentiate people.
Teate Depression Inventory Cut-off Scores and Diagnostic Utility
Results from regression analysis also revealed the measurement precision of the TDI-E. The raw summed scores for the nine items of the TDI-E seemed to predict the Rasch-based scores expressed in logits and the appropriateness of the cubic function (Lin et al., 2019). In other words, there is a substantial equivalence on the precision of the TDI-E score as measure of depression, whether it is computed as raw summed score or as Rasch-based interval score.
The diagnostic performance of the TDI-E in detecting elderly people who meet clinical thresholds for depressive symptoms, analyzed by the ROC curves, identified the cut-off point of 18 for differentiating non-depressed and depressed respondents. This value could facilitate researchers and clinicians into maximizing the clinical utility of the TDI-E when using in an applied way. For example, in clinical setting, a cut-off score easily allows to differentiate potential cases of clinical depression (True Positive) from probable “non-cases” (False Positive) or make decisions about who to treat and what treatments to provide (Widiger and Samuel, 2005; Van Dam et al., 2013). However, for clinicians who use the TDI-E as a screening instrument in clinical settings, where a higher sensitivity may be required, sensitivities and specificities corresponding to alternative cut off points were provided (Table 5).
Finally, although it may very tempting, to use a cut-off score on a self-report inventory as the single means of deriving, a diagnosis is a practice that should be avoided (Nezu et al., 2000). Rather, respondents scoring above the established cut-off level should be interviewed to assess for the depressive disorders criteria found in the DSM5.
Teate Depression Inventory Norms
The presented normative data could offer important advancements for the interpretation of the self-report measure scores and enhance its usefulness for clinical and research applications. For example, the z and t scores, set out here, makes it possible to compare TDI-E scores with the distribution of summed scores arising from convergent/divergent measures of depression and anxiety (e.g., the GDS or the Geriatric Anxiety Inventory), both in the clinical and general population. Thus, researchers and clinicians could benefit from these data in order to estimate significant changes across treatment (especially in repeated assessment) and/or to perform a brief assessment of the patient’s depression severity. Moreover, the norms table provided makes the TDI-E scores comparable to the scores derived from other geriatric measures, even developed within the CTT.
Limitations
These results were based in a convenience sample almost exclusively composed of healthy and cognitive intact older people. They may not might be different in a depressed and/or cognitive impaired older population. Another limitation raises from the choice to use the Rasch model to shorten the TDI. Within the IRT models, analysis of Rasch is a fairly straightforward model and showed advantages and limitations. One limitation concerns the Rasch assumption of equal measurement error for each item (no discrimination parameters were provided, like in the 2PL model), as well as the possibility that a simple model may not fit the data. However, as Ryan outlined (Ryan, 1983), the inclusion of adjunctive parameters, i.e., the discrimination or guessing parameters (in the 2PL and 3PL models, respectively) could make potentially difficult and ambiguous the interpretation of item difficulties because all parameters are estimates simultaneously (Andrich, 2004, 2011; Han, 2012). Far from others IRT models, the Rasch model estimated a single person and item parameters; thus, the total score represents a sufficient statistic for the person parameter (Andrich and Marais, 2019). Further limitation concerns the lack of the investigation on test-retest reliability of this instrument and on the correlations with external measures for assessing its concurrent and discriminant validity.
Future investigations will be devoted (1) to verify if it displays validity coefficients with well-known depression and anxiety questionnaires currently used in the elderly; (2) to define its responsiveness to different contexts and different clinical samples (i.e., elderly with cognitive impairment or dementia); and (3) to examine if the TDI-E is composed of cultural-invariant items, which could then be applied in transcultural investigations free of bias.
The TDI has been translated in English and Portuguese, in order to be used as an outcome measure in internationally based longitudinal studies and clinical trials.
Conclusion
The present study explored the potential improvement in the psychometric performance of the 21-item TDI in the elderly by item refinement via Rasch analysis. This resulted in a short version of nine items, which was unidimensional, showed good internal construct validity, good reliability, and no signs of DIF due to gender and age. A specific cut-off point provided here could be more meaningful for screening purpose, as well as its normative data. To sum up, the TDI-E seems to be a valid and reliable tool for the screening of geriatric depression, with less risk of finding false positives due to overlapping of depression in elderly with other comorbid conditions. Its brevity could improve feasibility and compliance of older adults, mostly when several self-report measures are being used in a multidimensional psychological assessment in late life.
Data Availability Statement
The datasets generated for this study are available on request to the corresponding author.
Ethics Statement
The study was reviewed and approved by the Department of Psychological Sciences, Health and Territory, University of Chieti, Italy, Review Board. Data were collected during 2018-2019. All our procedures were in accordance with the ethical standards of the 1964 Declaration of Helsinki and its later amendments. Written informed consent was obtained from all individual participants included in the study.
Author Contributions
MB and LC designed the study. LC conducted the statistical analyses. MB, AS, and LC interpreted the data. MB and LC drafted the manuscript. All authors contributed toward drafting and revising the paper and agreed to be accountable for all aspects of the work.
Conflict of Interest
We declare a potential conflict of interests for some authors, those who have published the handbook for one of the tests analyzed in the present report (AS and MB–please see “References” section).
The remaining author declares that the research was conducted in the absence of any commercial or financial relationships that could be construed as a potential conflict of interest.
References
Albert, P. R. (2015). Why is depression more prevalent in women? J. Psychiatry Neurosci. 40, 219–221. doi: 10.1503/jpn.150205
American Psychiatric Association (2013). Diagnostic and statistical manual of mental disorders (DSM-5®). Arlington, VA: American Psychiatric Association.
Andiel, C. (1995). Rasch analysis: a description of the model and related issues. Can. J. Rehabil. 9, 17–26.
Andrich, D. (1982). An index of person separation in latent trait theory, the traditional KR. 20 index, and the Guttman scale response pattern. Educ. Res. Persp. 9, 95–104.
Andrich, D. (2004). Controversy and the Rasch model: a characteristic of incompatible paradigms? Med. Care 42, I7–I16. doi: 10.1097/01.mlr.0000103528.48582.7c
Andrich, D. (2011). Rating scales and Rasch measurement. Exper. Rev. Pharmacocon. Outcomes Res. 11, 571–585. doi: 10.1586/erp.11.59
Andrich, D., Lyne, A., Sheridan, B., and Luo, G. (2010). RUMM 2030. Perth, Western Australia, Australia: RUMM Laboratory Pty Ltd.
Andrich, D., and Marais, I. (2019). A course in Rasch measurement theory: Measuring in the educational, social and health sciences. Singapore: Springer.
Angst, J., Gamma, A., Gastpar, M., Lépine, J.-P., Mendlewicz, J., and Tylee, A. (2002). Gender differences in depression. Eur. Arch. Psy. Clin. N. 252, 201–209. doi: 10.1007/s00406-002-0381-6
Arean, P. A., and Ayalon, L. (2005). Assessment and treatment of depressed older adults in primary care. Clin. Psychol. Sci. Pr. 12, 321–335. doi: 10.1093/clipsy.bpi034
Baghaei, P. (2008). The Rasch model as a construct validation tool. Rasch Meas. Trans. 22, 1145–1146.
Balsamo, M., Carlucci, L., Sergi, M. R., Murdock, K. K., and Saggino, A. (2015a). The mediating role of early maladaptive schemas in the relation between co-rumination and depression in young adults. PLoS One 10:e0140177. doi: 10.1371/journal.pone.0140177
Balsamo, M., Carlucci, L., Sergi, M., and Saggino, A. (2016). Validazione della versione italiana del co-rumination questionnaire [validation of the Italian version of the co-rumination questionnaire]. Ital. J. Cogn. Behav. Psych. 22, 13–34.
Balsamo, M., Cataldi, F., Carlucci, L., Padulo, C., and Fairfield, B. (2018). Assessment of late-life depression via self-report measures: a review. Clin. Interv. Aging 13, 2021–2044. doi: 10.2147/CIA.S178943
Balsamo, M., Giampaglia, G., and Saggino, A. (2014). Building a new Rasch-based self-report inventory of depression. Neuropsychiatr. Dis. Treat. 10, 153–165. doi: 10.2147/NDT.S53425
Balsamo, M., Imperatori, C., Sergi, M. R., Belvederi Murri, M., Continisio, M., Tamburello, A., et al. (2013a). Cognitive vulnerabilities and depression in young adults: an ROC curves analysis. Depress. Res. Treat. 2013, 1–8. doi: 10.1155/2013/407602
Balsamo, M., Innamorati, M., and Lamis, D. A. (2019). Editorial in the research topic clinical psychometrics: old issues and new perspectives. Front. Psychol. 10:947. doi: 10.3389/fpsyg.2019.00947
Balsamo, M., Innamorati, M., Van Dam, N. T., Carlucci, L., and Saggino, A. (2015b). Measuring anxiety in the elderly: psychometric properties of the state trait inventory of cognitive and somatic anxiety (STICSA) in an elderly Italian sample. Int. Psychogeriatr. 27, 999–1008. doi: 10.1017/S1041610214002634
Balsamo, M., Macchia, A., Carlucci, L., Picconi, L., Tommasi, M., Gilbert, P., et al. (2015c). Measurement of external shame: an inside view. J. Pers. Assess. 97, 81–89. doi: 10.1080/00223891.2014.947650
Balsamo, M., Romanelli, R., Innamorati, M., Ciccarese, G., Carlucci, L., and Saggino, A. (2013b). The state-trait anxiety inventory: shadows and lights on its construct validity. J. Psychopathol. Behav. Assess. 35, 475–486. doi: 10.1007/s10862-013-9354-5
Balsamo, M., and Saggino, A. (2007). Test per l’assessment della depressione nel contesto italiano: un’analisi critica. Ital. J. Cogn. Behav. Psych. 13, 167–199.
Balsamo, M., and Saggino, A. (2013). Il Teate depression inventory-Manuale [Teate depression inventory, manual]. Florence: Hoegrefe.
Balsamo, M., and Saggino, A. (2014). Determining a diagnostic cut-off on the Teate Depression Inventory. Neuropsychiatr. Dis. Treat. 10, 987–995. doi: 10.2147/NDT.S55706
Beck, A. T., Steer, R. A., and Brown, G. K. (1996). Beck depression inventory-II. San Antonio 78, 490–498.
Beekman, A. T., de Beurs, E., van Balkom, A. J., Deeg, D. J., van Dyck, R., and van Tilburg, W. (2000). Anxiety and depression in later life: co-occurrence and communality of risk factors. Am. Psychiat. 157, 89–95. doi: 10.1176/ajp.157.1.89
Bent-Hansen, J., Lunde, M., Klysner, R., Andersen, M., Tanghøj, P., Solstad, K., et al. (2003). The validity of the depression rating scales in discriminating between citalopram and placebo in depression recurrence in the maintenance therapy of elderly unipolar patients with major depression. Pharmacopsychiatry 36, 313–316. doi: 10.1055/s-2003-45120
Bradley, A. P. (1997). The use of the area under the ROC curve in the evaluation of machine learning algorithms. Pattern Recogn. 30, 1145–1159. doi: 10.1016/S0031-3203(96)00142-2
Breeman, S., Cotton, S., Fielding, S., and Jones, G. T. (2015). Normative data for the hospital anxiety and depression scale. Qual. Life Res. 24, 391–398. doi: 10.1007/s11136-014-0763-z
Brown, P. J., Woods, C. M., and Storandt, M. (2007). Model stability of the 15-item geriatric depression scale across cognitive impairment and severe depression. Psychol. Aging 22, 372–379. doi: 10.1037/0882-7974.22.2.372
Carlucci, L., D’Ambrosio, I., Innamorati, M., Saggino, A., and Balsamo, M. (2018a). Co-rumination, anxiety, and maladaptive cognitive schemas: when friendship can hurt. Psychol. Res. Behav. Manag. 2018, 133–144. doi: 10.2147/PRBM.S144907
Carlucci, L., Watkins, M. W., Sergi, M. R., Cataldi, F., Saggino, A., and Balsamo, M. (2018b). Dimensions of anxiety, age, and gender: assessing dimensionality and measurement invariance of the state-trait for cognitive and somatic anxiety (STICSA) in an Italian sample. Front. Psychol. 9:2345. doi: 10.3389/fpsyg.2018.02345
Castle, N. G., and Engberg, J. (2004). Response formats and satisfaction surveys for elders. Gerontologist 44, 358–367. doi: 10.1093/geront/44.3.358
Chachamovich, E., Fleck, M. P., and Power, M. (2010). Is geriatric depression scale-15 a suitable instrument for measuring depression in Brazil? Results of a Rasch analysis. Psychol. Health Med. 15, 596–606. doi: 10.1080/13548506.2010.487108
Cheung, Y. B., Liu, K. Y., and Yip, P. S. (2007). Performance of the CES-D and its short forms in screening suicidality and hopelessness in the community. Suicide Life Threat. Behav. 37, 79–88. doi: 10.1521/suli.2007.37.1.79
Chiang, K. S., Green, K. E., and Cox, E. O. (2009). Rasch analysis of the geriatric depression scale–short form. Gerontologist 49, 262–275. doi: 10.1093/geront/gnp018
Clark, L. A., and Watson, D. (1991). Tripartite model of anxiety and depression: psychometric evidence and taxonomic implications. J. Abnorm. Psychol. 100:316. doi: 10.1037/0021-843X.100.3.316
Crockett, L. J., Randall, B. A., Shen, Y. L., Russell, S. T., and Driscoll, A. K. (2005). Measurement equivalence of the center for epidemiological studies depression scale for Latino and Anglo adolescents: a national study. J. Consult. Clin. Psychol. 73, 47–58. doi: 10.1037/0022-006X.73.1.47
Cusin, C., Yang, H., Yeung, A., and Fava, M. (2009). “Rating scales for depression” in Handbook of clinical rating scales and assessment in psychiatry and mental health. eds. L. Baer and M. Blais (Totowa, NJ: Humana Press), 7–35.
da Rocha, N. S., Chachamovich, E., de Almeida Fleck, M. P., and Tennant, A. (2013). An introduction to Rasch analysis for psychiatric practice and research. J. Psychiatr. Res. 47, 141–148. doi: 10.1016/j.jpsychires.2012.09.014
Davis, A., Perruccio, A., Canizares, M., Tennant, A., Hawker, G., Conaghan, P., et al. (2008). The development of a short measure of physical function for hip OA HOOS-physical function Shortform (HOOS-PS): an OARSI/OMERACT initiative. Osteoarthr. Cartil. 16, 551–559. doi: 10.1016/j.joca.2007.12.016
Edelstein, B. A., Woodhead, E. L., Segal, D. L., Heisel, M. J., Bower, E. H., Lowery, A. J., et al. (2007). Older adult psychological assessment: current instrument status and related considerations. Clin. Gerontol. 31, 1–35. doi: 10.1080/07317110802072108
Efron, B., and Tibshirani, R. J. (1993). An introduction to the bootstrap. Boca Raton, FL: Chapman & Hall.
Embretson, S. E., and Reise, S. P. (2000). Multivariate applications books series. Item response theory for psychologists. Mahwah, NJ, US: Lawrence Erlbaum Associates Publishers.
Faravelli, C., Albanesi, G., and Poli, E. (1986). Assessment of depression: a comparison of rating scales. J. Affect. Disord. 11, 245–253. doi: 10.1016/0165-0327(86)90076-5
First, M. B., Spitzer, R. L., Gibbon, M., and Williams, J. B. W. (1997). Structured clinical interview for DSM-IV axis I disorders (SCID I). New York: Biometric Research Department.
Fiske, A., Wetherell, J. L., and Gatz, M. (2009). Depression in older adults. Annu. Rev. Clin. Psychol. 5, 363–389. doi: 10.1146/annurev.clinpsy.032408.153621
Forkmann, T., Boecker, M., Wirtz, M., Eberle, N., Westhofen, M., Schauerte, P., et al. (2009). Development and validation of the Rasch-based depression screening (DESC) using Rasch analysis and structural equation modelling. J. Behav. Ther. Exp. Psychiatry 40, 468–478. doi: 10.1016/j.jbtep.2009.06.003
Forkmann, T., Gauggel, S., Spangenberg, L., Brähler, E., and Glaesmer, H. (2013). Dimensional assessment of depressive severity in the elderly general population: psychometric evaluation of the PHQ-9 using Rasch analysis. J. Affect. Disord. 148, 323–330. doi: 10.1016/j.jad.2012.12.019
Frank, C. C., Feldman, S., and Wyman, R. (2018). Caring for older patients in primary care: wisdom and innovation from Canadian family physicians. Can. Fam. Physician 64, 416–418.
Friedman, B., Conwell, Y., and Delavan, R. L. (2007). Correlates of late-life major depression: a comparison of urban and rural primary care patients. Am. J. Geriatr. Psychiatry 15, 28–41. doi: 10.1097/01.JGP.0000224732.74767.ad
Friedman, B., Heisel, M. J., and Delavan, R. L. (2005). Psychometric properties of the 15-item geriatric depression scale in functionally impaired, cognitively intact, community-dwelling elderly primary care patients. J. Am. Geriatr. Soc. 53, 1570–1576. doi: 10.1111/j.1532-5415.2005.53461.x
Garfein, A. J., and Herzog, A. R. (1995). Robust aging among the young-old, old-old, and oldest-old. J. Gerontol. Ser. B Psychol. Sci. Soc. Sci. 50, S77–S87.
Gibbons, C. J., Mills, R. J., Thornton, E. W., Ealing, J., Mitchell, J. D., Shaw, P. J., et al. (2011). Rasch analysis of the hospital anxiety and depression scale (HADS) for use in motor neurone disease. Health Qual. Life Outcomes 9:82. doi: 10.1186/1477-7525-9-82
Gilchrist, G., and Gunn, J. (2007). Observational studies of depression in primary care: what do we know? BMC Fam. Pract. 8:28. doi: 10.1186/1471-2296-8-28
Grover, S., and Malhotra, N. (2015). Depression in elderly: a review of Indian research. J. Geriatr. Ment. Health 2, 4–15. doi: 10.4103/2348-9995.161376
Han, K. T. (2012). Fixing the c parameter in the three-parameter logistic model. Pract. Assess. Res. Eval. 17, 1–24. Retrieved from: http://pareonline.net/getvn.asp?v=17&n=1
Hanley, J. A., and McNeil, B. J. (1982). The meaning and use of the area under a receiver operating characteristic (ROC) curve. Radiology 143, 29–36. doi: 10.1148/radiology.143.1.7063747
Incalzi, R. A., Cesari, M., Pedone, C., and Carbonin, P. U. (2003). Construct validity of the 15-item geriatric depression scale in older medical inpatients. J. Geriatr. Psychiatry Neurol. 16, 23–28. doi: 10.1177/0891988702250532
Innamorati, M., Lester, D., Balsamo, M., Erbuto, D., Ricci, F., Amore, M., et al. (2014). Factor validity of the Beck Hopelessness Scale in Italian medical patients. J. Psychopathol. Behav. 36, 300–307. doi: 10.1007/s10862-013-9380-3
Innamorati, M., Tamburello, S., Contardi, A., Imperatori, C., Tamburello, A., Saggino, A., et al. (2013). Psychometric properties of the attitudes toward self-revised in Italian young adults. Depress. Res. Treat. 2013, 1–6. doi: 10.1155/2013/209216
Joiner, T. E. Jr., Walker, R. L., Pettit, J. W., Perez, M., and Cukrowicz, K. C. (2005). Evidence-based assessment of depression in adults. Psychol. Assess. 17, 267–277. doi: 10.1037/1040-3590.17.3.267
Jongenelis, K., Pot, A. M., Eisses, A. M. H., Gerritsen, D. L., Derksen, M., Beekman, A. T. F., et al. (2005). Diagnostic accuracy of the original 30-item and shortened versions of the geriatric depression scale in nursing home patients. Int. J. Geriatr. Psychiatry 20, 1067–1074. doi: 10.1002/gps.1398
Kennedy, G. J., Castro, J., Chang, M., Chauhan-James, J., and Fishman, M. (2016). Psychiatric and medical comorbidity in the primary care geriatric patient—an update. Curr psychiatry Rev 18:62. doi: 10.1007/s11920-016-0700-7
Kessler, R. C., Birnbaum, H., Bromet, E., Hwang, I., Sampson, N., and Shahly, V. (2010). Age differences in major depression: results from the National Comorbidity Survey Replication (NCS-R). Psychol. Med. 40, 225–237. doi: 10.1017/S0033291709990213
Knäuper, B., Belli, R. F., Hill, D. H., and Herzog, A. R. (1997). Question difficulty and respondents’ cognitive ability: the effect on data quality. J. Off. Stat. 13, 181–199.
Knäuper, B., Carrière, K., Chamandy, M., Xu, Z., Schwarz, N., and Rosen, N. O. (2016). How aging affects self-reports. Eur. J. Ageing 13, 185–193. doi: 10.1007/s10433-016-0369-0
Koenig, H. G., Cohen, H. J., Blazer, D. G., Krishnan, K. R. R., and Sibert, T. E. (1993). Profile of depressive symptoms in younger and older medical inpatients with major depression. J. Am. Geriatr. Soc. 41, 1169–1176. doi: 10.1111/j.1532-5415.1993.tb07298.x
Lamoureux, E. L., Tee, H. W., Pesudovs, K., Pallant, J. F., Keeffe, J. E., and Rees, G. (2009). Can clinicians use the PHQ-9 to assess depression in people with vision loss? Optom. Vis. Sci. 86, 139–145. doi: 10.1097/OPX.0b013e318194eb47
Lee, Y.-W. (2004). Examining passage-related local item dependence (LID) and measurement construct using Q3 statistics in an EFL reading comprehension test. Lang. Test. 21, 74–100. doi: 10.1191/0265532204lt260oa
Lewinsohn, P. M., Petit, J. W., Joiner, T. E. Jr., and Seeley, J. R. (2003). The symptomatic expression of major depressive disorder in adolescents and young adults. J. Abnorm. Psychol. 112, 244–252. doi: 10.1037/0021-843X.112.2.244
Lichtenberg, P. A. (2010). Handbook of assessment in clinical gerontology. Burlington, MA: Academic Press.
Lin, C.-Y., Hwang, J.-S., Wang, W.-C., Lai, W.-W., Su, W.-C., Wu, T.-Y., et al. (2019). Psychometric evaluation of the WHOQOL-BREF, Taiwan version, across five kinds of Taiwanese cancer survivors: Rasch analysis and confirmatory factor analysis. J. Formos. Med. Assoc. 118, 215–222. doi: 10.1016/j.jfma.2018.03.018
Linacre, J. M. (1998). Structure in Rasch residuals: why principal components analysis. Rasch Meas. Trans. 12:636
Linden, M., Borchelt, M., Barnow, S., and Geiselmann, B. (1995). The impact of somatic morbidity on the Hamilton depression rating scale in the very old. Acta Psychiatr. Scand. 92, 150–154. doi: 10.1111/j.1600-0447.1995.tb09559.x
Luber, M. P., Meyers, B. S., Williams-Russo, P. G., Hollenberg, J. P., DiDomenico, T. N., Charlson, M. E., et al. (2001). Depression and service utilization in elderly primary care patients. Am. J. Geriat. Psych. 9, 169–176. doi: 10.1097/00019442-200105000-00009
Lundgren-Nilsson, Å., Jonsdottir, I. H., Ahlborg, G., and Tennant, A. (2013). Construct validity of the psychological general well being index (PGWBI) in a sample of patients undergoing treatment for stress-related exhaustion: a Rasch analysis. Health Qual. Life Outcomes 11:2. doi: 10.1186/1477-7525-11-2
Lyness, J. M., Cox, C., Curry, J., Conwell, Y., King, D. A., and Caine, E. D. (1995). Older age and the underreporting of depressive symptoms. J. Am. Geriatr. Soc. 43, 216–221. doi: 10.1111/j.1532-5415.1995.tb07325.x
Mallinson, T., Stelmack, J., and Velozo, C. (2004). A comparison of the separation ratio and coefficient α in the creation of minimum item sets. Med. Care, I17–I24. doi: 10.1097/01.mlr.0000103522.78233.c3
Marais, I. (2013). “Local dependence” in Rasch Models in Health. eds. K. B. Christensen, S. Kreiner, and M. Mesbah (London, UK and Hoboken, NJ: Wiley-ISTE Ltd), 111–130.
Mehta, M., Whyte, E., Lenze, E., Hardy, S., Roumani, Y., Subashan, P., et al. (2008). Depressive symptoms in late life: associations with apathy, resilience and disability vary between young-old and old-old. Int. J. Geriat. Psych. 23, 238–243. doi: 10.1002/gps.1868
Mitchell, A. J., Bird, V., Rizzo, M., and Meader, N. (2010a). Diagnostic validity and added value of the geriatric depression scale for depression in primary care: a meta-analysis of GDS30 and GDS15. J. Affect. Disord. 125, 10–17. doi: 10.1016/j.jad.2009.08.019
Mitchell, A. J., Bird, V., Rizzo, M., and Meader, N. (2010b). Which version of the geriatric depression scale is most useful in medical settings and nursing homes? Diagnostic validity meta-analysis. Am. J. Geriatr. Psychiatry 18, 1066–1077. doi: 10.1097/jgp.0b013e3181f60f81
Mokken, R. J. (1971). A theory and procedure of scale analysis: With applications in political research. Berlin, Germany: Walter de Gruyter.
Moran, L. A., Guyatt, G. H., and Norman, G. R. (2001). Establishing the minimal number of items for a responsive, valid, health-related quality of life instrument. J. Clin. Epidemiol. 54, 571–579. doi: 10.1016/S0895-4356(00)00342-5
Nezu, A. M., Ronan, G. F., Meadows, E. A., and McClure, K. S. (2000). Practitioner’s guide to empirically-based measures of depression. Dordrecht, Netherlands: Kluwer Academic Publishers.
Oliffe, J. L., and Phillips, M. J. (2008). Men, depression and masculinities: A review and recommendations. J. Men’s Health 5, 194–202. doi: 10.1016/j.jomh.2008.03.016
Osman, A., Kopper, B. A., Barrios, F., Gutierrez, P. M., and Bagge, C. L. (2004). Reliability and validity of the Beck depression inventory--II with adolescent psychiatric inpatients. Psychol. Assess. 16, 120–132. doi: 10.1037/1040-3590.16.2.120
Picconi, L., Balsamo, M., Palumbo, R., and Fairfield, B. (2018a). Testing factor structure and measurement invariance across gender with Italian geriatric anxiety scale. Front. Psychol. 9:1164. doi: 10.3389/fpsyg.2018.01164
Picconi, L., Jackson, C. J., Balsamo, M., Tommasi, M., and Saggino, A. (2018b). Factor structure and measurement invariance across groups of the Italian Eysenck Personality Questionnaire-Short Form (EPP-S). Pers. Ind. Differ. 123, 76–80. doi: 10.1016/j.paid.2017.11.013
Pocklington, C., Gilbody, S., Manea, L., and McMillan, D. (2016). The diagnostic accuracy of brief versions of the geriatric depression scale: a systematic review and meta-analysis. Int J. Geriatr. Psychiatry 31, 837–857. doi: 10.1002/gps.4407
Radloff, L. S. (1977). The CES-D scale: A self-report depression scale for research in the general population. Appl. Psychol. Meas. 1, 385–401.
Raju, D., Su, X., and Patrician, P. A. (2014). Using item response theory models to evaluate the practice environment scale. J. Nurs. Meas. 22, 323–341. doi: 10.1891/1061-3749.22.2.323
Rasch, G. (1960). Studies in mathematical psychology: I. probabilistic models for some intelligence and attainment tests. Oxford, England: Nielsen & Lydiche.
Rodda, J., Walker, Z., and Carter, J. (2011). Depression in older adults. BMJ 343:d5219. doi: 10.1136/bmj.d5219
Roose, S. P., Sackeim, H. A., Krishnan, K. R. R., Pollock, B. G., Alexopoulos, G., Lavretsky, H., et al. (2004). Antidepressant pharmacotherapy in the treatment of depression in the very old: a randomized, placebo-controlled trial. Am. J. Psychiatr. 161, 2050–2059. doi: 10.1176/appi.ajp.161.11.2050
Ryan, J. P. (1983). “Introduction to latent trait analysis and item response theory” in Testing in the schools new directions for testing and measurement. ed. W. E. Hathaway (San Francisco, CA: Jossey-Bass), 48–64.
Saggino, A., Carlucci, L., Sergi, M. R., D’Ambrosio, I., Fairfield, B., Cera, N., et al. (2017). A validation study of the psychometric properties of the other as Shamer scale–2. SAGE Open 7, 1–10. doi: 10.1177/2158244017704241
Salzberger, T. (2010). Does the Rasch model convert an ordinal scale into an interval scale. Rasch Meas. Trans. 24, 1273–1275.
Santor, D. A., Ramsay, J., and Zuroff, D. C. (1994). Nonparametric item analyses of the Beck Depression Inventory: Evaluating gender item bias and response option weights. Psychol. Assess. 6:255.
Shea, T. L., Tennant, A., and Pallant, J. F. (2009). Rasch model analysis of the Depression, Anxiety and Stress Scales (DASS). BMC Psychiatry 9:21. doi: 10.1186/1471-244X-9-21
Sheikh, J. I., Cassidy, E. L., Doraiswamy, P. M., Salomon, R. M., Hornig, M., Holland, P. J., et al. (2004). Efficacy, safety, and tolerability of sertraline in patients with late-life depression and comorbid medical illness. J. Am. Geriatr. Soc. 52, 86–92. doi: 10.1111/j.1532-5415.2004.52015.x
Sijtsma, K., Meijer, R. R., and van der Ark, L. A. (2011). Mokken scale analysis as time goes by: an update for scaling practitioners. J. Pers. Ind. Differ. 50, 31–37. doi: 10.1016/j.paid.2010.08.016
Sijtsma, K., and Molenaar, I. W. (2002). Introduction to nonparametric item response theory. Thousand Oaks, CA: Sage.
Smith, J. E. (2002). Detecting and evaluating the impact of multidimensionality using item fit statistics and principal component analysis of residuals. J. Appl. Meas. 3, 205–231.
Smith, R. M., and Miao, C. Y. (1994). Assessing unidimensionality for Rasch measurement. Obj. Meas. 2, 316–327.
Sözeri-Varma, G. (2012). Depression in the elderly: clinical features and risk factors. Aging Dis. 3, 465–471.
Spangenberg, L., Glaesmer, H., Boecker, M., and Forkmann, T. (2015). Differences in patient health questionnaire and Aachen depression item Bank scores between tablet versus paper-and-pencil administration. Qual. Life Res. 24, 3023–3032. doi: 10.1007/s11136-015-1040-5
Storch, E. A., Roberti, J. W., and Roth, D. A. (2004). Factor structure, concurrent validity, and internal consistency of the beck depression inventory—second edition in a sample of college students. Depress. Anxiety 19, 187–189. doi: 10.1002/da.20002
Swets, J. A., Dawes, R. M., and Monahan, J. (2000). Psychological science can improve diagnostic decisions. Psychol. Sci. Public Interest 1, 1–26. doi: 10.1111/1529-1006.001
Tang, W. K., Wong, E., Chiu, H. F., Lum, C., and Ungvari, G. S. (2005). The Geriatric Depression Scale should be shortened: results of Rasch analysis. Int. J. Geriatr. Psychiatry 20, 783–789. doi: 10.1002/gps.1360
Tennant, A., and Conaghan, P. G. (2007). The Rasch measurement model in rheumatology: what is it and why use it? When should it be applied, and what should one look for in a Rasch paper? Arthritis Care Res. 57, 1358–1362. doi: 10.1002/art.23108
Tennant, A., McKenna, S. P., and Hagell, P. (2004). Application of Rasch analysis in the development and application of quality of life instruments. Value Health 7, S22–S26. doi: 10.1111/j.1524-4733.2004.7s106.x
Therrien, Z., and Hunsley, J. (2012). Assessment of anxiety in older adults: a systematic review of commonly used measures. Aging Ment. Health 16, 1–16. doi: 10.1080/13607863.2011.602960
Thombs, B. D., Magyar-Russell, G., Bass, E. B., Stewart, K. J., Tsilidis, K. K., Bush, D. E., et al. (2007). Performance characteristics of depression screening instruments in survivors of acute myocardial infarction: review of the evidence. Psychosomatics 48, 185–194. doi: 10.1176/appi.psy.48.3.185
Tommasi, M., Ferrara, G., and Saggino, A. (2018). Application of Bayes' theorem in valuating depression tests performance. Front. Psychol. 9:1240. doi: 10.3389/fpsyg.2018.01240
Unützer, J., Katon, W., Callahan, C. M., Williams, J. W. Jr., Hunkeler, E., Harpole, L., et al. (2002). Collaborative care management of late-life depression in the primary care setting: a randomized controlled trial. JAMA 288, 2836–2845. doi: 10.1001/jama.288.22.2836
Unützer, J., Patrick, D. L., Diehr, P., Simon, G., Grembowski, D., and Katon, W. (2000). Quality adjusted life years in older adults with depressive symptoms and chronic medical disorders. Int. Psychogeriatr. 12, 15–33. doi: 10.1017/S1041610200006177
Van Dam, N. T., Gros, D. F., Earleywine, M., and Antony, M. M. (2013). Establishing a trait anxiety threshold that signals likelihood of anxiety disorders. Anxiety Stress Coping 26, 70–86. doi: 10.1080/10615806.2011.631525
Widiger, T. A., and Samuel, D. B. (2005). Diagnostic categories or dimensions? A question for the diagnostic and statistical manual of mental disorders. J. Abnorm. Psychol. 114, 494–504. doi: 10.1037/0021-843X.114.4.494
Wohlreich, M. M., Mallinckrodt, C. H., Watkin, J. G., and Hay, D. P. (2004). Duloxetine for the long-term treatment of major depressive disorder in patients aged 65 and older: an open-label study. BMC Geriatr. 4:11. doi: 10.1186/1471-2318-4-11
Wongpakaran, N., Wongpakaran, T., and Kuntawong, P. (2019). Evaluating hierarchical items of the geriatric depression scale through factor analysis and item response theory. Heliyon 5:e02300. doi: 10.1016/j.heliyon.2019.e02300
Wright, B. D. (1996). Local dependency, correlations and principal components. Rasch Meas. Trans. 10, 509–511.
Yesavage, J. A., Brink, T. L., Rose, T. L., Lum, O., Huang, V., Adey, M., et al. (1982). Development and validation of a geriatric depression screening scale: a preliminary report. J. Psychiatr. Res. 17, 37–49.
Yesavage, J. A., and Sheikh, J. I. (1986). 9/geriatric depression scale (GDS) recent evidence and development of a shorter version. Clin. Gerontol. 5, 165–173.
Zhou, X. H., Obuchowski, N. A., and McClish, D. K. (2002). Statistical methods in diagnostic medicine. New York, NY: Wiley & Sons.
Ziegler, M., and Hagemann, D. (2015). Testing the unidimensionality of items. EJPA 31, 231–237. doi: 10.1027/1015-5759/a000309
Keywords: depression, elderly, late-life, adults, Rasch analysis, item response theory
Citation: Balsamo M, Saggino A and Carlucci L (2019) Tailored Screening for Late-Life Depression: A Short Version of the Teate Depression Inventory (TDI-E). Front. Psychol. 10:2693. doi: 10.3389/fpsyg.2019.02693
Edited by:
Pietro Cipresso, Italian Auxological Institute (IRCCS), ItalyReviewed by:
Chung-Ying Lin, Hong Kong Polytechnic University, Hong KongRoger Muñoz Navarro, University of Valencia, Spain
Copyright © 2019 Balsamo, Saggino and Carlucci. This is an open-access article distributed under the terms of the Creative Commons Attribution License (CC BY). The use, distribution or reproduction in other forums is permitted, provided the original author(s) and the copyright owner(s) are credited and that the original publication in this journal is cited, in accordance with accepted academic practice. No use, distribution or reproduction is permitted which does not comply with these terms.
*Correspondence: Michela Balsamo, bS5iYWxzYW1vQHVuaWNoLml0; bWljaGVsYS5iYWxzYW1vQHVuaWNoLml0