 Yutong Wang
 Xiaojian Sun
 Weifeng Chong
 Tao Xin
- 1Collaborative Innovation Center of Assessment for Basic Education Quality, Beijing Normal University, Beijing, China
- 2School of Mathematics and Statistics, Southwest University, Chongqing, China
We propose a new method that balances attribute coverage for short-length cognitive diagnostic computerized adaptive testing (CD-CAT). The new method uses the attribute discrimination index (ADI-based method) instead of the number of items that measure each attribute [modified global discrimination index (MGDI)-based method] to balance the attribute coverage. Therefore, the information that each attribute provides can be captured. The purpose of the simulation study was to evaluate the performance of the new method, and the results showed the following: (a) Compared with uncontrolled attribute-balance coverage method, the new method produced a higher mastery pattern correct classification rate (PCCR) and attribute correct classification rate (ACCR) with both the posterior-weighted Kullback–Leibler (PWKL) and the modified PWKL (MPWKL) item selection method. (b) Equalization of ACCR (E-ACCR) based on the ADI-based method leads to better results, followed by the MGDI-based method. The uncontrolled method leads to the worst results regardless of item selection methods. (c) Both the ADI-based and MGDI-based methods produced acceptable examinee qualification rates, regardless of item selection methods, although they were relatively low for the uncontrolled condition.
Introduction
Cognitive diagnostic assessment (CDA) has become popular in test theory research in recent years, which is developed to measure the cognitive skills of examinees (Leighton and Gierl, 2007; Gierl et al., 2008). Compared with classical test theory (CTT) and the most commonly used unidimensional item response theory (UIRT), which only provide overall scores to examinees, and multidimensional item response theory (MIRT), which provides both overall score and subscale scores, CDA can provide more detailed information about strengths and weaknesses of examinees for a specific content domain, so that administrators can identify whether or not examinees possess the attributes (Yao and Boughton, 2007; Lee et al., 2012). Evidence should be obtained of model fit when IRT models are used in real test data, and it is the same with CDA models (Sinharay and Haberman, 2014). Otherwise, the misfit of models may lead to a misleading conclusion.
Computerized adaptive testing (CAT) combines test theory with computer technology to improve testing efficiency, which has become a promising method in psychological and educational measurement. CAT can provide equivalent or even higher measurement accuracy of examinees' latent skills, with reductions in test length of up to 50%, compared with traditional paper-and-pencil tests (Weiss, 1982). Further, items administered in the test are matched with examinees' estimated latent trait level (Mao and Xin, 2013; Chang, 2015). Recently, to maximize the benefits of both CDA and CAT, researchers have attempted to combine CDA with CAT and named it cognitive diagnostic CAT (Xu et al., 2003; McGlohen and Chang, 2008; Cheng, 2009a; CD-CAT).
In CD-CAT, many factors can affect the reliability and validity of the test, one of which is the balance of attribute-level coverage (Cheng, 2010; Mao and Xin, 2013). Cheng (2010) pointed out that it is very important to make sure that each attribute in the test has been measured adequately or the reliability of the test will not be reduced. Furthermore, test validity will be at risk because of inadequate attribute coverage (Cheng, 2010). To balance attribute coverage in CD-CAT, Cheng (2010) developed the modified maximum global discrimination index (MMGDI) to build the item selection method. The MMGDI method is based on the global discrimination index (GDI) developed by Xu et al. (2003). The mechanism of MMGDI is to accumulate the Kullback–Leibler (KL) information between conditional distribution given estimated pattern profile and conditional distribution given each of all possible candidate pattern profiles. However, there is a problem that the GDI method eliminates the coverage at the attribute level. To overcome that shortcoming, the MMGDI method uses the maximum priority index (MPI) method to balance attribute coverage (Cheng and Chang, 2009). In the simulation study, Cheng (2010) showed that the new item selection method not only improved the attribute correct classification rate (ACCR) and the rate of attribute master pattern (AMP) but also improved the validity of the test.
The findings from Cheng (2010) indicated that the correct classification rate had increased when the number of items measuring each attribute is adequate, which implied that there is a positive correlation between the numbers of items measuring each attribute and the correct classification rate. However, Finkelman et al. (2009) pointed out that, in some situations, even if the test contained adequate numbers of items to measure each attribute, different measurement accuracy could occur across the attributes. In other words, the number of items measuring each attributes maybe not the essential factor that affects the measurement accuracy of latent skills.
Note that based on the information that each item provided, CAT can produce accurate estimates of latent skills with lesser items. We can infer that the information each item provided may be the essential factor that affects the accuracy of latent skills and affects the attribute measurement precision. Consequently, we investigated the argument whether the information that each attribute provided can be utilized as the index to balance attribute coverage.
The purpose of the current study is to explore a new method based on the information provided by each attribute, instead of the number of items used in the test to measure each attribute in CD-CAT. The major benefit of this approach is to balance the attribute coverage in a short-length test. There are several reasons for choosing a short-length test: First, CDAs can be used to design as low-stake testing, and they help teachers or administrators to understand the performance of students and thus determine what should be done to improve the students' performance (Roussos et al., 2007; Hartz and Roussos, 2008; Mao and Xin, 2013; Kaplan et al., 2015). As a consequence, cognitive diagnostic tests would be conducted more frequently than traditional tests in some areas such as interim assessment (Roussos et al., 2007; Hartz and Roussos, 2008; Mao and Xin, 2013; Kaplan et al., 2015). When CD-CAT is applied to interim assessment, the AMPs of students should be obtained with short-length tests (Zheng and Chang, 2016). Second, to the best of our knowledge, among the studies focused on short-length test, there are only two applied that CD-CAT. The first one is practiced by Wang (2013), who introduced the mutual information (MI) item selection method in CD-CAT. And the second one is practiced by Zheng and Chang (2016), who developed two high-efficiency algorithms to select items in CD-CAT. But no study appears to have considered the situation that balances attribute coverage in the test.
The remainder of the present paper is organized as follows. The Reduced Reparameterized Unified Model section introduces the cognitive diagnostic model (CDM) that we have used in this study. The Item Selection Methods section presents two chosen methods, PWKL and MPWKL information for CD-CAT. After that, we introduce two methods to balance attribute coverage: one is to balance the number of items that measures each attribute and the other one is to balance the information that each attribute provides. In a further section, we report the results of a simulation study to evaluate the performance of the novel balanced attribute coverage method.
Reduced Reparameterized Unified Model
We used the reduced reparameterized unified model (RRUM) in the current study (Hartz, 2002), because previous studies have demonstrated that its prototype, the RUM, is very useful for formative assessment in practice (Jang, 2005; Wang et al., 2011). RRUM has gained more attention for educational assessment by researchers in recent years (Kim, 2011; Feng et al., 2013; Chiu et al., 2016). Chiu et al. (2016) also pointed out that RRUM has more flexibility than the “deterministic inputs, noisy ‘and' gate” (DINA) model proposed by Junker and Sijtsma (2001). The item response function of the RRUM can be written as
where αi = (αi1, αi2, …, αiK) is the AMP of examinee i; ηi is the residual ability parameter of examinee i, which represents the latent trait account for attributes that are not included in the Q-matrix (McGlohen and Chang, 2008); K is the number of attributes. represents the probability that examinee i possesses all of the required attributes for item j and correctly applies them, which is formulated as . And represents the ratio that examinee i lacks attribute k but correctly applies it to item j, which can be written as P(Yijk = 1|αik = 0), and examinee i possesses attribute k and correctly applies it to item j, which can be written as P(Yijk = 1|αik = 1), so can be described as
where qjk is the attribute that item j measured, and qjk = 1 presents if item j measures attribute k, otherwise qjk = 0.
Item Selection Methods
Posterior-Weighted Kullback–Leibler Information Method
KL information assumes that all candidate AMPs, αc, share probabilities equally that belong to the true AMP for each examinee at each step of item selection. Cheng (2009a,b) commented that this assumption was unnecessary and may lead to low test efficiency. Cheng also pointed out that different candidate AMPs should have different probabilities to be the true AMP, and then he proposed a new item selection method that considered the posterior probability of examinees' responses. That modified approach was termed PWKL information:
and
where L(αc|Xt−1) is the likelihood function, Xt−1 is response vector of t − 1 items, and p(αc) is the prior distribution of αc. The item t will be selected for a specific examinee with maximum PWKL information. Simulation studies have shown that PWKL information outperformed KL information and Shannon entropy (SHE) algorithms in most aspects (Cheng, 2009a,b; Wang, 2013).
Modified Posterior-Weighted Kullback–Leibler Information Method
The MPWKL method modifies the PWKL method to lead to a more reasonable result, especially in short-length test (Kaplan et al., 2015). The PWKL method uses point estimate, whereas the MPWKL method uses the entire posterior distribution. Thus, more information can be gained from the MPWKL than the PWKL method. The MPWKL information method is shown as follows:
Methods For Balancing Attribute Coverage
Balance Attribute Coverage Based on Number of Items That Measure Each Attribute
Cheng and Chang (2009) introduced the MPI method to select items to meet the constraints in IRT-based CAT. Later, Cheng (2010) extended the MPI method to CD-CAT for balancing attribute coverage. The definition of the attribute-balance index (ABI) is
where Bk is the lower bound of the number of items required to measure attribute k, bk is the number of items measuring attribute k that has already been selected, and qjk is the element of Q-matrix. The value of ABI is non-negative. By combining ABI and PWKL information methods, the modified global discrimination index (MGDI) is formulated as
An item with maximum MGDI will be administered as the next item for a specific examinee. Cheng (2010) named it maximum MGDI (MMGDI) item selection method. It is worth noting that the MMGDI method will be used to select the next item if ABI is larger than 0; otherwise, the PWKL information method will be used. When qjk = 0, which means item j does not measure attribute k, then , which does not affect MGDIj.
Balance Attribute Coverage Based on Attribute Discrimination Index
As mentioned in the Introduction, in some situations, even though adequate items are used to measure each attribute, the estimated accuracy may differ across attributes (Finkelman et al., 2009). The number of items measuring each attribute may be the necessary condition to improve the AMPs' accuracy. However, the information that each attribute provides may also be an essential factor to increase the test accuracy. Therefore, not only measuring each attribute with the number of items but also information that each attribute provides can be used to balance attribute coverage.
Henson et al. (2008) developed the attribute discrimination index (ADI) to compute the information each attribute provided. Then Finkelman et al. (2010) developed a binary programming method based on ADI to assemble tests automatically for CDM. ADI aims to compute the expected KL information between any two AMPs, with all the attributes holding constant except the target attribute, within the ideal response pattern (IRP; Tatsuoka, 1995). Considering that the test that measures K attributes will produce 2K(2K − 1) possible comparisons regardless of hierarchy among attributes, a (2K × 2K) matrix Dj will be used to contain all these values. Dj can be written as follows:
where Pαu(xj) and Pαv(xj) are response probabilities of item j given AMPs αu and αv, respectively. Djuv represents the degree to which a master (non-master) differed from non-master (master) for the target attribute (Henson et al., 2008).
There are 2(K−1) comparisons of AMPs that differ only for the target attribute k. Note that the KL information between two AMPs is not symmetric. Therefore, two ADIs can be calculated for item j: one is the power that discriminates the master from non-master for the target attribute and the other one discriminates the non-master from master. The formulations of these two ADIs are
where ωk1 = p(αu|αk = 1), Ωk1 ≡ {αuk = 1 and αvk = 0 and αum = αvn ∀ m ≠ n}, and ωk0 = p(αu|αk = 0), Ωk0 ≡ {αuk = 0 and αvk = 1 and αum = αvn ∀ m ≠ n}. In general, ωkg is the weight of Djuv. Two situations need to be considered: First, there is no idea about the prior information of examinees population; then all AMPs are equally likely, which means ; second, the situation in which each AMP has different prior information and the estimates of the joint probabilities of the AMPs will be used as the weight of Djuv (Henson et al., 2008). Henson et al. (2008) defined the ADIs under the first situation as ADI(A) and the second as ADI(B). Noting that ADI(A) is related to items and unrelated to the knowledge states of examinees, therefore, this index can be used to represent the degree that the attribute is being measured by items. As a consequence, the ADI(A)-based ABI (ADIA-ABI) can be defined as
where ADI(A)k is the lower bound ADI of attribute k and the value of ADI(A)k is the average of ADI(A)k1 and ADI(A)k0 (Finkelman et al., 2010); adi(A)k represents ADI of attribute k that has already been selected.
The difference between the number of items measuring each attribute-based (MGDI-based) ABI and ADI(A)-based ABI is that Bk and bk are both positive integers and ABIs are nonnegative, whereas ADI(A)k and adi(A)k include any values that larger than 0. ADI(A)-ABI outcomes can produce negative values in some situations, which are undesirable. Hence, we constrain negative values to 0 when ADI(A) − ABIj < 0. By combining ADI(A)-ABIj with PWKL or MPWKL information, the ADI-based item selection method can be written as
where represents PWKL information or MPWKL information. If ADI(A) − ABI > 0, the next item will be selected by Equation (10); otherwise, PWKL or MPWKL information method will be used to select the next item.
Simulation Study
Manipulated Factors
We conducted a simulation study to investigate the performance of the ADI-based method under different conditions. We manipulated four independent factors in the study.
Item Pool
In this study, we had designed three item pools, which all contained 775 items and measured five attributes in total. Item pools were constructed based on the study of Huebner et al. (2018) and Wang et al. (2011). In item pool 1, item parameters and were generated from uniform distributions U(0.75, 0.95) and U(0.15, 0.50), respectively. Considering that was relatively large, hence, we labeled item pool 1 as the low discrimination (LD) item pool. In item pool 2, high discrimination (HD) item pool, item parameters and were generated from uniform distributions U(0.75, 0.95) and U(0.05, 0.40), respectively. In item pool 3, hybrid discrimination (HyD) item pool, item parameter was also generated from uniform distributions U(0.75, 0.95), but s were generated from uniform distributions U(0.05, 0.50) contained in both low and high discriminations. Tables 1, 2 present the descriptive statistics of LD, HD, and HyD item pools.
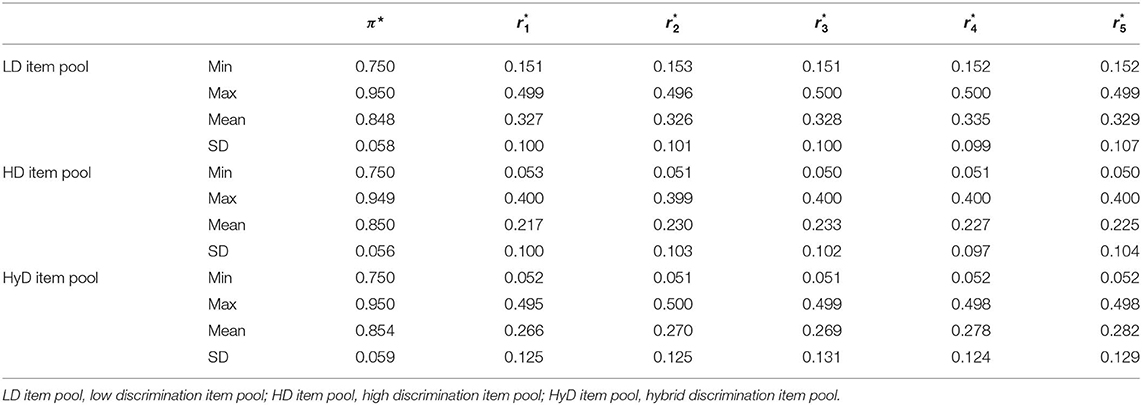
Table 1. Descriptive statistics of item parameters of LD item pool, HD item pool, and HyD item pool.
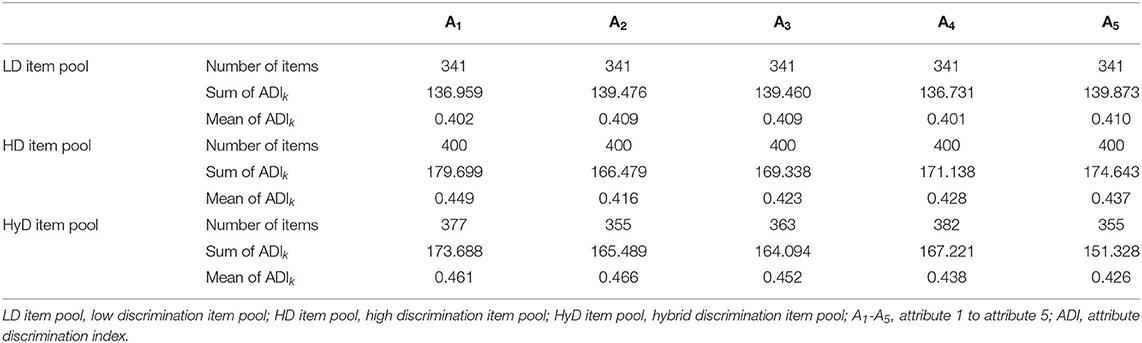
Table 2. Descriptive statistics of attribute discrimination index for each attribute of LD item pool, HD item pool, and HyD item pool.
Examinee Populations
We generated three examinee populations, each one containing 3,200 examinees. The first population (denote as Unif ) assumed that the AMP of each examinee, α, was generated from a uniform distribution of 32 possible pattern profiles with probability 1/32. Thus, each AMP had 100 examinees; meanwhile, each examinee had a 0.5 chance to master each attribute. Considering that correlations among attributes are common in practice, we used a multivariate normal distribution to describe the relationship among attributes for the second and third populations (denote as Norm) (de la Torre and Douglas, 2004; Cheng, 2009b; Kunina-Habenicht et al., 2012; Liu et al., 2016). The mastery probabilities for the five attributes were defined as 0.45, 0.50, 0.55, 0.60, and 0.65, respectively, in both populations. The correlations among attributes were set at 0.5 (low correlation) for the second population and 0.8 (high correlation) for the third population. Table 3 represents the frequencies of examinees who possess each possible number of attributes.
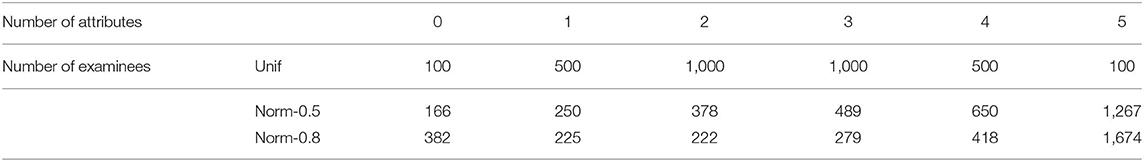
Table 3. Frequencies of examinees exhibiting each possible number of attributes in each population.
We obtained nine subgroups by crossing item pools and examinee populations. These combinations were as follows: LD item pool with the uniform distributed population (LD-unif); LD item pool with the normal distributed population and 0.5 attribute correlation (LD-norm-0.5); LD item pool with the normal distributed population and 0.8 attribute correlation (LD-norm-0.8); HD item pool with the uniform distributed population (HD-unif); HD item pool with the normal distributed population and 0.5 attribute correlation (HD-norm-0.5); HD item pool with the normal distributed population and 0.8 attribute correlation (HD-norm-0.8); HyD item pool with the uniform distributed population (HyD-unif); and HyD item pool with the normal distributed population and 0.5 attribute correlation (HyD-norm-0.5); and HyD item pool with the normal distributed population and 0.8 attribute correlation (HyD-norm-0.8).
Constraints of Attribute-Balance Coverage
We considered three levels of constraint: Level 1 did not constrain the coverage of attribute balance, whereas level 2 and level 3 added a constraint to it. Level 2 used the method developed by Cheng (2010), who balanced attribute coverage via the number of items measuring each attribute. In Cheng's simulation study, he set the lower bound of item number that measures each attribute at 4 (Bk = 4) for a 30-item test; in the current study, we set the lower bound at 2 (Bk = 2) for a 10-item test. Level 3 used the method proposed in the current study that balance attribute coverage via the information that each attribute provided (ADI), with 1 as the lower bound of information (ADI(A)k = 1). The reason that setting ADI(A)k = 1 was that as can be seen from Table 2, 1 was the lower bound of information for each attribute that can provide approximately two items that measure each attribute, which means level 3 and level 2 had the same constraints.
Item Selection Methods
Cheng (2010) used KL information method to select items successively, whereas many studies have demonstrated that PWKL information method performed better than KL information method in terms of pattern and ACCR (Cheng, 2009a,b; Mao and Xin, 2013; Wang, 2013; Hsu and Wang, 2015; Zheng and Chang, 2016). And the MPWKL information method may perform even better than PWKL (Kaplan et al., 2015). Thus, we adopted both the PWKL and MPWKL information methods in the current study.
We generated a total of 54 conditions study (3 item pools × 3 examinee populations × 3 constraints of attribute-balance coverage × 2 item selection methods). We fixed the number of items in the test to 10 in all conditions. The first item was selected randomly from the item pool, with a maximum a posteriori (MAP) method used to estimate the examinee's AMP, and the prior information of AMP assumed to follow a uniform distribution. The study procedures were implemented by R software.
Evaluation Criteria
We evaluated results against five criteria: mastery pattern correct classification rate (PCCR), ACCR, equalization of ACCR (E-ACCR), item exposure index, and examinee qualification rate. E-ACCR is the ratio between the standard deviation of ACCR and the mean of ACCR, which represents the stability of ACCR. Examinee qualification rate means the proportion of examinees who satisfy the prescribed constraints (e.g., a minimum of two items that measure each attribute under the MGDI-based method in this study), which ranged from 0 to 1. The computation of PCCR and ACCR is as follows:
where N is the number of examinees and I(…) is an indicator function. And item exposure index can be expressed as
where J is the number of items, is the number of items administered to examinees.
Results
Table 4 lists the estimates of PCCR for each condition. The data summarized in the table make several meaningful points. First, the MPWKL information method performs similarly or even better than the PWKL information method for both LD and HD item pools, regardless of the methods that constrain attribute coverage and distribution of the population. Second, compared with uncontrolled conditions, both the PWKL and MPWKL information methods lead to better PCCR outcomes when attribute coverage was controlled, and there are only minor differences between the MGDI-based and ADI-based methods. Third, the ADI-based attribute-balance method performs better than the MGDI-based method in normal distribution populations with 0.8 attribute correlation, regardless of the quality of the item pool. Fourth, the PCCRs in HyD item pools are quite complex. Both the ADI-based and MGDI-based attribute-balance methods perform better than uncontrolled conditions. However, the MPWKL information method does not always perform better than the PWKL information method in all conditions.
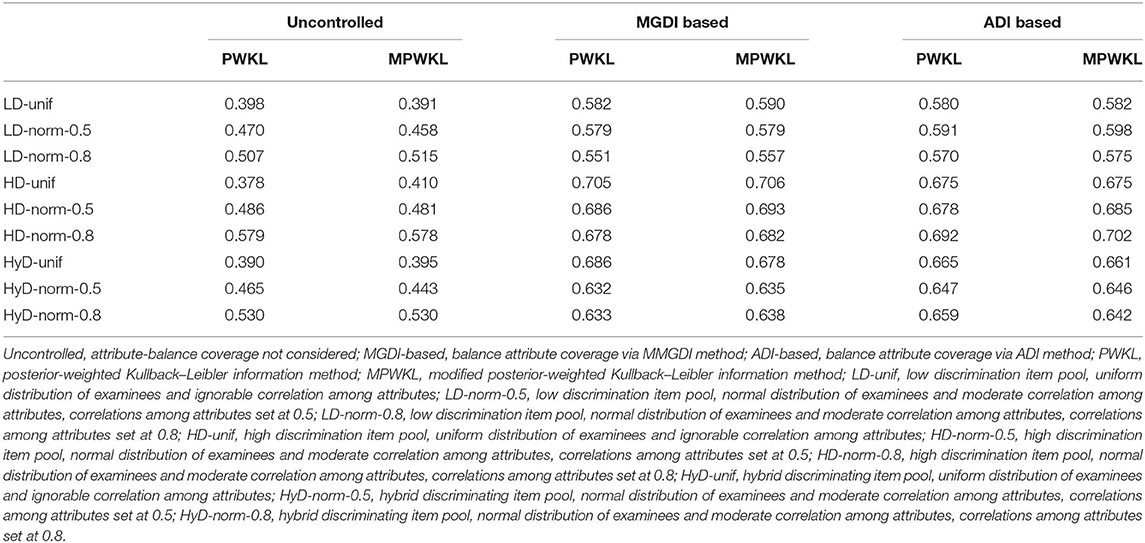
Table 4. Results of mastery pattern correct classification rate (PCCR).
Figures 1–3 depict the ACCR for each condition, and Table 5 represents the summary of ACCR and E-ACCR. They document the following results: First, the MPWKL information method has a similar performance or even outperforms the PWKL information method with ACCR for both LD and HD item pools with all populations under coverage controlled conditions and E-ACCR in most cases. Second, the coverage of ACCR and E-ACCR under uncontrolled conditions performs the worst, whereas they are comparable between the MGDI-based and ADI-based methods. And most of the E-ACCRs of the MGDI-based method perform slightly worse than the ADI-based method. Third, in the LD and HD item pools, when the PWKL information method was employed, the E-ACCR for uncontrolled conditions yields worse results than does the MGDI-based method; meanwhile, the ADI-based method leads to the best results. Fourth, in the HyD item pool, the ACCRs and E-ACCRs with both the ADI-based and MGDI-based attribute-balance methods outperform uncontrolled conditions; meanwhile, the ADI-based attribute-balance method performs the best under the condition of HyD-norm-0.8.
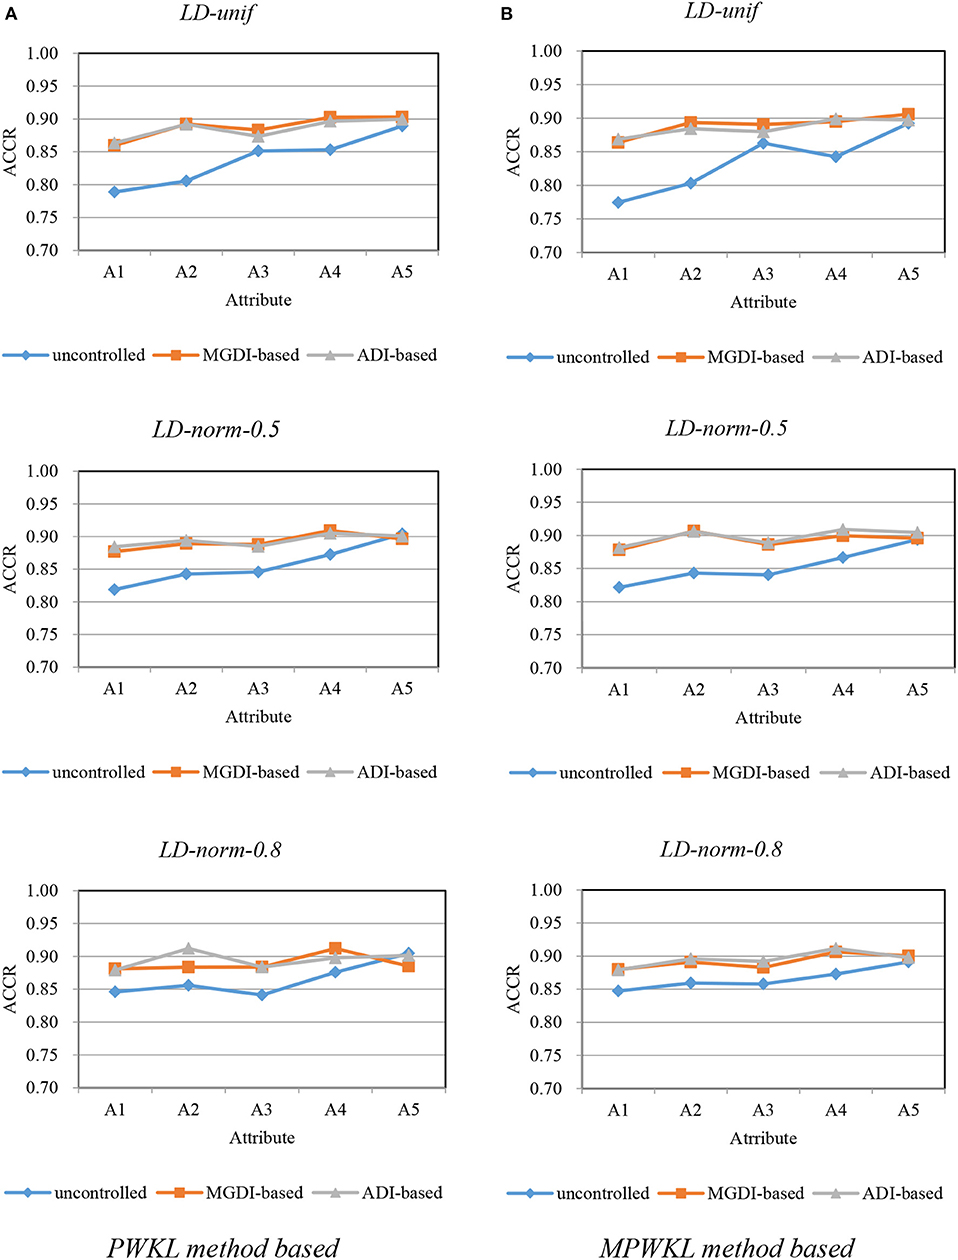
Figure 1. Attribute correct classification rates (ACCRs) under posterior-weighted Kullback–Leibler (PWKL) and modified PWKL (MPWKL) information methods for low discrimination (LD) item pools. (A) PWKL method based. (B) MPWKL method based.
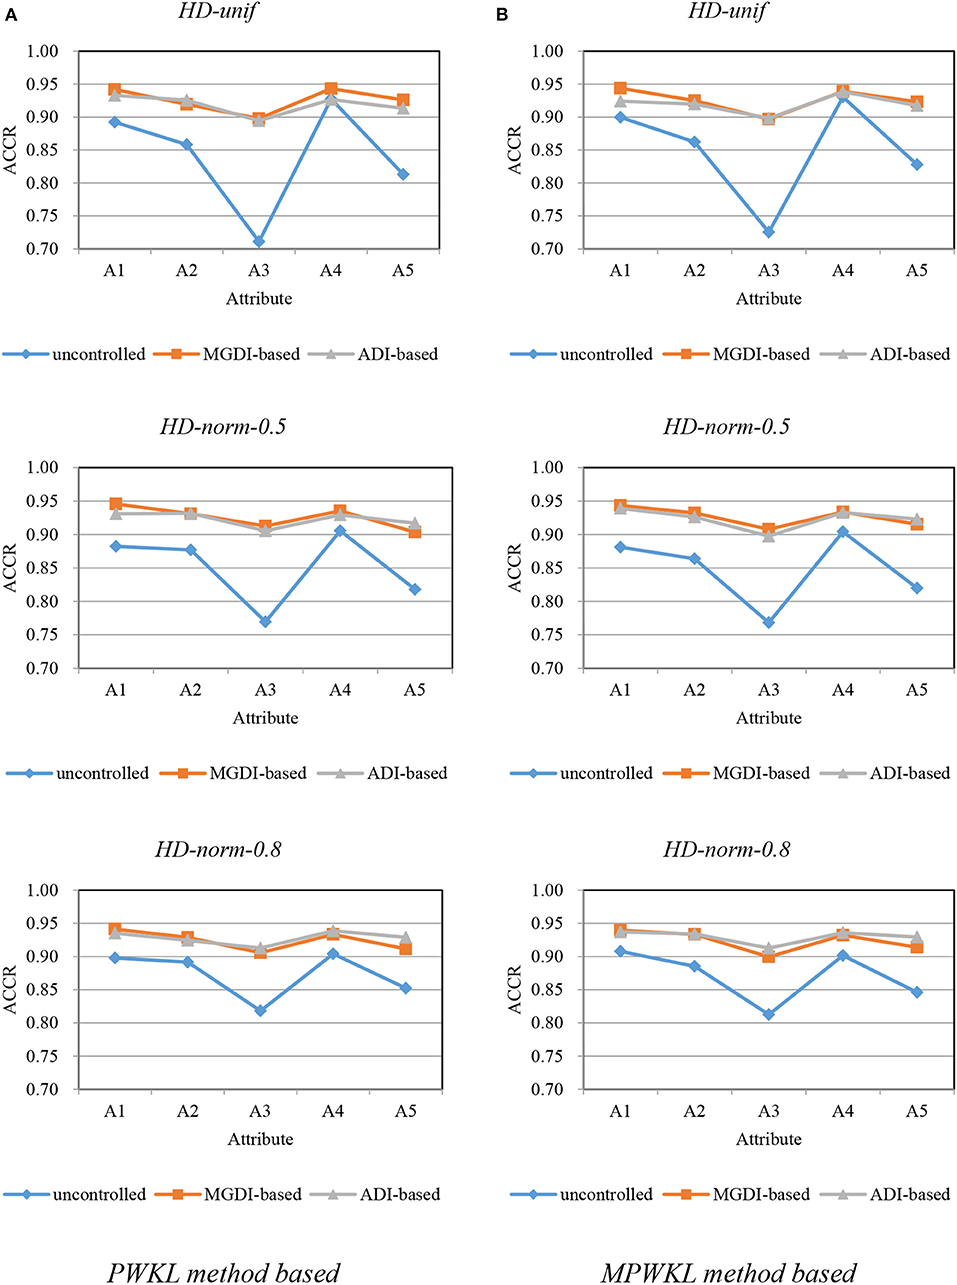
Figure 2. Attribute correct classification rates (ACCRs) under posterior-weighted Kullback–Leibler (PWKL) and modified PWKL (MPWKL) information methods for high discrimination (HD) item pools. (A) PWKL method based. (B) MPWKL method based.
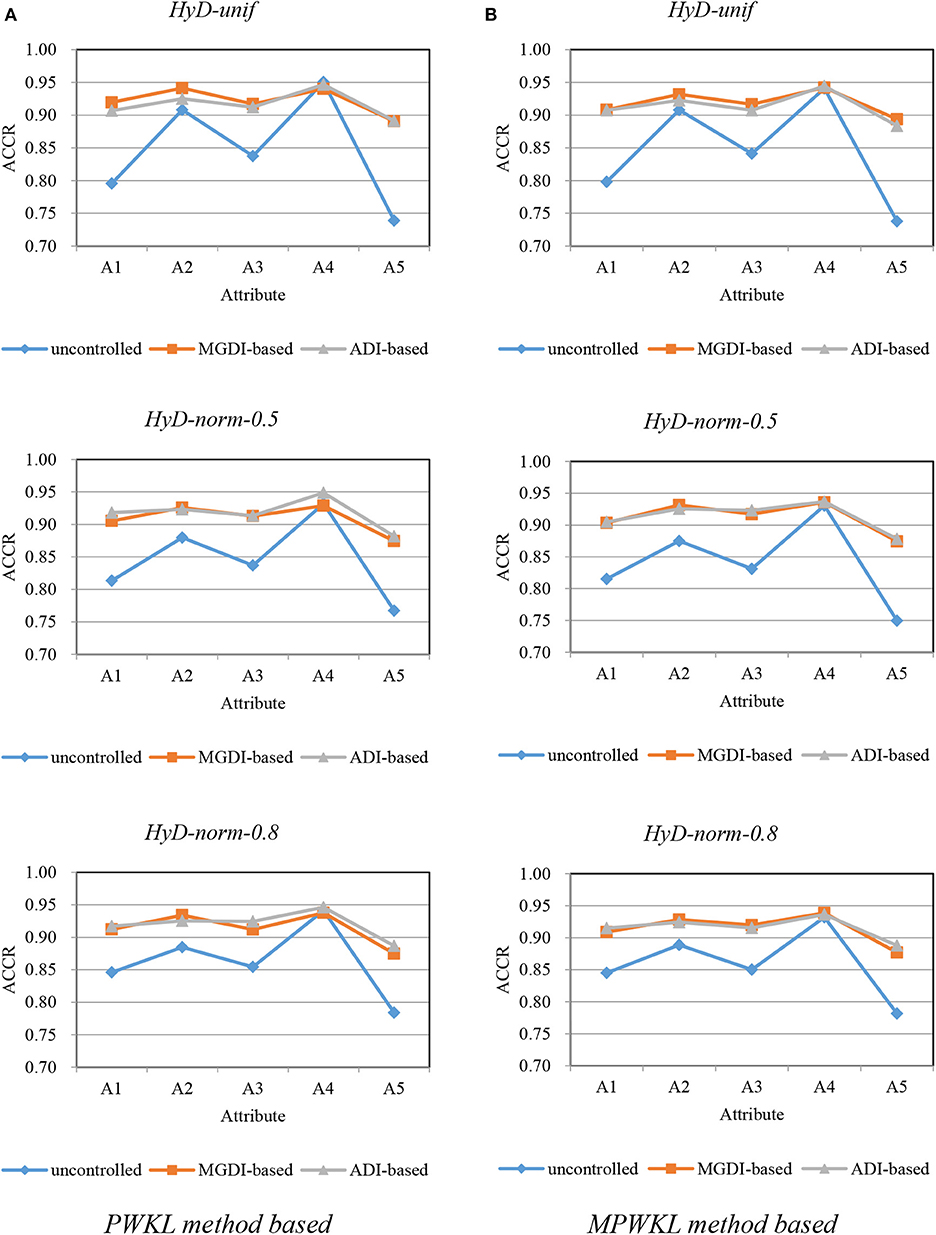
Figure 3. Attribute correct classification rates (ACCRs) under posterior-weighted Kullback–Leibler (PWKL) and modified PWKL (MPWKL) information methods for hybrid discrimination (HyD) item pools. (A) PWKL method based. (B) MPWKL method based.
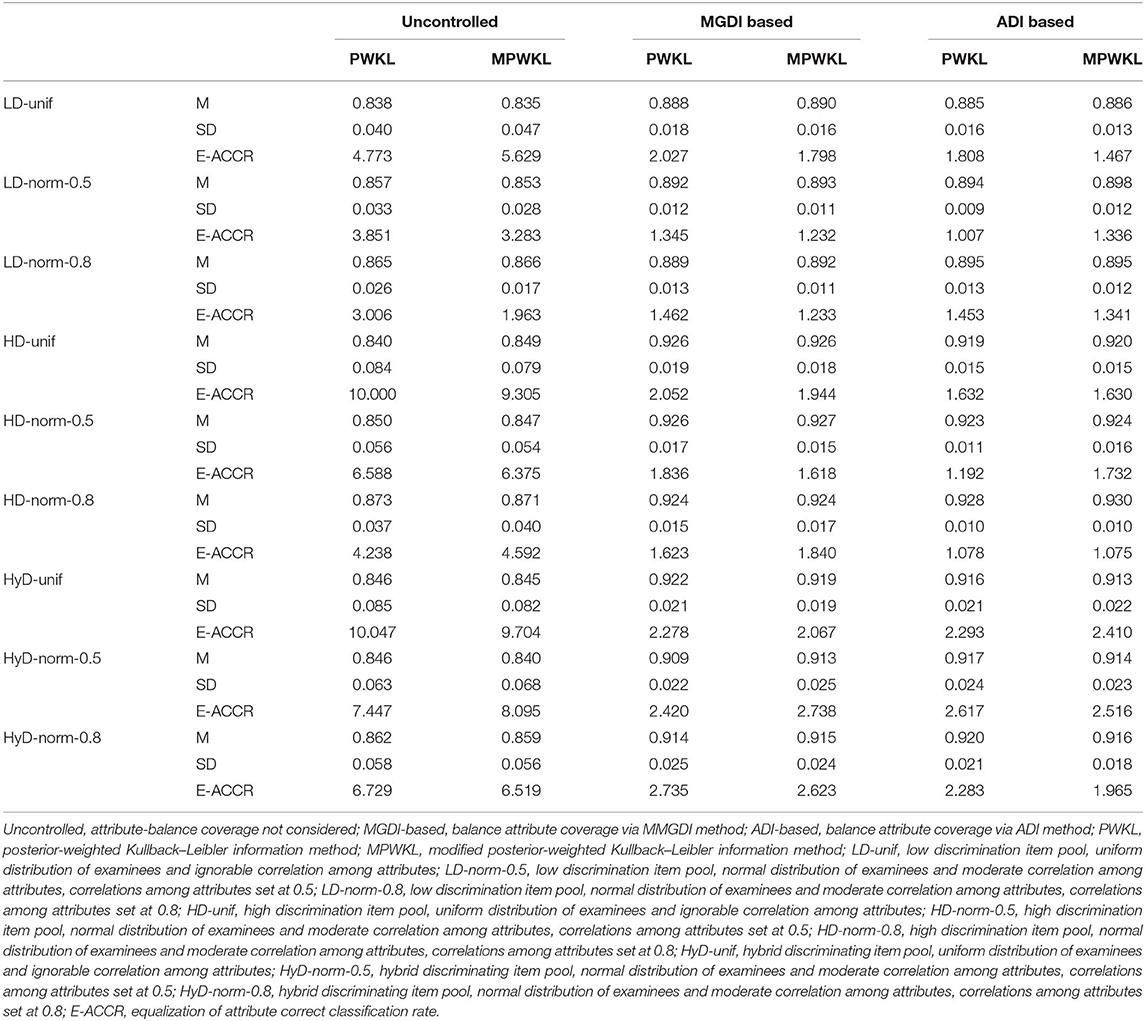
Table 5. Summary of ACCR and E-ACCR.
The results of the item exposure rate and examinee qualification rate for each condition are summarized in Table 6. The following results can be drawn from the table: First, both PWKL and MPWKL information methods lead to acceptable item exposure, regardless of attribute-balance constraints, quality of item pool, and population distribution. However, the MGDI-based attribute coverage constraint gains the worst outcomes. When the ADI-based attribute coverage constraint is used, it mitigates the worst result but better than the uncontrolled attribute coverage constraint for uniform distribution populations with HD and HyD item pools. Second, compared with uncontrolled attribute coverage constraint, the examinee qualification rates of both MGDI-based and ADI-based attribute coverage constraints produce perfect results, regardless of item selection methods. In addition, MGDI-based and ADI-based attribute coverage constraints lead to consistent examinee qualification rates with both PWKL and MPWKL information methods. Moreover, an unexpected result appears that examinee qualification rates for uniform distribution populations with HD and HyD item pools are extremely low.
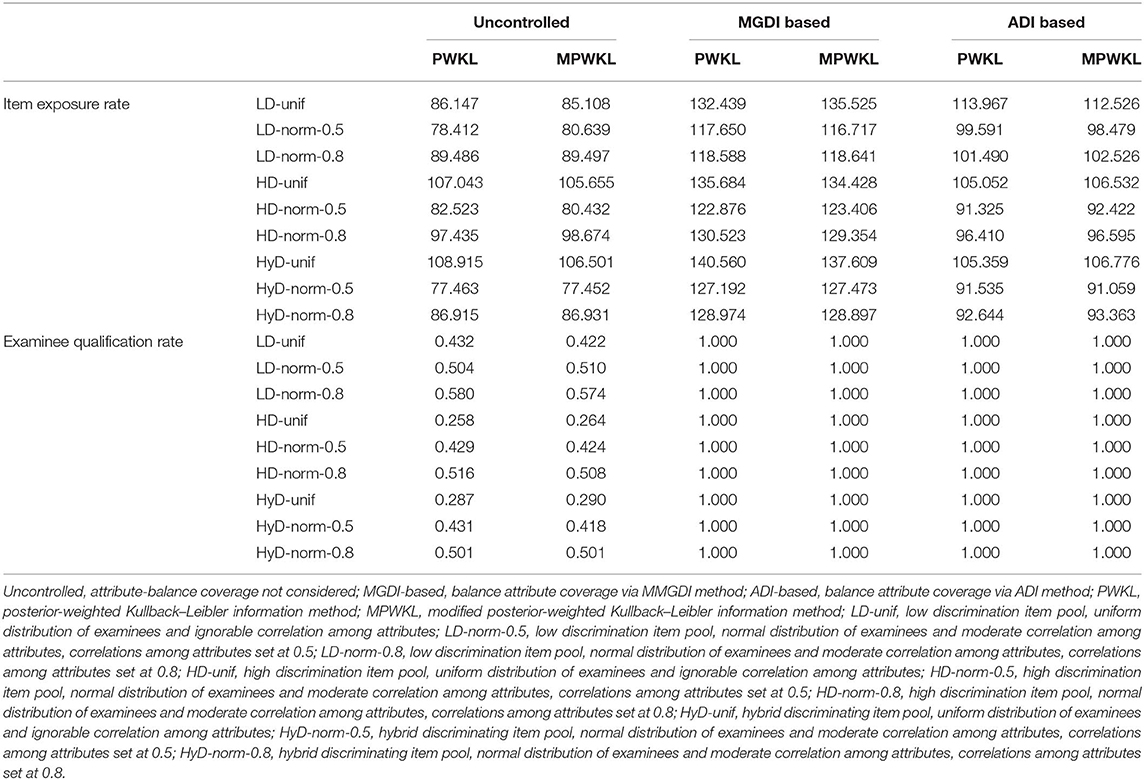
Table 6. Results of item exposure rate and examinee qualification rate for each condition.
Discussion and Conclusion
CD-CAT captures the advantages of both CDA and CAT, allowing the diagnosis of strengths and weaknesses of examinees with fewer items. CD-CAT can be used for low-stakes testing, so it can be adopted to provide detailed information on examinees for educators regularly (Hartz and Roussos, 2008; Mao and Xin, 2013; Kaplan et al., 2015). Thus, educators can provide remedial instruction for those examinees who need help. It is worth noting that the test length of CD-CAT should not be too long, in order to avoid increasing the burden on students. It should deviate from the original orientation by using a computer-based test to reduce students' burden and improve the efficiency of testing and learning if students do not take the test too long.
It is critical to consider the structure of short tests to assess the knowledge states of examinees comprehensively in CD-CAT. It is also important that each attribute should be measured adequately. Cheng (2010) used the number of items measuring each attribute to balance the coverage of attributes. The current study uses the information that each attribute provided to balance attribute coverage, as proposed by Henson et al. (2008). The simulation study was conducted to evaluate the performance of the new method, and the results showed that compared with the uncontrolled attribute coverage under the PWKL and MPWKL information methods, the ADI-based attribute-balance coverage method (the new method) improved both PCCR and ACCR. The reason is that when the attribute-balance coverage constraint is not controlled, some attributes may not be measured adequately; thus, the ADI is small for many examinees. Henson et al. (2008) demonstrated that the correlations are quite high between ADI and correct classification rates. Therefore, ADI can be used as the indicator of correct classification rates reasonably. Moreover, Cheng (2010) pointed out that the smallest ACCR dominated the PCCR, and he described this phenomenon as similar to Liebig's law of the minimum, which means the shortest stave is the most important factor that affects the capacity of a barrel with staves. In sum, considering that some ADIs are slightly smaller when attribute-balance coverage is not controlled, the ACCRs for some attributes are lower. As a consequence, the PCCRs under uncontrolled conditions are lower than those of MGDI-based and ADI-based attribute-balance coverage methods.
The present results also show that, compared with the uncontrolled method, both the ADI-based and MGDI-based attribute-balance coverage methods produce noticeable better results of PCCR and E-ACCR and slightly better ones of ACCR. Although there are no noticeable differences of E-ACCR between the ADI-based method and the MGDI-based method, the ADI-based method performs slightly better for most conditions. We infer that the ADI-based attribute-balance coverage method produces more stable ACCR than the other two methods. Besides, regardless of item selection methods, all examinees satisfied the prescribed constraints when the ADI-based and MGDI-based methods have been used, whereas the uncontrolled method failed for some examinees.
It is worth noting that when attribute-balance coverage is uncontrolled, the examinee qualification rates for HD and HyD item pools with uniform distribution populations are extremely poor under both item selection methods, for still unknown reasons. Therefore, a further study of that effect is needed.
Some future studies can be conducted to improve and enhance the application of the ADI-based attribute-balance coverage method. First, a variable-length CD-CAT can be conducted to evaluate the performance of the ADI-based method. Under variable-length CD-CAT, the measurement precision or standard error is fixed, and the number of items administered to each examinee is different. Second, there is only one RRUM model that has been used in the current study, which is a non-compensatory model. More models can be considered to verify the generalization of the ADI-based attribute-balance coverage method, especially for compensatory models. Third, the importance of each attribute to the item is assumed to be equal, but it is common that some traits are more important than others when more than one attribute is to be measured in practice (Wang et al., 2014). Thus, researchers need to take the relative importance of each attribute into account in a future study. Lastly, how to choose the lower bound of the ADI is an additional important issue. The value that has been used in the current study is a variation of the number of items measuring each attribute in the study of Cheng (2010), but how large the ADI should be to measure each attribute adequately is still unknown. Thus, studies that address the adequacy of the ADI in CD-CAT will provide some guidelines for further test administrations.
Data Availability Statement
All datasets generated for this study are included in the article/supplementary material.
Author Contributions
WC and TX proposed the original concept and designed the fundamental study of this study. YW and XS wrote the simulation study code and organized the article. All authors contributed to the manuscript revision.
Funding
This research was supported by the Cultural Experts and Four Groups of Talented People Foundation of China.
Conflict of Interest
The authors declare that the research was conducted in the absence of any commercial or financial relationships that could be construed as a potential conflict of interest.
References
Chang, H. H. (2015). Psychometrics behind computerized adaptive testing. Psychometrika 80, 1–20. doi: 10.1007/s11336-014-9401-5
Cheng, Y. (2009a). When cognitive diagnosis meets computerized adaptive testing: CD-CAT. Psychometrika 74, 619–632. doi: 10.1007/s11336-009-9123-2
Cheng, Y. (2009b). “Computerized adaptive testing for cognitive diagnosis,” in Proceedings of the 2009 GMAC Conference on Computerized Adaptive Testing, ed D. J. Weiss. Available online at: www.psych.umn.edu/psylabs/CATCentral/
Cheng, Y. (2010). Improving cognitive diagnostic computerized adaptive testing by balancing attribute coverage: the modified maximum global discrimination index method. Educ. Psychol. Meas. 70, 902–913. doi: 10.1177/0013164410366693
Cheng, Y., and Chang, H. H. (2009). The maximum priority index method for severely constrained item selection in computerized adaptive testing. Br. J. Math. Stat. Psychol. 62, 369–383. doi: 10.1348/000711008X304376
Chiu, C. Y., Köhn, H. F., and Wu, H. M. (2016). Fitting the reduced RUM with mplus: a tutorial. Int. J. Test. 16, 331–351. doi: 10.1080/15305058.2016.1148038
de la Torre, J., and Douglas, J. (2004). Higher-order latent trait models for cognitive diagnosis. Psychometrika 69, 333–353. doi: 10.1007/BF02295640
Feng, Y., Habing, B. T., and Huebner, A. (2013). Parameter estimation of the reduced RUM using the EM algorithm. Appl. Psychol. Meas. 38, 137–150. doi: 10.1177/0146621613502704
Finkelman, M., Kim, W., and Roussos, L. A. (2009). Automated test assembly for cognitive diagnosis models using a genetic algorithm. J. Educ. Meas. 46, 273–292. doi: 10.1111/j.1745-3984.2009.00081.x
Finkelman, M. D., Kim, W., Roussos, L., and Verschoor, A. (2010). A binary programming approach to automated test assembly for cognitive diagnosis models. Appl. Psychol. Meas. 34, 310–326. doi: 10.1177/0146621609344846
Gierl, M. J., Wang, C., and Zhou, J. (2008). Using the attribute hierarchy method to make diagnostic inferences about examinees' cognitive skills in algebra on the SAT©. J. Technol. Learn. Assess. 6:1–53. Available online at: https://eric.ed.gov/?id=EJ838616
Hartz, S. (2002). A bayesian framework for the unified model for assessing cognitive abilities: blending theory with practice (Unpublished doctoral dissertation). University of Illinois at Urbana-Champaign, Champaign, IL, United States.
Hartz, S., and Roussos, L. (2008). The fusion model for skills diagnosis: blending theory with practicality. ETS Res. Rep. Ser. 2008:i-57. doi: 10.1002/j.2333-8504.2008.tb02157.x
Henson, R., Roussos, L., Douglas, J., and He, X. (2008). Cognitive diagnostic attribute-level discrimination indices. Appl. Psychol. Meas. 32, 275–288. doi: 10.1177/0146621607302478
Hsu, C. L., and Wang, W. C. (2015). Variable-length computerized adaptive testing using the higher order DINA model. J. Educ. Meas. 52, 125–143. doi: 10.1111/jedm.12069
Huebner, A., Finkelman, M. D., and Weissman, A. (2018). Factors affecting the classification accuracy and average length of a variable-length cognitive diagnostic computerized test. J. Comput. Adapt. Test. 6, 1–14. doi: 10.7333/1802-060101
Jang, E. (2005). A validity narrative: effects of reading skills diagnosis on teaching and learning in the context of NG TOEFL (Unpublished doctoral dissertation). University of Illinois at Urbana-Champaign, Champaign, IL, United States.
Junker, B. W., and Sijtsma, K. (2001). Cognitive assessment models with few assumptions, and connections with nonparametric item response theory. Appl. Psychol. Meas. 25, 258–272. doi: 10.1177/01466210122032064
Kaplan, M., de la Torre, J., and Barrada, J. R. (2015). New item selection methods for cognitive diagnosis computerized adaptive testing. Appl. Psychol. Meas. 39, 167–188. doi: 10.1177/0146621614554650
Kim, Y.-H. (2011). Diagnosing eap writing ability using the reduced reparameterized unified model. Lang. Test. 28, 509–541. doi: 10.1177/0265532211400860
Kunina-Habenicht, O., Rupp, A. A., and Wilhelm, O. (2012). The impact of model misspecification on parameter estimation and item-fit assessment in log-linear diagnostic classification models. J. Educ. Meas. 49, 59–81. doi: 10.1111/j.1745-3984.2011.00160.x
Lee, Y. S., de la Torre, J., and Park, Y. S. (2012). Relationships between cognitive diagnosis, CTT, and IRT indices: an empirical investigation. Asia Pac. Educ. Rev. 13, 333–345. doi: 10.1007/s12564-011-9196-3
Leighton, J., and Gierl, M., (eds.). (2007). Cognitive Diagnostic Assessment for Education: Theory and Applications. Cambridge: Cambridge University Press.
Liu, Y., Tian, W., and Xin, T. (2016). An application of M2 statistic to evaluate the fit of cognitive diagnostic models. J. Educ. Behav. Stat. 41, 3–26. doi: 10.3102/1076998615621293
Mao, X., and Xin, T. (2013). The application of the monte carlo approach to cognitive diagnostic computerized adaptive testing with content constraints. Appl. Psychol. Meas. 37, 482–496. doi: 10.1177/0146621613486015
McGlohen, M., and Chang, H. H. (2008). Combining computer adaptive testing technology with cognitively diagnostic assessment. Behav. Res. Methods 40, 808–821. doi: 10.3758/BRM.40.3.808
Roussos, L. A., DiBello, L. V., Stout, W., Hartz, S. M., Henson, R. A., and Templin, J. L. (2007). “The fusion model skills diagnosis system,” in Cognitive Diagnostic Assessment for Education: Theory and Applications, eds J. Leighton and M. Gierl (Cambridge: Cambridge University Press, 275–318.
Sinharay, S., and Haberman, S. J. (2014). How often is the misfit of item response theory models practically significant? Educ. Meas. Issues Pract. 33, 23–35. doi: 10.1111/emip.12024
Tatsuoka, K. K. (1995). “Architecture of knowledge structures and cognitive diagnosis: a statistical pattern recognition and classification approach,” in Cognitively Diagnostic Assessment, eds P. D. Nichols, S. F. Chipman, and R. L Brennan (New York, NY: Routledge, 327–359.
Wang, C. (2013). Mutual information item selection method in cognitive diagnostic computerized adaptive testing with short test length. Educ. Psychol. Meas. 73, 1017–1035. doi: 10.1177/0013164413498256
Wang, C., Chang, H. H., and Huebner, A. (2011). Restrictive stochastic item selection methods in cognitive diagnostic computerized adaptive testing. J. Educ. Meas. 48, 255–273. doi: 10.1111/j.1745-3984.2011.00145.x
Wang, C., Zheng, C., and Chang, H. H. (2014). An enhanced approach to combine item response theory with cognitive diagnosis in adaptive testing. J. Educ. Meas. 51, 358–380. doi: 10.1111/jedm.12057
Weiss, D. J. (1982). Improving measurement quality and efficiency with adaptive testing. Appl. Psychol. Meas. 6, 473–492. doi: 10.1177/014662168200600408
Xu, X., Chang, H., and Douglas, J. (2003). “A simulation study to compare CAT strategies for cognitive diagnosis,” in Paper presented at the annual meeting of the American Educational Research Association (Chicago, IL).
Yao, L., and Boughton, K. A. (2007). A multidimensional item response modeling approach for improving subscale proficiency estimation and classification. Appl. Psychol. Meas. 31, 83–105. doi: 10.1177/0146621606291559
Keywords: balance attribute coverage, cognitive diagnostic computerized adaptive testing, attribute discrimination index, equalization of attribute correct classification rate, examinee qualification rate
Citation: Wang Y, Sun X, Chong W and Xin T (2020) Attribute Discrimination Index-Based Method to Balance Attribute Coverage for Short-Length Cognitive Diagnostic Computerized Adaptive Testing. Front. Psychol. 11:224. doi: 10.3389/fpsyg.2020.00224
Received: 04 August 2019; Accepted: 31 January 2020;
Published: 28 February 2020.
Edited by:
Hong Jiao, University of Maryland, United StatesReviewed by:
Yong Luo, Educational Testing Service, United StatesWenchao Ma, University of Alabama, United States
Zhehan Jiang, University of Alabama, United States
Copyright © 2020 Wang, Sun, Chong and Xin. This is an open-access article distributed under the terms of the Creative Commons Attribution License (CC BY). The use, distribution or reproduction in other forums is permitted, provided the original author(s) and the copyright owner(s) are credited and that the original publication in this journal is cited, in accordance with accepted academic practice. No use, distribution or reproduction is permitted which does not comply with these terms.
*Correspondence: Tao Xin, eGludGFvQGJudS5lZHUuY24=