 Kate M. Xu
 Celeste Meijs
 Hieronymus J. M. Gijselaers
 Renate H. M. de Groot
- Faculty of Educational Sciences, Open University of the Netherlands, Heerlen, Netherlands
With modern technological advances, distance education has become an increasingly important education delivery medium for, for example, the higher education provided by open universities. Among predictive factors of successful learning in distance education, the effects of non-cognitive skills are less explored. Grit, the dispositional tendency to sustain trait-level passion and long-term goals, has raised much research interest and gained importance for predicting academic achievement. The Grit Questionnaire, measuring Perseverance of Effort and Consistency of Interests, has been shown to be a reliable instrument in traditional university student populations. However, the measurement and predictive validity of this questionnaire is still unknown for adult distance education university students who differ from traditional students in various ways (e.g., having a wider range of student ages). Based on a sample of 2,027 students from a distance education university, this study assessed the psychometric properties of the two-factor structure grit measured by the Grit Questionnaire. The findings suggest that the short form of the Grit Questionnaire is a potentially useful assessment tool for measuring the grit construct for distance learning higher education and that the Consistency of Interests factor is especially relevant to consider the improvement of learning performance for distance education in terms of courses credit and exam attempts. The measurement precision of the Perseverance of Effort factor, however, should be improved in future research to provide higher measurement accuracy and broader item coverage.
Introduction
With modern technological advances, distance education has become an increasingly important education delivery medium as a way of lifelong and continuous learning (Eurydice, 2011). Among predictive factors of learning in distance education, the effects of non-cognitive skills are less explored (Aparicio et al., 2017). The role of grit—perseverance and passion for long-term goal pursuit—might especially be important for adult distance education students, because these students are not only older than typical university students but also are more likely to have a full-time or part-time job and/or family responsibilities. Given the multitude of personal and societal responsibilities, possessing grit, being committed to both effort and interest toward their study might be especially critical for their academic performance. To study the relationship between grit and relevant outcomes in adult distance education, it is important that the instrument measuring grit is reliable and valid. To our knowledge, no previous studies have examined the psychometric properties of a questionnaire measuring grit for adult distance education students.
Recently, the power of non-cognitive character strengths, in particular grit has been the subject of widespread research interest (Schmitt, 2012; West et al., 2016). This line of research has led to government interests to include perseverance as one of the non-cognitive factors critical for study success (Shechtman et al., 2013). Schools are also starting to incorporate assessment of such character traits as part of the curriculum (Sparks, 2015; Zernike, 2016). Duckworth et al. (2007) defined grit as a trait-level passion, Perseverance of Effort, and Consistency of Interests needed to attain long-term goals. The Grit Questionnaire has been used to predict not only achievement in the academic domain (Duckworth et al., 2007; Eskreis-Winkler et al., 2014) but also other important outcomes such as cognitive functions (Abuhassàn and Bates, 2015; Li et al., 2018b), self-efficacy (Wolters and Hussain, 2015), academic engagement (Datu et al., 2016), and subjective well-being (Datu et al., 2016; Li et al., 2018a; Disabato et al., 2019), which also play important roles in academic performance (Howell, 2009). Recent research findings in neuroscience have also advanced the understanding of the grit measurement by demonstrating associations between grit and relevant neuroanatomical correlates (Wang et al., 2017, 2018).
Despite the rapidly increasing number of studies that are being conducted on grit and its correlates, important gaps remain regarding the generalizability of the measurement and the predictive validity of the Grit Questionnaire in other student populations. In particular, much of the previous literature has focused on full-time students, in particular those in secondary and higher education. Little is known in adult distance education regarding whether grit can be reliably measured across student demographic background such as prior level of education, age, and gender groups and if its relationship with achievement holds true for learners of alternative educational settings such as those (Hwang et al., 2017, see also Aparicio et al., 2017).
The current study aims to psychometrically evaluate the Grit Questionnaire in a sample of adult distance education students attending a large distance education University, as well as to examine its association with academic performance. In the following, we review previous psychometric studies in students of higher education and general adult population that examined the factor structure of the Grit scale and the association between grit and academic performance (Arslan et al., 2013; Datu et al., 2016).
Psychometric Studies of Grit Questionnaire
The Factor Structure of Grit
The original grit scale (Grit-O) consisted of 12 items measuring two dimensions: six measuring the Perseverance of Effort dimension and six measuring the Consistency of Interests dimension (see latent variable representation in Figure 1). The Perseverance of Effort dimension describes the extent to which an individual sustains continued effort in the face of challenges, whereas the Consistency of Interests dimension focuses on the sustainability of passion—the interest the person maintains over time. The Grit Questionnaire was initially developed and validated in a sample of 1,545 adults (age > 25, Study 1; Duckworth et al., 2007). Although factor analysis of an initial pool of items in Study 1 suggested two dimensions (i.e., Perseverance of Effort and Consistency of Interests), the authors combined the items from the two scales into one single total score in subsequent analyses. This has raised much debate in terms of the structure of the grit construct (Credé et al., 2017; Credé, 2018). Since the two Grit dimensions were shown as separate factors, combining the two into a single factor would imply a unidimensional construct misrepresenting the underlying structure. Credé et al. (2017) showed in a meta-analysis that the two factors were moderately correlated (r = 0.44), and this was confirmed by a more recent meta-analysis by Guo et al. (2019) (r = 0.43). If the one-factor structure holds true, the two factors would have a correlation approaching 1, which is not the case.
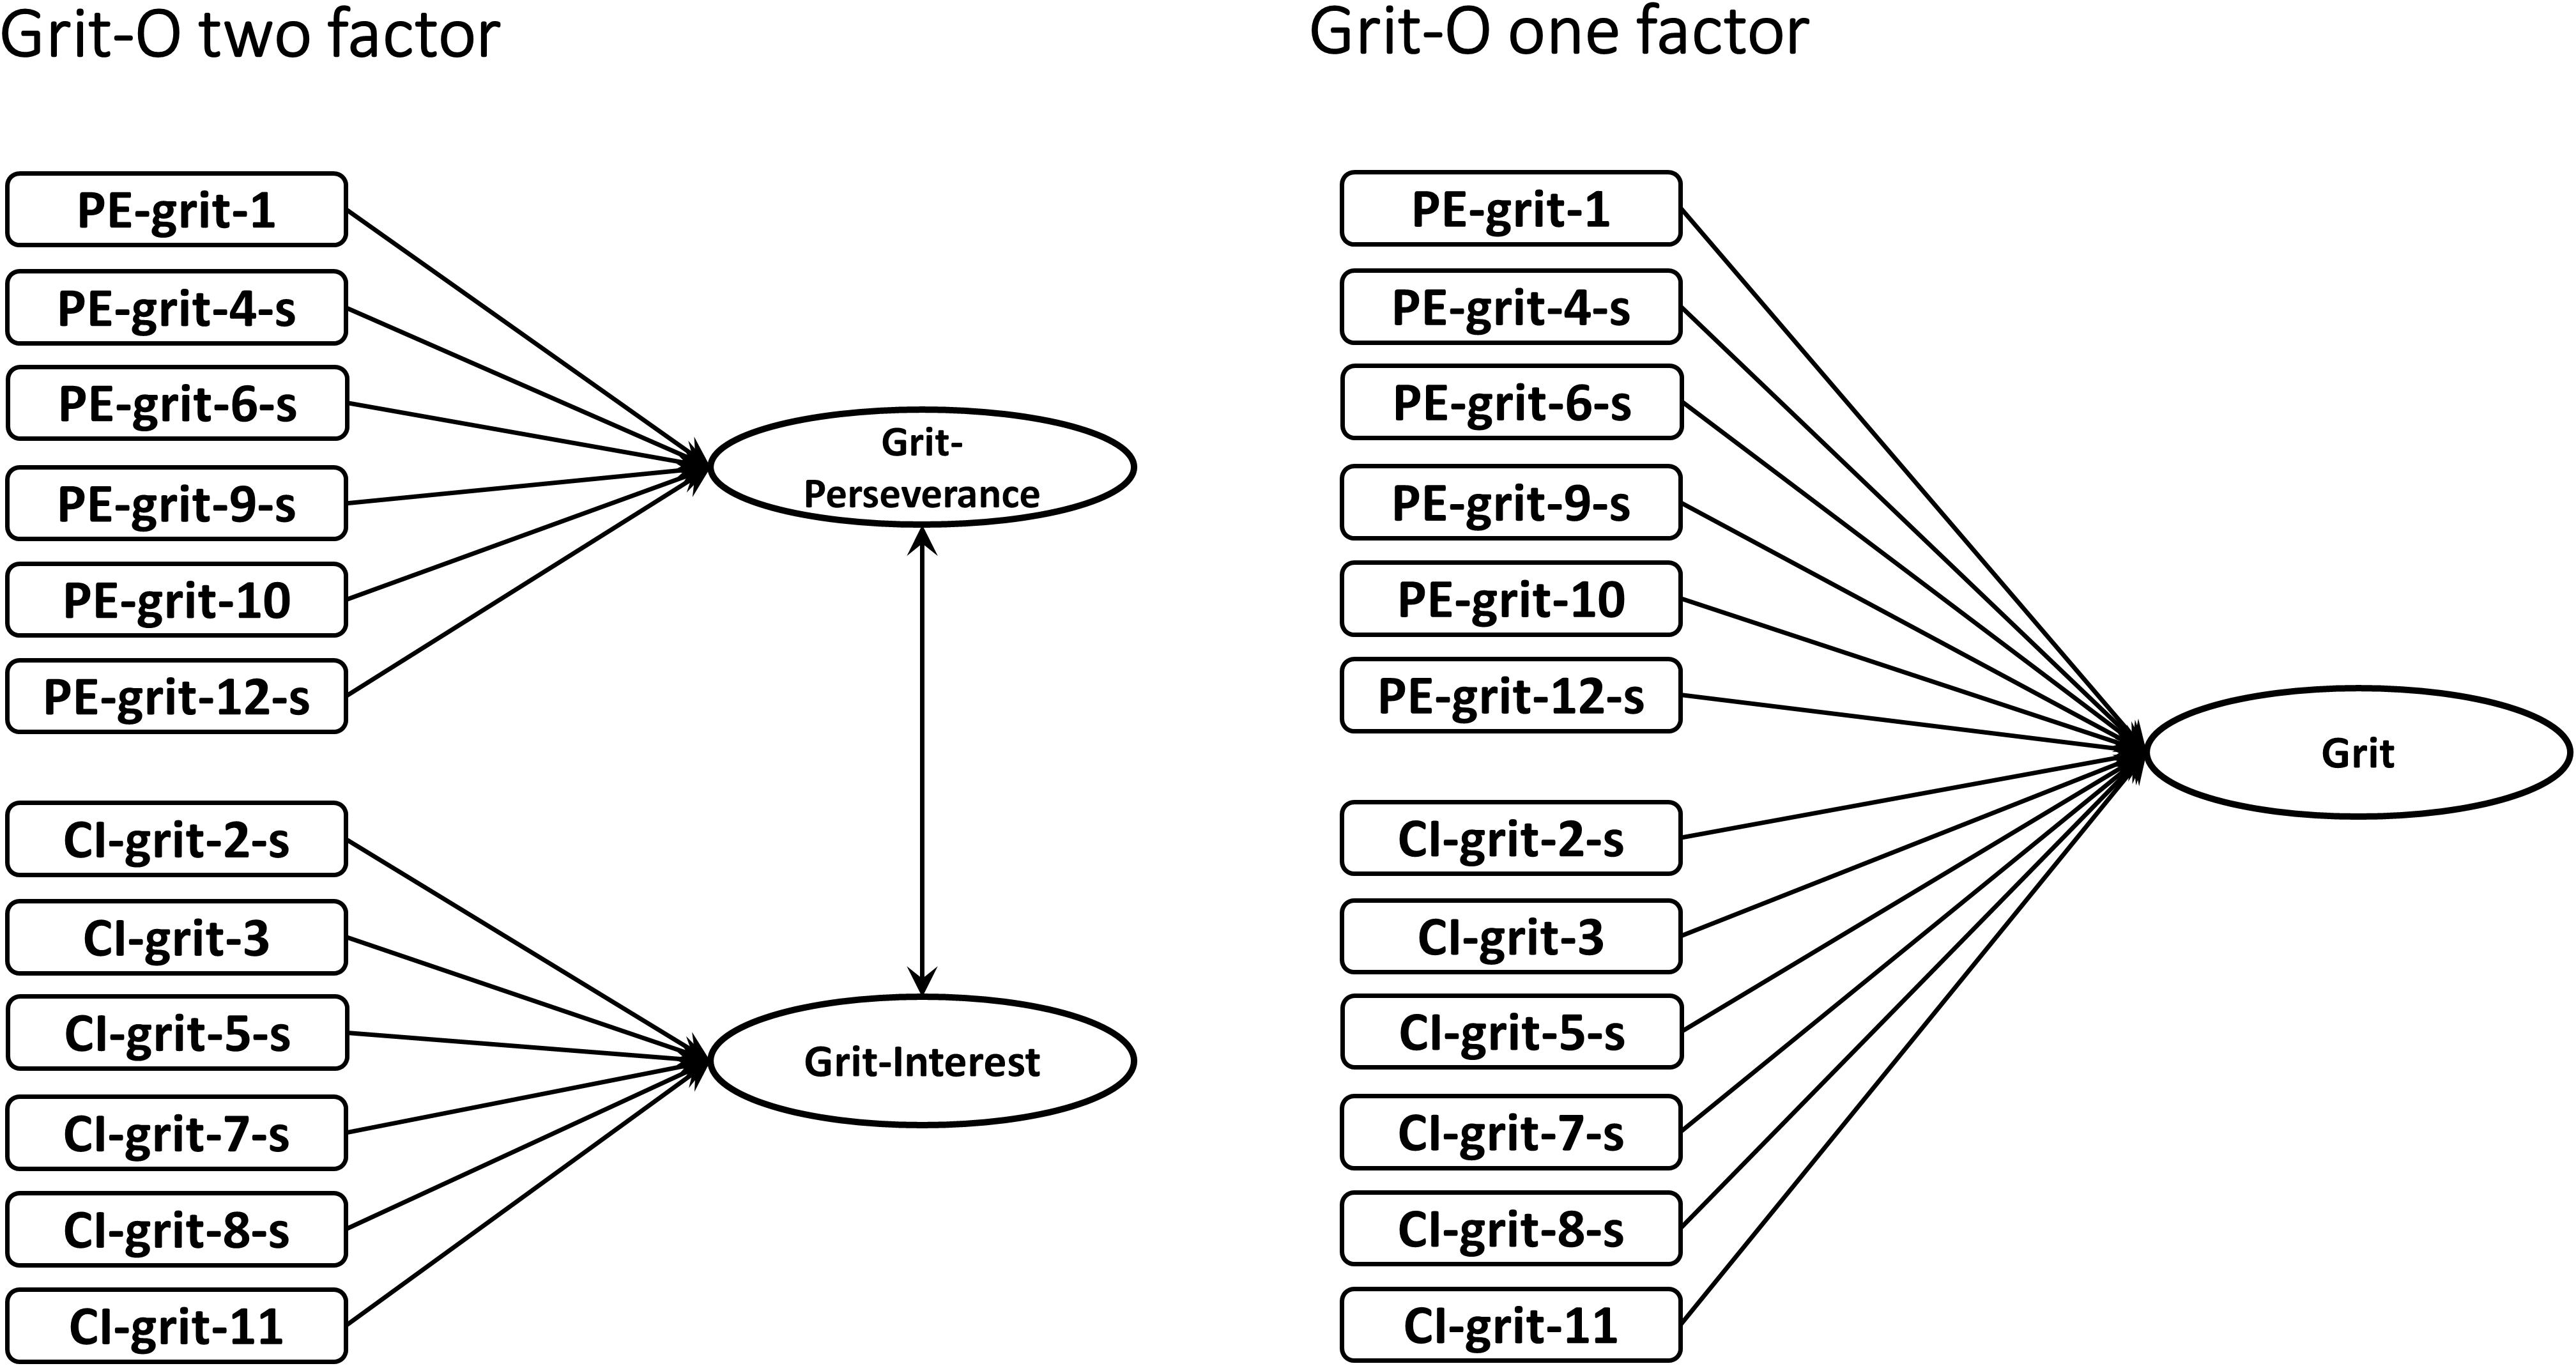
Figure 1. Psychological construct of the 12-item original Duckworth Grit Questionnaire (one-factor and two-factor). The letter “s” denotes the short-version of the Grit Questionnaire items. See Table 1 for item wordings.
The Short Version of the Grit Questionnaire
Following the development of the Grit-O, the authors developed a shortened version based on eight items from the full version (Grit-S; Duckworth and Quinn, 2009). The Grit-S has been shown to possess better psychometric properties than the Grit-O and hence, most empirical studies on grit have utilized the Grit-S questionnaire (e.g., Datu et al., 2016; Hwang et al., 2017; Wyszyńska et al., 2017). Wyszyńska et al. (2017) validated the Polish version of the Grit-S scale in 270 adults aged 18–34 in the general population. The two-factor model was found to fit the data better than the one-factor unidimensional model. The two-factor Grit structure was also supported in Philippine (n = 220; Datu et al., 2016) and US undergraduate students (n = 336; Muenks et al., 2017).
In a sample of female adult distance education students in Korea (Hwang et al., 2017), based on the Grit-O scale, the authors studied the relationship between grit, maladjustment (e.g., difficulties in finishing class assignments), and achievement. However, the authors did not perform a psychometric evaluation of the Grit items, thus it is still unknown which factor structure holds for adult distance education students. Therefore, in the present study, the factor structures of both the Grit-O and Grit-S scales were investigated in a sample of distance education in both male and female students, participating in adult online distance education.
Measurement Invariance of Grit
Since grit is considered a dispositional trait, the psychometric properties of the grit construct may be subject to gender and age differences as shown in personality research (Soto et al., 2011; see also Xu et al., 2017). Adult distance education student population has a more diverse range of age; it is thus important to assess whether measurement of the Grit Questionnaire holds invariant across age. Previous research examining psychometric properties of the Grit Questionnaires in adult populations has supported measurement invariance in relation to gender (e.g., Duckworth and Quinn, 2009; Wyszyńska et al., 2017). However, there is still limited research examining whether the Grit Questionnaire is measurement invariant across ages in adult or adult distance education populations.
Many studies have found a positive association between grit and level of education obtained (Duckworth et al., 2007; Palczyńska and Świst, 2018). Since distance education students often have diverse educational backgrounds, it is important to examine whether measurement properties of the Grit Questionnaire holds equal across prior educational levels. However, most of the previous research focused on and confirmed measurement invariance of level of education by comparing samples currently receiving secondary (e.g., Areepattamannil and Khine, 2017) and/or university education (e.g., Datu et al., 2016). The extent to which previous educational levels affect measurement properties of the Grit Questionnaire in distance education student is still unknown.
The Association Between Grit and Academic Performance
Of the two factors measured in the Grit Questionnaire, the Perseverance of Effort factor has particularly shown to be predictive of achievement-related outcomes. In the meta-analysis of Credé et al. (2017), this factor was higher correlated with academic performance measured by grade point average (r = 0.20) than the correlation for the Consistency of Interests factor (r = 0.08). In more recent studies, Palczyńska and Świst (2018) reported a positive association (b = 0.07) between Consistency of Interests and educational attainment (highest level of education obtained) measured in a sample of adults (aged 18–69, N = 4,355) from Poland. In a study based on traditional higher education students by Muenks et al. (2017), Perseverance of Effort predicted grade point average (b = 0.17). Perseverance of Effort was also found to positively predict grade-point average in another study based on US undergraduate students (n = 209, b = 0.22; Akos and Kretchmar, 2017); however, neither factors of Grit predicted course credit. Few studies investigated the predictive effect of grit on academic performance in adult distance education students, except for one study based on a sample of adult distance education students in Korea (Hwang et al., 2017). The authors found that neither Consistency of Interests nor Perseverance of Effort directly predicted GPA; however, Perseverance of Effort predicted academic maladjustment (e.g., difficulties in finishing class assignments) which in turn predicted grade-point average. The current study further aimed to investigate the predictive effects of grit factors on academic performance in a sample of adult distance education students.
The present study has primarily focused on the literature of the Grit Questionnaire developed by Duckworth et al. (2007). However, it is important to acknowledge that the Duckworth Grit Questionnaire is not the only theoretical framework of the grit construct. In particular, a triarchic model of grit has recently been developed and empirically supported to allow more culturally diverse adaptation of grit (Datu et al., 2017, 2018, 2020). Passion has also been suggested as an informative aspect of grit (Jachimowicz et al., 2018; see also Guo et al., 2019). Furthermore, the validity of the Grit Questionnaire has been under much debate, in particular regarding its uniqueness in relation to other relevant personality trait such as conscientiousness and self-control (Credé, 2018, 2019; also see Guo et al., 2019). The present investigation primary attempts to examine not all but several aspects of the psychometric properties of the Duckworth Grit Questionnaire.
Based on a large sample of adult distance education university students, the present investigation addresses the gaps in the literature of the Duckworth Grit Questionnaire in terms of its factor structure (one factor vs. two factors), item characteristics, and measurement invariance related to age, gender, and educational level, as well as its predictive validity for academic achievement through the following three research aims, using sophisticated analytical approach based on item response theory (IRT).
Research Questions
1. Evaluating the psychometric properties of the original and short versions of the Grit Questionnaire in a distance education setting. It is expected that the two-factor structure model fits the data better in comparison with the one-factor structure model, and that the factor structure based on Grit-S fits the data better than on Grit-O. However, in terms of item-level properties, limited previous research has examined aspects such as item discrimination indices and threshold levels (difficulty).
2. Assessing the measurement invariance of grit construct across gender, age, and educational levels. Based on previous research, psychometric properties of items measuring grit will be invariance in terms of gender; however, no specific hypothesis is made regarding age and prior educational levels due to lack of previous empirical research.
3. Investigating the predictive validity of the Grit Questionnaire with regard to academic performance (course grades, course credits, and exam attempts in a distance education setting). Although Perseverance of Effort has been found to be a more consistent predictor of achievement (Credé et al., 2017) in traditional higher education, in adult samples, Consistency of Interests rather than Perseverance of Effort was associated with educational attainment (Palczyńska and Świst, 2018). It is possible that for distance education students, also Consistency of Interests rather than Perseverance of Effort is more predictive of achievement.
Materials and Methods
Design, Participants, and Procedure
The sample for the present study was drawn from a larger study—the Adult Learning Open University Determinants (ALOUD) study. The ALOUD study is an investigation of biological and psychological determinants of study success possibly affecting academic performance in adult students participating in adult distance education, the Open University of the Netherlands (OUNL; Neroni et al., 2015). Previous publications on the ALOUD study can be found here (Gijselaers et al., 2015, 2016a,b,c, 2017; Meijs et al., 2019). All new students attending the OUNL registered in the period of August 2012 to August 2013 (N = 4,945) were approached to participate in ALOUD. Since OUNL is the only distance education university in the Netherlands, participants included in our study represent well the population under investigation. At baseline, an online survey lasting 45–60 min on average was administered regarding psychological, biological, and background variables using LimeSurvey®, version 1.92+ (LimeSurvey Project Team/Carsten Schmitz, 2012). During a 14-month follow-up, data regarding academic performance based on objective measures were also collected through the examination registration office. The 14-month period is in line with the subscription duration for a course at this university. More information about this cohort can be found in the data description paper of the ALOUD study (Neroni et al., 2015).
The analysis sample for the present study was based on participants with available data in variables measuring Grit and academic performance. The Grit Questionnaire was measured at baseline as part of the online survey. Of those who responded (n = 2,842) at baseline, 2,027 participants provided complete response to the Grit Questionnaire.
In the current sample, the age of participants ranged from 18 to 80, with the largest part (60%) being between 26 and 47 years old. Most participants already had a higher vocational or university/postgraduate degree (71%). There were more female students (62%, n = 1,253) than male students (38%, n = 774). At the time of the data collection, 88.3% of the participants held Dutch nationality (n = 1,790). Information on marital status was not collected by this study but 28.4% participants reported living with a partner (n = 560) and a further 35.2% living with a partner and children (n = 695). To control for potential confounding effects due to diverse demographic backgrounds, age, gender, and level of previous education were included as covariates in the predictive analysis of the current study.
Measures
Grit
All 12 items of the Grit-O questionnaire (Table 1; translated and back translated by native speakers of both the native language in the student population as well as the English language) were assessed in the form of a 5-point Likert scale, ranging from “completely disagree” to “completely agree.” The internal consistency statistics measured by Cronbach’s Alpha were good for the Grit global scale (Grit-O α = 0.79; Grit-S α = 0.76), Perseverance of Effort dimension (Grit-O α = 0.67; Grit-S α = 0.62) and Consistency of Interests dimension (Grit-O α = 0.82; Grit-S α = 0.76).
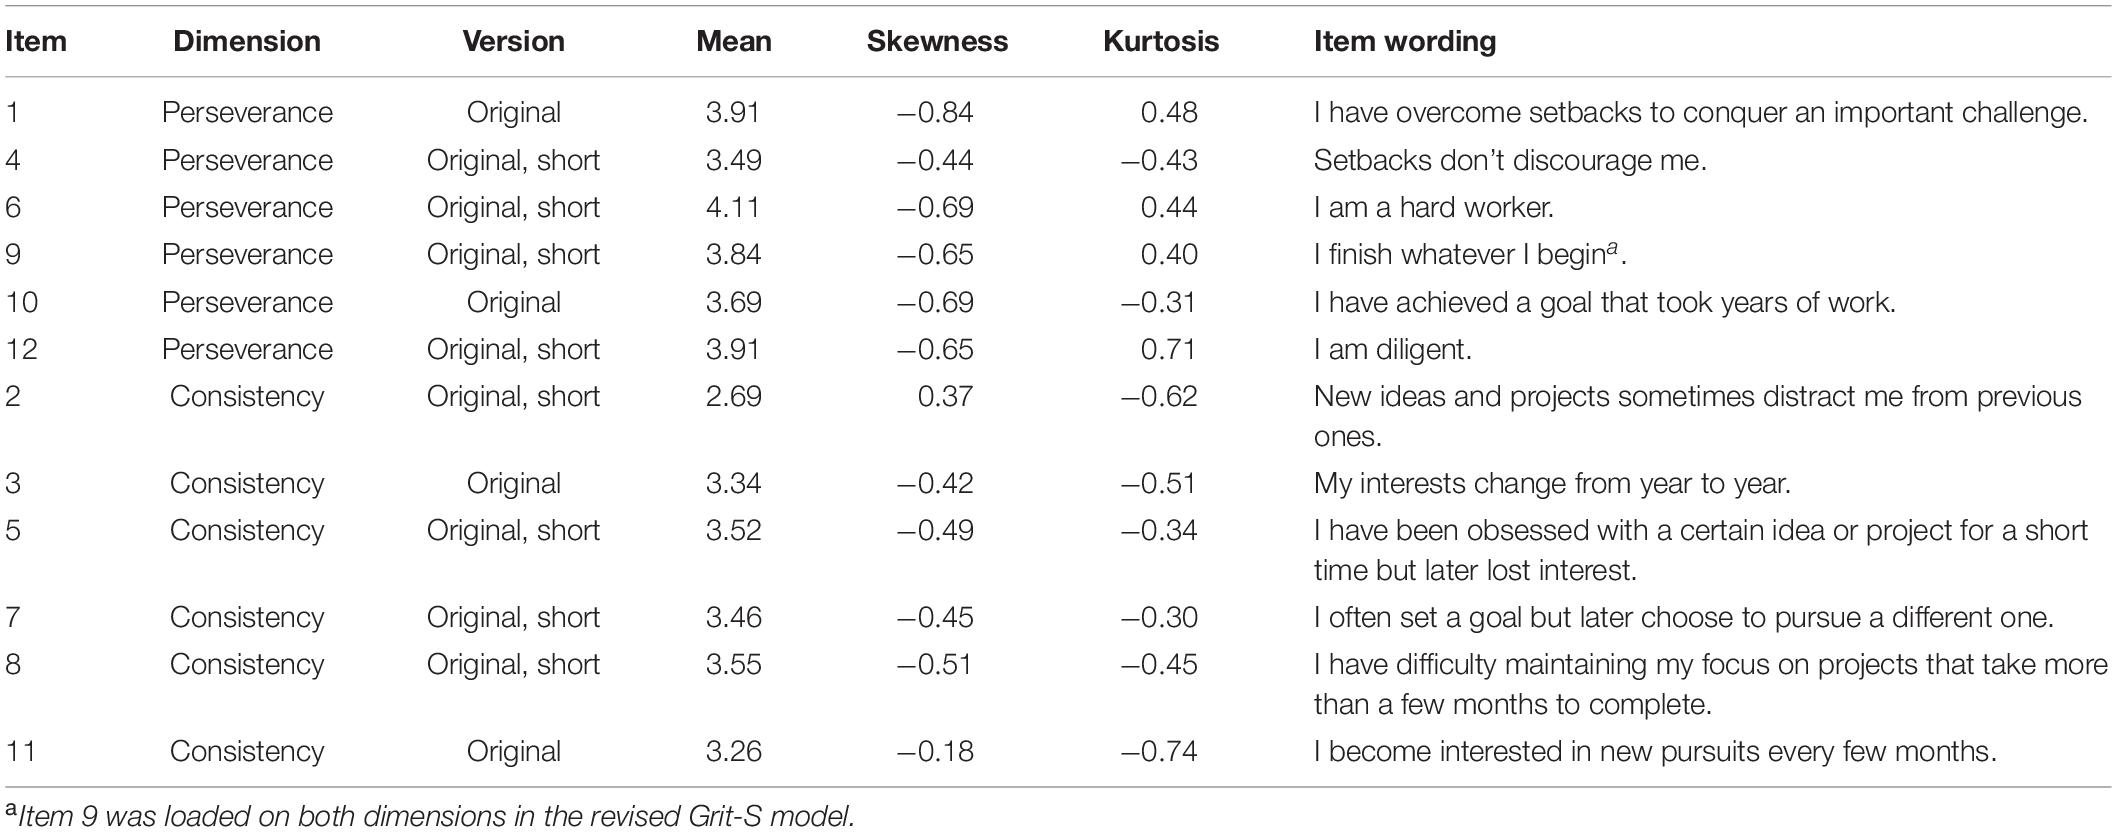
Table 1. Descriptive statistics.
Academic Performance
Academic performance during 14 months after the study baseline were operationalized as total course credit, average course grade, and exam attempt.
Exam Attempt
This performance measure is based on whether a student attempted taking an exam. Within the 2,027 students who provided complete data on the Grit Questionnaire, 1,133 had made exam attempts, whereas the remaining 894 did not make an attempt during the 14-month follow-up. This is an important indicator of study progress because more than 50% of the responders in the investigated population did not complete any course after 14 months, and many of them reported not having started studying. This is normal at such universities (Gijselaers et al., 2017). Since a course grade can only be obtained after a successful exam attempt, it is highly relevant to investigate whether grit is related to exam attempt.
Course Credit
Course credit was the number of successfully completed study modules in 14 months (min = 1, max = 22; mean = 3.18, SD = 2.54). A course at this university consists of one or more modules. One module is equal to 4.3 European Credits in the European Credit Transfer System. The nominal study load for one module is approximately 120 study hours.
Course Grade
Average course grades were calculated across courses taken (min = 6, max = 10; mean = 7.16, SD = 0.90). A grade is a score between 1 and 10, with 10 being the best possible score.
Only the grades of passed exams were used to calculate the course grade, with six being the passing grade. From the 1,133 students who had made exam attempts, 952 were successful. The average course grade was available for those students. However, for the 181 students who failed the exam attempt, no information was available for their course grades nor course credits.
All learning performance measures were derived from objectively measured learning performance data provided by the exam registration office of this adult distance education university. The assessments of most courses measured in this study were timed computerized exams which students had to perform at one of the 21 study centers of this adult distance education University located throughout the country and part of a neighbor country (Belgium) having the same mother tongue.
Analysis
Model Specification
An IRT analytical approach was used for the present study, embedded in the framework of confirmatory factor analysis (CFA) and structural equation modeling (SEM) methods, in statistical software Mplus 7.11 (Muthén and Muthén, 2015), using weighted least squares estimator with theta parameterization (WLSMV; Muthén and Muthén, 2015). The IRT method affords appropriate treatment of the Likert scale format response data as categorical variables. Under Mplus MLSMV specification, data were modeled as ordered-categorical polytomous ratings via a probit regression link to the corresponding latent variables. These methods correspond to a graded response normal ogive IRT model with two parameters (Samejima, 1997). For each fitted model under whole sample or multiple group analysis specification, parameters associated with each included items were estimated in terms of error residuals, discrimination indices (factor loading), and four thresholds (difficulty) for each item corresponding to the five Likert scale categories. Factor variances and covariances were estimated for latent variables. Factor means were also estimated in the case of multiple group analysis models.
Measurement Invariance
Multiple group analysis was used to examine the measurement invariance in relation to gender. Differential item functioning (DIF) analysis was used to examine whether there is measurement invariance related to age and prior education levels. For measurement invariance regarding gender, four multiple group models were estimated: configural invariance, weak invariance (discrimination indices/factor loadings), strong invariance (discrimination indices/factor loadings and thresholds), strict invariance (discrimination/factor loadings, thresholds, and uniqueness), and structural invariance (variance and covariance of latent constructs). The DIF refers to the presence of an association between the covariate and an item while controlling for the regression path from the covariate to the latent variable and the covariate. This indicates that the latent variable alone does not account for the relationship between the covariate and the item, thus a measurement bias is present. DIF is analogous to non-invariance of the item threshold and suggests response bias of the item (Kaplan, 2000). To assess DIF in relation to age and prior educational levels, we specified two models (Woods, 2009, also see Morin et al., 2013). In the DIF baseline model (saturated model), the path coefficients between the covariates and the latent variables were constrained to be zero, with the direct paths from the covariates to the items freely estimated. In the DIF comparison model (the more restrictive invariance model), the paths coefficients from the covariates to the items were fixed at zero, but the paths from the covariates to the latent factors are freely estimated. To evaluate the extent of measurement invariance based on multiple group and DIF analysis, goodness-of-fit indices are used to evaluate whether there is a decrease of model fit as the invariant constricts become more restrictive.
Model Evaluation
Model goodness of fit was evaluated using a range of fit indices. Since the chi-square statistic is known to be highly sensitive to sample size (Marsh et al., 1988, 2005), a variety of sample-size-independent goodness-of-fit indices were also examined to assess the fit of the alternative models: the Root Mean Square Error of Approximation (RMSEA), the Tucker-Lewis Index (TLI), and the Comparative Fit Index (CFI; Fan et al., 1999; Hu and Bentler, 1999; Yu, 2002; Marsh et al., 2004). The TLI and CFI vary along a 0–1 continuum and values greater than 0.90 and 0.95 typically reflect an acceptable and excellent fit to the data. RMSEA values of less than 0.06 and 0.08 indicate a close fit and an acceptable fit to the data, respectively. In terms of model comparisons for multiple-group analyses, a restrictive model is preferred if the change in model fit indices is not significantly inferior to those of the less restrictive model. For RMSEA, the change should be less than 0.015 (Chen, 2007). For CFI and TLI, the change should be less than 0.01 (Cheung and Rensvold, 2001; Chen, 2007). The chi-square difference tests for model comparison were computed with the DIFFTEST function in Mplus with the WLSMV estimator (Muthén and Muthén, 2015).
Results
Factor Structure of Grit
Two separate IRT-CFA models were fitted for both the Grit-O and Grit-S scales. The first model was based on the structure of a single first-order factor, assuming unidimensionality of the Grit construct (Figure 1). In this model, all items were loaded on one factor (Model M1 for Grit-O, and Model M3 for Grit-S, Table 2). The second model tested the two-factor structure, with Perseverance of Effort and Consistency of Interests as separate dimensions (Figure 1; Model M2 for Grit-O, Model M4 for Grit-S, Table 2). As expected, the two-factor model fitted the data better both for Grit-O and for Grit-S scales (Table 2). For Grit-O, in comparison with the one-factor model (Model M1), the two-factor model (Model M2) showed better model fit. Similarly, for Grit-S, the two-factor model also fitted the data better than the one-factor model. Furthermore, the two-factor model of Grit-S (Table 2, Model M4) fitted data better than the two-factor model of Grit-O (Table 2, Model M2). This confirms that a model with two-factor structure fitted the data better than the unidimensional one-factor structure, and that the two-factor Grit-S model showed better model goodness of fit than the two-factor Grit-O model.
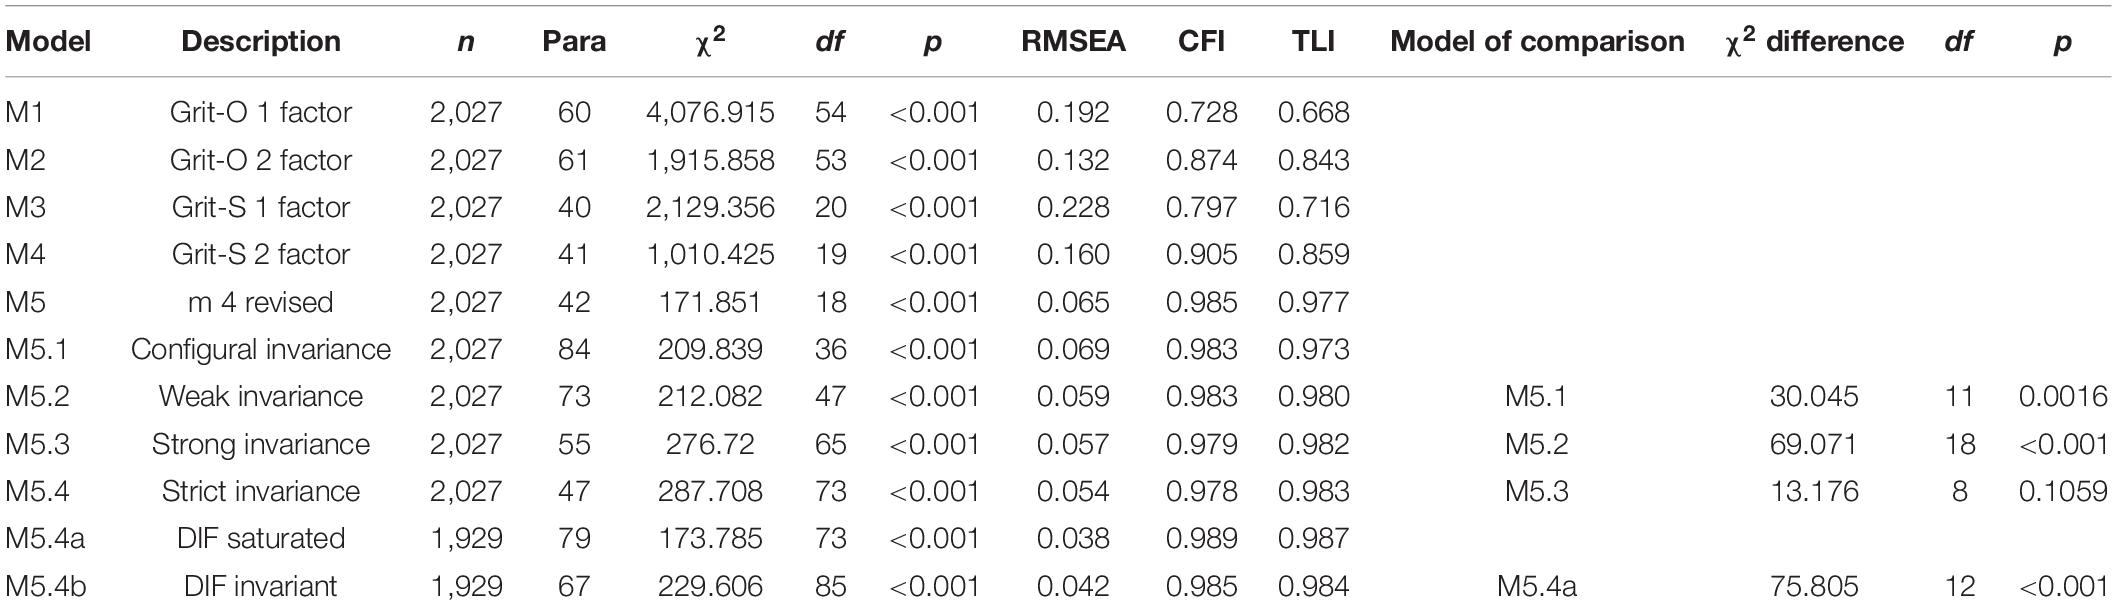
Table 2. Model fit indices.
However, the fit indices of Model M4 were still below thresholds of good model fit. An examination of the modification indices revealed that item 9 (“I finish whatever I begin”), which is intended to measure Perseverance of Effort dimension, also loads on the Consistency of Interests factor. This indicates that both Perseverance of Effort and Consistency of Interests were measured by this item. The revised two-factor Grit-S model (Model M5) with this cross-loading for both factors showed a close fit to the data (Model M5, Table 2).
The discrimination indices (factor loadings) and item thresholds (difficulty) are presented in Table 3. All item discrimination indices (loadings) were statistically significant and measured the intended grit dimension, with item 9, measuring both Perseverance of Effort and Consistency of Interests. The strengths of the discrimination indices for most items were around 0.5 or higher for most items, except for item 4 (0.351) and item 9 (0.314) for the Perseverance of Effort dimension. In terms of item thresholds for Perseverance of Effort dimension, the first three thresholds for all the four items were distributed toward the lower end distribution of the Perseverance of Effort (−2.882 to 1.264 on the standardized latent variable scale). Item 4 is the only item with a threshold measuring the latent variable just beyond 1 standard deviation above the mean. There is a lack of items measuring Perseverance of Effort on higher range of the latent variable distribution. The item overage of thresholds for items measuring Consistency of Interest was broader, ranging from −2.414 to 1.787.
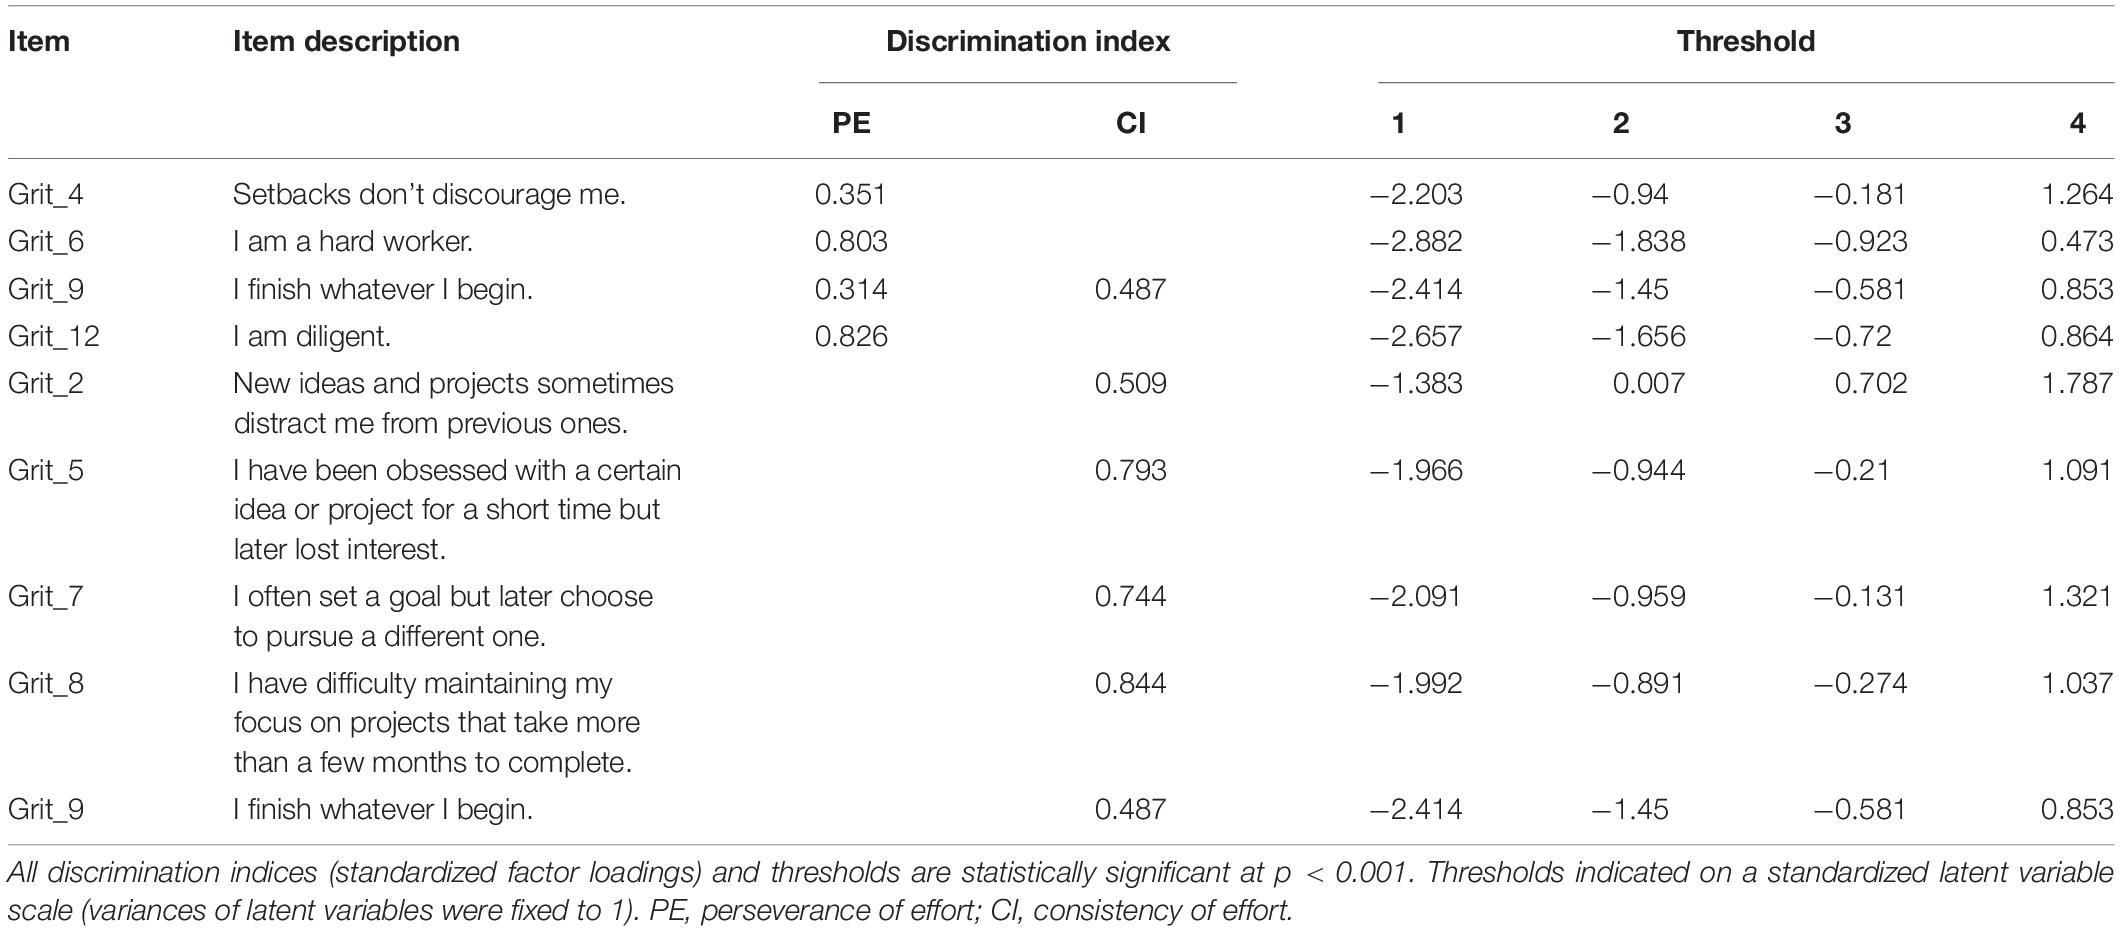
Table 3. Factor loadings and threshold for revised Grit-S (m5).
Measurement Invariance of Grit
Measurement invariance in relation to gender was performed over four sequential models (M5.1–M5.4), based on the factor structure of model M5. Comparisons of more-restrictive model against less-restrictive model showed minimal change in recommended fit indices in terms of RMSEA, CLI, and TLI (Table 2), supporting weak invariance (M5.2 vs. M5.1), strong invariance (M5.3 vs. M5.2), and strict invariance (M5.4 vs. M5.3). The chi-square difference tests were statistically significant, but the results should be interpreted with caution due to the large sample size in the present study.
Measurement invariance in terms of DIF (threshold) was examined for age and prior education levels in model M5.3 (baseline saturated model) and model 5.4 (comparison constrained model). Fit indices suggest minimal change in goodness of fit to data between models M5.3 and M5.4, indicating absence of DIF across age and prior education levels.
Predictive Validity of Grit in Academic Performance
Latent correlations of the Grit-S factors and covariates were presented in Table 4 (based on model M5). The Perseverance of Effort factor was positively and moderately correlated with the Consistency of Interests factor at 0.383. In particular, Consistency of Interests rather than Perseverance of Effort was positively correlated with course credits (r = 0.079) and exam attempt (r = 0.154). Furthermore, older students, and students with higher prior education rated higher on both Perseverance of Effort and Consistency of Interests. Male students reported lower values on Perseverance of Effort and Consistency of Interests. In subsequent prediction analyses for the effect of grit on academic achievement, we controlled for the effects of age, gender, and level of previous education.
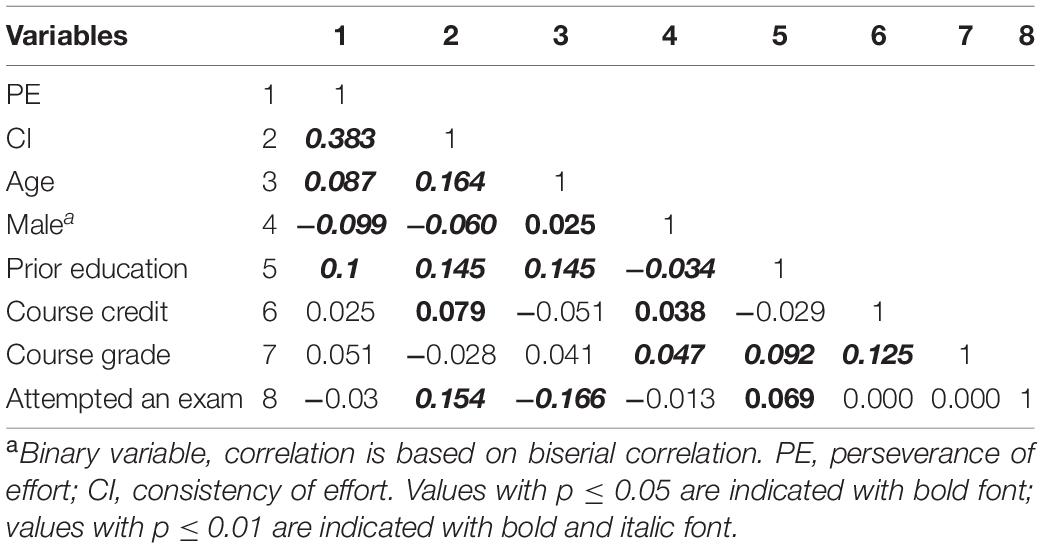
Table 4. Correlation between Grit-S factors and covariates.
Based on SEM analysis incorporating the two-factor Grit-S IRT measurement model (M5), the predictive validity of the revised Grit-S scale was assessed. Controlling for the effect of age, gender, and prior education, Consistency of Interests predicted significantly higher course credits (beta = 0.101, p = 0.033) and higher likelihood of attempting an exam (odds ratio = 1.436, p < 0.001; Table 5). While the Perseverance of Effort factor positively predicted course grade (beta = 0.087, p = 0.044), it also moderately predicted a lower likelihood to attempt an exam (odds ratio = 0.858, p = 0.015). Further analysis included interaction terms with gender and age, but the effect of grit factor was not found to be moderated by gender nor age (Table 5).
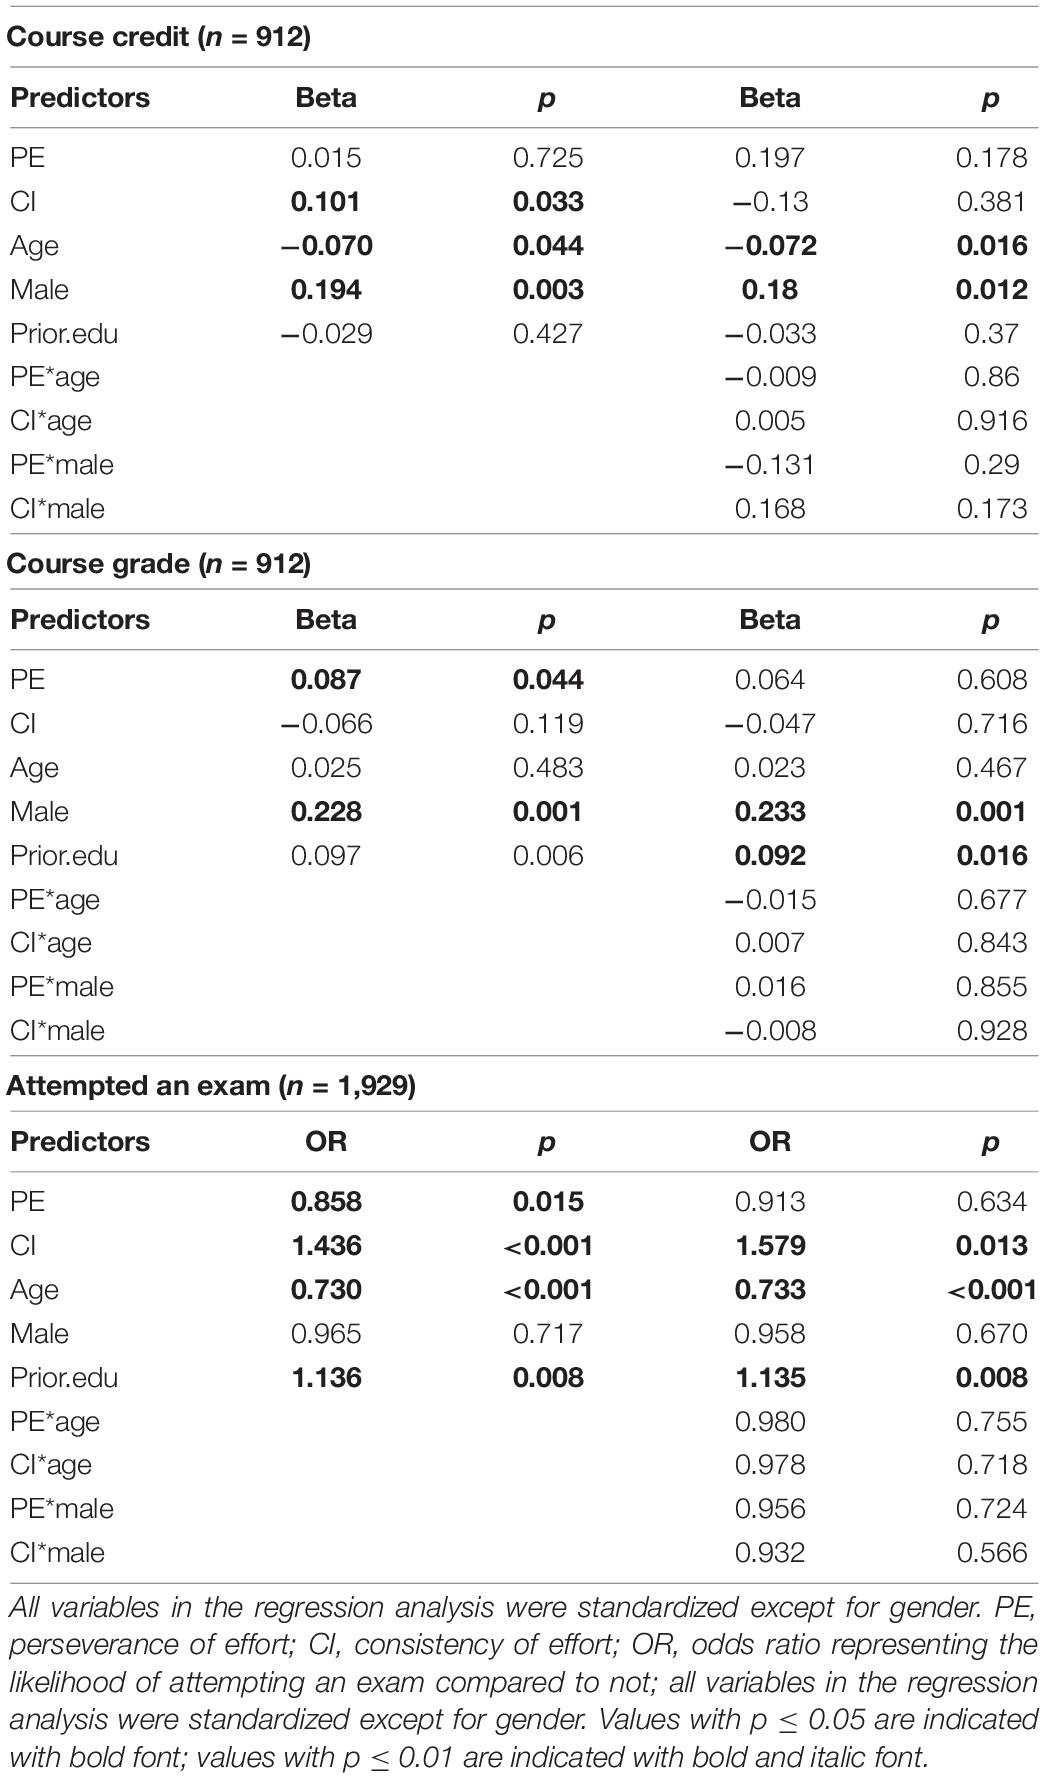
Table 5. Academic performance predicted by Grit-S factors.
Discussion
Factor Structure of Grit
The present investigation assessed the psychometric properties of the Grit Questionnaire in a sample of adult distance education students. In terms of measurement validity, the two-factor structure fits the data better than the one-factor structure, and this is the case both for Grit-O and Grit-S scales. In addition, the two-factor Grit-S model fitted the data better than the two-factor Grit-O model. The finding that the two-factor model, in particular the short version of the Grit Questionnaire, fits the data better than the unidimensional model confirmed findings from previous studies and recent debates (also see Muenks et al., 2017; Credé, 2018; Guo et al., 2019). The Consistency of Interests and Perseverance of Effort factors are separate factors with a moderate correlation, consistent with what has been reported in previous meta-analyses (Credé et al., 2017; Guo et al., 2019). This suggests that in an adult distance education student population, the internal structure of the grit construct remains similar to the measure in traditional higher education students.
Although the item “I finish whatever I begin” was intended to measure Perseverance of Effort, in the current sample, it was also found to load on the Consistency of Interests factor. This finding indicates that this item measures both factors. This may reflect on the specific characteristics of the distance education students. For example, for them being able to maintain effort may be something that is closely linked with holding the same goals of interests over a long period in order to pursue a learning program. However, further replication is necessary to confirm this is not a chance finding based on sample fluctuation.
The measurement precision of Perseverance of Effort dimension is in need of further improvement. Two items from this dimension had rather low item discrimination indices (factor loading), and furthermore, the thresholds (difficulty) of items measuring Perseverance of Effort had a rather sparse covering in the higher range of the latent variable distribution, indicating measurement precision is likely poor for individuals with high levels of Perseverance of Effort. The suboptimal psychometric property of the Perseverance of Effort dimension is reflected by the low reliability index measured by Chronbach’s alpha. In future research, more items with higher discrimination and higher threshold levels should be developed in order to improve the measurement quality of grit Perseverance of Effort dimension.
Measurement Invariance of Grit
The psychometric properties of the Grit-S scale were found to be invariant across gender, age, and prior education. This finding is in line with previous research based on adult population, which also found measurement invariance across genders (e.g., Duckworth and Quinn, 2009; Wyszyńska et al., 2017) and educational levels comparing samples attending secondary (e.g., Areepattamannil and Khine, 2017) and/or university education (e.g., Datu et al., 2016). This indicates that the measurement properties Grit-S scale is comparable across gender, age and prior education.
Predictive Validity of Grit in Academic Performance
The Consistency of Interests factor was positively predictive of the number of course credits as well as the likelihood to make a course attempt. This finding is in line with the previous Polish study where in adults Consistency of Interests but not Perseverance of Effort was associated with educational attainment (Palczyńska and Świst, 2018). This may be due to the specific profile of adult distance education students: first, more than 70% of the students already possessed a higher education-level degree; furthermore, many distance education students are often older than traditional higher education students and have family and/or work responsibilities. As such, the intention to pursue a distance education study might lie in interests of career advancement and/or motivation for self-improvement. For example, a student who enrolls in distance education could be motivated for career advancement via obtaining a degree (e.g., Business Administration), or out of a more intrinsic motivation such as pursuing a personal hobby in certain subject (e.g., a course on art in Italy). In this sense, promoting and maintaining personal interests and motivation might be especially important for increasing the academic performance of distance education students.
Results also showed that Perseverance of Effort factor positively predicted the course grade, but there was a negative effect on taking a course attempt. The finding regarding the positive effect on course grades is consistent with previous research based on adults and college students (e.g., Akos and Kretchmar, 2017; Muenks et al., 2017; Credé, 2018). However, the adverse effect on the likelihood to attempt a course exam is a unique finding. On the one hand, this could be due to students who invest more effort would deliberately delay the exam attempt because they feel they need to spend more time to prepare for the exam. On the other hand, this result might be biased and should be interpreted with caution, because the reliability and measurement precision are relatively low for the Perseverance of Effort dimension. Measurement errors can bias the effect coefficient thus this effect could be the result of a statistical bias (Loken and Gelman, 2017).
In sum, the results showed partial support to the predictive validity of grit, since the Consistency of Interest but not Perseverance of Effort positively predicted course credits and exam attempt, both are important steps in successfully obtaining the final degree. This in part contradicts the theoretical prediction of grit that both perseverance and passion are required to obtain success (Duckworth et al., 2007). This may be partly due to some of the issues related to grit which have in recent years been under rather intense debate regarding the validity and measurement practice (Credé, 2018, 2019; Guo et al., 2019). In the following sections, we discuss more extensively the issues related to grit construct in terms of its limitations and potential future directions.
Strengths and Limitations
The present investigation used IRT-based psychometric and SEM analysis to evaluate the factor structure, measurement properties across gender, age, educational levels, as well as predictive validity of the grit construct measured by the Grit Questionnaire. The sample is also of reasonable size. Since the university involved is the only distance education institute for university-level higher education in Netherlands, to a degree, the current study includes the whole target population within 1 calendar year. Participants in the ALOUD study are comparable with the general population of students who normally study at this university (Moerkerke, 2014). Nevertheless, the findings are still limited due to the largely cross-sectional nature of the data. There is likely a reciprocal relationship between Perseverance of Effort and/or Consistency of Interests and academic performance. Higher scores on either or both factors may lead to better academic performance, and better performance could further reinforce the value of being gritty. Also, we did not test the reliability of the Grit scale over multiple assessment occasions; therefore, it is still unknown whether the measurement properties hold constant across time. Longitudinal data is required in order to establish possible causal effects between academic performance and grit, as well as to assess test-retest reliability of the Grit Questionnaire. Furthermore, the present study did not compare the psychometric equivalency of participants from socioeconomic background, nor the original English version of the Grit Questionnaire with the translated Dutch version of the Grit Questionnaire. These limitations from the current investigation would be important aspects to be addressed by future research.
Although the construction of the Grit Questionnaire is relatively recent, its connotation bears a similarity to already existing constructs (Muenks et al., 2017; Credé, 2018; Steinmayr et al., 2018). In particular, grit measured by the Grit Questionnaire has been noted to share considerable overlap with the personality trait conscientiousness, a disposition of being able to plan, organize, and persist to achieve long-term goals (Duckworth et al., 2007; Duckworth and Quinn, 2009), as well as self-control, the capacity to regulate attention, emotion, and behavior in the presence of temptation (Duckworth and Gross, 2014). However, Duckworth has suggested that grit differentiates from the personality trait conscientiousness by the focus on “effort and interest over time” and showed that grit independently predicts academic performance above and beyond personality and similar traits such as self-control (Duckworth et al., 2007; Duckworth and Quinn, 2009).
Other predictive factors of achievement that have been looked at in comparison with grit include effort regulation, self-efficacy (Muenks et al., 2017; Usher et al., 2018), self-regulated learning (Wolters and Hussain, 2015; Xu et al., 2020), and self-esteem (Weisskirch, 2018), all of which are also constructs theorized to influence academic performance (Schunk and Greene, 2018). However, these constructs are often measured in a domain specific way (Bong, 2001). For example, questionnaire items assessing self-efficacy often specifically refer to the academic subject (e.g., maths or reading). Self-efficacy in maths can be more highly correlated with academic performance in maths compared with academic performance in reading. The Grit Questionnaire, on the other hand, measures a rather general concept thus lacking a contextual focus which may attenuate the predictive validity for domain specific performance. It has been suggested that the limited predictive effect of grit might be due to the fact that the Grit scale is a domain general construct, therefore lacking specificity directly relevant for academic performance. Recent research in measurement of grit has proposed and developed instruments of grit that measure different domains, academic and nonacademic (Schmidt et al., 2017; Cormier et al., 2019). It has been shown that grit, when measured specific to a domain, is more highly correlated with performance in the corresponding domain (e.g., academic grit is more highly correlated with academic performance). In future adult distance education studies of grit, academic grit can be assessed to pin-point the predictive effect of grit on academic performance.
Conclusion and Implications
To conclude, the current study showed that the Consistency of Interests rather than Perseverance of Effort is a predictor of academic performance in adult distance education students, and that the measurement precision of the Perseverance of Effort dimension needs to be improved. Further research in this population needs to refine the measurement of the Grit Questionnaire in order to better understand the role of grit in the academic success of adult distance education students, and what further factors might explain the relationship between Consistency of Interest and academic performance.
There are intervention studies that have shown that certain personality traits similar to Perseverance of Effort, such as conscientiousness, can be responsive to interventions (Roberts et al., 2017). Nevertheless, in most of previous research, the effect size of grit on academic achievement was rather modest, indicating potentially limited efficacy if an intervention is put into practice. Future studies in adult distance education students should explore the extent to which the grit construct can uniquely predict academic performance in order to fully establish the usefulness of this instrument to the previously established constructs that also predict academic performance. Until then, caution should be taken regarding designing interventions to “raise” grit in adult distance education students as a means to promote academic performance.
Data Availability Statement
The data analyzed in this study is subject to the following licenses/restrictions: the data used for the current article is part of a larger datasets that securely stored on an institutional server. It is thus not possible to for the data to be publicly available from open servers free to download. Requests to access these datasets should be directed to RG,cmVuYXRlLmRlZ3Jvb3RAb3Uubmw=.
Ethics Statement
The studies involving human participants were reviewed and approved by the Ethical Committe of the Open University of the Netherlands. The patients/participants provided their written informed consent to participate in this study.
Author Contributions
KX designed and performed the analysis, and wrote the manuscript. CM, HG, JN, and RG provided critical input on the design and substantially improved the manuscript. All authors contributed to the article and approved the submitted version.
Conflict of Interest
The authors declare that the research was conducted in the absence of any commercial or financial relationships that could be construed as a potential conflict of interest.
References
Abuhassàn, A., and Bates, T. C. (2015). Grit distinguishing effortful persistence from conscientiousness. J. Individ. Differ. 36, 205–214. doi: 10.1027/1614-0001/a000175
Akos, P., and Kretchmar, J. (2017). Investigating grit at a non-cognitive predictor of college success. Rev. High. Educ. 40, 163–186. doi: 10.1353/rhe.2017.0000
Aparicio, M., Bacao, F., and Oliveira, T. (2017). Grit in the path to e-learning success. Comput. Hum. Behav. 66, 388–399. doi: 10.1016/j.chb.2016.10.009
Areepattamannil, S., and Khine, M. S. (2017). Evaluating the psychometric properties of the original grit scale using Rasch analysis in an Arab adolescent sample. J. Psychoeduc. Assess. 36, 856–862. doi: 10.1177/0734282917719976
Arslan, S., Akin, A., and Çitemel, N. (2013). The predictive role of grit on metacognition in Turkish university students. Stud. Psychol. 55, 311–320. doi: 10.21909/sp.2013.04.645
Bong, M. (2001). Between-and within-domain relations of academic motivation among middle and high school students: self-efficacy, task value, and achievement goals. J. Educ. Psychol. 93, 23–34. doi: 10.1037//0022-0663.93.1.23
Chen, F. F. (2007). Sensitivity of goodness of fit indexes to lack of measurement invariance. Struct. Equ. Modeling 14, 464–504. doi: 10.1080/10705510701301834
Cheung, G. W., and Rensvold, R. B. (2001). The effects of model parsimony and sampling error on the fit of structural equation models. Organ. Res. Methods 4, 236–264. doi: 10.1177/109442810143004
Cormier, D. L., Dunn, J. G. H., and Causgrove Dunn, J. (2019). Examining the domain specificity of grit. Pers. Individ. Dif. 139, 349–354. doi: 10.1016/j.paid.2018.11.026
Credé, M. (2018). What shall we do about grit? A critical review of what we know and what we don’t know. Educ. Res. 47, 606–611. doi: 10.3102/0013189X18801322
Credé, M. (2019). Total grit scale score does not represent perseverance. Proc. Natl. Acad. Sci. U.S.A. 116, 3941–3941. doi: 10.1073/pnas.1816934116
Credé, M., Tynan, M. C., and Harms, P. D. (2017). Much ado about grit: a meta-analytic synthesis of the grit literature. J. Pers. Soc. Psychol. 113, 492–511. doi: 10.1037/pspp0000102
Datu, J. A. D., McInerney, D. M., Żemojtel-Piotrowska, M., Hitokoto, H., and Datu, N. (2020). Is grittiness next to happiness? Examining the association of triarchic model of grit dimensions with well-being outcomes. J. Happiness Stud. doi: 10.1007/s10902-020-00260-6
Datu, J. A. D., Valdez, J. P. M., and King, R. B. (2016). Perseverance counts but consistency does not! Validating the short grit scale in a collectivist setting. Curr. Psychol. 35, 121–130. doi: 10.1007/s12144-015-9374-2
Datu, J. A. D., Yuen, M., and Chen, G. (2017). Development and validation of the triarchic model of grit scale (TMGS): evidence from Filipino undergraduate students. Pers. Individ. Dif. 114, 198–205. doi: 10.1016/j.paid.2017.04.012
Datu, J. A. D., Yuen, M., and Chen, G. (2018). The triarchic model of grit is linked to academic success and well-being among Filipino high school students. Sch. Psychol. Q. 33, 428–438. doi: 10.1037/spq0000234
Disabato, D. J., Goodman, F. R., and Kashdan, T. B. (2019). Is grit relevant to well-being and strengths? Evidence across the globe for separating perseverance of effort and consistency of interests. J. Pers. 87, 194–211. doi: 10.1111/jopy.12382
Duckworth, A. L., and Gross, J. J. (2014). Self-control and grit: related but separable determinants of success. Curr. Dir. Psychol. Sci. 23, 319–325. doi: 10.1177/0963721414541462
Duckworth, A. L., Peterson, C., Matthews, M. D., and Kelly, D. R. (2007). Grit: perseverance and passion for long-term goals. J. Pers. Soc. Psychol. 92, 1087–1101. doi: 10.1037/0022-3514.92.6.1087
Duckworth, A. L., and Quinn, P. D. (2009). Development and validation of the short grit scale (GRIT–S). J. Pers. Assess. 91, 166–174. doi: 10.1080/00223890802634290
Eskreis-Winkler, L., Shulman, E. P., Beal, S. A., and Duckworth, A. L. (2014). The grit effect: predicting retention in the military, the workplace, school and marriage. Front. Psychol. 5:36. doi: 10.3389/fpsyg.2014.00036
Eurydice (2011). Adults in Formal Education: Policies and Practice in Europe (9292011472). Available online at: https://publications.europa.eu/en/publication-detail/-/publication/f8d1465a-38e4-418e-be51-17d41ccb64bb/language-en (accessed January 10, 2012).
Fan, X., Thompson, B., and Wang, L. (1999). Effects of sample size, estimation methods, and model specification on structural equation modeling fit indexes. Struct. Equ. Modeling 6, 56–83. doi: 10.1080/10705519909540119
Gijselaers, H. J., Elena, B., Kirschner, P. A., and de Groot, R. H. (2016a). Physical activity, sleep, and nutrition do not predict cognitive performance in young and middle-aged adults. Front. Psychol. 7:642. doi: 10.3389/fpsyg.2016.00642
Gijselaers, H. J., Kirschner, P. A., and de Groot, R. H. (2016b). The consumption of breakfast, fish and/or caffeine does not predict study progress in adult distance education. Int. J. Vitam. Nutr. Res. 1, 1–9. doi: 10.1024/0300-9831/a000278
Gijselaers, H. J., Kirschner, P. A., Verboon, P., and de Groot, R. H. (2016c). Sedentary behavior and not physical activity predicts study progress in distance education. Learn. Individ. Differ. 49, 224–229. doi: 10.1016/j.lindif.2016.06.021
Gijselaers, H. J., Kirschner, P. A., and de Groot, R. H. (2015). Chronotype, sleep quality and sleep duration in adult distance education: not related to study progress. Learn. Individ. Differ. 44, 46–52. doi: 10.1016/j.lindif.2015.10.002
Gijselaers, H. J., Meijs, C., Neroni, J., Kirschner, P. A., and de Groot, R. H. (2017). Updating and not shifting predicts learning performance in young and middle-aged adults. Mind Brain Educ. 11, 190–200. doi: 10.1111/mbe.12147
Guo, J., Tang, X., and Xu, K. M. (2019). Capturing the multiplicative effect of perseverance and passion: measurement issues of combining two grit facets. Proc. Natl. Acad. Sci. U.S.A. 116, 3938–3940. doi: 10.1073/pnas.1820125116
Howell, A. J. (2009). Flourishing: achievement-related correlates of students’ well-being. J. Posit. Psychol. 4, 1–13. doi: 10.1080/17439760802043459
Hu, L., and Bentler, P. M. (1999). Cutoff criteria for fit indexes in covariance structure analysis: conventional criteria versus new alternatives. Struct. Equ. Modeling 6, 1–55. doi: 10.1080/10705519909540118
Hwang, M. H., Lim, H. J., and Ha, H. S. (2017). Effects of grit on the academic success of adult female students at Korean Open University. Psychol. Rep. 121, 705–725. doi: 10.1177/0033294117734834
Jachimowicz, J. M., Wihler, A., Bailey, E. R., and Galinsky, A. D. (2018). Why grit requires perseverance and passion to positively predict performance. Proc. Natl. Acad. Sci. 115, 9980–9985. doi: 10.1073/pnas.1803561115
Kaplan, D. (2000). Structural Equation Modeling: Foundations and Extensions, Vol. 10. Thousand Oaks, CA: Sage Publications, Inc.
Li, J., Lin, L., Zhao, Y., Chen, J., and Wang, S. (2018a). Grittier Chinese adolescents are happier: the mediating role of mindfulness. Pers. Individ. Dif. 131, 232–237. doi: 10.1016/j.paid.2018.05.007
Li, J., Zhao, Y., Kong, F., Du, S., Yang, S., and Wang, S. (2018b). Psychometric assessment of the Short Grit Scale among Chinese adolescents. J. Psychoeduc. Assess. 36, 291–296. doi: 10.1177/0734282916674858
LimeSurvey Project Team/Carsten Schmitz (2012). LimeSurvey: An Open Source Survey Tool. Available online at: http://www.limesurvey.org (accessed November 30, 2020).
Loken, E., and Gelman, A. (2017). Measurement error and the replication crisis. Science 355, 584–585. doi: 10.1126/science.aal3618
Marsh, H. W., Balla, J. R., and McDonald, R. P. (1988). Goodness-of-fit indexes in confirmatory factor analysis: the effect of sample size. Psychol. Bull. 103, 391–410. doi: 10.1037/0033-2909.103.3.391
Marsh, H. W., Hau, K. T., and Grayson, D. A. (2005). “Goodness of fit evaluation in structural equation modeling,” in Contemporary Psychometrics. A Festschrift to Roderick P. McDonald, eds A. Maydeu-Olivares and J. J. McArdle (Mahwah, NJ: Lawrence Erlbaum Associates, Inc), 225–340.
Marsh, H. W., Hau, K. T., and Wen, Z. (2004). In search of golden rules: comment on hypothesis-testing approaches to setting cutoff values for fit indexes and dangers in overgeneralizing Hu and Bentler’s (1999) findings. Struct. Equ. Modeling 11, 320–341. doi: 10.1207/s15328007sem1103_2
Meijs, C., Neroni, J., Gijselaers, H. J., Leontjevas, R., Kirschner, P. A., and de Groot, R. H. (2019). Motivated strategies for learning questionnaire part B revisited: new subscales for an adult distance education setting. Internet High. Educ. 40, 1–11. doi: 10.1016/j.iheduc.2018.09.003
Moerkerke, G. (2014). Trends in student population and curriculum design for the Open University of the Netherlands. Int. J. Contin. Educ. Lifelong Learn. 7, 71–91.
Morin, A. J. S., Marsh, H. W., and Nagengast, B. (2013). “Exploratory structural equation modeling,” in Structural Equation Modeling: a Second Course, 2 Edn, eds G. R. Hancock and R. O. Mueller (Charlotte, NC: Information Age Publishing).
Muenks, K., Wigfield, A., Yang, J. S., and O’Neal, C. R. (2017). How true is grit? Assessing its relations to high school and college students’ personality characteristics, self-regulation, engagement, and achievement. J. Educ. Psychol. 109, 599–620. doi: 10.1037/edu0000153
Neroni, J., Gijselaers, H. J., Kirschner, P. A., and Groot, R. H. (2015). The Adult Learning Open University Determinants (ALOUD) study: biological and psychological factors associated with learning performance in adult distance education. Br. J. Educ. Technol. 46, 953–960. doi: 10.1111/bjet.12288
Palczyńska, M., and Świst, K. (2018). Personality, cognitive skills and life outcomes: evidence from the Polish follow-up study to PIAAC. Large Scale Assess. Educ. 6:2. doi: 10.1186/s40536-018-0056-z
Roberts, B. W., Luo, J., Briley, D. A., Chow, P. I., Su, R., and Hill, P. L. (2017). A systematic review of personality trait change through intervention. Psychol. Bull. 143, 117–141. doi: 10.1037/bul0000088
Samejima, F. (1997). Graded Response Model. In Handbook of Modern Item Response Theory. Germany: Springer, 85–100.
Schmidt, F. T., Fleckenstein, J., Retelsdorf, J., Eskreis-Winkler, L., and Möller, J. (2017). Measuring grit: a German validation and a domain-specific approach to grit. Eur. J. Psychol. Assess. 35, 436–447. doi: 10.1027/1015-5759/a000407
Schmitt, N. (2012). Development of rationale and measures of noncognitive college student potential. Educ. Psychol. 47, 18–29. doi: 10.1080/00461520.2011.610680
Schunk, D. H., and Greene, J. A. (eds) (2018). Handbook of Self-Regulation of Learning and Performance. New York, NY: Routledge.
Shechtman, N., DeBarger, A. H., Dornsife, C., Rosier, S., and Yarnall, L. (2013). Promoting Grit, Tenacity, and Perseverance: Critical Factors for Success in the 21st Century, Vol. 1. Washington, DC: US Department of Education, 1–107.
Soto, C. J., John, O. P., Gosling, S. D., and Potter, J. (2011). Age differences in personality traits from 10 to 65: big five domains and facets in a large cross-sectional sample. J. Pers. Soc. Psychol. 100, 330–348. doi: 10.1037/a0021717
Steinmayr, R., Weidinger, A. F., and Wigfield, A. (2018). Does students’ grit predict their school achievement above and beyond their personality, motivation, and engagement? Contemp. Educ. Psychol. 53, 106–122. doi: 10.1016/j.cedpsych.2018.02.004
Usher, E. L., Li, C. R., Butz, A. R., and Rojas, J. P. (2018). Perseverant grit and self-efficacy: are both essential for children’s academic success? J. Educ. Psychol. 111, 877–902. doi: 10.1037/edu0000324
Wang, S., Dai, J., Li, J., Wang, X., Chen, T., Yang, X., et al. (2018). Neuroanatomical correlates of grit: growth mindset mediates the association between gray matter structure and trait grit in late adolescence. Hum. Brain Mapp. 39, 1688–1699. doi: 10.1002/hbm.23944
Wang, S., Zhou, M., Chen, T., Yang, X., Chen, G., Wang, M., et al. (2017). Grit and the brain: spontaneous activity of the dorsomedial prefrontal cortex mediates the relationship between the trait grit and academic performance. Soc. Cogn. Affect. Neurosci. 12, 452–460. doi: 10.1093/scan/nsw145
Weisskirch, R. S. (2018). Grit, self-esteem, learning strategies and attitudes and estimated and achieved course grades among college students. Curr. Psychol. 37, 21–27. doi: 10.1007/s12144-016-9485-4
West, M. R., Kraft, M. A., Finn, A. S., Martin, R. E., Duckworth, A. L., Gabrieli, C. F., et al. (2016). Promise and paradox: measuring students’ non-cognitive skills and the impact of schooling. Educ. Eval. Policy Anal. 38, 148–170. doi: 10.3102/0162373715597298
Wolters, C. A., and Hussain, M. (2015). Investigating grit and its relations with college students’ self-regulated learning and academic achievement. Metacogn. Learn. 10, 293–311. doi: 10.1007/s11409-014-9128-9
Woods, C. M. (2009). Evaluation of MIMIC-model methods for DIF testing with comparison to two-group analysis. Multivariate Behav. Res. 44, 1–27. doi: 10.1080/00273170802620121
Wyszyńska, P., Ponikiewska, K., Karaś, D., Najderska, M., and Rogoza, R. (2017). Psychometric properties of the Polish version of the short Grit scale. Pol. Psychol. Bull. 48, 229–236. doi: 10.1515/ppb-2017-0026
Xu, M. K., Gaysina, D., Tsonaka, R., Morin, A. J. S., Croudace, T. J., Barnett, J. H., et al. (2017). Monoamine oxidase A (MAOA) gene and personality traits from late adolescence through early adulthood: a latent variable investigation. Front. Psychol. 8:1736. doi: 10.3389/fpsyg.2017.01736
Xu, K. M., Cunha-Harvey, A. R., King, R., de Koning, B., Paas, F., Baars, M., et al. (2020). A cross-cultural investigation on perseverance, self-regulated learning, motivation, and achievement. OSF. Available online at: https://osf.io/p4d nk
Yu, C.-Y. (2002). Evaluating Cutoff Criteria of Model Fit Indices for Latent Variable Models with Binary and Continuous Outcomes. Los Angeles, CA: University of California.
Keywords: distance education, grit, adult students, psychometric validation, academic performance
Citation: Xu KM, Meijs C, Gijselaers HJM, Neroni J and de Groot RHM (2020) Measuring Perseverance and Passion in Distance Education Students: Psychometric Properties of the Grit Questionnaire and Associations With Academic Performance. Front. Psychol. 11:563585. doi: 10.3389/fpsyg.2020.563585
Received: 19 May 2020; Accepted: 12 October 2020;
Published: 14 December 2020.
Edited by:
Jason C. Immekus, University of Louisville, United StatesReviewed by:
Jesus Alfonso Daep Datu, The Education University of Hong Kong, Hong KongSong Wang, Sichuan University, China
Copyright © 2020 Xu, Meijs, Gijselaers, Neroni and de Groot. This is an open-access article distributed under the terms of the Creative Commons Attribution License (CC BY). The use, distribution or reproduction in other forums is permitted, provided the original author(s) and the copyright owner(s) are credited and that the original publication in this journal is cited, in accordance with accepted academic practice. No use, distribution or reproduction is permitted which does not comply with these terms.
*Correspondence: Kate M. Xu, bWFuLmsueHVAZ21haWwuY29t; a2F0ZS54dUBvdS5ubA==