 Zhaohan Wang
 Yue Ma1†
 Wennian Cai
 Tao Zhang
 Tiejun Shui
 Haijun Yang
- 1West China School of Public Health and West China Fourth Hospital, Sichuan University, Chengdu, China
- 2National Cancer Center, National Clinical Research Center for Cancer, Cancer Hospital and Shenzhen Hospital, Chinese Academy of Medical Sciences and Peking Union Medical College, Shenzhen, China
- 3Yunnan Center for Disease Control and Prevention, Kunming, China
- 4Yan'an Hospital of Kunming City, Kunming, China
Background: Hand, foot, and mouth disease (HFMD) poses a significant risk to children. While most studies focus on the individual effects of temperature or relative humidity, the combined effect of these factors and their temporal variations remain unclear. Understanding these effects is essential for designing effective public health interventions.
Methods: Using daily meteorological and HFMD case data collected from 2010 to 2019 in 16 cities in Yunnan Province, China, we compared three composite indices (Humidex, heat index, and temperature–humidity index) to identify the indices that best captured the combined effect of temperature and humidity on HFMD risk. An extended time-varying distributed lag nonlinear model (DLNM) was used to examine how these effects shifted over time across population subgroups. Relative risk (RR) values at the 1%, 25%, 75%, and 99% quantiles were extracted to represent effects at extremely, moderately low, moderately, and extremely high levels.
Results: The THIa8 demonstrated a monotonic upward exposure–response curve with narrower confidence intervals, more consistent relationships across cities, and the best model fit (Quasi-Akaike information criterion (QAIC) = 283564.2, Akaike information criterion (AIC) = 45.46, and Bayesian information criterion (BIC) = 62.30). HFMD risk decreased at extremely low (RR = 0.677, 95% CI: 0.632, 0.724) and moderately low THIa8 levels (RR = 0.766, 95% CI: 0.713, 0.823) but increased at moderately high (RR = 1.121, 95% CI: 1.084, 1.159) and extremely high THIa8 levels (RR = 1.478, 95% CI: 1.300, 1.680). Temporal analysis revealed a decreased HFMD risk at extremely low THIa8 values from 2010 to 2019, weakened protective effects at moderately low THIa8 values and an increased risk at extremely high THIa8 values. Subgroup analyses revealed that kindergarten children (3 ≤ age < 6 years) and females were particularly vulnerable.
Conclusion: The THIa8 effectively captures the combined effect of temperature and relative humidity on HFMD risk revealing temporal variations. Adaptive public health strategies are needed to mitigate HFMD transmission under changing environmental conditions.
1 Introduction
Hand, foot, and mouth disease (HFMD) is an infectious disease primarily caused by enteroviruses and is widely distributed across the Asia-Pacific region (1–3). Most cases are slight and self-remitting, but severe cases can lead to complications such as aseptic meningitis, pulmonary edema, and myocarditis (4). Since the early 21st century, the Asia–Pacific region has experienced several large-scale HFMD outbreaks, with a noticeable increase in the proportion of severe cases, raising concerns among public health authorities (5, 6). In 2008, China designated HFMD a category C notifiable disease (7). Approximately 2 million cases are reported annually due to limited vaccination coverage (self-paid vaccination) and the lack of cross-protection against other serotypes causing HFMD (8, 9). HFMD has become the primary focus in the field of infectious diseases among children in China (10). The absence of specific antiviral treatments and high incidence rate make HFMD a substantial challenge to public health.
Previous studies have indicated that environmental factors, especially temperature and humidity, significantly increase the spread of HFMD (9–15). Several studies have analyzed the independent effects of temperature and humidity. However, the effects of these two factors on HFMD risk are not independent but rather have a mutual influence (14–19). This complex relationship cannot be fully captured by considering temperature or relative humidity alone.
Currently, two common approaches are applied to examine the combined effect of temperature and relative humidity, involving stratified or varying coefficient models (14–16). These methods allow researchers to examine how temperature affects HFMD risk at various humidity levels and vice versa, thereby clarifying their interaction. However, these methods are often relatively complex and may not effectively quantify how their combined effect influences disease outcomes. Another common approach involves constructing composite indices. Several indices have been explored for HFMD, including the heat index, temperature–humidity index (THI), and humidex (17–19). These indices provide a more comprehensive framework for assessing the combined effect of the two factors on HFMD risk, allowing for the use of exposure–response curves to quantitatively describe their relationship. This approach offers a more intuitive and simplified analysis of complex weather conditions and their impact on health outcomes. However, while these indices may offer a more robust framework for evaluating the effects of weather factors on disease risk, few studies have evaluated their suitability in characterizing the combined effect of these factors on HFMD risk.
Furthermore, several studies suggest that the effect of environmental variables on health risks evolves over time and are influenced by dynamic conditions such as climate change (20–26). For HFMD, the combined effect of temperature and relative humidity on disease outcomes may also change over time. Understanding how the combined effect of these two factors on HFMD risk evolves over time is crucial for accurately assessing current health risks and informing public health strategies. Such insights can help guide preventive measures, particularly in regions with unique climatic patterns like Yunnan Province.
This study focused on two key issues: determining which composite index best captures the combined effect of the two factors on HFMD risk and exploring how the combined effect changes over time. Our study area covered 16 cities in Yunnan Province, China. A two-stage time series analysis was applied to compare the performance of three composite indices, the heat index, THI, and Humidex, which were used to capture the combined effect of the two factors on HFMD risk. Using the optimal composite index, we conducted a time-varying DLNM to study the temporal trends of the combined effect of the two factors on HFMD risk in Yunnan, China, from 2010 to 2019. We also examined the differences in the time-varying combined effect across age and sex.
2 Methods
2.1 Study site
Located in China’s southwestern border area, Yunnan Province covers a total area of approximately 394,100 square kilometers (27). The province has complex climatic conditions characterized by diverse climate types and small annual temperature variations (28). The climate in Yunnan Province has periodic patterns, with meteorological factors showing complex and variable fluctuations over time. We selected all cities in Yunnan across cold, temperate, and tropical climates (including subtropical zones) as the study area (Supplementary Figures S1–S3).
2.2 Data sources
Data on the daily counts of HFMD cases were collected from the Yunnan Center for Disease Control and Prevention, covering the period from January 2010 to December 2019. This research examined HFMD cases in children under 6 years of age. To conduct the age subgroup analysis, we categorized the patients into two groups: Group 1 (0 ≤ age < 3 years) and Group 2 (3 ≤ age <6 years). The two groups specifically represent preschool children and kindergarten children.
Daily meteorological data were sourced from the National Meteorological Science Data Center,1 including daily average temperature (°C), average humidity (%), average wind velocity (m/s), sunshine duration (hours), daily rainfall (mm), and average air pressure (HPa). A comprehensive description of Yunnan’s meteorological monitoring stations can be found in Supplementary Table S1. To determine city-specific meteorological conditions, we averaged the daily variables for each city throughout the study period (Supplementary Table S2).
2.3 Description of composite indices
We included three widely discussed and applied composite temperature–humidity indices, namely, the Humidex, heat index, and THI, to assess their effectiveness in capturing the combined effect of these factors on HFMD risk. These composite indices have been previously explored in studies of HFMD and have demonstrated success in evaluating the combined effects of temperature and humidity on disease transmission (17–19). Their definitions and formulas are as follows.
2.3.1 Humidex
The Humidex has been widely used as a composite index reflecting both temperature and relative humidity (29). The formula can be written as Equation 1:
T is the city-specific daily mean air temperature (°C), and R is the city-specific daily relative humidity (%). This index assumes a linear relationship where relatively high humidity amplifies the effect of temperature on human physiology, particularly under warm conditions. This index highlights how vapor pressure from relative humidity interacts with air temperature to increase perceived heat, making it a useful tool for understanding temperature–humidity interactions in moderate- to high-temperature environments.
2.3.2 Heat index
The heat index uses a complex polynomial function to incorporate various factors (such as body height, weight, and sunlight exposure) that affect the heat dissipation of the body (30). The formula can be written as Equation 2:
This index incorporates nonlinear interactions, showing that the impact of humidity becomes more pronounced with increasing temperature. This index emphasizes how temperature and humidity jointly contribute to heat stress, with relative humidity playing a greater role under extreme heat conditions. The heat index is particularly suitable for capturing the dynamic interplay of these factors in hot and humid climates.
2.3.3 THI
The THI is an alternative index developed by researchers (18). The THI accounts for the complex relationship between temperature and relative humidity, where the impact of humidity on the index value increases as the relative humidity deviates from 50%. The formula is as follows Equation 3:
where T is the daily temperature (°C) and R is the daily relative humidity. represents the degree to which the impact temperature is greater at 100% relative humidity than at 50% relative humidity. On the basis of prior knowledge and sensitivity analysis results (Supplementary Table S9), we ultimately selected = 1.8 for the study. These findings indicate that 100% relative humidity increases the effect of temperature on HFMD risk 1.8 times more than 50% relative humidity does. Henceforth, we refer to this index as the THIa8.
2.4 Statistical analyses
A three-stage analysis was used to compare our candidate indices. The temperature was included as a reference for comparison. In the first stage, a DLNM with consistent model selection criteria was used to estimate the exposure–response relationships for each index across the 16 cities in Yunnan Province. In the second step, a multivariate meta-regression model was used to synthesize the first-stage results to evaluate the association patterns and model fit of each index, identifying the composite index that best captured the combined effect on HFMD risk. In the third stage, a time-varying DLNM meta strategy was used to analyze temporal variations in the combined effect on HFMD risk as the optimal composite index.
2.4.1 Estimating the exposure–response relationship
The DLNM, developed by Gasparrini et al. (31), has been widely used in climatic and health-related time series. Owing to the sparse nature of HFMD case data in individual cities (Supplementary Table S3), we implemented a generalized DLNM using the quasi-Poisson distribution. Informed by prior knowledge (32) and sensitivity analysis results (Supplementary Text S1; Supplementary Figures S4–S10; Supplementary Tables S4–S9), the model was defined as follows Equation 4:
where represents the daily HFMD incidence on dayt, represents different indices (Humidex, heat index, THIa8, and temperature as a reference), and represents the cross-basis function. The model captures both the exposure-response and lag-response dimensions using a natural cubic spline (ns) with three equidistant knots for the exposure dimension and a natural cubic spline (df = 4) for the lag dimension. The lag period was defined as 0–14 days on the basis of the incubation and infectious periods of HFMD. represents the potential confounding variables, including sunshine duration, air pressure, wind velocity and relative humidity. Seasonal and long-term trends were adjusted via a natural cubic spline with 8 degrees of freedom per year. represents autoregressive terms with data on a logarithmic scale, incorporating 1st- and 2nd-order lags. represents the days of the week, and represents China’s public holidays. Dow was used to control for weekday effects and holiday effects.
2.4.2 Evaluating the association patterns and model fit of the composite index
We aimed to identify a composite index that effectively characterizes the combined effect of temperature and humidity on HFMD risk, with certain desirable properties. First, the exposure–response curves derived from the index should exhibit monotonicity, consistency across different cities, and alignment with established epidemiological patterns. These properties will ensure the interpretability and practical utility of the index in public health interventions. Second, while association patterns provide critical epidemiological insights, better model fit enhances the reliability and robustness of the findings, offering a comprehensive basis for selecting the most suitable index.
To achieve this, we assessed both the association patterns and model fit of the three candidate indices. The performance of each index was assessed using the Quasi-Akaike information criterion (QAIC) (33), Bayesian information criterion (BIC) and Akaike information criterion (AIC). First, we aggregated the QAIC values from the DLNMs fitted to all 16 cities to assess the overall goodness-of-fit for each index across Yunnan Province. Second, a multivariate meta-regression model was applied to synthesize the city-level exposure–response relationships and examine the association patterns of each index at the provincial level. Finally, we compared the AIC and BIC values of the meta-regression models to identify the index with the best overall model fit, providing a comprehensive evaluation of its ability to represent the combined effect on HFMD risk.
2.4.3 Exploring the temporal trends in the exposure–response association by using a time-varying DLNM
The Wald test can determine whether there is temporal heterogeneity in the associations for each city and overall (34). To assess the temporal trends in the combined effect on HFMD risk, we employed a time-varying DLNM (35). We added cross-basis time interactions to capture the time-varying relationships. The time-varying DLNM is as follows Equation 5:
The terms and parameter settings are the same as those in the time-constant DLNM (2.4.1). represents the study time points. represents the reference time point, which is the associated time we wanted to obtain. By changing the reference time, we could observe the associations at different time points. In this study, 2010, 2011, 2012, 2013, and 2019 were used as reference times to obtain the exposure–response curves for each corresponding year. To illustrate this temporal variation, we compared the exposure-response curves for 2010 and 2019, highlighting the changes in risk patterns across these years (34).
For each index, we selected the average value over the entire study period as a point of reference. To thoroughly examine the time-varying exposure–response relationships between each index and HFMD risk, we extracted RR values at the 1%, 25%, 75%, and 99% quantiles of the index values, which represented effects at extremely, moderately low, moderately, and extremely high levels, respectively.
Additionally, analyses stratified by sex and age were conducted to identify vulnerable groups, allowing us to assess variations in susceptibility across demographic groups and achieve a more detailed risk profile.
R (V.3.6.1), including the “dlnm,” “mvmeta,” “splines,” “tsModel,” “ThermIndex,” and “Weathermetrics” packages, was used for all the statistical analyses. Statistical significance was defined as a two-sided p value <0.05 for all tests.
3 Results
3.1 Epidemiological patterns of HFMD cases in Yunnan, China
Between 2010 and 2019, 684,846 HFMD cases were reported across 16 cities in Yunnan, revealing a bimodal seasonal distribution with prominent peaks in both summer (April–July) and winter (October–December). Annually, case counts showed a significant upward trend, with the winter peak becoming increasingly pronounced (Figure 1). Detailed summary statistics of the characteristics are included in Supplementary Table S10.
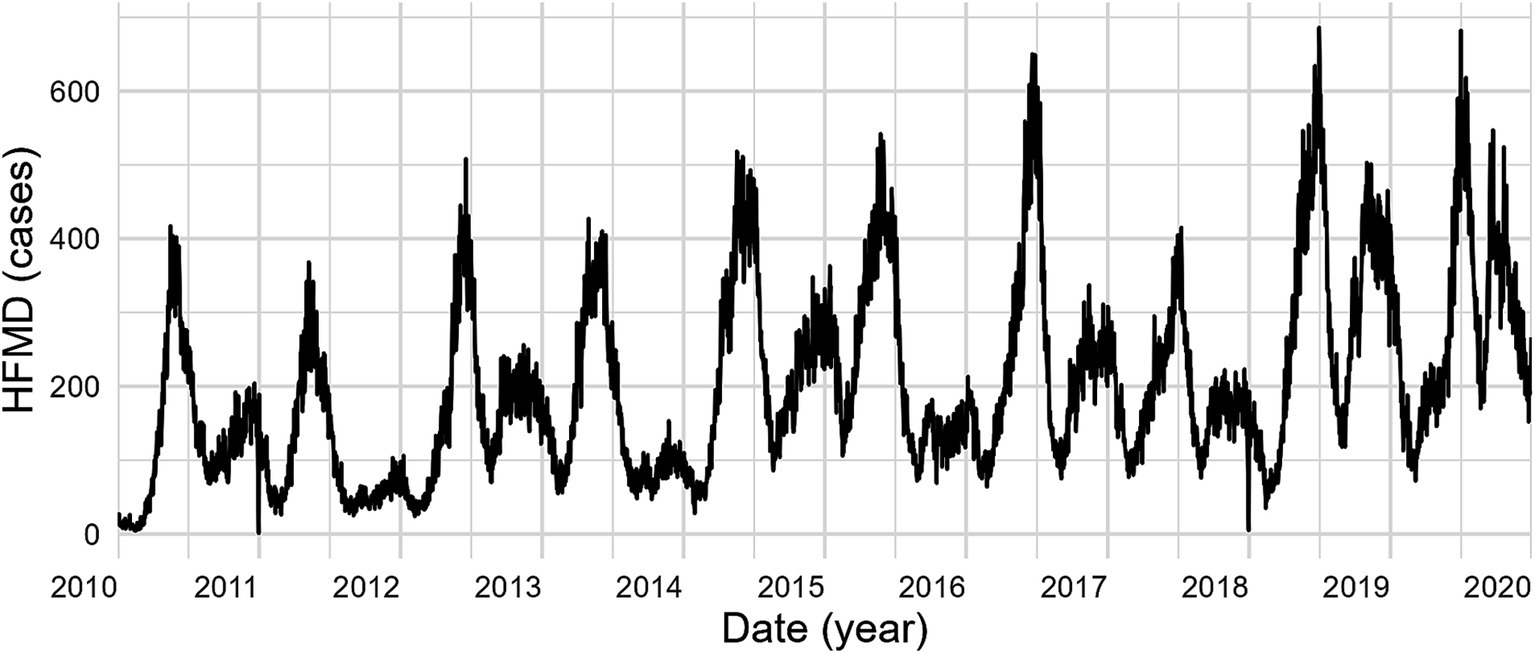
Figure 1. HFMD incidence trend in Yunnan Province, China: 2010–2019.
3.2 Evaluating the association patterns and model fit of the composite indices
Figure 2 shows the cumulative exposure-response relationships across cities for each index, with the solid red line representing the pooled association and dashed gray lines illustrating city-specific variations. We found that the exposure–response curve for the THIa8 exhibited a consistent monotonically increasing trend, especially in the high-value range. This was accompanied by a narrower confidence interval than that of the other indices, indicating a more consistent exposure–response relationship across different cities. In contrast, the risk increasing trends for the heat index and Humidex begin to level off or even decrease in the high-value region, forming an “S”-shaped curve. These indices displayed wider confidence intervals, suggesting greater variability and less stable estimates across different cities.
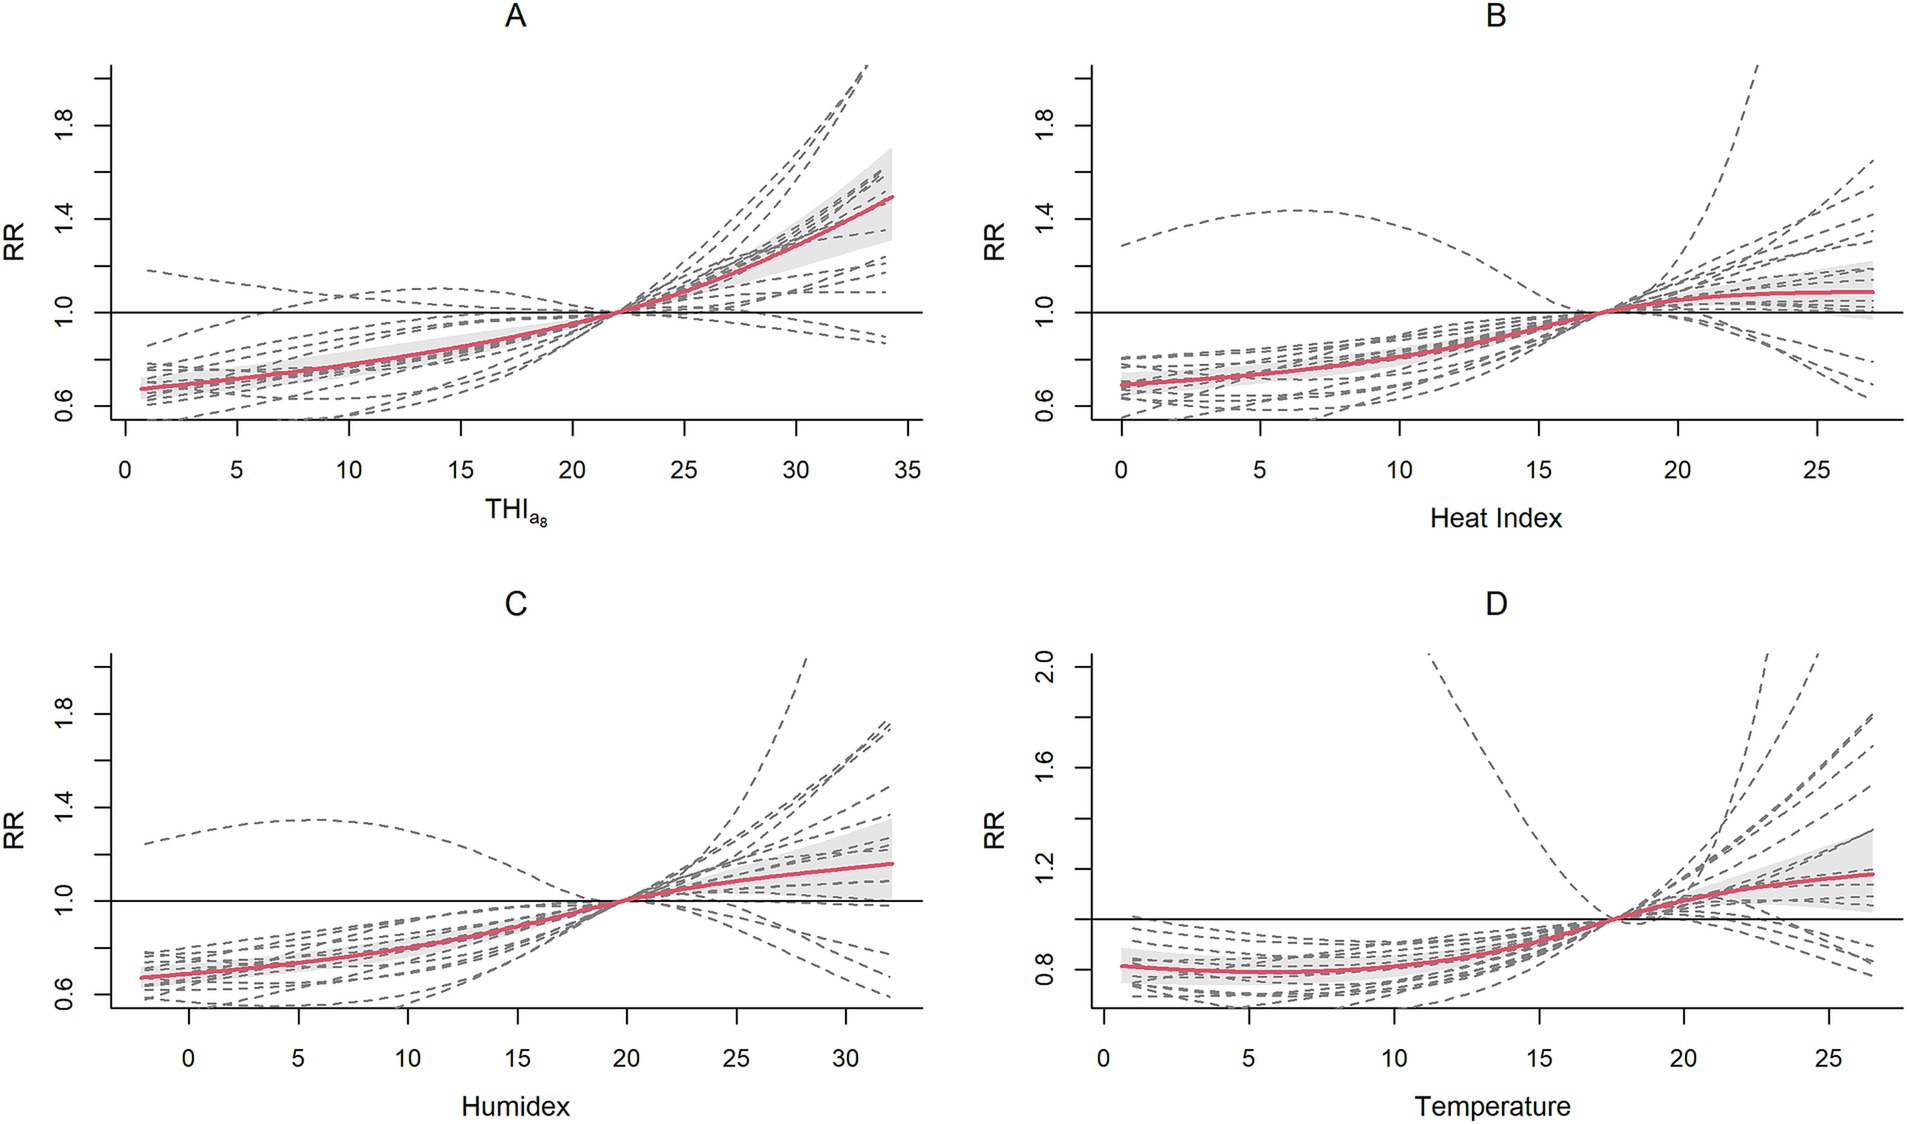
Figure 2. Association patterns for the THIa8 (A), heat index (B), Humidex (C), and temperature (D).
The pooled analysis revealed a significant decrease in HFMD risk at extremely low and moderately low THIa8 levels but an increase at moderately high and extremely high levels. At extremely low THIa8 values, the RR was 0.677 (95% CI, 0.632, 0.724), which increased to 0.766 (95% CI, 0.713, 0.823) at moderately low THIa8 values. Conversely, the RR increased to 1.121 (95% CI, 1.084, 1.159) at moderately high THIa8 values and reached 1.478 (95% CI, 1.300, 1.680) at extremely high THIa8 values.
We subsequently compared the QAICs, AICs and BICs (Table 1). With respect to model fit, the THIa8 consistently had the best performance, regardless of whether the QAIC, BIC or AIC was considered. Considering both the association patterns and model fit, the THIa8 was more suitable for capturing the combined effect of the two factors on HFMD risk.
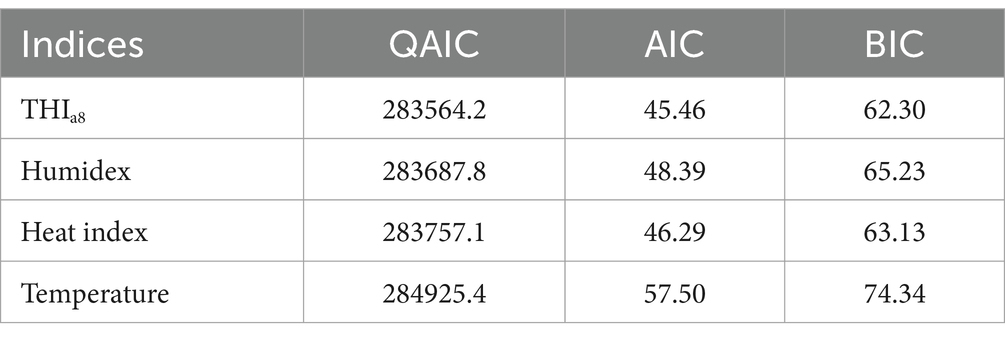
Table 1. The fit of the model for the different indices.
3.3 Temporal trends in the cumulative exposure–response relationships between the THIa8 and HFMD risk
The Wald test results revealed significant temporal trends across Yunnan Province and its individual cities (Supplementary Table S11). Figure 3A shows the effect of the THIa8 on HFMD risk in 2010 (blue) and 2019 (red). There was a significant difference in the effect of the THIa8 on HFMD risk between the beginning and end years of the study. These findings suggest that extremely low THIa8 values are linked to a lower risk of HFMD, whereas moderately low and extremely high THIa8 values correspond to an increased risk. The association between the THIa8 and changes in HFMD risk over time are shown in Supplementary Tables S12, S13. The annual variation in the effect of the THIa8 on HFMD risk during the study period is shown in Supplementary Figure S11.
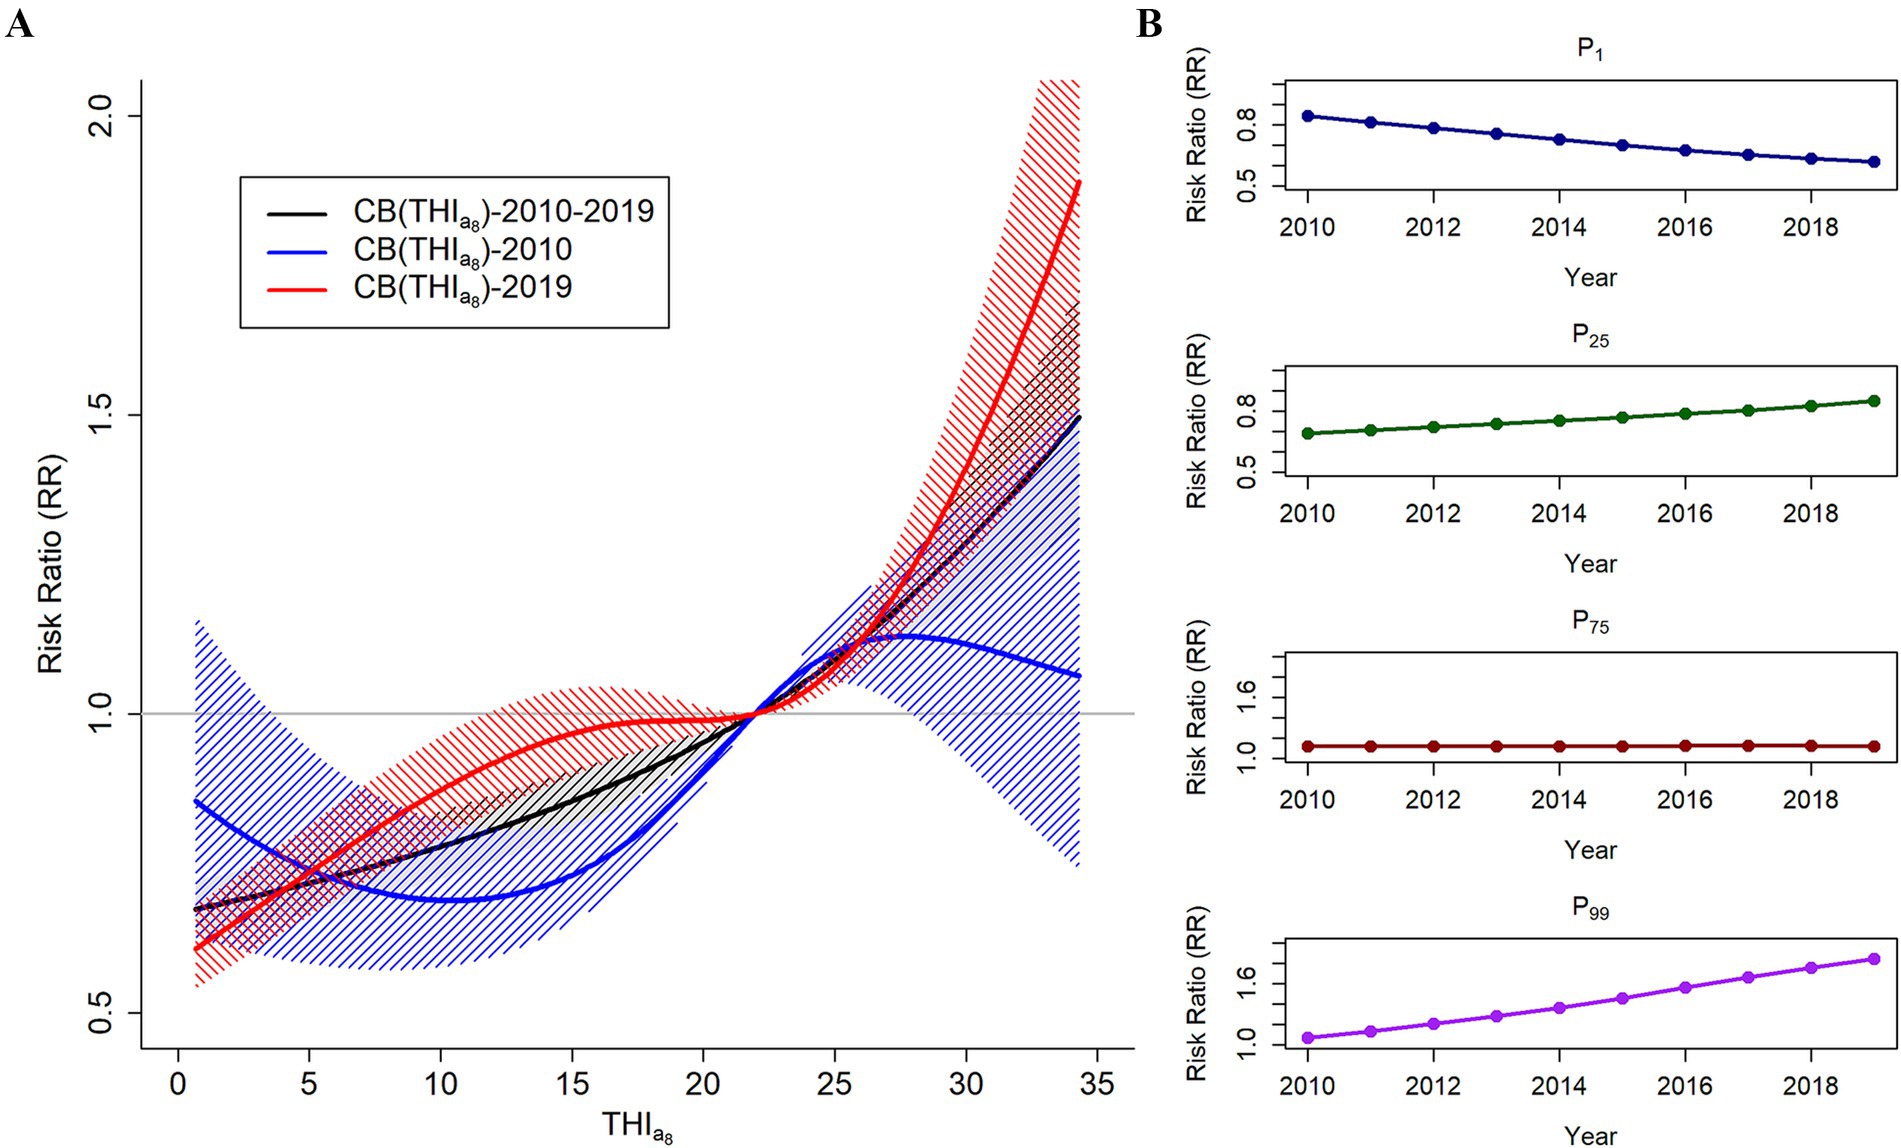
Figure 3. (A) Temporal trends in the associations between the THIa8 and HFMD risk in Yunnan Province from 2010 to 2019. (B) Temporal trends of the associations at P1, the 1st percentile of the THIa8; P25, the 25th percentile of the THIa8; P75, the 75th percentile of the THIa8; and P99, the 99th percentile of the THIa8.
Figure 3B and Table 2 illustrate the temporal trends in HFMD risk associated with varying levels of the THIa8 throughout the study period. At specific percentiles, the THIa8 values are as follows: 1.04 at P1, 9.10 at P25, 25.90 at P75, and 33.96 at P99. At extremely low THIa8 values (P1), the association with HFMD risk showed a consistent downward trend. By 2019, the estimated relative risk (RR) for the effect of the THIa8 had decreased to 0.617 (95% CI, 0.552, 0.691).
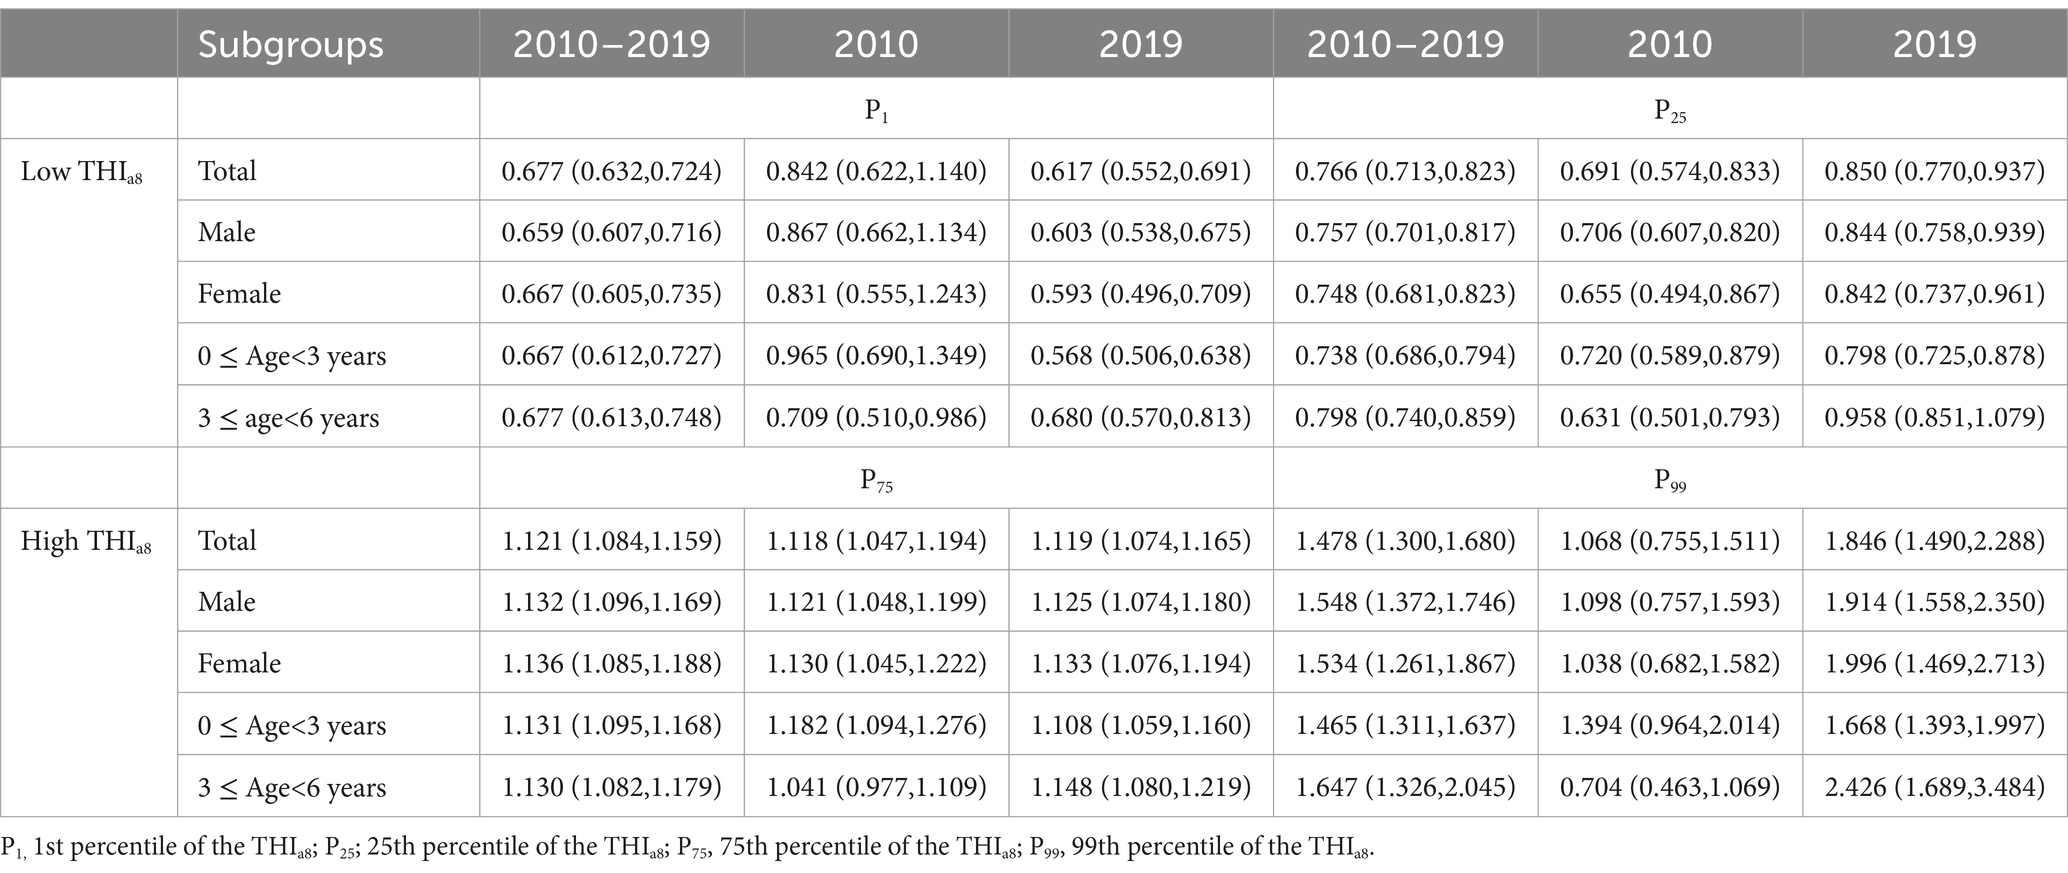
Table 2. Temporal trends in HFMD risk associated with low and high THIa8 levels in the first and last years of the study.
In contrast, moderately low THIa8 (P25) values and extremely high THIa8 (P99) values were negatively associated. For moderately low THIa8 (P25) values, the protective effect steadily decreased, with the RR gradually approaching 1. Moreover, at extremely high THIa8 values (P99), the association with HFMD risk demonstrated a consistent upward trend. By 2019, the RR estimate for the effect of extremely high THIa8 values reached 1.846 (95% CI, 1.490, 2.288).
The subgroup analysis results revealed consistent findings (Figure 4; Table 2; Supplementary Tables S14–S21). Compared with that in 2010, the protective effect of extremely low THIa8 values in 2019 significantly increased across all subgroups, except the 3 ≤ age<6 subgroup. The risk reduction effect was evident among both sexes and other age groups. For the 3 ≤ age<6 group, we observed a marked weakening of the protective effect against HFMD at extremely low THIa8 values, which was more pronounced than that in the other subgroups. For extremely high THIa8 values, all subgroups experienced a substantial increase in HFMD incidence. Additionally, the female subgroup and the 3 ≤ age<6 subgroup presented a more pronounced increase in risk, whereas the male subgroup and the other age groups were comparatively less affected. Supplementary Figures S12–S15 provide detailed annual variations in THIa8 effects across subgroups, further illustrating these trends.
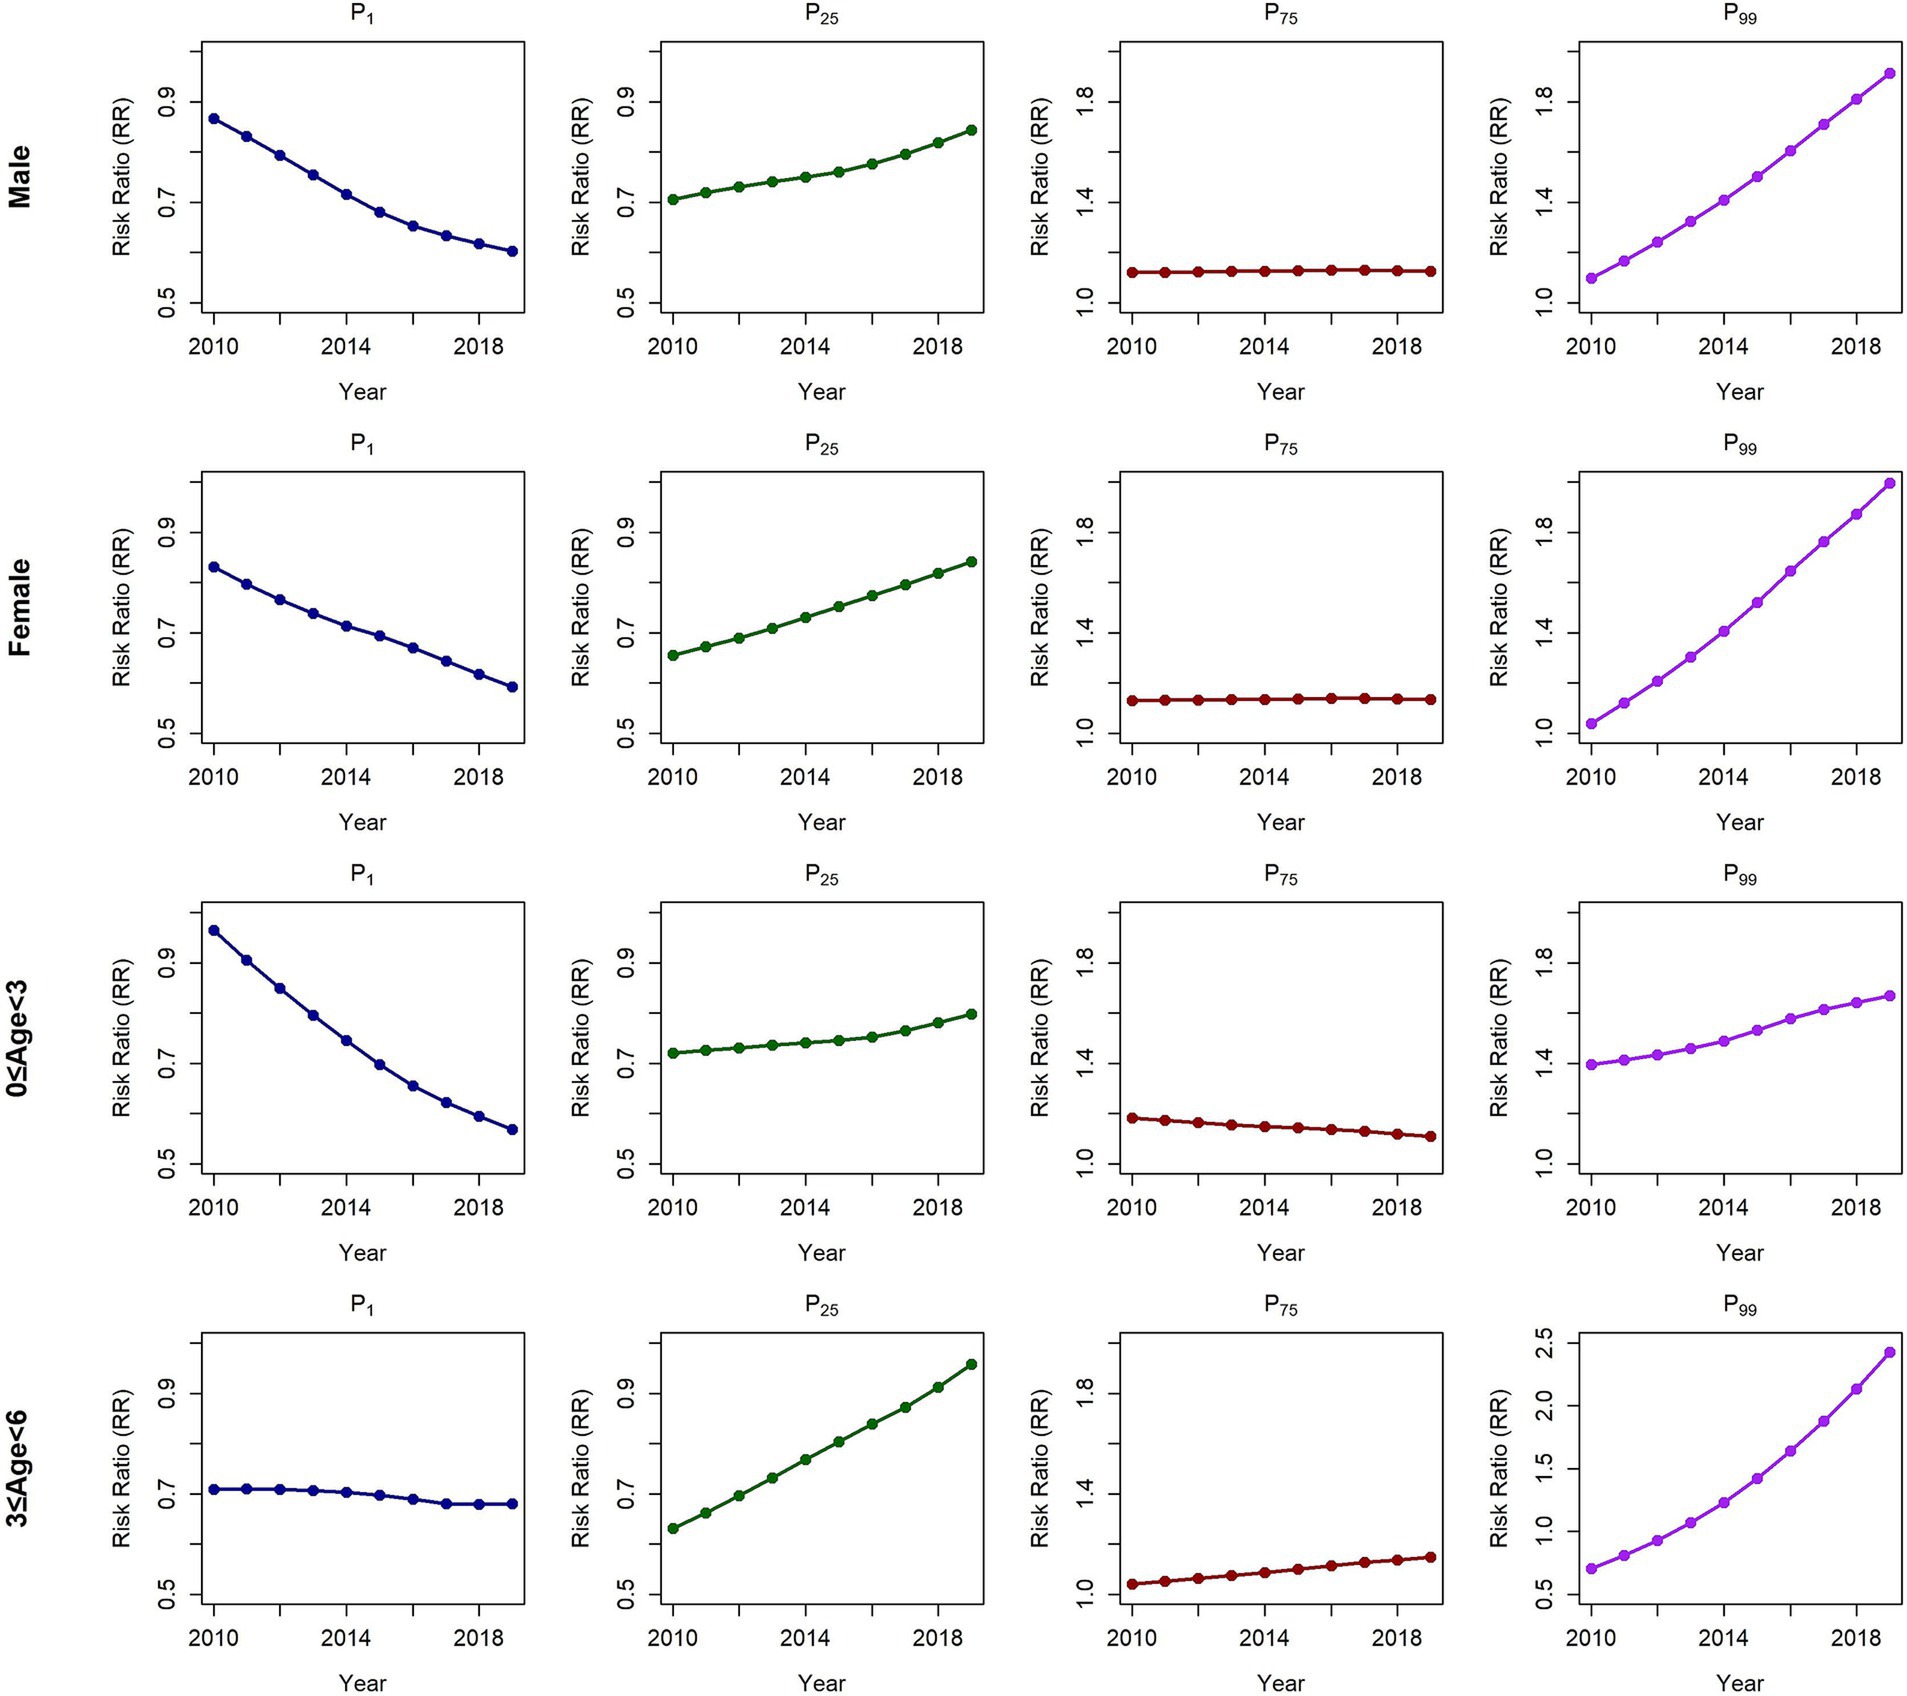
Figure 4. Temporal trends in the relationships between the THIa8 and HFMD risk among subgroups in Yunnan Province at the individual levels annually.
4 Discussion
To our knowledge, this is the first study to systematically analyze the temporal trends in the combined effect of temperature and relative humidity on HFMD risk using a comprehensive indice (THIa8). By evaluating the association patterns and model fit of three composite indices—the Humidex, the heat index, and THIa8—we found that the THIa8 effectively captured the combined effect of these two factors on HFMD risk. Our results also revealed temporal changes in the relationship between the THIa8 and HFMD risk, with a decreased risk at extremely low THIa8 values from 2010 to 2019, weakened protective effects at moderately low THIa8 values, and an increased risk at extremely high THIa8 values over time. Subgroup analyses further revealed that kindergarten-aged children (3 ≤ age < 6 years) and females were particularly vulnerable, stressing the need for targeted public health strategies.
The THIa8 quantifies the combined effects through a monotonic upward exposure–response curve. Specifically, HFMD risk decreased at low THIa8 levels but increases significantly at high THIa8 levels. The formula for the THIa8 quantifies how relative humidity affects the effect of temperature on HFMD risk. The results indicate that 100% relative humidity can increase the effect of temperature on HFMD risk by 1.8 times relative to 50% relative humidity. This pattern aligns with the results of previous studies, which indicate that warm and humid conditions contribute to enterovirus survival and replication, increasing HFMD risk (18, 32, 36–38). Specifically, both high-temperature and high-humidity conditions may increase HFMD risk by an additional 47.3% compared with nonhot or nonhumid conditions (38).
Furthermore, we identified significant temporal trends in the associations. Between 2010 and 2019, there was an increased protective effect at extremely low THIa8 values, a decreased protective effect at moderately low THIa8 values, and an increased risk at extremely high THIa8 values. Many studies support the notion that the associations between environmental factors and infectious diseases change over time (3, 20–24, 35, 39). A meta-analysis examining the drivers of global evolution and infectious disease risk highlighted the ongoing impact of environmental transformations—such as habitat degradation and biodiversity loss—on infectious disease dynamics (40). The study revealed that these changes alter the ecological landscapes of pathogens and vectors, resulting in changing associations between environmental factors and disease risk over time. Our research aligns with these findings.
The protective effect observed at extremely low THIa8 values may be partly due to climate-related factors. According to the THI calculation, extremely low THIa8 values are observed in cool and dry. The survival time of enteric viruses, such as EV-71 and CVA-16, is likely reduced, limiting viral transmission to susceptible hosts. This reduction in viral survival aligns with the lower RR values associated with extremely low THIa8 values. However, the observed strengthening of this protective effect over time could indicate that additional factors, such as public health interventions, are contributing to this trend. Specifically, strengthened HFMD epidemic warnings and prevention campaigns during autumn and winter may have further reduced the incidence of HFMD under these cooler and drier conditions. At moderately low THIa8 values, we observed a decreasing protective effect, with RR values approaching 1. A moderately low THIa8 value was associated with mild, stable conditions. These conditions neither inhibit nor significantly promote viral survival, creating an environment where HFMD-related pathogens such as EV-71 and CVA-16 can persist on surfaces and in water sources (37). Such conditions, often observed during transitional seasons such as spring and autumn, may increase the likelihood of transmission, particularly in densely populated settings with frequent close contact among children. During these mild weather periods, people may spend more time in semi-enclosed spaces—for example, schools might reduce outdoor activities to avoid sudden temperature changes, while households could keep windows closed for thermal comfort. This behavioral pattern might unintentionally increase indoor crowding, creating opportunities for person-to-person transmission even under seemingly low-risk meteorological conditions. Over time, the diminishing protective effect at this THIa8 highlights the need for proactive monitoring during these moderate conditions. At extremely high THIa8 values, we observed a steady increase in HFMD risk, with RR values increasing to 1.846 by 2019. This trend aligns with research suggesting that hot and humid conditions promote viral replication and spread (41). Extremely high THIa8 values correspond to hot, humid weather, which creates conditions favorable for viral transmission. Owing to intense daytime heat, children tend to participate in outdoor activities during cooler periods, such as early morning or late afternoon, increasing their exposure to contaminated environments and infected individuals in public spaces (42). Moreover, heat stress may weaken immune responses, heightening individuals’ susceptibility to infections and facilitating disease transmission (43). The increasing RR trend at extremely high THIa8 values over time may also be influenced by climate change. The increasing frequency of hot and humid conditions worldwide enhances viral stability and transmission, aligning with the observed increased HFMD risk (44, 45). In Yunnan Province, these shifts occurred against a backdrop of progressive climate changes, where meteorological observations indicate a gradual rise in annual mean temperature and increased frequency of extreme heat-humidity events during the study period (46).
Stratified analyses by age and sex highlighted population-specific susceptibilities. The 3 ≤ age<6 group had a lower sensitivity to the protective effects of extremely low THIa8 values and a greater risk to the effects of extremely high THIa8 values than did the 0 ≤ age<3 group. Preschool children’s (0 ≤ age<3) greater sensitivity to low THIa8 likely stems from their limited mobility and reliance on indoor environments where reduced viral persistence enhances protection. For older children, broader environmental exposure across homes, schools, and playgrounds dilutes these localized benefits. Under high THIa8, older children’s heightened risk aligns with emerging evidence that climate extremes amplify transmission through multiple pathways: warmer temperatures prolong viral survival in outdoor environments, heat stress weakens children’s mucosal defenses, and increased outdoor play elevates exposure risks (47). Females also presented a heightened risk at extremely high THIa8 values. This difference could be attributed to physiological differences between the sexes, particularly estrogen-mediated immune modulation that may delay viral clearance under heat stress and anatomical variations in sweat gland distribution that could impair evaporative cooling (48). Behavioral patterns may further amplify these physiological risks. For example, the frequent use of sun-protective attire (e.g., long sleeves, hats) among females likely increases hand-to-face contact frequency through repeated garment adjustments, which could elevate pathogen exposure risks.
Our results have practical implications in two key areas. First, the THIa8 effectively captures the combined effect of these two factors on HFMD risk. The dynamic impact on HFMD risk, as reflected by the THIa8, underscores the necessity of adaptive public health policies. Continuous monitoring of environmental conditions is essential to enable timely adjustments in prevention and public education efforts. For example, during periods of high temperature and humidity, heightened vigilance and targeted interventions while leveraging the protective effects of cool and dry conditions are crucial to mitigate HFMD risk. Second, focused interventions should be designed to address the specific vulnerabilities of different population subgroups. For example, public health campaigns aimed at reducing outdoor exposure during periods of extremely high THIa8 values could focus on children aged 3 to 5 years, as their increased outdoor activities make them more susceptible to HFMD. While our findings are grounded in Yunnan’s subtropical climate, the thermodynamic principles underlying THIa8’s humidity-modulated temperature effects suggest broader applicability. However, region-specific adaptations are needed—snow-cover periods in temperate zones may alter transmission dynamics through modified human-environment interactions. Our study has specific limitations. First, the ecological design inherently restricts causal inference due to unmeasured confounders like socioeconomic factors. As a result, the THIa8 is more suitable for characterizing HFMD risk patterns under varying temperature and humidity conditions rather than serving as a direct measure of the causal effect of these environmental factors on disease transmission. Second, the exclusion of viral serotype data (e.g., EV-A71 vs. CV-A16) requires caution, as pathogen-specific environmental responses may vary. However, laboratory-confirmed serotypes primarily came from severe/hospitalized cases, which may not fully represent environmental associations in the broader HFMD population. Third, although the THIa8 weight parameter (ω = 1.8) demonstrated statistical robustness, its biological interpretation requires validation through controlled viral persistence experiments.
5 Conclusion
Our study indicates that the impact of the combined effect, as reflected by the THIa8, on HFMD risk over time. Specifically, we observed that the protective effect at extremely low THIa8 values was increased, whereas the protective effect at moderately low THIa8 values was decreased. Concurrently, the risk associated with extremely high THIa8 values increased. These findings suggest that the effect of various environmental factors on disease risk is not static but rather dynamically changing. Therefore, to effectively meet future challenges and optimize public health strategies, continuous monitoring of environmental changes and their health impacts is essential. This ensures that prevention and response measures can be adapted in a timely manner.
Data availability statement
The data analyzed in this study is subject to the following licenses/restrictions: the datasets presented in this article are not readily available because the datasets generated and/or analyzed in this study are available from Yunnan Center for Disease Control and Prevention. The authors used the data for this current study under a license from the Yunnan CDC, so the data cannot be shared publicly. Requests to access these datasets should be directed to Yunnan Center for Disease Control and Prevention, https://www.yncdc.cn/.
Ethics statement
The studies involving humans were approved by the Institutional Review Board of the School of Public Health, Sichuan University. The studies were conducted in accordance with the local legislation and institutional requirements. Written informed consent for participation was not required from the participants or the participants’ legal guardians/next of kin in accordance with the national legislation and institutional requirements.
Author contributions
ZW: Conceptualization, Data curation, Formal analysis, Investigation, Methodology, Project administration, Software, Visualization, Writing – original draft, Writing – review & editing. YM: Conceptualization, Formal analysis, Funding acquisition, Methodology, Resources, Supervision, Writing – original draft, Writing – review & editing. WC: Conceptualization, Data curation, Methodology, Project administration, Resources, Supervision, Writing – review & editing. TZ: Funding acquisition, Project administration, Resources, Supervision, Validation, Writing – review & editing. TH: Project administration, Resources, Supervision, Validation, Writing – review & editing. TS: Project administration, Resources, Supervision, Validation, Writing – review & editing. FY: Conceptualization, Funding acquisition, Investigation, Project administration, Resources, Validation, Visualization, Writing – review & editing. HY: Formal analysis, Methodology, Project administration, Resources, Supervision, Validation, Visualization, Writing – review & editing.
Funding
The author(s) declare that financial support was received for the research and/or publication of this article. This work was supported by the National Natural Science Foundation of China (grant nos. 81872713 and 82373689), the Chengdu Science and Technology Program (grant no. 2024-YF05-00644-SN), and the Sichuan Center for Disease Control and Prevention (H241225 and H231218).
Conflict of interest
The authors declare that the research was conducted in the absence of any commercial or financial relationships that could be construed as potential conflicts of interest.
Generative AI statement
The authors declare that no Gen AI was used in the creation of this manuscript.
Publisher’s note
All claims expressed in this article are solely those of the authors and do not necessarily represent those of their affiliated organizations, or those of the publisher, the editors and the reviewers. Any product that may be evaluated in this article, or claim that may be made by its manufacturer, is not guaranteed or endorsed by the publisher.
Supplementary material
The Supplementary material for this article can be found online at: https://www.frontiersin.org/articles/10.3389/fpubh.2025.1553278/full#supplementary-material
Footnotes
References
1. Zhu, F, Xu, W, Xia, J, Liang, Z, Liu, Y, Zhang, X, et al. Efficacy, safety, and immunogenicity of an enterovirus 71 vaccine in China. N Engl J Med. (2014) 370:818–28. doi: 10.1056/NEJMoa1304923
2. Xing, W, Liao, Q, Viboud, C, Zhang, J, Sun, J, Wu, JT, et al. Hand, foot, and mouth disease in China, 2008–12: an epidemiological study. Lancet Infect Dis. (2014) 14:308–18. doi: 10.1016/s1473-3099(13)70342-6
3. Aswathyraj, S, Arunkumar, G, Alidjinou, EK, and Hober, D. Hand, foot and mouth disease (HFMD): emerging epidemiology and the need for a vaccine strategy. Med Microbiol Immunol. (2016) 205:397–407. doi: 10.1007/s00430-016-0465-y
4. Fujimoto, T, Chikahira, M, Yoshida, S, Ebira, H, Hasegawa, A, Totsuka, A, et al. Outbreak of central nervous system disease associated with hand, foot, and mouth disease in Japan during the summer of 2000: detection and molecular epidemiology of enterovirus 71. Microbiol Immunol. (2002) 46:621–7. doi: 10.1111/j.1348-0421.2002.tb02743.x
5. Chan, LG, Parashar, UD, Lye, MS, Ong, FG, Zaki, SR, Alexander, JP, et al. Deaths of children during an outbreak of hand, foot, and mouth disease in Sarawak, Malaysia: clinical and pathological characteristics of the disease. For the outbreak study group. Clin Infect Dis. (2000) 31:678–83. doi: 10.1086/314032
6. Van Tu, P, Thao, NTT, Perera, D, Truong, KH, Tien, NTK, Thuong, TC, et al. Epidemiologic and virologic investigation of hand, foot, and mouth disease, southern Vietnam, 2005. Emerg Infect Dis. (2007) 13:1733–41. doi: 10.3201/eid1311.070632
7. Zhang, Y, Zhu, Z, Yang, W, Ren, J, Tan, X, Wang, Y, et al. An emerging recombinant human enterovirus 71 responsible for the 2008 outbreak of hand foot and mouth disease in Fuyang city of China. Virol J. (2010) 7:94. doi: 10.1186/1743-422x-7-94
8. Zhang, C, Wang, X, Sun, D, Li, Y, Feng, Y, Zhang, R, et al. Modification effects of long-term air pollution levels on the relationship between short-term exposure to meteorological factors and hand, foot, and mouth disease: a distributed lag non-linear model-based study in Shandong Province, China. Ecotoxicol Environ Saf. (2024) 272:116060. doi: 10.1016/j.ecoenv.2024.116060
9. Jiang, L, Jiang, H, Tian, X, Xia, X, and Huang, T. Epidemiological characteristics of hand, foot, and mouth disease in Yunnan Province, China, 2008-2019. BMC Infect Dis. (2021) 21:751. doi: 10.1186/s12879-021-06462-4
10. Zhu, L, Wang, X, Guo, Y, Xu, J, Xue, F, and Liu, Y. Assessment of temperature effect on childhood hand, foot and mouth disease incidence (0-5years) and associated effect modifiers: a 17 cities study in Shandong Province, China, 2007-2012. Sci Total Environ. (2016) 551-552:452–9. doi: 10.1016/j.scitotenv.2016.01.173
11. Qi, H, Chen, Y, Xu, D, Su, H, Zhan, L, Xu, Z, et al. Impact of meteorological factors on the incidence of childhood hand, foot, and mouth disease (HFMD) analyzed by DLNMs-based time series approach. Infect Dis Poverty. (2018) 7:5. doi: 10.1186/s40249-018-0388-5
12. Xu, Z, Hu, W, Jiao, K, Ren, C, Jiang, B, and Ma, W. The effect of temperature on childhood hand, foot and mouth disease in Guangdong Province, China, 2010-2013: a multicity study. BMC Infect Dis. (2019) 19:969. doi: 10.1186/s12879-019-4594-y
13. Hao, J, Yang, Z, Yang, W, Huang, S, Tian, L, Zhu, Z, et al. Impact of ambient Temperature and relative humidity on the incidence of hand-foot-mouth disease in Wuhan, China. Int J Environ Res Public Health. (2020) 17:428. doi: 10.3390/ijerph17020428
14. Du, Z, Lawrence, WR, Zhang, W, Zhang, D, Yu, S, and Hao, Y. Interactions between climate factors and air pollution on daily HFMD cases: a time series study in Guangdong, China. Sci Total Environ. (2019) 656:1358–64. doi: 10.1016/j.scitotenv.2018.11.391
15. Du, Z, Lin, S, Marks, T, Zhang, W, Deng, T, Yu, S, et al. Weather effects on hand, foot, and mouth disease at individual level: a case-crossover study. BMC Infect Dis. (2019) 19:1029. doi: 10.1186/s12879-019-4645-4
16. Song, C, Shi, X, Bo, Y, Wang, J, Wang, Y, and Huang, D. Exploring spatiotemporal nonstationary effects of climate factors on hand, foot, and mouth disease using Bayesian spatiotemporally varying coefficients (STVC) model in Sichuan, China. Sci Total Environ. (2019) 648:550–60. doi: 10.1016/j.scitotenv.2018.08.114
17. Zhan, ZY, Fang, HY, Xu, XY, and Hu, ZJ. Interactions of particulate matter with temperature, heat index and relative humidity on pediatric hand, foot, and mouth disease in a subtropical city. Environ Pollut. (2023) 336:122385. doi: 10.1016/j.envpol.2023.122385
18. Fan, C, Liu, F, Zhao, X, Ma, Y, Yang, F, Chang, Z, et al. An alternative comprehensive index to quantify the interactive effect of temperature and relative humidity on hand, foot and mouth disease: a two-stage time series study including 143 cities in mainland China. Sci Total Environ. (2020) 740:140106. doi: 10.1016/j.scitotenv.2020.140106
19. Zhang, W, Du, Z, Zhang, D, Yu, S, Huang, Y, and Hao, Y. Assessing the impact of humidex on HFMD in Guangdong Province and its variability across social-economic status and age groups. Sci Rep. (2016) 6:8965. doi: 10.1038/srep18965
20. Li, S, Chen, G, Jaakkola, JJK, Williams, G, and Guo, Y. Temporal change in the impacts of ambient temperature on preterm birth and stillbirth: Brisbane, 1994–2013. Sci Total Environ. (2018) 634:579–85. doi: 10.1016/j.scitotenv.2018.03.385
21. Pan, R, Yao, Z, Yi, W, Wei, Q, He, Y, Tang, C, et al. Temporal trends of the association between temperature variation and hospitalizations for schizophrenia in Hefei, China from 2005 to 2019: a time-varying distribution lag nonlinear model. Environ Sci Pollut Res. (2021) 29:5184–93. doi: 10.1007/s11356-021-15797-z
22. Rai, M, Breitner, S, Huber, V, Zhang, S, Peters, A, and Schneider, A. Temporal variation in the association between temperature and cause-specific mortality in 15 German cities. Environ Res. (2023) 229:115668. doi: 10.1016/j.envres.2023.115668
23. Ordanovich, D, Tobías, A, and Ramiro, D. Temporal variation of the temperature-mortality association in Spain: a nationwide analysis. Environ Health. (2023) 22:5. doi: 10.1186/s12940-022-00957-6
24. Lu, P, Miao, J, Feng, S, Green, D, Lim, Y-H, Gao, X, et al. Temporal variations of the association between summer season heat exposure and hospitalizations for renal diseases in Queensland, Australia, 1995–2016. Environ Res Lett. (2022) 17:ac72b8. doi: 10.1088/1748-9326/ac72b8
25. Rocque, RJ, Beaudoin, C, Ndjaboue, R, Cameron, L, Poirier-Bergeron, L, Poulin-Rheault, R-A, et al. Health effects of climate change: an overview of systematic reviews. BMJ Open. (2021) 11:e046333. doi: 10.1136/bmjopen-2020-046333
26. Deschenes, O. Temperature Human health, and adaptation: a review of the empirical literature. Energy Econ. (2014) 4:606–619. doi: 10.1016/j.eneco.2013.10.013
27. Sripa, B, Suwannatrai, AT, Sayasone, S, Do, DT, Khieu, V, and Yang, Y. Current status of human liver fluke infections in the greater Mekong subregion. Acta Trop. (2021) 224:106133. doi: 10.1016/j.actatropica.2021.106133
28. China Statistics Press. China statistical yearbook 2022 China Statistics Press (2022). Available at: https://www.stats.gov.cn/sj/ndsj/2022/indexch.htm
29. Masterton, JM, and Richardson, FA. Humidex: a method of quantifying human discomfort due to excessive heat and humidity. Downsview, Ontario: Environment Canada (1979).
30. National Weather Service. The heat index equation In: L Rothfusz, editor. National Weather Service Technical Attachment : Weather Prediction Center (2022). Available at: https://www.wpc.ncep.noaa.gov/html/heatindex_equation.shtml
31. Gasparrini, A, Armstrong, B, and Kenward, MG. Distributed lag non-linear models. Stat Med. (2010) 29:2224–34. doi: 10.1002/sim.3940
32. Xiao, X, Gasparrini, A, Huang, J, Liao, Q, Liu, F, Yin, F, et al. The exposure-response relationship between temperature and childhood hand, foot and mouth disease: a multicity study from mainland China. Environ Int. (2017) 100:102–9. doi: 10.1016/j.envint.2016.11.021
33. Peng, RD, Dominici, F, and Louis, TA. Model choice in time series studies of air pollution and mortality. J R Stat Soc A Stat Soc. (2006) 169:179–203. doi: 10.1111/j.1467-985X.2006.00410.x
35. Gasparrini, A, Guo, Y, Hashizume, M, Kinney, PL, Petkova, EP, Lavigne, E, et al. Temporal variation in heat-mortality associations: a multicountry study. Environ Health Perspect. (2015) 123:1200–7. doi: 10.1289/ehp.1409070
36. Abad, FX, Pintó, RM, and Bosch, A. Survival of enteric viruses on environmental fomites. Appl Environ Microbiol. (1994) 60:3704–10. doi: 10.1128/aem.60.10.3704-3710.1994
37. Bertrand, I, Schijven, JF, Sánchez, G, Wyn-Jones, P, Ottoson, J, Morin, T, et al. The impact of temperature on the inactivation of enteric viruses in food and water: a review. J Appl Microbiol. (2012) 112:1059–74. doi: 10.1111/j.1365-2672.2012.05267.x
38. Wu, J, Cheng, J, Xu, Z, Zhao, K, Zhao, D, Xie, M, et al. Nonlinear and interactive effects of Temperature and humidity on childhood hand, foot and mouth disease in Hefei, China. Pediatr Infect Dis J. (2016) 35:1086–91. doi: 10.1097/inf.0000000000001238
39. Li, C, Liu, Z, Li, W, Lin, Y, Hou, L, Niu, S, et al. Projecting future risk of dengue related to hydrometeorological conditions in mainland China under climate change scenarios: a modelling study. Lancet Planet Health. (2023) 7:e397–406. doi: 10.1016/s2542-5196(23)00051-7
40. Mahon, MB, Sack, A, Aleuy, OA, Barbera, C, Brown, E, Buelow, H, et al. A meta-analysis on global change drivers and the risk of infectious disease. Nature. (2024) 629:830–6. doi: 10.1038/s41586-024-07380-6
41. Zhu, L, Yuan, Z, Wang, X, Li, J, Wang, L, Liu, Y, et al. The impact of ambient Temperature on childhood HFMD incidence in inland and coastal area: a Two-City study in Shandong Province, China. Int J Environ Res Public Health. (2015) 12:8691–704. doi: 10.3390/ijerph120808691
42. Cheng, J, Zhu, R, Xu, Z, Wu, J, Wang, X, Li, K, et al. Impact of temperature variation between adjacent days on childhood hand, foot and mouth disease during April and July in urban and rural Hefei, China. Int J Biometeorol. (2016) 60:883–90. doi: 10.1007/s00484-015-1082-y
43. Li, S, Yao, Q, Li, J, Yang, H, Qian, R, Zheng, M, et al. Inhibition of neutrophil swarming by type I interferon promotes intracellular bacterial evasion. Nat Commun. (2024) 15:8663. doi: 10.1038/s41467-024-53060-4
44. Coates, SJ, Davis, MDP, and Andersen, LK. Temperature and humidity affect the incidence of hand, foot, and mouth disease: a systematic review of the literature—a report from the International Society of Dermatology Climate Change Committee. Int J Dermatol. (2019) 58:388–99. doi: 10.1111/ijd.14188
45. Romanello, M, Walawender, M, Hsu, SC, Moskeland, A, Palmeiro-Silva, Y, Scamman, D, et al. The 2024 report of the lancet countdown on health and climate change: facing record-breaking threats from delayed action. Lancet. (2024) 404:1847–96. doi: 10.1016/s0140-6736(24)01822-1
46. Liu, BJ, Chen, CL, Lian, YQ, Chen, JF, and Chen, XH. Long-term change of wet and dry climatic conditions in the southwest karst area of China. Glob Planet Change. (2015) 127:1–11. doi: 10.1016/j.gloplacha.2015.01.009
47. He, Y, Liu, WJ, Jia, N, Richardson, S, and Huang, C. Viral respiratory infections in a rapidly changing climate: the need to prepare for the next pandemic. EBioMedicine. (2023) 93:104593. doi: 10.1016/j.ebiom.2023.104593
Keywords: HFMD, composite index, combined effect, temporal trends, time-varying DLNM
Citation: Wang Z, Ma Y, Cai W, Zhang T, Huang T, Shui T, Yin F and Yang H (2025) Quantifying the temporal trends of the combined effect of temperature and relative humidity on hand, foot, and mouth disease in Yunnan, China. Front. Public Health. 13:1553278. doi: 10.3389/fpubh.2025.1553278
Edited by:
Fabio Scarpa, University of Sassari, ItalyReviewed by:
Xiao Jinbo, Chinese Center for Disease Control and Prevention, ChinaHongmei Yu, Shanxi Medical University, China
Copyright © 2025 Wang, Ma, Cai, Zhang, Huang, Shui, Yin and Yang. This is an open-access article distributed under the terms of the Creative Commons Attribution License (CC BY). The use, distribution or reproduction in other forums is permitted, provided the original author(s) and the copyright owner(s) are credited and that the original publication in this journal is cited, in accordance with accepted academic practice. No use, distribution or reproduction is permitted which does not comply with these terms.
*Correspondence: Fei Yin, ODIxNzQ4MzFAcXEuY29t; Haijun Yang, eXlhbmdoYWlqdW5AMTI2LmNvbQ==
†These authors have contributed equally to this work