 Yiran Li1‡
 Lulu Meng2‡Siyu Liang1Yan Zhang3Wenjia Li1Jiali Duan4Ruoxiang Cao2Jie Li1,3
 Liyu Huang4,5*†
- 1School of Public Health, Hebei Medical University, Shijiazhuang, Hebei, China
- 2Office of Research and Teaching Administration, Beijing Center for Disease Prevention and Control, Beijing, China
- 3Institute of Nutrition and Food Hygiene, Fengtai District Center for Disease Prevention and Control, Beijing, China
- 4Institute of Nutrition and Food Hygiene, Beijing Center for Disease Prevention and Control, Beijing, China
- 5School of Public Health, Capital Medical University, Beijing, China
Background: Sugar-sweetened beverage (SSB) consumption among children and adolescents remains high worldwide. In China, most studies have examined either peer or family influences, but few have assessed their combined effects, particularly for pre-packaged SSBs.
Methods: A cross-sectional study was conducted among 2,317 primary and secondary school students in Beijing between October and November 2024. Students and their caregivers completed paired questionnaires on pre-packaged SSB consumption and potential influencing factors. Multivariable logistic regression was used to examine associations between peer and family factors and SSB consumption, adjusting for demographic and behavioral covariates.
Results: In the past week, 81.9% of students consumed at least one type of pre-packaged SSB. With the increase of age, the intake of SSBs increased in children. Fruit/vegetable beverages were the most commonly consumed beverages for primary school students, and tea beverages were the most commonly consumed beverages for secondary school students. Peer-influenced purchasing behavior (OR: 1.600,95% CI:1.318–1.941), peer-sharing behavior (OR: 1.373,95% CI:1.106–1.704), household accessibility (OR: 1.305,95% CI:1.085–1.570) and parental supportive attitudes toward SSBs (OR: 2.246,95% CI:1.691–2.981) were associated with high consumption of SSBs. Similar associations were observed for carbonated beverages, tea beverages, milk beverages, and other categories, though effect sizes varied.
Conclusion: Peer behaviors and family environments substantially influence pre-packaged SSB consumption among children and adolescents in Beijing. Targeted interventions should include banning SSB sales in school canteens, introducing warning labels on high-sugar beverages, and promoting parental education to reduce home availability.
1 Introduction
In recent years, the high consumption rate of sugar-sweetened beverages (SSBs) has become a major global challenge for children and adolescents health. Sugar-sweetened beverages, characterized by low dietary fiber and protein, high sugar content, and high energy density, have been categorized as ultra-processed foods, contributing to the global disease burden (1). Studies have shown that long-term intake of SSBs increases the risk of obesity (2), the incidence of type 2 diabetes (3), dental caries (4), and other metabolic diseases (5) in children and adolescents. The World Health Organization (WHO) has explicitly recommended that the intake of free sugars in children and adolescents should be kept below 10% of total daily energy intake, and even recommended a further reduction to less than 5% to minimize health risks (6). However, despite interventions such as sugar taxes (7, 8), advertising restrictions (9, 10), and health education intervention (11, 12) by many governments, the consumption of SSBs among children and adolescents is still generally high (2, 13). In China, despite WHO recommendations, most provincial school nutrition guidelines do not explicitly limit SSBs, and enforcement varies across regions.
In China, economic development and consumption upgrades have greatly increased the accessibility of SSBs among children and adolescents. A study pointed out that 87.6% children consumed SSB and the median consumption of SSB was 205.4 ml/day per consumer (14). A study of 25,893 Chinese adolescents aged 13–15 years showed that the proportions of Chinese adolescents who consumed sugar-sweetened beverage ≥1 times/week was 65.02% and that high-frequency sugar-sweetened beverage consumption is associated with lower muscle strength (15). The number of deaths and disease burdens caused by high sugar-sweetened beverages intake in China has increased significantly over the past three decades (16). Existing studies have largely focused on prevalence and health outcomes (17–21), while research on social determinants—particularly the roles of peers and family—remains limited in China.
Social influences are known to be critical in shaping dietary behaviors during childhood and adolescence. According to social learning theory, children often imitate the behaviors of peers and family members, especially in shared settings such as schools and homes. A study in Northeast China explored the association between family-related factors, community environmental factors, and children's sugary beverage intake, but ignored peer factors (22). As children's earliest dietary role models and food providers, parents' behaviors, attitudes and family eating environment have a profound impact on children's beverage choices. Parents' own consumption habits of SSBs, whether they store such beverages at home, and whether they actively limit their children's intake are closely related to their children's actual intake (23). Similarly, peer norms, peer pressure, and social sharing behaviors have shown to influence SSBs consumption patterns (24).
Given the scarcity of evidence on how peer and family environments influence SSB consumption among Chinese children and adolescents, this study aimed to examine the associations between these factors and the consumption of pre-packaged SSBs among primary and secondary school students in Beijing. By identifying these social determinants, the research intends to inform targeted intervention strategies that involve families and peer groups to effectively reduce sugary beverage intake among youth.
2 Materials and methods
2.1 Study population
The cross-sectional study was conducted from October to November 2024. The students were selected using a multistage stratified cluster sampling method: (1) One urban area and one suburb of Beijing were randomly selected as project sites. (2) Two primary schools, two middle schools and two high schools were selected in total across the project site, yielding eight schools overall, including four schools with nine-year consistent education (covering both primary and middle levels). (3) All students in Grade 3, Grade 7 and Grade 10 were randomly selected from each primary school, middle school and high school.
The sample size was calculated based on the beverage consumption rate (p = 25%) among children and adolescents reported in the Chinese Dietary Guidelines Scientific Research Report (2021) (25). p = 25%, μα/2 1.96, δ = 0.15p, and the design effect (deff) = 2, the required sample size was calculated as n = 1,024. Considering stratification by urban and suburban areas (two strata) and an anticipated 10% invalid questionnaire and non-response rate, the final estimated sample size was 2,276 participants. Using the formula:
Participants were selected based on the following criteria: (1) Voluntarily undergo this survey and sign the informed consent form; (2) No plans to move out or transfer in the future; (3) Students who can cooperate in completing the questionnaire. Exclusion criteria: (1) Not sign the informed consent form and unable to cooperate with the personnel who are unwilling to cooperate with the questionnaire; (2) Leave of absence or have recent plan to move out or transfer to another school. A total of 2,525 student–caregiver pairs were recruited. After excluding the cases with incomplete key variables, 2,317 pairs (response rate: 91.8%) were included in the final analysis.
The study was approved by the Ethics Committee of the Beijing Center for Disease Prevention and Control (BJCDC2024031). All participants and their caregivers co-signed a written informed consent form prior to participation in the study.
2.2 Measurements and variable definition
A self-designed questionnaire was used for the survey. Based on a review of relevant literature, the research team developed the questionnaire, which was subsequently reviewed and revised by experts before being finalized as the Sugar-Sweetened Beverage Consumption Behavior Questionnaire (86 items) and the Family Environment Questionnaire on Sugar-Sweetened Beverage Consumption Behavior (68 items). A pilot test indicated Cronbach's α coefficients of 0.81 and 0.75, respectively, demonstrating good reliability.
The questionnaire mainly covered participants' demographic characteristics, knowledge and attitudes toward sugar-sweetened beverages, consumption behaviors, and related health behaviors. The Sugar-Sweetened Beverage Consumption Behavior Questionnaire and the Family Environment Questionnaire on Sugar-Sweetened Beverage Consumption Behavior were completed independently by students and their parents, respectively. Student questionnaires were administered in schools under teacher supervision, while parent questionnaires were self-administered at home. Student and parent responses were matched one-to-one through questionnaire coding.
2.2.1 Consumption of sugar-sweetened beverages
Students report the frequency and amount of SSBs consumption over the past week. The questionnaire is developed based on the BEVQ-15 (26), and a modified version of the questionnaire is used to measure children's consumption of SSBs, which includes two categories: pre-packaged beverages and freshly made beverages. Beverages are classified according to the nutritional components of each beverage and the Chinese General Standard for Beverages (GB/T 10789-2015) (27). There are 8 categories of pre-packaged beverages, including 100% fruit/vegetable juices, fruit/vegetable beverages, carbonated beverages, tea beverages, milk beverages, plant protein drinks, beverages for special uses, coffee beverages. The Cronbach α coefficient is 0.817, indicating good internal consistency.
To give students a better understanding of the types of beverages, we have listed several common examples of SSBs categories to improve interpretability: vegetable- or fruit-flavored beverages that were not 100% fruit or vegetable juice (hereafter referred to as “fruit/vegetable beverages”, e.g., Minute Maid orange juice), carbonated beverages (e.g., cola, Sprite), tea beverages (e.g., iced tea, jasmine tea), sugar-sweetened milk beverages that were not milk or yogurt (hereafter referred to as “milk beverages”, e.g., Fruity milk, Nutri-Express), plant protein beverages (e.g., soya-bean milk drink, walnut drink, almond milk drink), beverages for special uses (e.g., sports drinks, energy drinks, nutrient drinks, electrolyte drinks, such as Red Bull, Pulse) (28).
To assess the weekly consumption of beverages, the questionnaire sets “Drinking Frequency” and “Average Drinking Per Consumption”. “Drinking frequency” is set to “times/day” (drinking once or more a day is reported here), “times/week” (drinking at least once a week, but not consuming every day is reported here), “never” (not drinking in the past week is reported here). Students were asked to report the frequency and amount of each drink according to their actual situation, and the amount of drinking measured in milliliters. Finally, the frequency of each drink is unified as “times/week”. SSBs are considered “consumed” when the frequency of consumption of SSBs in any of the above categories is not “never”.
2.2.2 Health-related behaviors
For the purpose of this study, health-related behaviors refer to average daily water intake (<1,000 ml, 1,000–1,500 ml, >1,500 ml), outdoors activity time (< 60 min/day, ≥60 min/day), and weekday/weekend sleep duration. According to the Notice on Further Strengthening the Sleep Management of Primary and Secondary School Students issued by the Ministry of Education of China in 2021, primary school students should sleep for 10 h a day, junior high school students should sleep for 9 h a day, and high school students should sleep for 8 h a day.
2.2.3 Peer-related factors
In this study, students were asked “Do you purchase sugary drinks because your friends or classmates do“ and “Do you share sugar drinks with your friends or classmates.” Answer is dichotomous variable: yes or no.
2.2.4 Family-related factors
In this study, family-related factors are caregiver education levels (high school or below vs. college or higher), only-child status (yes/no), parents' attitudes toward their children's consumption of SSBs (supportive, indifferent, non-supportive), and household availability of SSBs (yes/no).
2.2.5 Body mass index
Height and weight were obtained from recent school physical examination records. Body mass index (BMI) was calculated as BMI = weight (kg)/ [height (m)]2. According to the criteria for screening for malnutrition and overweight and obesity among school-age children and adolescents in China (29, 30), students were classified into “ underweight “, “normal weight”, “overweight” and “obese”.
2.3 Quality control
A pilot survey in one primary, one junior high, and one senior high school ensured questionnaire clarity across age groups. For third-grade students, accuracy was enhanced through trained teacher assistance, beverage images as visual aids, a 7-day recall period, and immediate on-site checks for missing or inconsistent responses. All survey staff received standardized training on administration, ethics, and confidentiality. Data were double-entered independently in EpiData 3.1, with discrepancies resolved against original questionnaires.
2.4 Statistical analysis
All statistical analysis were performed using the statistical software IBM SPSS Statistics version 22.0. Continuous variables were expressed as mean and standard deviation. Categorical variables were expressed as count (n) and percentages (%). Comparisons between groups were made using a chi-square test. Multiple logistic regression analysis was used to examine the association between peer-related and family-related factors and SSBs intake, and demographic characteristics (sex, grade, place of residence, only-child status, caregiver's educational level) and health-related behaviors (daily water intake, outdoor activity time) were included as covariates. Statistical significance was defined as p < 0.05 (two-sided).
3 Results
3.1 Characteristics of participants
A total of 2,317 participants were included in the study, with a response rate of 91.8% (2,317/2,525), and all their data were available and included in the analysis. Table 1 shows the demographic characteristics of the participants and the consumption of SSBs over the past week. Among the 2,317 children, the mean age was 12.3 ± 2.9 years. Nearly half (48.7%) were boys, nearly half (48.2%) were from urban areas, 54.9% were only children, and 40.3 percent had a BMI of overweight (18.4 percent) or obese (21.9 %). The caregivers of the children were mainly parents (98.8%), grandparents (1.0%) or others (0.2%), and 81.9% of the caregivers had a college degree or above. In the past week, about 83.9% of children have consumed SSBs. Children who consumed SSBs were more likely to be older students, and caregivers were more likely to have a high school education or less than those who were non-consumer of SSBs (all p < 0.05).
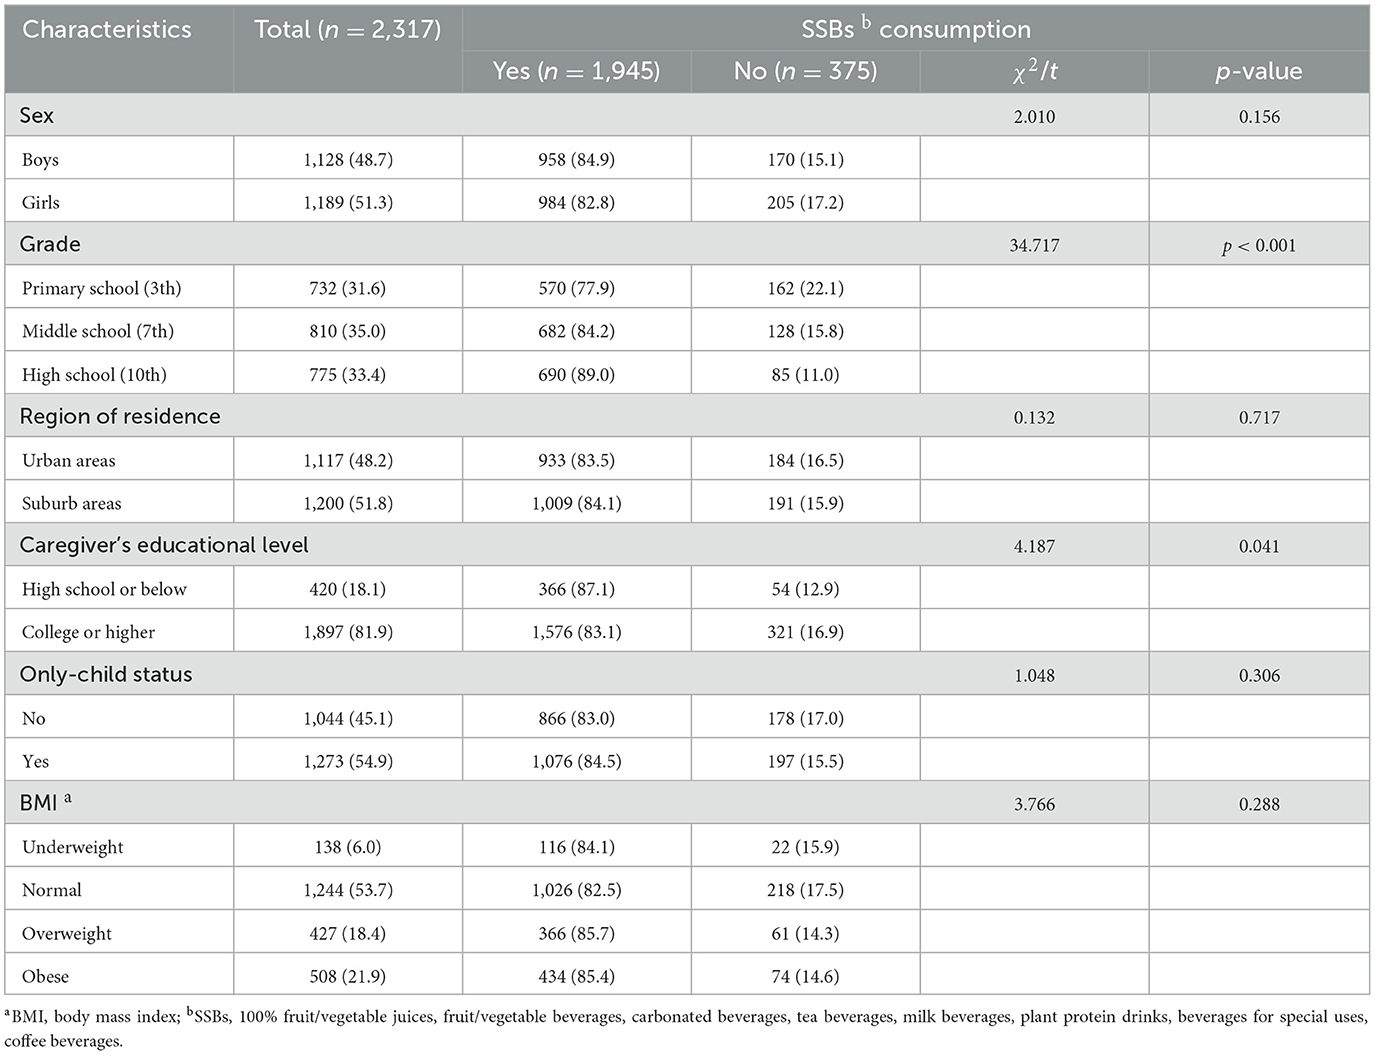
Table 1. Demographic characteristics of participants and SSBs consumption in the past week: n (%).
3.2 SSBs consumption frequency
As shown in Table 2, about 81.9% of the participants had consumed pre-packaged sugary drinks in the past week. Fruit/vegetable beverages (36.3%), 100% fruit/vegetable juice (35.0%), and carbonated beverages (33.1%) were the most consumed beverages by primary school students, while coffee beverages (5.1%), plant protein beverages (20.9%), and beverages for special uses (24.2) were the least consumed. Tea beverages (48.8%), 100% fruit/vegetable juice (48.1%), and carbonated beverages (44.1%) were the most consumed beverages by middle school students, while coffee beverages (15.6%), plant protein beverages (22.0%), and milk beverages (34.0%) were the least consumed. For high school students, tea beverages (62.5%), carbonated beverages (56.0%), and 100% fruit/vegetable juice (46.4%) were the most consumed beverages, while plant protein beverages (28.3%), beverages for special uses (29.3%), and coffee beverages (34.6%) were the least consumed.
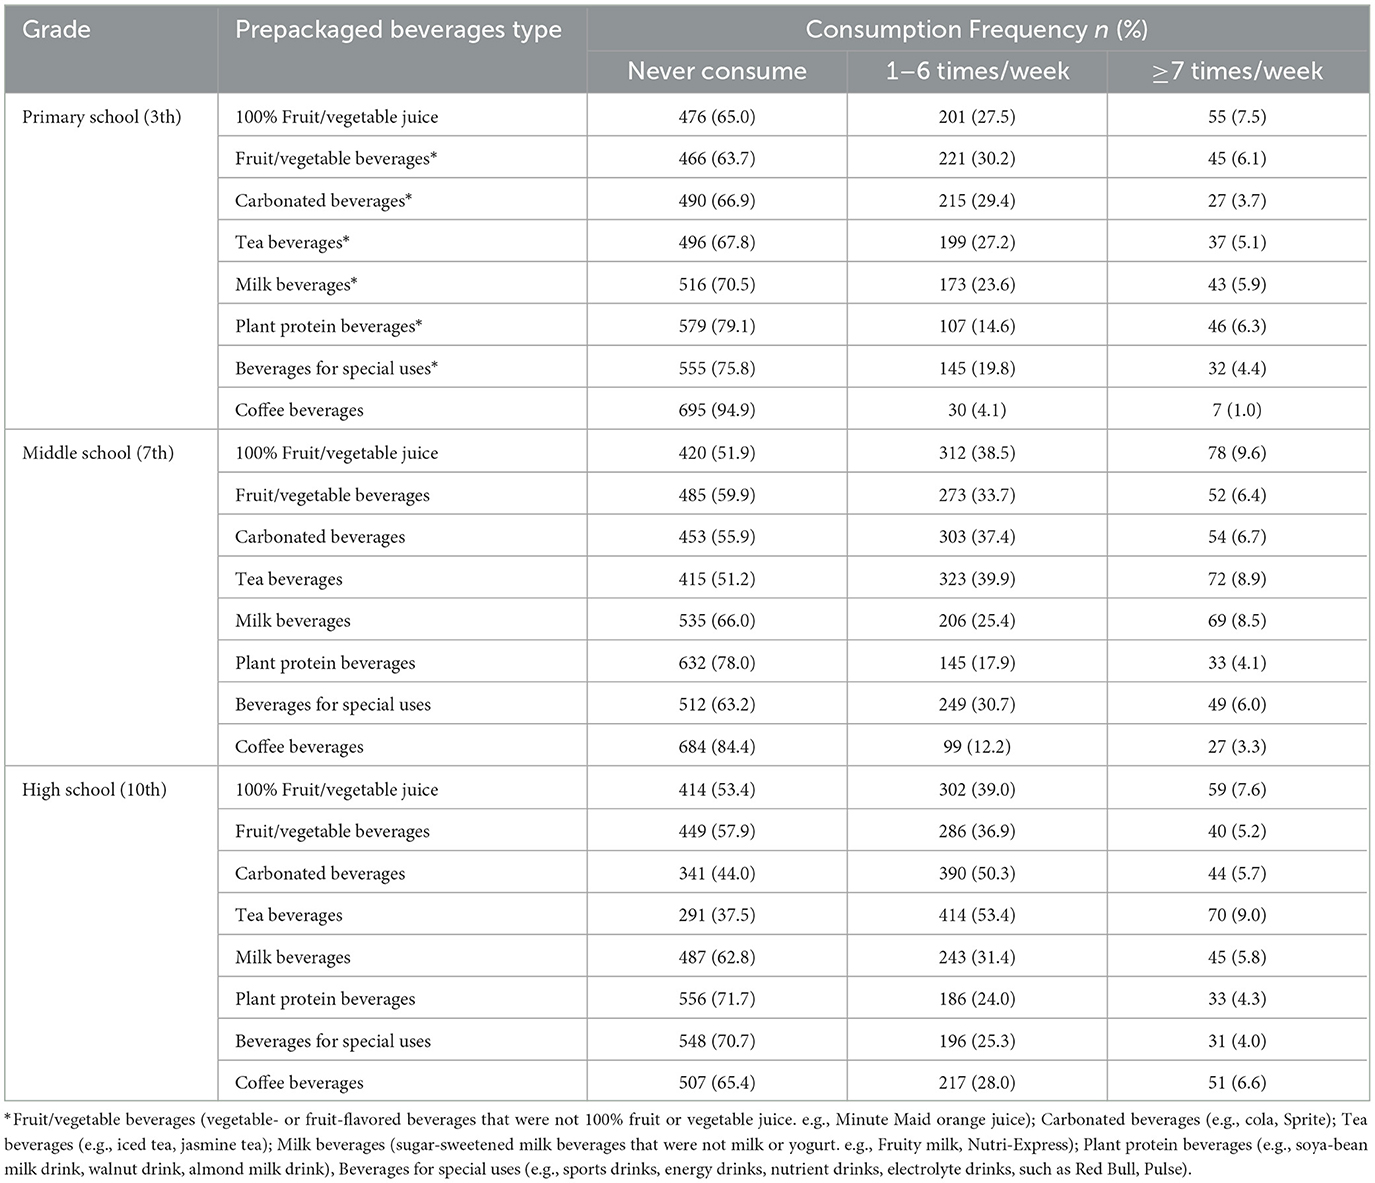
Table 2. Consumption of different types of prepackaged beverages by grade: n (%).
3.3 Factors related to SSBs consumption
Table 3 displays that 76.0% of the participants had a daily water intake of 1,000 ml or more, and 52.8% had a daily outdoor activity time of 60 min or more. The majority of students (76.2%) did not get enough sleep during the week, and 73.0% of them had adequate sleep on the weekend. Sugar-sweetened beverage consumption was associated with higher daily water intake, peer-influenced purchase of SSBs, peer-sharing of SSBs, parental attitudes toward SSBs and household availability (all p < 0.05). With the exception of carbonated beverages, plant protein beverages and beverages for special uses, the other five types of SSBs were associated with higher daily water intake, peer-influenced purchase of SSBs, peer-sharing of SSBs, parental attitudes toward SSBs and household availability (all p < 0.05).
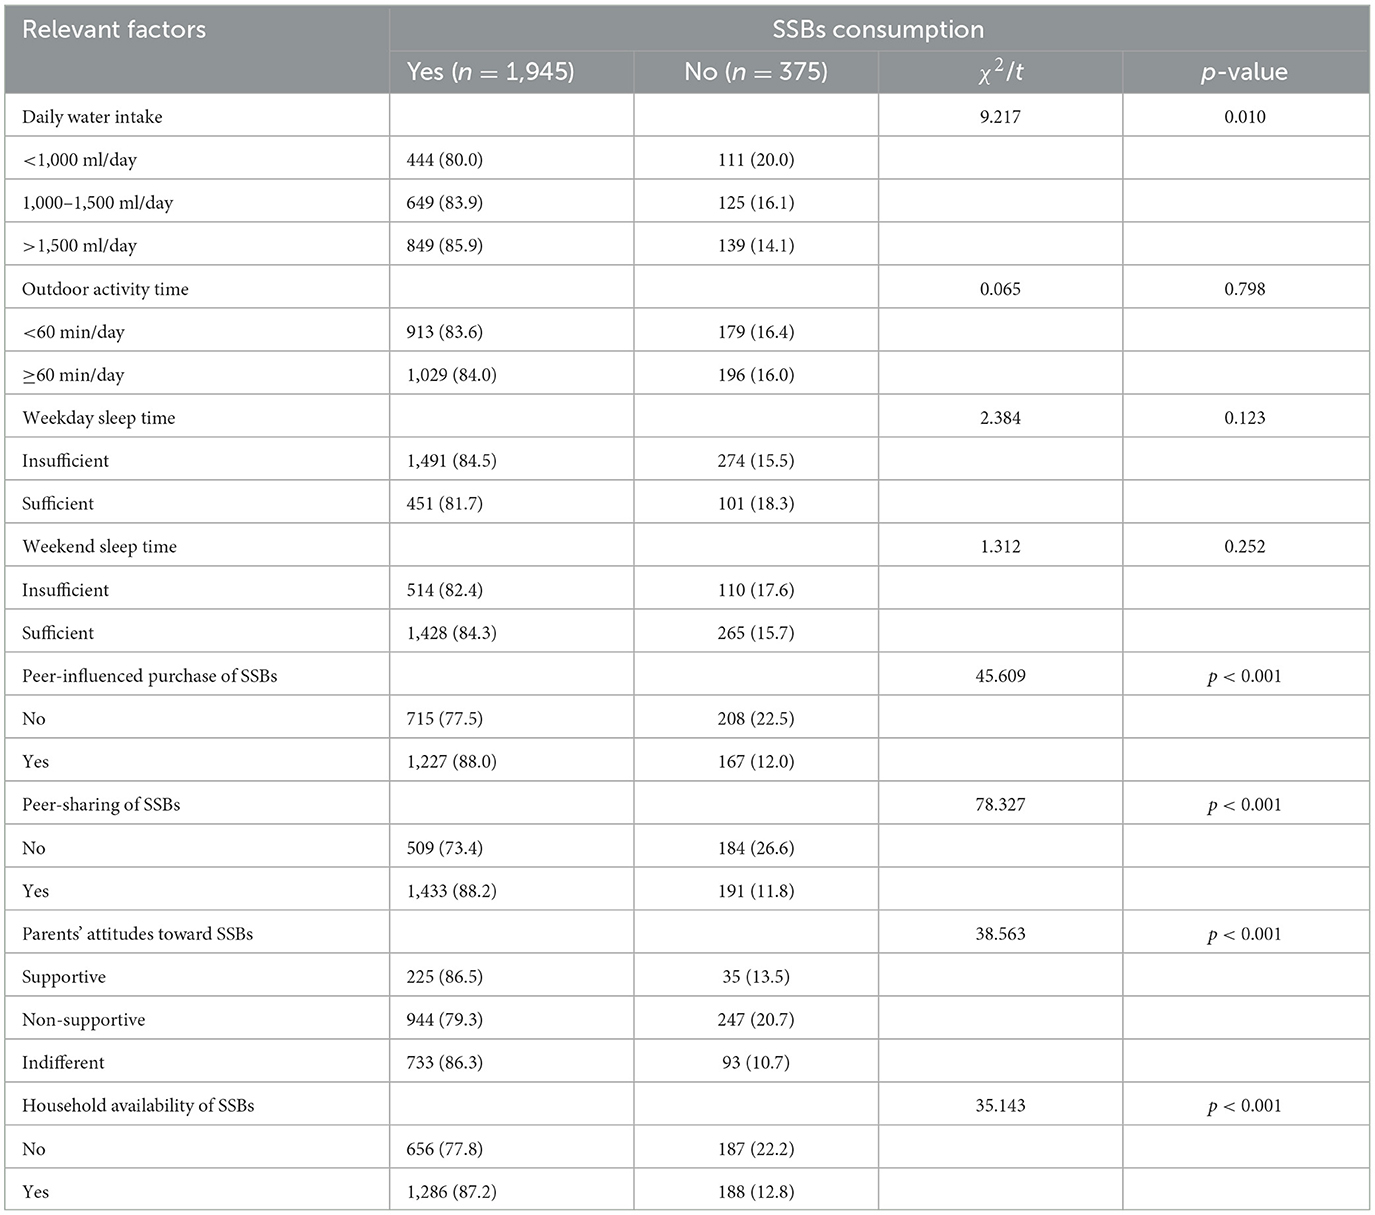
Table 3. Relationships between health-related behaviors, peer-related factors, home-related factors and SSBs consumption.
3.4 Associations between SSBs consumption and relevant factors
As shown in Table 4, after adjusting for sex, grade, residence, only-child status, caregiver education, daily water intake, and outdoor activity time, logistic regression showed that peer-influenced purchasing, peer sharing, supportive or indifferent parental attitudes, and household SSB availability were all significantly associated with higher odds of consuming most SSB categories. Taking fruit/vegetable beverages as an example, students who purchase sugar drinks under peer-influenced (OR: 1.600,95% CI:1.318–1.941) and share SSBs with their peers (OR: 1.373,95% CI:1.106–1.704) were more likely to consume fruit/vegetable beverages than the counterparts. When there was a household availability of SSBs environment (OR: 1.305, 95% CI:1.085–1.570), children were more likely consume fruit/vegetable beverages compared with the “No” group. In addition, the children whose parents' attitudes toward SSBs “supportive” (OR: 2.246, 95% CI:1.691–2.981), or “indifferent” (OR: 1.573,95% CI: 1.295–1.910) were more likely to consume fruit/vegetable beverages compared with the “non-supportive” group. Similar associations were observed for carbonated beverages, tea beverages, milk beverages, and other categories, though effect sizes varied.
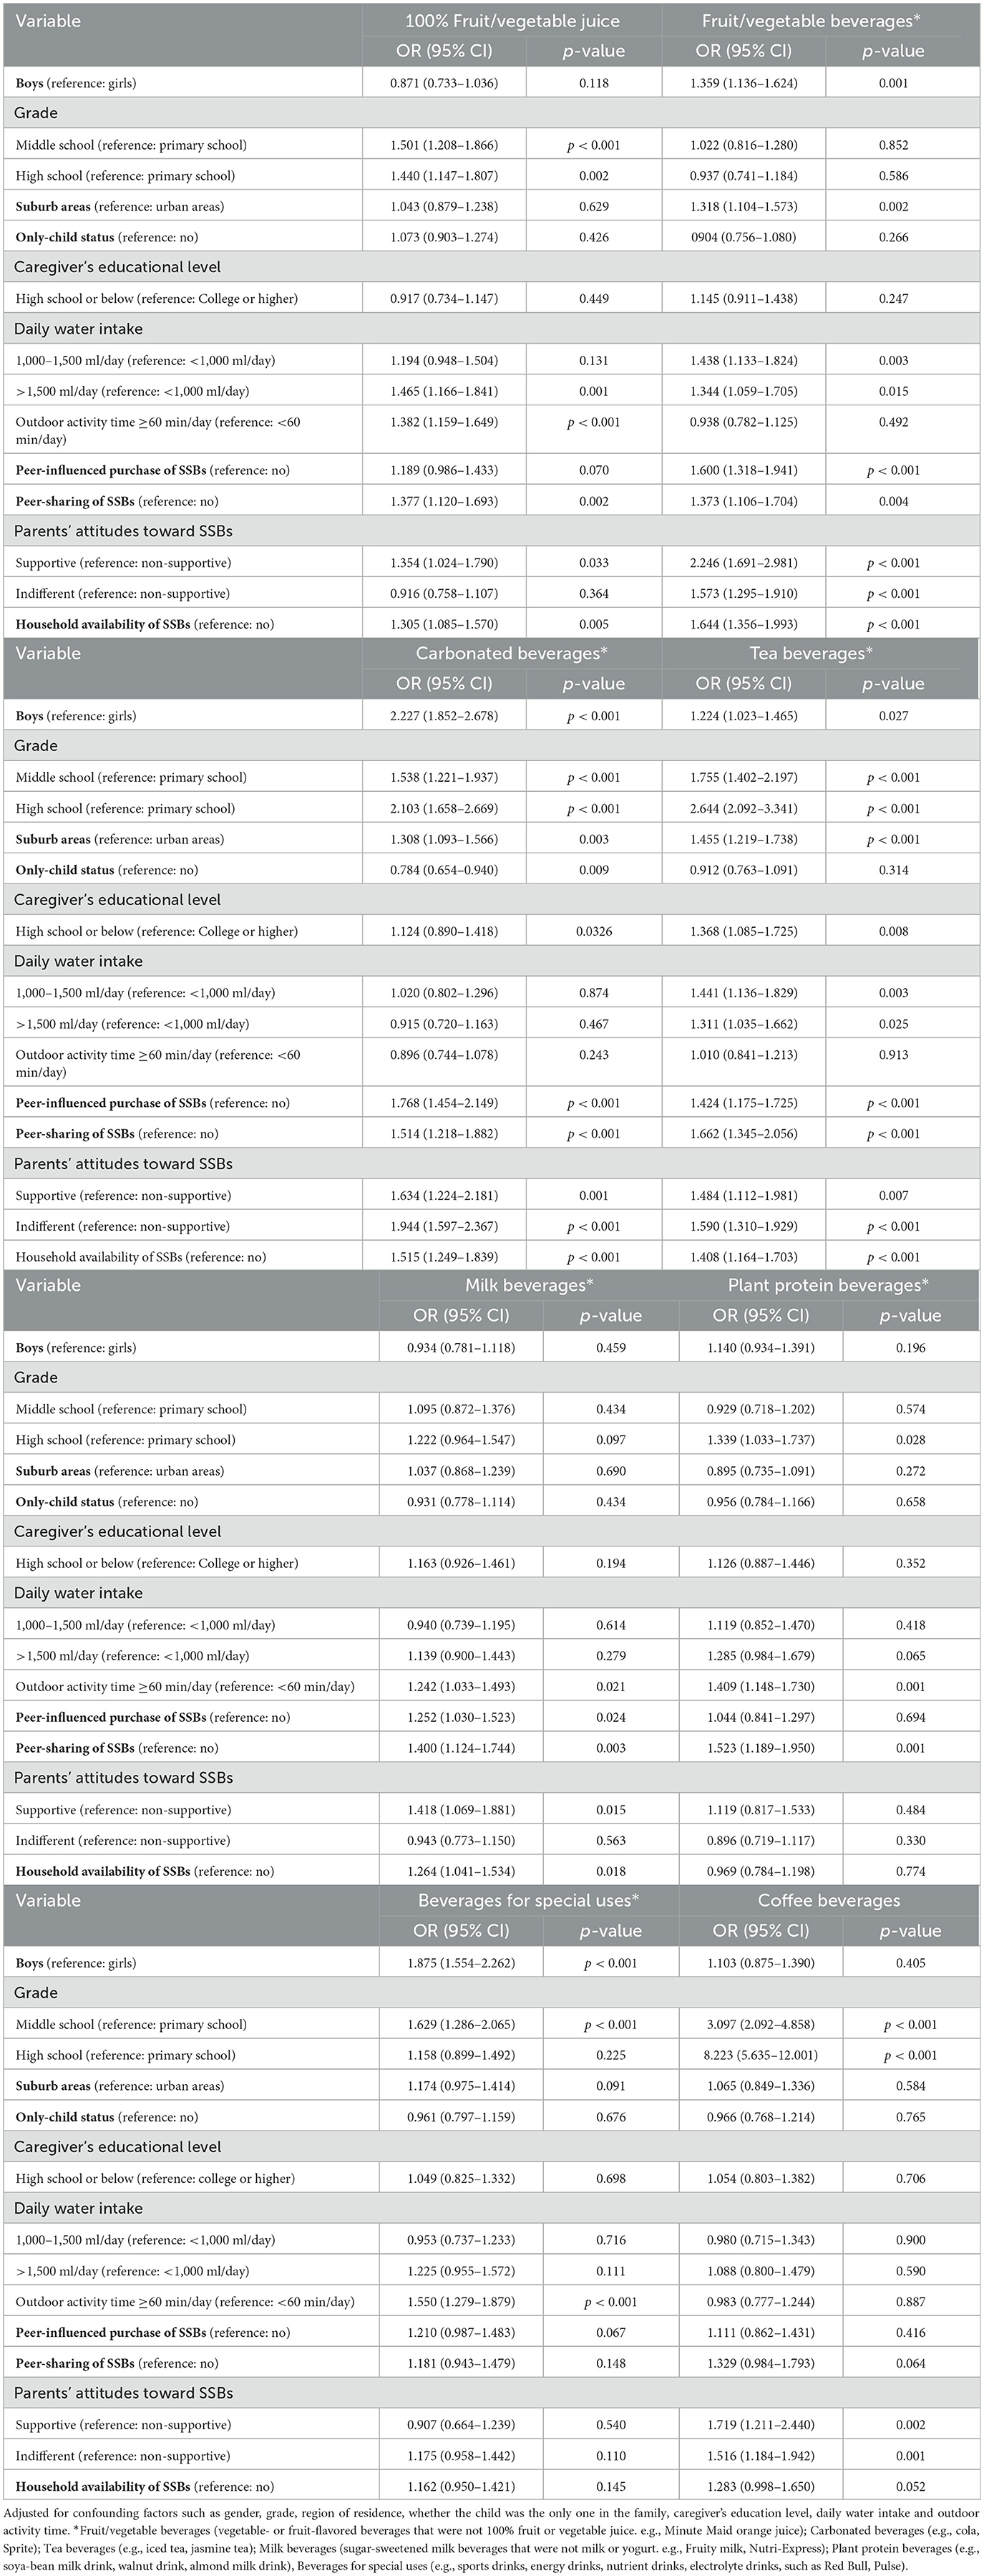
Table 4. Associations between consumption of different types of SSBs and influencing factors: multivariate analysis.
4 Discussion
This large, school-based cross-sectional study found that more than four-fifths (81.9%) of primary and secondary school students in Beijing consumed at least one type of pre-packaged SSB in the past week.
One previous nation study found that the intake of SSBs in Chinese children aged 6–17 years in 2012 was estimated at 181.0 g/day, occurring 2.2 times per week (31). Data from the 2014 National Intervention Program for Obesity in Children and Adolescents Aged 6–17 Years in China showed that 66.6% of participants reported consuming sugar-sweetened beverages (32). This result echoes previous research in Beijing, China. For example, a cross-sectional study of preschoolers in Dongcheng District, Beijing, China, found that about 84.5% of pre-schoolers had consumed SSB in the past 3 months (33), which included milk beverages, fruit/vegetable beverages, vegetable protein beverages, carbonated beverages, tea beverages, and sports/energy beverages, a total of 6 beverages. Our study added 100% fruit/vegetable juices and coffee beverages to a total of 8 types. This study found that the proportion of primary and secondary school students in Beijing who consumed SSBs was higher than in other parts of China. This difference may reflect Beijing's uniqueness as a metropolis in terms of food culture and lifestyle.
The study also found that students consume SSB more frequently with age, which is consistent with some international studies. According to the National Health and Nutrition Examination Survey (NHANES), older adolescents have the highest average intake and percentage of daily calories from SSBs than younger children (34). In addition, the prevalence of high-added sugar consumers is significantly higher among those aged 12–19 years compared to those aged 2–5 years (35). According to a study in the United States (36), the percent energy contributed by added sugars was 14.3 ± 0.2% (2–8 years), 16.2 ± 0.2% (9–18 years), and 13.1 ± 0.2% (≥19 years), suggesting the highest intakes are among adolescents and teens. Tea drinks are more common among secondary school students, while primary school students are more likely to choose fruit and vegetable beverages. This may be due to the misconception that fruit and vegetable juice drinks are healthier in younger children. However, in the survey of the sugar content of beverages in the Beijing market, fruit and vegetable juice drinks had the highest sugar content (10.0 g/100 ml) (37). Older students have greater autonomy in their dietary choices and are more influenced by advertising and social media (38–40), leading to differences in sugary beverage preferences. In addition, different stages of mental and physical development may also have an impact on beverage preference and motivation to drink, which can be explained by the theory of self-determination (41, 42). Carbonated beverages are popular among young people all over the world (43, 44). Hundred percentage fruit and vegetable juices have also been shown to be associated with increased BMI in children (45). However, a study found that the consumption of herbal teas and dietary beverages increased and the eating habits of students generally changed positively (13), suggesting that we can replace high-sugar drinks with sugar-free or low-sugar drinks to reduce added sugar intake.
This study further found that peer purchasing and sharing behaviors significantly increased the likelihood of SSBs intake among students. This result is consistent with the social norm theory, which states that adolescents tend to imitate group behavior to gain a sense of belonging and identity (46). In school, peer interaction is frequent, and drink sharing may be seen as part of social interaction, thus invisibly driving the popularity of SSBs. Previous studies have found that the establishment of positive “peer influence mechanisms”, such as student health advocacy groups and social network interventions, should be considered when designing interventions (47, 48).
This study found that the availability of SSBs in the household was significantly associated with SSBs intake in children, which was consistent with previous studies in Beijing. They pointed out that children's eating behavior is heavily influenced by family food availability, eating habits, eating rules, and parental nutritional literacy (49). In addition, when parents clearly expressed their disapproval of SSBs consumption, students' SSBs intake levels were significantly reduced. This also validates the important role of the family in the formation of children's health behaviors (22, 50), emphasizing the key role of parents as “gatekeepers of health behaviors”.
The results of this study suggest that concerted efforts should be made at the school, family and social levels to reduce the intake of SSBs among primary and secondary school students (51). It is suggested that schools should strengthen healthy diet education and limit the sale and promotion of sugary drinks on campus (52, 53). Families should reduce the stockpile of SSBs at home, and parents should set an example of healthy eating. A combination of school-based and home-based interventions appears to be effective in reducing sugar-sweetened beverage consumption among schoolchildren in China (54). Society can legislate to restrict the advertising of SSBs targeting minors (55, 56). Peer role plays an important role in adolescents' food choices, so it is important to encourage the formation of a peer culture of “healthy eating” (57). Future studies can use a longitudinal tracking design to evaluate the effects of long-term intake of SSBs on weight gain, metabolic indexes, and psychological and behavioral development. In addition, the impact of broader socio-ecological factors such as media exposure, school nutrition policy, and community environment on SSBs consumption should be further explored to guide the formulation of intervention strategies more comprehensively.
Although this study provides new evidence on the influencing factors of SSBs consumption among school-age children in China, the following limitations should be noted. First, this study used a self-report questionnaire to collect data, which may lead to underestimation or overestimation of the frequency of consumption of sugar-sweetened beverages and exposure to related influencing factors. Second, this study is a cross-sectional study, and the causal relationship of potential confounders cannot be inferred. Third, Beijing is a representative of China's advanced economic cities, which could lead to bias in comparison with the rest of China.
5 Conclusions
This study shows that the consumption rate of SSBs among primary and secondary school students is relatively high in Beijing. Our findings highlight the role of peer and family-related factors in SSBs consumption. Exposure to peer-related factors, such as peer-influenced purchasing behavior, peer-sharing behavior, and availability of SSBs in the home setting, were associated with a higher likelihood of consumption of SSBs in children. In contrast, parental disapproval or neutral attitudes toward SSBs were negatively correlated with SSBs consumption. Therefore, interventions should combine school-level actions (ban SSB sales in canteens, strengthen peer-led health promotion) with family-level strategies (parental education, limiting home availability) and policy measures (warning labels on high-sugar beverages, restricting advertising to minors).to reduce SSBs consumption.
Data availability statement
The original contributions presented in the study are included in the article/Supplementary material, further inquiries can be directed to the corresponding author.
Ethics statement
The studies involving humans were approved by the Ethics Committee of the Beijing Center for Disease Prevention and Control. The studies were conducted in accordance with the local legislation and institutional requirements. Written informed consent for participation in this study was provided by the participants' legal guardians/next of kin.
Author contributions
YL: Writing – original draft, Investigation, Formal analysis, Data curation, Methodology. LM: Formal analysis, Methodology, Data curation, Writing – original draft, Supervision. SL: Writing – original draft, Investigation. YZ: Resources, Supervision, Writing – review & editing. WL: Investigation, Writing – original draft. JD: Resources, Writing – review & editing, Conceptualization. RC: Writing – review & editing, Supervision. JL: Supervision, Resources, Writing – review & editing. LH: Funding acquisition, Conceptualization, Writing – review & editing, Supervision.
Funding
The author (s) declare that financial support was received for the research and/or publication of this article. This research was funded by Capital's Funds for Health Improvement and Research (grant number: 2024-2G-3019).
Acknowledgments
We gratefully thank all participants.
Conflict of interest
The authors declare that the research was conducted in the absence of any commercial or financial relationships that could be construed as a potential conflict of interest.
Correction Note
A correction has been made to this article. Details can be found at: 10.3389/fpubh.2025.1718297.
Generative AI statement
The author (s) declare that no Gen AI was used in the creation of this manuscript.
Any alternative text (alt text) provided alongside figures in this article has been generated by Frontiers with the support of artificial intelligence and reasonable efforts have been made to ensure accuracy, including review by the authors wherever possible. If you identify any issues, please contact us.
Publisher's note
All claims expressed in this article are solely those of the authors and do not necessarily represent those of their affiliated organizations, or those of the publisher, the editors and the reviewers. Any product that may be evaluated in this article, or claim that may be made by its manufacturer, is not guaranteed or endorsed by the publisher.
Supplementary material
The Supplementary Material for this article can be found online at: https://www.frontiersin.org/articles/10.3389/fpubh.2025.1661141/full#supplementary-material
References
1. Monteiro CA, Cannon G, Levy RB, Moubarac JC, Louzada ML, Rauber F, et al. Ultra-processed foods: what they are and how to identify them. Public Health Nutr. (2019) 22:936–41. doi: 10.1017/S1368980018003762
2. Lara-Castor L, Micha R, Cudhea F, Miller V, Shi P, Zhang J, et al. Intake of sugar sweetened beverages among children and adolescents in 185 countries between 1990 and 2018: population based study. BMJ. (2024) 386:e079234. doi: 10.1136/bmj-2024-079234
3. Lara-Castor L, O'Hearn M, Cudhea F, Miller V, Shi P, Zhang J, et al. Burdens of type 2 diabetes and cardiovascular disease attributable to sugar-sweetened beverages in 184 countries. Nat Med. (2025) 31:552–64. doi: 10.1016/j.cdnut.2024.103510
4. Ha DH, Arora A, Harford J, Luzzi L, Chrisopoulos S, Do LG. Population impact of sugar-sweetened beverages on dental caries and overweight/obesity in Australian children. JDR Clin Transl Res. (2023) 8:224–33. doi: 10.1177/23800844221091701
5. Calcaterra V, Cena H, Magenes VC, Vincenti A, Comola G, Beretta A, et al. Sugar-sweetened beverages and metabolic risk in children and adolescents with obesity: a narrative review. Nutrients (2023) 15:702. doi: 10.3390/nu15030702
6. Who Guidelines Approved by the Guidelines Review Committee. Guideline: Sugars Intake for Adults and Children. Geneva: World Health Organization (2015).
7. Thow AM, Rippin HL, Mulcahy G, Duffey K, Wickramasinghe K. Sugar-sweetened beverage taxes in Europe: learning for the future. Eur J Public Health. (2022) 32:273–80. doi: 10.1093/eurpub/ckab211
8. Al-Jawaldeh A, Taktouk M, Naalbandian S, Aguenaou H, Al Hamad N, Almamary S, et al. Sugar reduction initiatives in the Eastern Mediterranean region: a systematic review. Nutrients (2022) 15:55. doi: 10.3390/nu15010055
9. Najafi M, Mosadeghrad AM, Arab M. Challenges and solutions to banning the advertisement of unhealthy products: a qualitative study. BMC Public Health. (2024) 24:2956. doi: 10.1186/s12889-024-19846-3
10. Zwierczyk U, Kobryn M, Duplaga M. The awareness of the role of commercial determinants of health and the readiness to accept restrictions on unhealthy food advertising in polish society. Nutrients (2023) 15:4743. doi: 10.3390/nu15224743
11. Chiang WL, Azlan A, Mohd Yusof BN. Effectiveness of education intervention to reduce sugar-sweetened beverages and 100% fruit juice in children and adolescents: a scoping review. Expert Rev Endocrinol Metab. (2022) 17:179–200. doi: 10.1080/17446651.2022.2060818
12. Grummon AH, Zeitlin AB, Lee CJY, Hall MG, Collis C, Cleveland LP, et al. Countermarketing versus health education messages about sugar-sweetened beverages: an online randomized controlled trial of us adults. Am J Public Health. (2024) 114:1354–64. doi: 10.2105/AJPH.2024.307853
13. Meric ÇS, Ayhan NY, Yilmaz HÖ. Evaluation of added sugar and sugar-sweetened beverage consumption by University Students. Kesmas Natl Public Health J. (2021) 16:1–7. doi: 10.21109/kesmas.v16i1.3702
14. Liu XT, Xiong JY, Xu YJ, Zhao L, Libuda L, Cheng G. Prospective association of family members' sugar-sweetened beverages intake with children's sugar-sweetened beverages consumption in China. Eur J Nutr. (2023) 62:175–84. doi: 10.1007/s00394-022-02971-3
15. Zhang Y, Xu P, Song Y, Ma N, Lu J. Association between sugar-sweetened beverage consumption frequency and muscle strength: results from a sample of Chinese adolescents. BMC Public Health. (2023) 23:1010. doi: 10.1186/s12889-023-15987-z
16. Jiang Y, Xu T, Dong W, Chu C, Zhou M. Study on the death and disease burden caused by high sugar-sweetened beverages intake in China from 1990 to 2019. Eur J Public Health. (2022) 32:773–8. doi: 10.1093/eurpub/ckac067
17. Tang N, Li J, Zhang Z. Associations between sugar-sweetened beverage consumption, moderate-to-vigorous physical activity duration and psychological symptoms in adolescents: a nationwide study in China. J Affect Disord. (2025) 380:26–36. doi: 10.1016/j.jad.2025.03.069
18. Yu L, Zhou H, Zheng F, Song J, Lu Y, Yu X, et al. Sugar Is the key cause of overweight/obesity in sugar-sweetened beverages (Ssb). Front Nutr. (2022) 9:885704. doi: 10.3389/fnut.2022.885704
19. Qin Z, Xu F, Ye Q, Zhou H, Li C, He J, et al. Sugar-sweetened beverages and school students' hypertension in urban areas of Nanjing, China. J Hum Hypertens. (2018) 32:392–6. doi: 10.1038/s41371-018-0030-9
20. Geng M, Jiang L, Wu X, Ding P, Liu W, Liu M, et al. Sugar-sweetened beverages consumption are associated with behavioral problems among preschoolers: a population based cross-sectional study in China. J Affect Disord. (2020) 265:519–25. doi: 10.1016/j.jad.2020.01.076
21. Zhang Y, Xiong J, Sun R, Chai G, Xiong L. Sugar-sweetened beverages, relative grip strength, and psychological symptoms among rural adolescents in Western China: a cross-sectional study. Front Nutr. (2025) 12:1511256. doi: 10.3389/fnut.2025.1511256
22. Zhuang X, Liu Y, Gittelsohn J, Lewis E, Song S, Ma Y, et al. Sugar-sweetened beverages consumption and associated factors among Northeastern Chinese Children. Nutrients (2021) 13:2233. doi: 10.3390/nu13072233
23. Scaglioni S, De Cosmi V, Ciappolino V, Parazzini F, Brambilla P, Agostoni C. Factors influencing children's eating behaviours. Nutrients (2018) 10. doi: 10.3390/nu10060706
24. Rageliene T, Grønhøj A. The influence of peers' and siblings' on children's and adolescents' healthy eating behavior. A Systematic Literature Review Appetite. (2020) 148:104592. doi: 10.1016/j.appet.2020.104592
25. Ding G, Ma A. Scientific Research Report on Dietary Guidelines for Chinese Residents. 2021: Beijing: People's Health Publishing House (2021).
26. Fausnacht AG, Myers EA, Hess EL, Davy BM, Hedrick VE. Update of the Bevq-15, a beverage intake questionnaire for habitual beverage intake for adults: determining comparative validity and reproducibility. J Hum Nutr Diet. (2020) 33:729–37. doi: 10.1111/jhn.12749
27. General standard for beverage (GB/T 10789-2015). Standards Administration of China (2015). Available online at: https://openstd.samr.gov.cn/bzgk/std/ (Accessed July 5, 2025).
28. van de Gaar VM, van Grieken A, Jansen W, Raat H. Children's sugar-sweetened beverages consumption: associations with family and home-related factors, differences within ethnic groups explored. BMC Public Health. (2017) 17:195. doi: 10.1186/s12889-017-4095-0
29. Screening for Overweight and Obesity among School-Age Children and Adolescents (WS/T 586-2018). National Health Commission of the People's Republic of China (2018). Available online at: https://www.nhc.gov.cn/wjw/pqt/201803/a7962d1ac01647b9837110bfd2d69b26.shtml (Accessed July 5, 2025).
30. Screening Standard for Malnutrition of School-Age Children and Adolescents (WS/T 456-2014). National Health Commission of the People's Republic of China (2014). Available online at: https://www.nhc.gov.cn/zwgkzt/pqt/201407/38b15c0a1ed444e8908e12752decaffa.shtml (Accessed July 5, 2025).
31. Gan Q, Xu P, Yang T, Cao W, Xu J, Li L, et al. Sugar-sweetened beverage consumption status and its association with childhood obesity among chinese children aged 6–17 Years. Nutrients (2021) 13:2211. doi: 10.3390/nu13072211
32. Gui ZH, Zhu YN, Cai L, Sun FH, Ma YH, Jing J, et al. Sugar-sweetened beverage consumption and risks of obesity and hypertension in chinese children and adolescents: a national cross-sectional analysis. Nutrients (2017) 9:1302. doi: 10.3390/nu9121302
33. Yan R, Gong E, Li X, Zheng L, Liao W, Min K, et al. Impact of obesogenic environments on sugar-sweetened beverage consumption among preschoolers: findings from a cross-sectional survey in Beijing. Nutrients (2022) 14:2860. doi: 10.3390/nu14142860
34. Rosinger A, Herrick K, Gahche J, Park S. Sugar-Sweetened Beverage Consumption among U.S. Youth, 2011–2014. NCHS Data Brief (2017). p. 1-8.
35. Park S, Zhao L, Lee SH, Hamner HC, Moore LV, Galuska DA, et al. Children and adolescents in the united states with usual high added sugars intake: characteristics, eating occasions, and top sources, 2015-2018. Nutrients (2023) 15:274. doi: 10.3390/nu15020274
36. Bailey RL, Fulgoni VL, Cowan AE, Gaine PC. Sources of added sugars in young children, adolescents, and adults with low and high intakes of added sugars. Nutrients (2018) 10:102. doi: 10.3390/nu10010102
37. Wen J, Ma H, Yu Y, Zhang X, Guo D, Yin X, et al. Sugar content of market beverages and children's sugar intake from beverages in Beijing, China. Nutrients (2021) 13:4297. doi: 10.3390/nu13124297
38. Harris JL, Sacco SJ, Fleming-Milici F. Tv Exposure, attitudes about targeted food ads and brands, and unhealthy consumption by adolescents: modeling a hierarchical relationship. Appetite. (2022) 169:105804. doi: 10.1016/j.appet.2021.105804
39. Kucharczuk AJ, Oliver TL, Dowdell EB. Social media's influence on adolescents' food choices: a mixed studies systematic literature review. Appetite. (2022) 168:105765. doi: 10.1016/j.appet.2021.105765
40. Murphy G, Corcoran C, Tatlow-Golden M, Boyland E, Rooney B. See, Like, Share, Remember: adolescents' responses to unhealthy-, healthy- and non-food advertising in social media. Int J Environ Res Public Health (2020) 17:2181. doi: 10.3390/ijerph17072181
41. Ryan RM, Deci EL. Self-determination theory and the facilitation of intrinsic motivation, social development, and well-being. Am Psychol. (2000) 55:68–78. doi: 10.1037//0003-066X.55.1.68
42. Patrick H, Williams GC. Self-determination theory: its application to health behavior and complementarity with motivational interviewing. Int J Behav Nutr Phys Act. (2012) 9:18. doi: 10.1186/1479-5868-9-18
43. Kim J, Yun S, Oh K. Beverage consumption among Korean adolescents: data from 2016 Korea youth risk behavior survey. Nutr Res Pract. (2019) 13:70–5. doi: 10.4162/nrp.2019.13.1.70
44. Yang L, Bovet P, Liu Y, Zhao M, Ma C, Liang Y, et al. Consumption of carbonated soft drinks among young adolescents aged 12 to 15 years in 53 low- and middle-income countries. Am J Public Health. (2017) 107:1095–100. doi: 10.2105/AJPH.2017.303762
45. Nguyen M, Jarvis SE, Chiavaroli L, Mejia SB, Zurbau A, Khan TA, et al. Consumption of 100% fruit juice and body weight in children and adults: a systematic review and meta-analysis. JAMA Pediatr. (2024) 178:237–46. doi: 10.1001/jamapediatrics.2023.6124
46. Salvy SJ, de la Haye K, Bowker JC, Hermans RC. Influence of peers and friends on children's and adolescents' eating and activity. Behav Physiol Behav. (2012) 106:369–78. doi: 10.1016/j.physbeh.2012.03.022
47. Smit CR, de Leeuw RNH, Bevelander KE, Burk WJ, van Woudenberg TJ, Buijs L, et al. Promoting water consumption among dutch children: an evaluation of the social network intervention share H (2)O. BMC Public Health. (2021) 21:202. doi: 10.1186/s12889-021-10161-9
48. Franken SCM, Smit CR, Buijzen M. Promoting water consumption on a Caribbean Island: an intervention using children's social networks at schools. Int J Environ Res Public Health (2018) 15:0713. doi: 10.3390/ijerph15040713
49. Zhang R, Yu X, Yu Y, Guo D, He H, Zhao Y, et al. Family food environments and their association with primary and secondary students' food consumption in Beijing, China: a cross-sectional study. Nutrients (2022) 14:1970. doi: 10.3390/nu14091970
50. Bogart LM, Elliott MN, Ober AJ, Klein DJ, Hawes-Dawson J, Cowgill BO, et al. Home sweet home: parent and home environmental factors in adolescent consumption of sugar-sweetened beverages. Acad Pediatr. (2017) 17:529–36. doi: 10.1016/j.acap.2017.01.015
51. Wang C, Chen Y, Xu H, Wang W, Zhou H, Sun Q, et al. Sustaining healthy habits: the enduring impact of combined school-family interventions on consuming sugar-sweetened beverages among pilot Chinese schoolchildren. Nutrients (2024) 16:0953. doi: 10.3390/nu16070953
52. Teo CH, Chin YS, Lim PY, Masrom SAH, Shariff ZM. Impacts of a school-based intervention that incorporates nutrition education and a supportive healthy school canteen environment among primary school children in Malaysia. Nutrients (2021) 13:1712. doi: 10.3390/nu13051712
53. Verdonschot A, de Vet E, van Rossum J, Mesch A, Collins CE, Bucher T, et al. Education or provision? A comparison of two school-based fruit and vegetable nutrition education programs in the Netherlands. Nutrients (2020) 12:3280. doi: 10.3390/nu12113280
54. Wang C, Hong X, Wang W, Zhou H, Wu J, Xu H, et al. The combination of school-based and family-based interventions appears effective in reducing the consumption of sugar-sweetened beverages, a randomized controlled trial among Chinese schoolchildren. Nutrients (2022) 14:0833. doi: 10.3390/nu14040833
55. Pomeranz JL, Mozaffarian D, Micha R. Sugar-sweetened beverage warning policies in the broader legal context: health and safety warning laws and the first amendment. Am J Prev Med. (2020) 58:783–8. doi: 10.1016/j.amepre.2020.01.006
56. Grummon AH, Reimold AE, Hall MG. Influence of the San Francisco, Ca, Sugar-sweetened beverage health warning on consumer reactions: implications for equity from a randomized experiment. J Acad Nutr Diet. (2022) 122:363–70.e6. doi: 10.1016/j.jand.2021.07.008
Keywords: sugar-sweetened beverages, children, peer, family, school-age
Citation: Li Y, Meng L, Liang S, Zhang Y, Li W, Duan J, Cao R, Li J and Huang L (2025) Association between peer behaviors and family environment and pre-packaged sugar-sweetened beverage consumption among primary and secondary school students in Beijing. Front. Public Health 13:1661141. doi: 10.3389/fpubh.2025.1661141
Received: 07 July 2025; Accepted: 12 September 2025;
Published: 01 October 2025; Corrected: 16 October 2025.
Edited by:
Amanda Rodrigues Amorim Adegboye, Coventry University, United KingdomReviewed by:
Haci Ömer Yilmaz, Bandirma Onyedi Eylül University, TürkiyeMarya Yenita Sitohang, The University of Melbourne, Australia
Copyright © 2025 Li, Meng, Liang, Zhang, Li, Duan, Cao, Li and Huang. This is an open-access article distributed under the terms of the Creative Commons Attribution License (CC BY). The use, distribution or reproduction in other forums is permitted, provided the original author(s) and the copyright owner(s) are credited and that the original publication in this journal is cited, in accordance with accepted academic practice. No use, distribution or reproduction is permitted which does not comply with these terms.
*Correspondence: Liyu Huang, bGl5dV9odWFuZzA1MjZAMTI2LmNvbQ==
†Present Address: Liyu Huang, Institute of Nutrition and Food Hygiene, Beijing Center for Disease Prevention and Control, Beijing, China
‡These authors have contributed equally to this work