 Marco Tommasi
 Grazia Ferrara
- Department of Psychological, Health and Territorial Sciences, Università degli Studi G. d'Annunzio Chieti e Pescara, Chieti, Italy
The validity of clinical diagnoses is a fundamental topic in clinical psychology, because now there are some political administrations, as the IOM or the U.K. government, which are focusing on best evidence-based practice in clinical psychology. The most problematic issue in clinical psychology is to avoid wrong diagnoses which can have negative consequences on individual life and on the utility of clinical treatments. In the case of diagnoses based on self-report tests, the diagnostic decision about individual health is based on the comparison between its score and the cutoff, according to the frequentist approach to probability. However, the frequentist approach underestimates the possible risks of incorrect diagnoses based on cutoffs only. The Bayesian approach is a valid alternative to make diagnoses on the basis of the scores from psychological tests. The Bayes' theorem estimates the posterior probability of the presence of a pathology on the basis of the knowledge about the diffusion of this pathology (prior probability) and of the knowledge of sensitivity and specificity values of the test. With all this information, it is possible to estimate the diagnostic accuracy of some self-report tests used for assessing depression. We analyzed the diagnostic accuracy of the most used psychological tests of depression (Zung's Self-Rating Depression Scale, Hamilton Rating Scale for Depression, Center for Epidemiological Studies for Depression and the Beck Depression Inventory), together with a new scale (Teate Depression Inventory) developed with the IRT procedure, by analyzing the published works in which data about sensitivity and specificity of these scales are reported. Except the TDI, none of these scales can reach a satisfactory level of diagnostic accuracy, probably for the absence of an optimal procedure to select test items and subjects with clearly defined pathological symptoms which could allow the reduction of false positives in test scoring.
Introduction
In these last years the problem of validity of psychological diagnoses has become an important topic in psychological research (Witteman et al., 2007). The principal focus is the development of psychological instruments, in particular self-report measures, which have resulted to be more and more efficient in detecting individuals suffering from psychological syndromes, as depression, obsessive-compulsive disorders, anxiety, etc. This is, really, an old topic in clinical psychology (Meehl and Rosen, 1955), but in the last years the necessity of a more precision in diagnostic accuracy also in psychology has become ever more relevant (Witteman et al., 2007; Westbury, 2010; Colquhoun, 2014).
For example, the relatively recent focus on best evidence-based practice in clinical psychology has been substantially influenced by the Institute of Medicine (IOM) reports on the research and policy to deal with problem of mental health and substance use disorders. These works of the National Academies played an important role in the public health policies of the Patient Protection and Affordable Care Act (ACA or Obamacare) as well as of the Mental Health Parity and Addiction Equity Act. The ACA, in addition to the expansion of medical therapies coverage, reformed the procedure by which medical care is delivered to people, with a strong emphasis on accountability and performance measurement of therapists, whereas the Mental Health Parity and Addiction Equity Act attempted to ensure that individuals with mental health and substance use problems could have access to behavioral health care services (Barlow, 2015).
On the other hand, in the United Kingdom a program was developed, defined as the English Improving Access to Psychological Therapies (IAPT), which was intended to provide evidence-based psychological therapies to a general population (Gyani et al., 2013). The rationale was that if people suffering of mental diseases as, for example, anxiety and depression, could obtain valid psychological assistance, then there was not only a benefit for the single individual, but also for the entire society, even from the economic standpoint. However only a quarter of people suffering of mental disease are actually in treatment in Europe and in the U.S.A. (Layard, 2013).
A way to allow people suffering of mental disease to obtain a valid psychological treatment is improving the accuracy of psychological diagnosing in clinical settings. The efficacy of psychological treatments is strongly connected with the accuracy of psychological diagnosing (Barlow et al., 2013; Gyani et al., 2013).
In medical practice many attempts were made to improve diagnostic accuracy (Begg, 1987; Hui and Zhou, 1998; Zhou, 1998), and one of the most promising procedure was the Bayes' theorem (Van Stralen et al., 2009). The Bayes' theorem (also defined Bayes' law or Bayes' rule) is, really, an equation which estimates the probability of an event on the basis of the prior knowledge of conditions that are related to the event (Glickman and Van Dyk, 2007; Viertl, 2012). The Bayesian approach to probability, or bayesianism, is different from the frequentist approach, or frequentism, because it takes into account the level of belief of a person when she/he has to estimate the occurrence probability of an event. This approach is also defined “subjective probability” (Fienberg, 2006). Frequentism, on the other side, take into account only the probability that the event occurrence is due only to random factors. Therefore, the probability on an event can be determined only after its occurrence. In this case, frequentism is related to the likelihood function of the events. The frequentism was the preferred approach to estimate the probability of an event for many years (Fienberg, 2006). It is with the works of some authors (Wald, 1950; Savage, 1951, 1961) that from 50s the Bayes' theorem started to be accepted in the field of statistics and mathematical applications of probability.
The application of frequentism needs the existence of a frequency (density) distribution of a specific characteristic in population. To create the density distribution is necessary a long series of successive trials or observations to count the occurrence of successes or failures. For example, to estimate the probability of head or tail after tossing a coin, we can toss for 5 thousand times, and count how many times we have obtained heads. If the result of an event is due only to random factors, as in the case of tossing a coin, the frequency of head occurrences is equivalent to that of tail occurrences. Therefore both head and cross have the probability of 0.5 to occur. Results of random events have the same probability to occur. In the case of tossing a dice, each face of the dice has 1/6 probability to occur. However, there are some events for which is not possible to estimate the density distribution. For example, Laplace estimated the error probability of calculating the mass of Saturn, but the mass of the planet is not a random variable. Therefore, there are empirical situations in which the classic theory of probability cannot be used (Viertl, 2012).
Also in the field of psychology, some psychological characteristics have a density distribution (e.g., intelligence, personality traits) and thanks to these density distributions we can establish if an individual is normal or pathological. The problem of density distribution of psychological syndromes is relevant especially in diagnostic accuracy in clinical psychology, wherein it is necessary to evaluate if an individual is normal or pathological (Westbury, 2010).
One of the major limits in clinical psychology is the absence of gold standard tests or, in other words, tests which have a 100% of sensitivity and 100% of specificity (Black et al., 1999; Black and Craig, 2002). In absence of a perfect test, therefore, multiple imperfects tests are used in order to gain an improved estimate. In general, the results of these test are correlated, given a subject's disease status (Black et al., 1999; Black and Craig, 2002). However, because tests are imperfect the correct interpretation of their results is always at risk (Lesaffre et al., 2007). It is necessary to add information not present in the data collected with the test and this further information is our knowledge about the parameter of interest (e.g., the probability than a human being is affected by a mental disorder) before performing the test. This previous knowledge constitutes the prior probability of the parameter and the bayesian analysis allows the combination of this prior probability with the collected data to yield an estimate (Black et al., 1999; Black and Craig, 2002; Lesaffre et al., 2007). In addition, Bayes's theorem can be applied in different kinds of analyses, e.g., to analyze individual scores obtained in successive performances to estimate if test failure can be reduced or not (Sheppard and Kaufman, 2005), to reduce failure in radiological examinations (Santosh and Antani, 2018) or to improve analysis of documents with incomplete data (Philippot et al., 2015).
When psychological tests are used to estimate normality, psychometricians or clinical psychologists define specific test scores, the cutoffs, which have the function of delimiting the area of normality. Usually personality traits have a specific distribution of probability which is used to define the cutoff for judging an individual normal or pathological. When an individual obtains a test score which overcomes or it is outside the boundaries defined by cutoffs, this individual is considered not normal or not belonging to normal population. Usually, the most used cutoffs to define the boundaries of normality are 1.96 or 1.64, if raw scores are transformed into z scores. In personality tests the most used cutoff value is 65, when raw scores are transformed into standardized T scores and in intelligence tests the most used cutoffs are 70 and 130, when raw scores are transformed into standardized QI scores.
On the basis of test scores, psychologists determine the normality of examinees and these scores, compared to the relative cutoffs, allow psychologists to decide if the individual does not show particular problems or, otherwise, if she/he presents some psychological diseases or impairments. The rationale on which this procedure is based is that extreme scores are very rare and, therefore, the individual score is probably affected by other factors beyond random variance.
Density distributions of tests scores are used to estimate if an individual is normal or clinical. Cutoffs define the portion of area under the density distribution curve in which individual can be considered, with a certain amount of error, normal or pathological. The amount of error is, usually, 5 or 2.5%. These percentages indicate the risk to obtain false positives or to judge an individual as pathological when, actually, he is normal. If the density distribution is composed by scores obtained by a sample of non-clinical or normal subjects, cutoffs divide the area of the probability curve into the area of false positives (FPs) and of true negatives (TNs). If it is possible to collect scores from a sample of clinical or pathological subjects, then cutoffs divide the area of the density distribution into the area of false negatives (FNs) and the area of true positives (TPs). FPs and TPs are those subjects who overcome the cutoffs. The biggest risk in diagnostic settings is to judge a person as pathological while, actually, he is perfectly sane, or to judge a person as normal, when he is severely pathological. These errors can severely worsen individual life. Therefore, it is necessary an accurate estimation of risk while doing diagnoses.
A very good psychological test should have a low percentage of FPs and a high percentage of TPs. Frequentism considers only the risk to commit FPs (Colquhoun, 2014). For example, if for a specific test, we define a cutoff by which there is only 5% of FPs, however this is not the true level of risk probability. We have to estimate also the percentage of TPs, and then to estimate the False Positive Rate (FPR) which is given by the equation FPs/(FPs + TPs). For example, if a psychological test for diagnosing the presence of a depressive syndrome has a 5% of FPs, that is equivalent to 45 subjects on a total of 900 normal subjects, and a 80% of TPs, that is equivalent to 80 subjects on a total of 100 pathological subjects, then the FPR is 45/(45 + 80) = 0.36. In other words, we have about 36% of probability to commit a mistake when we decide that a subject is pathological. This percentage is clearly superior than the usual level of error of 5%. We have to say that psychological tests with a low percentage of FPs (about 5%) are very rare and that many tests have, actually, a greater percentage of FPs. In addition, even a percentage of 80% of TPs is not very common. Therefore, the FPR value could be very high in diagnostic settings.
However, bayesianism poses another important question, which usually is not considered in estimating the risk of errors in diagnostic accuracy. Bayes' theorem is a statement about conditional probabilities that does not allow the exchange of the order of the events. In other words, if A and B are two events, the occurrence probability of the event A, given B, is not the same of the occurrence probability of the event B, given A (Glickman and Van Dyk, 2007; Viertl, 2012). In the case of psychological assessment, if we develop a test to estimate if a person is normal or pathological, the probability that this person is pathological, if she/he resulted positive at the test is not equivalent to the probability to obtain a positive result, if she/he is truly pathological.
By supposing that we are using a psychological test for diagnosing the presence of depression in people, the probability of a person to be actually depressed, if her/his score overcomes the cutoff value is not equivalent to the probability to obtain scores higher than the cutoff, when she/he is effectively depressed. In other words, when we have to do a diagnosis, to estimate the actual risk of a failure, we have to consider the conditional probability of a person to be depressed when she/he overcomes the cutoff and also the conditional probability of a person to overcome the cutoff when she/he is depressed. Let A the probability of a person to be actually depressed and B the probability to overcome the cutoff. According to Bayes' theorem, the conditional probability of a person to be depressed when he overcomes the cutoff (P(A|B)), also called the posterior probability, is:
wherein P(B|A) is the conditional probability to overcome the cutoff when the person is actually depressed (the probability of TPs), P(A) is the probability to be depressed in the population and P(B) is the probability to obtain a test score that is higher than the cutoff. P(A) is called the prior probability of A, and is related to the percentage of people who are actually depressed in the population. For example, the percentage of depressed people in the U.S.A. population is 6.7% (source: https://www.nimh.nih.gov/health/statistics/major-depression.shtml). Therefore P(A) = 0.067. The probability P(B) is given by the sum of the percentage of FPs and TPs. To estimate P(B) we should know, therefore, the number of FPs and TPs for each specific test used to measure the level of depression. Let us suppose that the percentages of FPs and TPs is 5 and 80% respectively. The conditional probability that a person overcomes the cutoff, if he is actually depressed, is P(B|A) = 0.8, while the probability that a person overcomes the cutoff independently by his pathological state is P(B) = 0.05(1 − 0.067) + 0.8(0.067) = 0.10. The prior probability to be depressed is P(A) = 0.067. The conditional probability that a person is actually depressed if he overcomes the cutoff is: [P(B|A)P(A)]/P(B) = [0.8(0.067)]/0.10 = 0.54.
In other words, the probability that the individual is actually depressed is only 54%. Surely the probability is superior than the probability due to pure chance (50%), however it is not a really high value. There are different reasons for this result. The first reason is that the probability of depressed people in the population is (fortunately) low (about 6.7% of the population suffer from a severe depression). The second is that the test has not a very high percentage of TPs (about 80%), even if psychological tests with usually 80% of TPs are considered very good tests. The third reason is that a percentage of 5% of FPs reduces the probability to recognize correctly depressed people. Because we cannot reduce the percentage of depressed people in population and that the percentage of 80% of TPs is usually considered a good percentage, the remaining thing to do is to improve test reliability by reducing the percentage of FPs. For example, if we reduce from 0.05 to 0.025 the proportion of FPs, then P(B) = 0.025(1 − 0.067) + 0.8(0.067) = 0.08. Therefore, [P(B|A)P(A)]/P(B) = [0.8 (0.067)]/0.08 = 0.67. By halving the proportion of FPs we have increased the probability to correctly detect depressed people from 54 to 67%. Figure 1 shows the variation of the conditional probabilities P(A|B) against different values of P(B|A) (the proportions of TPs) in relation to the proportions of FPs for tests which have to recognize depressed people in the population (with a prior probability of 6.7%). The selected FPs values were 0.3, 0.2, 0.1, 0.05, 0.025, 0.01, and 0.001. The proportions of TPs or P(B|A) values represent also the power of the psychological tests or the capacity of the test to correctly recognize pathological persons.
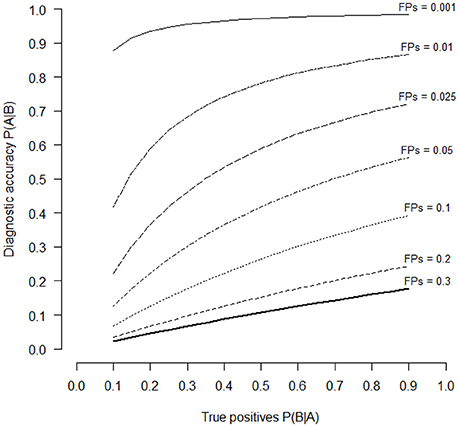
Figure 1. Diagnostic accuracy of an hypothetical psychological test in relation to the different levels of TPs (P(A|B) values of the horizontal axis) and of FPs (series of curves with different line styles). Diagnostic accuracy is estimated with the Bayes' theorem (Equation 1). The selected levels of FPs were 30, 20, 10, 5, 2.5, 1, and 0.1%.
It is possible to see that only when the proportion of FPs is lower than 0.05, psychological tests are able to correctly identify depressed people. By reducing the level of FPs it is possible to increase the probability to make a correct diagnosis of depression. If we set P(A|B) = 0.50, which is the same probability to guess the correct diagnosis by chance, the power of the test P(B|A) is 0.70, 0.34, 0.16, and < 0.10, if the proportions of FPs are 0.05, 0.025, 0.01 and 0.001 respectively. If we set P(A|B) = 0.75, which means to make a correct diagnosis with a percentage greater than pure chance, the necessary power to detect depressed people P(B|A) is 0.41 and < 0.10, for FPs proportions of 0.01 and 0.001 respectively. Therefore, to increase the probability to make a correct diagnosis, psychological tests should have a low proportion of FPs and a relatively high proportion of TPs.
Obviously, the levels of P(A|B) are not only affected by the proportion of FPs and TPs, but also by the proportion of pathological individuals in the population. In the case of psychological depression the proportion of depressed people, always making reference to the U.S.A. population, is affected by gender: 4.8% of males and 8.5% of females are depressed, respectively. Depression is more frequent in young people: 10.9% of people with age between 18 and 25 years are depressed against the value of 6.7% in the general population. This means that psychological tests have higher P(A|B) values in females or young people than in adult males because of the higher occurrence of the pathology in these groups of people.
Independently by the presence of depression among people, it is necessary to analyze if psychological tests are reliable instruments for making accurate diagnoses of depression. Therefore we decided to consider the most used and famous test currently used to make diagnosis of depression: the Beck Depression Inventory, the Hamilton Depression Rating Scale, the Center for Epidemiologic Studies Depression Scale and the Zung Self-Rating Depression Scale. In addition to these scales, we also included a new scale for depression the Teate Depression Inventory.
For each depression scale we collected papers wherein the sensitivity, specificity and cutoff of each scale are reported. Sensitivity is the proportion of TPs, or sensitivity = TP/(TP + FN), while specificity is the proportion of True Negatives (TNs), or specificity = TN/(TN + FP). The proportion of FPs is equivalent to 1 minus the proportion of TNs. Therefore, 1 minus the specificity gives the proportion of FPs, which is the probability to incorrectly recognize depressed people. The proportion of TPs (sensitivity) is the probability P(B|A) and represents the power of the psychological test (probability to recognize correctly depressed people). Therefore, the probability P(B) to obtain a positive result in a test is given by the following formula: P(B) = [sensitivity × P(A)] + [(1 – specificity) × (1 – P(A))], where P(A) is the prior probability of being depressed. For each depression scale, we also collected the Positive Predictive Value (PPV) and the Negative Predictive Value (NPV). PPV is defined as the probability that a person randomly chosen from the population who has tested positive actually has the disease, and NPV is the probability that a person who has tested negative does not have the disease (Hui and Zhou, 1998). PPV is the proportion of patients with positive test result in total of subjects with positive result (PPV = TP/[TP + FP]), while NPV is the proportion of subjects without the disease with a negative test result in total of subjects with negative test results (NPV = TN/[TN + FN]) (Šimundić, 2008). Good tests should have PPV and NPV values close to 1 or 100, if values are in percentage (Šimundić, 2008).
Materials and Methods
We selected the four most used self-report psychological tests used to make diagnostic decision about the presence of symptoms of depressive disorders. The four tests were: the Zung Self-Rating Depression Scale (ZSDS), the Hamilton Rating Scale for Depression (HAMD), the Center for Epidemiological Studies for Depression (CES-D) and the Beck Depression Inventory (BDI). We also included another test for measuring depression recently developed by some of the authors of this paper: the Teate Depression Inventory (TDI).
Self-Report Depression Scales
The Beck Depression Inventory (BDI)
It is a 21 item self-report screening inventory designed to measure the severity of depression (Beck et al., 1961). The BDI considers depression as a unitary dimension which can be applied for diagnoses in different psychiatric and medical contexts. In 1996 some of the items of the test were changed, obtaining, in this way a second version of the depression scale, defined BDI-II (Beck et al., 1996). The inventory uses three cut-off scores to discriminate between “mild,” “moderate,” and “severe” depression which are, respectively, 10, 16, and 20 (Beck et al., 1996).
The Hamilton Rating Scale for Depression (HAMD)
It is a commonly used self-report instrument to assess depression in research and clinical practice (Hamilton, 1960). For clinical purposes, the HAMD is useful to measure the severity of depression in patients suffering of depression in absence of somatic comorbidity. It is a 21 item scale, even if there is also a shorter version of 17 item which is often used as well (Bagby et al., 2004). The cut-off values of the HAMD to be diagnosed as depressed according to the DSM criteria are in the range 15–20 (Faries et al., 2000).
The Zung Self-Rating Depression Scale (ZSDS)
It is a 20 item self-report scale developed by Zung to measure the severity of depressive symptoms (Zung, 1965). The scale can distinguish between different level of severity in depressive symptoms (Zung, 1973): normal (index scores 25–49); mild to moderate (index scores 50–59); moderate to severe (index scores 60–69); severe (index scores >70). Usually the cutoff value used to discriminate between depressed vs. non-depressed is 50 (Dunstan et al., 2017).
The Center for Epidemiological Studies for Depression (CES-D)
It is a self-report scale developed to be used in studies of the epidemiology of depressive symptoms in the general population (Radloff, 1977). It was designed to measure current level of depressive symptoms with a particular attention toward the depressed mood. The scale consists of 20 items. The CES-D is partially derived from the BDI but it uses a more concise wording. The standard cutoff score is 16 (Zich et al., 1990).
The Teate Depression Inventory (TDI)
The TDI (Balsamo and Saggino, 2013, 2014) is a 21-item self-report scale. It was developed via Rasch logistic analysis of responses, within the framework of Item Response Theory (Rasch, 1960). Growing literature suggests that the TDI has promising psychometric properties in both clinical and nonclinical samples (Innamorati et al., 2013; Balsamo et al., 2015a,b,c; Saggino et al., 2017, 2018; Contardi et al., 2018). Additionally, three cutoff scores were recommended in terms of sensitivity, specificity and classification accuracy for screening of varying levels (minimal, mild, moderate, and severe) of depression severity in a group of patients diagnosed with Major Depressive Disorder (Balsamo and Saggino, 2014).
Procedure
We selected papers about the five self-report scales of depression wherein the necessary data for estimating the posterior probability of being really depressed are present. Papers were selected on the basis of precedent reviews about the validity of depressive scales (Bagby et al., 2004; Wang and Gorenstein, 2013; Meader et al., 2014; Martinez-Martin et al., 2016) or by doing a research on Psychinfo or Scholar Google databases. Posterior probability P(A|B) can be calculated if the values of sensitivity and specificity of the scale are available. Therefore we selected papers wherein data about sensitivity and specificity, used as criterions to estimate test validity, were reported. In addition, from the selected papers we reported other kind of information: name of authors, years of publication of their work, the typology of subjects used in the research (normal subjects or patients with psychiatric or medical diseases), number of subjects effectively used for collecting responses on tests of depression and the recommended or used cutoffs to estimate define is the subject is normal or pathological. All these data, including sensitivity and specificity of the depression scale estimated by the authors, are reported in Table 1.
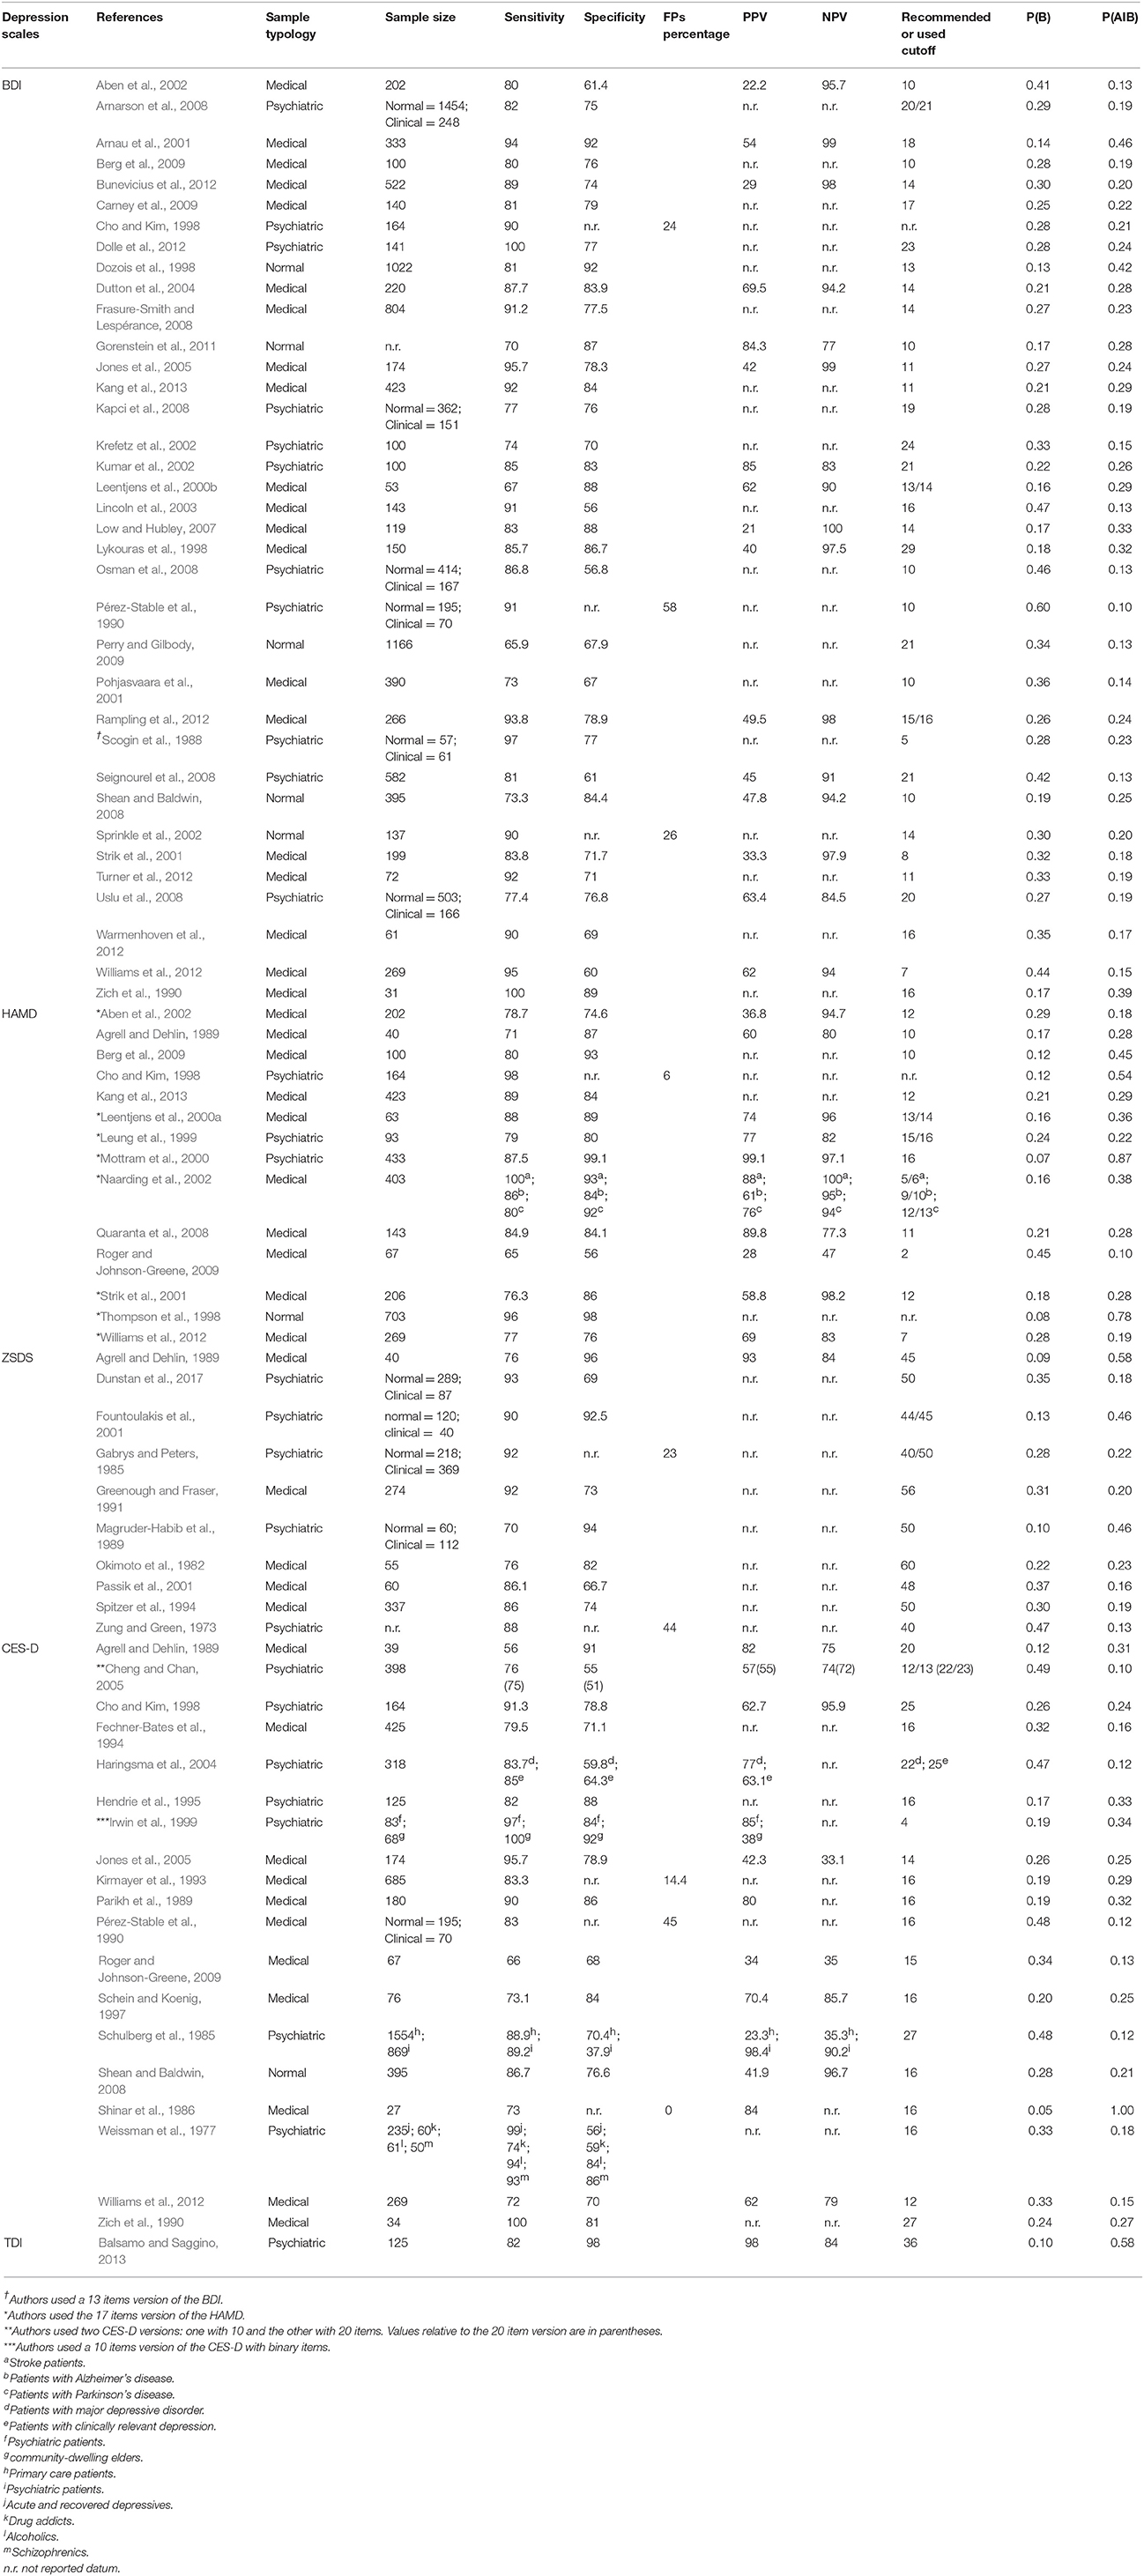
Table 1. Studies using the five depression scales by authors, publication year, sample typology, sample size, sensitivity, specificity, FPs percentage, positive predictive value (PPV), negative predictive value (NPV), recommended or used cutoff, P(B) and P(A|B) value.
In some works, the authors did not report values of specificity. In these case we used the percentage or proportion of false positives, when available. Other works did not reported the cutoffs, even if sensitivity and specificity were described. Nevertheless, we decided to insert these works in our analysis.
Sensitivity and specificity were used to estimate the conditional probability of being depressed if results at the test are positive or, in other word, the percentage of correct diagnoses (P(A|B)). For the prior distribution of depression P(A) we decided to use the percentage of people suffering of major depressive episode among U.S.A. adult population of 2016 (source: https://www.nimh.nih.gov/health/statistics/major-depression.shtml). According to the SAMSHA survey, about 6.7% of U.S.A. adults suffers of a major depressive episode (4.8% and 8.5% for male and female population, respectively). We used this value to estimate the posterior probability of being depressed according to Bayes' theorem.
Results
Table 1 shows the name of authors, the year of publication, the typology of subjects used to estimate criterion validity (sensitivity, specificity, PPV and NPV) of the depression scale and the size of each sample. Sample size indicate the number of subjects that effectively answered to depression scales.
Table 1 shows that many studies did not report PPV and NPV values, even if many publications suggest to report these data when analyzing test accuracy (Begg, 1987; Hui and Zhou, 1998; Šimundić, 2008). The mean values of PPV for the BDI, HAMD and CES-D are 47.36, 68.13 and 62.12%, respectively, while the mean values of NPV for the BDI, HAMD and CES-D are 93.31, 87.03 and 70.17%, respectively. For the ZSDS and TDI we have only one value for the PPV, which are 93% and 98%, respectively, and for the NPV which is 84% for both the depression scales. Using the proportion of sensibility and specificity, we estimated the conditional probability P(A|B) for each depression scale. Table 1 shows the values of P(B) and of P(B|A) for each published work divided for each depression scale. Because the TDI is a newly developed scale, there is currently only one study which reports its sensitivity and specificity values.
Table 1 shows also the three typologies of samples used in each work which were: normal, psychiatric or medical sample. The normal sample includes only subjects without particular psychiatric or psychological syndromes; the psychiatric sample includes subjects who received diagnoses of psychiatric or psychological syndromes (e.g., diagnosis of Major Depressive Disorder); the medical sample includes subjects affected by medical diseases (e.g., patients with Parkinson's disease, stroke patients or primary care patients). The psychiatric sample could indicates also a mixed sample or, in other words, a sample that could be composed both by normal and pathological subjects. In the case of mixed samples, Table 1 reports sizes for both normal and clinical groups.
Figure 2 shows the values of P(A|B) against those of P(B|A) for each selected work of depression scales.
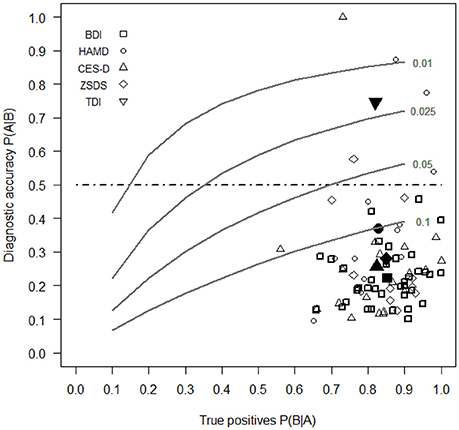
Figure 2. Diagnostic accuracy of BDI, HAMD, ZSDS, CES-D, and TDI estimated with the Bayes' theorem (Equation 1) against the different levels of P(A|B) (horizontal axis) and of FPs (series of gray curves). Open symbols report data for each study, while filled symbols indicate the mean values for each depression scale. For the TDI there is currently one study which reports its sensitivity and specificity values. The selected levels of FPs were 10, 5, 2.5, and 1%.
Our results show that the depression scale with the greatest diagnostic accuracy or the highest value of P(A|B) is the TDI. It is the only self-report depression scale that has a percentage probability of diagnostic accuracy of 74.6%, which overcomes the limit of 50% of correct diagnosis according to Bayes' theorem. This means that the true risk of wrong diagnoses with the TDI is 25.6%. In other words, the TDI is the only scale for which if an individual obtains an high score, then he has also a probability to be truly depressed more than that obtained by chance only. The mean percentages of P(A|B) for the BDI, HAMD, ZSDS, CES-D are 22.4, 37.1, 28.0, and 25.7%, respectively, all lower than the value of 50%.
Figure 3 shows the mean values (in percentages) of sensitivity and specificity of each depression scale. All the depression scales have similar values of sensitivity, but two scales, the HAMD and the TDI, have also specificity values greater than the respective sensitivities.
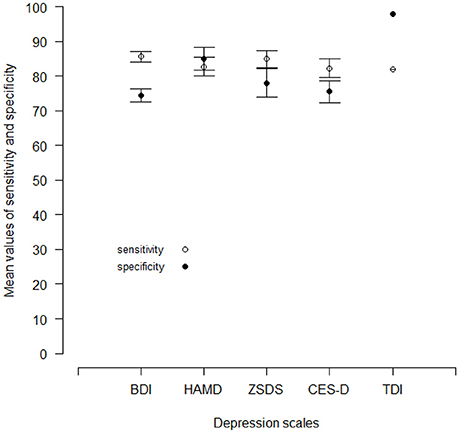
Figure 3. Mean values of sensitivity and specificity for the BDI, the HAMD, the ZSDS and the CES-D reported by different published works. For the TDI, there is currently one published work. Vertical lines are standard errors.
Therefore, only a test with a high level of specificity can guarantee a high level of diagnostic accuracy. In other words, diagnostic reliability can be assured by tests with a small number of FPs.
Table 2 shows the mean values of sensitivity, specificity and cutoff values for the BDI, the HAMD, the ZSDS, the CES-D and the TDI for the three different typology of samples used by authors to estimate test reliability, which are reported in Table 1.
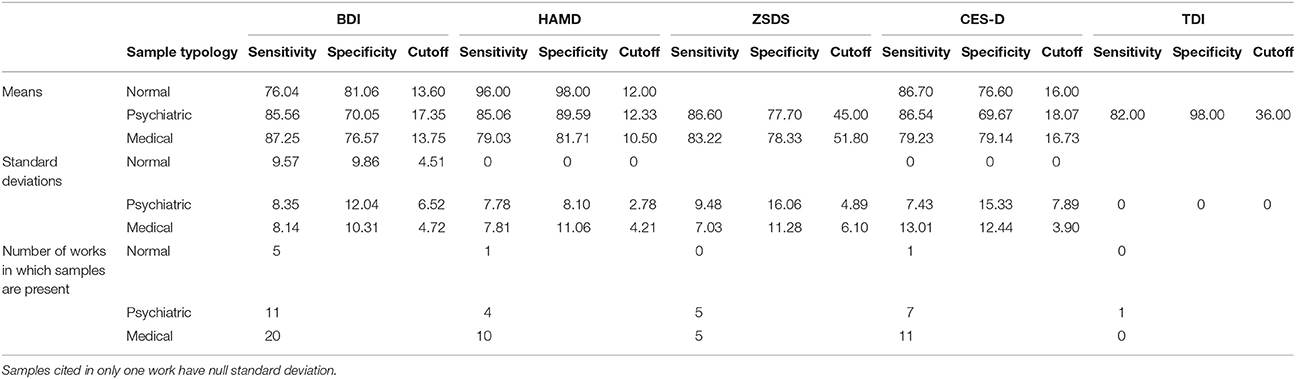
Table 2. Mean values of specificity, sensitivity and cutoff values for each kind of sample (normal, psychiatric or medical) used in studies to estimate the criterion validity of depressive scales.
When psychiatric samples are used, depression scales tend to have higher cutoff values, higher sensitivity values and lower specificity values in relation to those of normal and medical samples. Only the HAMD and the TDI have an opposite trend.
Discussion and Conclusion
On the basis of our analyses, all the most famous self-report depression scales, the BDI, the HAMD, the ZSDS and the CES-D have a low diagnostic accuracy, because none of them can arrive to a level of diagnostic accuracy higher than 50%, according to Bayes' theorem. The TDI, which is the last created depression scale, can overcome the 50% level and it is certainly the most reliable test for diagnosis accuracy of depression in comparison with the other scales. In order to overcome psychometric weaknesses of existing measures of depression (Balsamo and Saggino, 2007), TDI was developed by using the IRT procedure (Embretson and Reise, 2013) to select items which best discriminate between normal and clinical patients (Balsamo and Saggino, 2013, 2014). In general, the IRT procedure allows the estimation of items parameters: the difficulty parameter and the discrimination parameter (Embretson and Reise, 2013). The difficulty parameter defines the order of difficulty of test items, while the discrimination parameter allows the selection of items which best discriminate between different groups of subjects (e.g., normal vs. clinical subjects). The IRT procedure used in the development of the TDI can have improved its diagnostic accuracy by reducing the number of FPs. Even if, probably, studies replications are necessary to obtain greater confidence about the diagnostic accuracy of the TDI, however this finding is strongly encouraging about the use of the scale in clinical settings. Therefore it would be preferable when developing new psychological scales of depression to use the IRT procedure in order to select the items which allow the reduction of FPs frequency.
With medical samples the mean values of specificity of depression scales tend to be higher in relation to other samples, except for the HAMD and the TDI. Probably this is due to the fact that medical symptoms are more clearly defined than psychiatric symptoms, allowing a selection of clinical subjects that are representative of the pathological population. By combining these results with the previous mean values of sensitivity and specificity for each scale, it is possible to state that the low diagnostic accuracy of self-report depression scales are due predominantly to the excessive numbers of FPs in samples, especially in those composed by psychiatric subjects, and that this is due, probably, also to an unsatisfactory definition of the fundamental symptoms that best divide the normal subjects from the pathological ones. Thus, it is fundamental to pay attention to the way subjects are selected to compose the clinical samples that are necessary to validate tests which are provided also for use in clinical psychology or psychiatry. Clinical samples, in particular, should be composed by subjects whose symptoms have been clearly defined according to specific criteria as, for example, those specified in the DSM (American Psychiatric Association, 2013) or ICD-10 (World Health Organization, 1992). Otherwise it is possible to include in the clinical sample people that are not representative of the population with that specific pathology, increasing, in this way, the frequency of FPs. In the case of depression scales, the low specificity in psychiatric samples can be due to the fact that some clinical subjects were not truly depressed because the specific symptoms of depression were not accurately determined. Only with a clear definition of pathological symptoms it is possible to have an accurate estimation of the proportion of TPs and FPs. The problem to define the signs to decide correctly the presence or the absence of a medical or a psychological disorder or a malfunction in instruments are well known in literature (Begg, 1987; Hui and Zhou, 1998; Zhou, 1998; Sheppard and Kaufman, 2005). Therefore, psychologists should define clearly the symptoms of psychological diseases to create valid clinical samples that are truly representative of pathological populations. There were some cases in which psychologists obtained high level of diagnostic accuracy when estimating the validity of the depression scale. Figure 2 shows that in some works the depression scales obtained values of P(A|B) higher than 50% (3 cases for the HAMD, one for the ZSDS and one for the CES-D). However in all the remaining cases, diagnostic accuracy still remain unsatisfactory for depression scales (lower than 50%). Probably in these cases, which are the majority, there was not a really accurate selection of clinical subjects.
Our conclusion is that the diagnostic accuracy of a self-report depression scale, but also for every other kind of psychological test with a possible use in diagnostic settings, can be reached on the basis of the bayesian approach. Using Bayes' theorem, it is possible to define the level of diagnostic accuracy of the test and to intervene, in case of low accuracy, on the factors that have reduced its level of accuracy. The most probable factors influencing diagnostic accuracy are the percentage of TPs, or the number of subjects with a real psychological disease that should obtain scores in psychological tests significantly higher than cutoff values, and the percentage of FPs, or the number of subjects without any psychological disease, that run the risk to be incorrectly diagnosed as pathological. The correct determination of the frequencies of TPs and FPs is based on the accurate selection of test items. This accurate selection can be accomplished not only with the best statistical analyses, but also with a clear definition of the symptoms of psychological syndromes. The diagnostic accuracy can be achieved only with the selection of pathological samples which are representative of the pathological population and with the selection of items which can reduce and increase the frequency of FPs and TPs, respectively.
There are other methods to improve diagnostic accuracy in addition to Bayes' theorem (Begg, 1987; Hui and Zhou, 1998; Zhou, 1998), but these methods use complex mathematical procedures and needs specific computer programs which can induce a negative attitude in clinical psychologist toward them, while the Bayesian approach is relatively simple to comprehend and to handle, also by people without great expertise in mathematics and statistics. Our intent was to increase in psychologist who uses self-report tests for their diagnosis the awareness that they should be more confident in tests in which more efficient statistical techniques were used to select items (e.g., using IRT procedures), that they should control if signs or symptoms of psychological syndromes were accurately defined in the clinical sample and that the presence or absence of syndromes in individuals could not be based only on the comparison of individual test scores to the recommended cutoff values.
Author Contributions
MT concept of the work, writing of the work, data analysis. GF writing part of the work, contribution in data analysis. AS proofread of the work, contribution in data analysis.
Conflict of Interest Statement
We declare a potential conflict of interests for some authors, those who have published the handbook for one of the tests analyzed in the present report (AS–please see References's section).
The remaining authors declare that the research was conducted in the absence of any commercial or financial relationships that could be construed as a potential conflict of interest.
References
Aben, I., Verhey, F., Lousberg, R., Lodder, J., and Honig, A. (2002). Validity of the beck depression inventory, hospital anxiety and depression scale, SCL-90, and hamilton depression rating scale as screening instruments for depression in stroke patients. Psychosomatics 43, 386–393. doi: 10.1176/appi.psy.43.5.386
Agrell, B., and Dehlin, O. (1989). Comparison of six depression rating scales in geriatric stroke patients. Stroke 20, 1190–1194. doi: 10.1161/01.STR.20.9.1190
American Psychiatric Association (2013). Diagnostic and Statistical Manual of Mental Disorders, 5th Edn. Arlington, VA: American Psychiatric Association.
Smári J, Sigurethsson J. F. (2008). The Beck Depression Inventory Second Edition (BDI-II): psychometric properties in Icelandic student and patient populations. Nord. J. Psychiatry 62, 360–365. doi: 10.1080/08039480801962681
Arnau, R. C., Meagher, M. W., Norris, M. P., and Bramson, R. (2001). Psychometric evaluation of the Beck Depression Inventory-II with primary care medical patients. Health Psychol. 20, 112–119. doi: 10.1037/0278-6133.20.2.112
Bagby, R. M., Ryder, A. G., Schuller, D. R., and Marshall, M. B. (2004). The Hamilton Depression Rating Scale: has the gold standard become a lead weight? Am. J. Psychiatry 161, 2163–2177. doi: 10.1176/appi.ajp.161.12.2163
Balsamo, M., Carlucci, L., Murdock, K. K., Sergi, M. R., and Saggino, A. (2015a). The Mediating role of early maladaptive schemas in the relation between co-rumination and depression in youths. PLoS ONE 10:e140177. doi: 10.1371/journal.pone.0140177
Balsamo, M., Innamorati, M., Van Dam, N. T., Carlucci, L., and Saggino, A. (2015b). Measuring anxiety in the elderly: psychometric properties of the state trait inventory of cognitive and somatic anxiety (STICSA) in an elderly Italian sample. Int. Psychogeriatr. 27, 999–1008. doi: 10.1017/S1041610214002634
Balsamo, M., Macchia, A., Carlucci, L., Picconi, L., Tommasi, M., Gilbert, P., et al. (2015c). Measurement of External Shame: an inside view. J. Pers. Assess. 97, 81–89. doi: 10.1080/00223891.2014.947650
Balsamo, M., and Saggino, A. (2007). Test per l'assessment della depressione nel contesto italiano: un'analisi critica [Tests for depression assessnegment in Italian context: a critical review]. Psicoter. Cogn. Comport. 13, 167–199. Available online at: https://www.docplayer.it/33911442-Test-per-l-assessment-della-depressione-nel-contesto-italiano-un-analisi-critica.html
Balsamo, M., and Saggino, A. (2014). Determining a diagnostic cut-off on the teate depression inventory. Neuropsychiatr. Dis. Treat. 10, 987–995. doi: 10.2147/NDT.S55706
Barlow, D. H. (2015). Psychosocial Interventions for Mental and Substance Use Disorders: A Framework for Establishing Evidence-Based Standards. Washington, DC: National Academies Press.
Barlow, D. H., Bullis, J. R., Comer, J. S., and Ametaj, A. A. (2013). Evidence-based psychological treatments: an update and a way forward. Annu. Rev. Clin. Psychol. 9, 1–27. doi: 10.1146/annurev-clinpsy-050212-185629
Beck, A. T., Steer, R. A., and Brown, G. K. (1996). Beck depression inventory-II. San Antonio 78, 490–498.
Beck, A. T., Ward, C. H., Mendelson, M., Mock, J., and Erbaugh, J. (1961). An inventory for measuring. Arch. Gen. Psychiatry 4, 561–571. doi: 10.1001/archpsyc.1961.01710120031004
Begg, C. B. (1987). Biases in the assessment of diagnostic tests. Stat. Med. 6, 411–423. doi: 10.1002/sim.4780060402
Berg, A., Lönnqvist, J., Palomäki, H., and Kaste, M. (2009). Assessment of depression after stroke: a comparison of different screening instruments. Stroke 40, 523–529. doi: 10.1161/STROKEAHA.108.527705
Black, M. A., and Craig, B. A. (2002). Estimating disease prevalence in the absence of a gold standard. Stat. Med. 21, 2653–2669. doi: 10.1002/sim.1178
Black, M. A., Jones, R. D., Carroll, G. J., and Craig, B. A. (1999). “A Bayesian approach to the assessment of diagnostic test accuracy in the absence of a gold standard,” in Proceedings of the Section on Statistics and Epidemiology (Ithaca, NY: Cornell University; American Statistical Association), 94–98.
Bunevicius, A., Staniute, M., Brozaitiene, J., and Bunevicius, R. (2012). Diagnostic accuracy of self-rating scales for screening of depression in coronary artery disease patients. J. Psychosom. Res. 72, 22–25. doi: 10.1016/j.jpsychores.2011.10.006
Carney, C. E., Ulmer, C., Edinger, J. D., Krystal, A. D., and Knauss, F. (2009). Assessing depression symptoms in those with insomnia: an examination of the beck depression inventory second edition (BDI-II). J. Psychiatr. Res. 43, 576–582. doi: 10.1016/j.jpsychires.2008.09.002
Cheng, S. T., and Chan, A. (2005). The center for epidemiologic studies depression scale in older Chinese: thresholds for long and short forms. Int. J. Geriatr. Psychiatr. 20, 465–470. doi: 10.1002/gps.1314
Cho, M. J., and Kim, K. H. (1998). Use of the center for epidemiologic studies depression (CES-D) scale in Korea. J. Nerv. Ment. Dis. 186, 304–310. doi: 10.1097/00005053-199805000-00007
Colquhoun, D. (2014). An investigation of the false discovery rate and the misinterpretation of p-values. R. Soc. Open Sci. 1:140216. doi: 10.1098/rsos.140216
Contardi, A., Imperatori, C., Amati, I., Balsamo, M., and Innamorati, M. (2018). Assessment of affect lability: psychometric properties of the ALS-18. Front. Psychol. 9:427. doi: 10.3389/fpsyg.2018.00427
Dolle, K., Schulte-Körne, G., O'Leary, A. M., von Hofacker, N., Izat, Y., and Allgaier, A. K. (2012). The Beck Depression Inventory-II in adolescent mental health patients: cut-off scores for detecting depression and rating severity. Psychiatry Res. 200, 843–848. doi: 10.1016/j.psychres.2012.05.011
Dozois, D. J., Dobson, K. S., and Ahnberg, J. L. (1998). A psychometric evaluation of the Beck Depression Inventory–II. Psychol. Assess. 10, 83–89. doi: 10.1037/1040-3590.10.2.83
Dunstan, D. A., Scott, N., and Todd, A. K. (2017). Screening for anxiety and depression: reassessing the utility of the Zung scales. BMC Psychiatry 17:329. doi: 10.1186/s12888-017-1489-6
Dutton, G. R., Grothe, K. B., Jones, G. N., Whitehead, D., Kendra, K., and Brantley, P. J. (2004). Use of the Beck Depression Inventory-II with African American primary care patients. Gen. Hosp. Psychiatr. 26, 437–442. doi: 10.1016/j.genhosppsych.2004.06.002
Faries, D., Herrera, J., Rayamajhi, J., DeBrota, D., Demitrack, M., and Potter, W. Z. (2000). The responsiveness of the Hamilton depression rating scale. J. Psychiatr. Res. 34, 3–10. doi: 10.1016/S0022-3956(99)00037-0
Fechner-Bates, S., Coyne, J. C., and Schwenk, T. L. (1994). The relationship of self-reported distress to depressive disorders and other psychopathology. J. Consult. Clin. Psychol. 62, 550–559. doi: 10.1037/0022-006X.62.3.550
Fienberg, S. E. (2006). When did Bayesian inference become“ Bayesian”? Bayesian Anal. 1, 1–40. doi: 10.1214/06-BA101
Fountoulakis, K. N., Samolis, S., Kleanthous, S., Kaprinis, S. G., St Kaprinis, G., and Bech, P. (2001). Reliability, validity and psychometric properties of the Greek translation of the Zung Depression Rating Scale. BMC Psychiatry 1:6. doi: 10.1186/1471-244X-1-6
Frasure-Smith, N., and Lespérance, F. (2008). Depression and anxiety as predictors of 2-year cardiac events in patients with stable coronary artery disease. Arch. Gen. Psychiatr. 65, 62–71. doi: 10.1001/archgenpsychiatry.2007.4
Gabrys, J. B., and Peters, K. A. Y. (1985). Reliability, discriminant and predictive validity of the Zung Self-Rating Depression Scale. Psychol. Rep. 57, 1091–1096. doi: 10.2466/pr0.1985.57.3f.1091
Glickman, M. E., and Van Dyk, D. A. (2007). “Basic bayesian methods,” in Topics in Biostatistics, eds W. T. Ambrosius (Totowa, NJ: Humana Press), 319–338.
Gorenstein, C., Wang, Y. P., Argimon, I. L., and Werlang, B. S. G. (2011). Manual do Inventario de Depressao de Beck - BDI-II. Sao Paulo: Casa do Psicologo.
Greenough, C. G., and Fraser, R. D. (1991). Comparison of eight psychometric instruments in unselected patients with back pain. Spine 16, 1068–1074. doi: 10.1097/00007632-199109000-00010
Gyani, A., Shafran, R., Layard, R., and Clark, D. M. (2013). Enhancing recovery rates: lessons from year one of IAPT. Behav. Res. Ther. 51, 597–606. doi: 10.1016/j.brat.2013.06.004
Hamilton, M. (1960). A rating scale for depression. J. Neurol. Neurosurg. Psychiatr. 23, 56–62. doi: 10.1136/jnnp.23.1.56
Haringsma, R., Engels, G. I., Beekman, A. T. F., and Spinhoven, P. (2004). The criterion validity of the Center for Epidemiological Studies Depression Scale (CES-D) in a sample of self-referred elders with depressive symptomatology. Int. J. Geriatr. Psychiatr. 19, 558–563. doi: 10.1002/gps.1130
Hendrie, H. C., Callahan, C. M., Levitt, E. E., Hui, S. L., Mustek, B., Austrom, M. G., et al. (1995). Prevalence rates of major depressive disorders: the effects of varying the diagnostic criteria in an older primary care population. Am. J. Geriatric Psychiatr. 3, 119–131. doi: 10.1097/00019442-199500320-00004
Hui, S. L., and Zhou, X. H. (1998). Evaluation of diagnostic tests without gold standards. Stat. Methods Med. Res. 7, 354–370. doi: 10.1191/096228098671192352
Innamorati, M., Tamburello, S., Contardi, A., Imperatori, C., Tamburello, A., Saggino, A., et al. (2013). Psychometric properties of the Attitudes toward Self-Revised in Italian young adults. Depress. Res. Treat. 2013:6. doi: 10.1155/2013/209216
Irwin, M., Artin, K. H., and Oxman, M. N. (1999). Screening for depression in the older adult: criterion validity of the 10-item Center for Epidemiological Studies Depression Scale (CES-D). Arch. Intern. Med. 159, 1701–1704. doi: 10.1001/archinte.159.15.1701
Jones, J. E., Hermann, B. P., Woodard, J. L., Barry, J. J., Gilliam, F., Kanner, A. M., et al. (2005). Screening for major depression in epilepsy with common self-report depression inventories. Epilepsia 46, 731–735. doi: 10.1111/j.1528-1167.2005.49704.x
Kang, H. J., Stewart, R., Kim, J. M., Jang, J. E., Kim, S. Y., Bae, K. Y., et al. (2013). Comparative validity of depression assessment scales for screening poststroke depression. J. Affect. Disord. 147, 186–191. doi: 10.1016/j.jad.2012.10.035
Kapci, E. G., Uslu, R., Turkcapar, H., and Karaoglan, A. (2008). Beck Depression Inventory II: evaluation of the psychometric properties and cut-off points in a Turkish adult population. Depress. Anxiety 25, E104–E110. doi: 10.1002/da.20371
Kirmayer, L. J., Robbins, J. M., Dworkind, M., and Yaffe, M. J. (1993). Somatization and the recognition of depression and anxiety in primary care. Am. J. Psychiatry 150, 734–741. doi: 10.1176/ajp.150.5.734
Krefetz, D. G., Steer, R. A., Gulab, N. A., and Beck, A. T. (2002). Convergent validity of the Beck Depression Inventory-II with the Reynolds Adolescent Depression Scale in psychiatric inpatients. J. Pers. Assess. 78, 451–460. doi: 10.1207/S15327752JPA7803_05
Kumar, G., Steer, R. A., Teitelman, K. B., and Villacis, L. (2002). Effectiveness of Beck Depression Inventory–II subscales in screening for major depressive disorders in adolescent psychiatric inpatients. Assessment 9, 164–170. doi: 10.1177/10791102009002007
Layard, R. (2013). Mental health: the new frontier for labour economics. IZA J. Labor Policy 2, 2–16. doi: 10.1002/9781118539415.wbwell103
Leentjens, A. F., Verhey, F. R., Lousberg, R., Spitsbergen, H., and Wilmink, F. W. (2000a). The validity of the Hamilton and Montgomery-Åsberg depression rating scales as screening and diagnostic tools for depression in Parkinson's disease. Int. J. Geriatr. Psychiatr. 15, 644–649. doi: 10.1002/1099-1166(200007)15:7 < 644::AID-GPS167>3.0.CO;2-L
Leentjens, A. F., Verhey, F. R., Luijckx, G. J., and Troost, J. (2000b). The validity of the Beck Depression Inventory as a screening and diagnostic instrument for depression in patients with Parkinson's disease. Movement Disorders 15, 1221–1224. doi: 10.1002/1531-8257(200011)15:6 < 1221::AID-MDS1024>3.0.CO;2-H
Lesaffre, E., Speybroeck, N., and Berkvens, D. (2007). Bayes and diagnostic testing. Veterinary Parasitol. 148, 58–61. doi: 10.1016/j.vetpar.2007.05.010
Leung, C. M., Wing, Y. K., Kwong, P. K., and Shum, A. L. K. (1999). Validation of the Chinese-Cantonese version of the Hospital Anxiety and Depression Scale and comparison with the Hamilton Rating Scale of Depression. Acta Psychiatr. Scand. 100, 456–461. doi: 10.1111/j.1600-0447.1999.tb10897.x
Lincoln, N. B., Nicholl, C. R., Flannaghan, T., Leonard, M., and Van der Gucht, E. (2003). The validity of questionnaire measures for assessing depression after stroke. Clin. Rehabil. 17, 840–846. doi: 10.1191/0269215503cr687oa
Low, G. D., and Hubley, A. M. (2007). Screening for depression after cardiac events using the Beck Depression Inventory-II and the Geriatric Depression Scale. Soc. Indic. Res. 82, 527–543. doi: 10.1007/s11205-006-9049-3
Lykouras, L., Oulis, P., Adrachta, D., Daskalopoulou, E., Kalfakis, N., Triantaphyllou, N., et al. (1998). Beck Depression Inventory in the detection of depression among neurological inpatients. Psychopathology 31, 213–219. doi: 10.1159/000029042
Magruder-Habib, K., Zung, W. W., Feussner, J. R., Alling, W. C., Saunders, W. B., and Stevens, H. A. (1989). Management of general medical patients with symptoms of depression. Gen. Hosp. Psychiatr. 11, 201–207. doi: 10.1016/0163-8343(89)90042-X
Martinez-Martin, P., Leentjens, A. F., de Pedro-Cuesta, J., Chaudhuri, K. R., Schrag, A. E., and Weintraub, D. (2016). Accuracy of screening instruments for detection of neuropsychiatric syndromes in Parkinson's disease. Mov. Disord. 31, 270–279. doi: 10.1002/mds.26522
Meader, N., Moe-Byrne, T., Llewellyn, A., and Mitchell, A. J. (2014). Screening for poststroke major depression: a meta-analysis of diagnostic validity studies. J. Neurol. Neurosurg. Psychiatr. 85, 198–206. doi: 10.1136/jnnp-2012-304194
Meehl, P. E., and Rosen, A. (1955). Antecedent probability and the efficiency of psychometric signs, patterns, or cutting scores. Psychol. Bull. 52, 194–216. doi: 10.1037/h0048070
Mottram, P., Wilson, K., and Copeland, J. (2000). Validation of the Hamilton Depression Rating Scale and Montgommery and Asberg Rating Scales in terms of AGECAT depression cases. Int. J. Geriatr. Psychiatry 15, 1113–1119. doi: 10.1002/1099-1166(200012)15:12 < 1113::AID-GPS253>3.0.CO;2-Y
Naarding, P., Leentjens, A. F., van Kooten, F., and Verhey, F. R. (2002). Disease-specific properties of the Hamilton Rating Scale for depression in patients with stroke, Alzheimer's dementia, and Parkinson's disease. J. Neuropsychiatry Clin. Neurosci. 14, 329–334. doi: 10.1176/jnp.14.3.329
Okimoto, J. T., Barnes, R. F., Veith, R. C., Raskind, M. A., Inui, T. S., and Carter, W. B. (1982). Screening for depression in geriatric medical patients. Am. J. Psychiatr. 139, 799–802. doi: 10.1176/ajp.139.6.799
Osman, A., Barrios, F. X., Gutierrez, P. M., Williams, J. E., and Bailey, J. (2008). Psychometric properties of the Beck Depression Inventory-II in nonclinical adolescent samples. J. Clin. Psychol. 64, 83–102. doi: 10.1002/jclp.20433
Parikh, R. M., Eden, D. T., Price, T. R., and Robinson, R. G. (1989). The sensitivity and specificity of the Center for Epidemiologic Studies Depression Scale in screening for post-stroke depression. Int. J. Psychiatr. Med. 18, 169–181. doi: 10.2190/BH75-EUYA-4FM1-J7QA
Passik, S. D., Kirsh, K. L., Donaghy, K. B., Theobald, D. E., Lundberg, J. C., Holtsclaw, E., et al. (2001). An attempt to employ the Zung Self-Rating Depression Scale as a “lab test” to trigger follow-up in ambulatory oncology clinics: criterion validity and detection. J. Pain Sympt. Manage 21, 273–281. doi: 10.1016/S0885-3924(00)00264-5
Pérez-Stable, E. J., Miranda, J., Mu-oz, R. F., and Ying, Y. W. (1990). Depression in medical outpatients: underrecognition and misdiagnosis. Arch. Intern. Med. 150, 1083–1088. doi: 10.1001/archinte.1990.00390170113024
Perry, A. E., and Gilbody, S. (2009). Detecting and predicting self-harm behaviour in prisoners: a prospective psychometric analysis of three instruments. Soc. Psychiatry Psychiatr. Epidemiol. 44, 853–861. doi: 10.1007/s00127-009-0007-7
Philippot, E., Santosh, K. C., Belaïd, A., and Belaïd, Y. (2015). Bayesian networks for incomplete data analysis in form processing. Int. J. Machine Learn. Cybernet. 6, 347–363. doi: 10.1007/s13042-014-0234-4
Pohjasvaara, T., Vataja, R., Leppävuori, A., Kaste, M., and Erkinjuntti, T. (2001). Depression is an independent predictor of poor long-term functional outcome post-stroke. Euro. J. Neurol. 8, 315–319. doi: 10.1046/j.1468-1331.2001.00182.x
Quaranta, D., Marra, C., and Gainotti, G. (2008). Mood disorders after stroke: diagnostic validation of the poststroke depression rating scale. Cerebrovas. Dis. 26, 237–243. doi: 10.1159/000147450
Radloff, L. S. (1977). The CES-D scale: a self-report depression scale for research in the general population. Appl. Psychol. Meas. 1, 385–401. doi: 10.1177/014662167700100306
Rampling, J., Mitchell, A. J., Von Oertzen, T., Docker, J., Jackson, J., Cock, H., et al. (2012). Screening for depression in epilepsy clinics. A comparison of conventional and visual-analog methods. Epilepsia 53, 1713–1721. doi: 10.1111/j.1528-1167.2012.03571.x
Rasch, G. (1960). Studies in Mathematical Psychology: I. Probabilistic Models for Some Intelligence and Attainment Tests. Oxford: Nielsen & Lydiche.
Roger, P. R., and Johnson-Greene, D. (2009). Comparison of assessment measures for post-stroke depression. Clin. Neuropsychol. 23, 780–793. doi: 10.1080/13854040802691135
Saggino, A., Balsamo, M., Carlucci, L., Cavalletti, V., Sergi, M. R., Da Fermo, G., et al. (2018). Psychometric properties of the Italian version of the young schema questionnaire l-3: preliminary results. Front. Psychol. 9:312. doi: 10.3389/fpsyg.2018.00312
Saggino, A., Carlucci, L., Sergi, M. R., D'Ambrosio, I., Fairfield, B., Cera, N., et al. (2017). A validation study of the psychometric properties of the other as shamer scale−2. SAGE Open 7, 1–10. doi: 10.1177/2158244017704241
Santosh, K. C., and Antani, S. (2018). Automated chest x-ray screening: can lung region symmetry help detect pulmonary abnormalities? IEEE Trans. Med. Imaging 37, 1168–1177. doi: 10.1109/TMI.2017.2775636
Savage, L. J. (1951). The theory of statistical decision. J. Am. Stat. Assoc. 46, 55–67. doi: 10.1080/01621459.1951.10500768
Savage, L. J. (1961). “The foundations of statistical inference reconsidered,” in Proceedings of the Fourth Berkeley Symposium on Mathematical Statistics and Probability, Vol. 1 (Berkeley, CA: University of California), 575–586.
Schein, R. L., and Koenig, H. G. (1997). The Center for Epidemiological Studies-Depression (CES-D) Scale: assessment of depression in the medically ill elderly. Int. J. Geriatr. Psychiatr. 12, 436–446. doi: 10.1002/(SICI)1099-1166(199704)12:4 < 436::AID-GPS499>3.0.CO;2-M
Schulberg, H. C., Saul, M., McClelland, M., Ganguli, M., Christy, W., and Frank, R. (1985). Assessing depression in primary medical and psychiatric practices. Arch. Gen. Psychiatr. 42, 1164–1170. doi: 10.1001/archpsyc.1985.01790350038008
Scogin, F., Beutler, L., Corbishley, A., and Hamblin, D. (1988). Reliability and validity of the short form Beck Depression Inventory with older adults. J. Clin. Psychol. 44, 853–857. doi: 10.1002/1097-4679(198811)44:6 < 853::AID-JCLP2270440604>3.0.CO;2-7
Seignourel, P. J., Green, C., and Schmitz, J. M. (2008). Factor structure and diagnostic efficiency of the BDI-II in treatment-seeking substance users. Drug Alcohol Depend. 93, 271–278. doi: 10.1016/j.drugalcdep.2007.10.016
Shean, G., and Baldwin, G. (2008). Sensitivity and specificity of depression questionnaires in a college-age sample. J. Genet. Psychol. 169, 281–292. doi: 10.3200/GNTP.169.3.281-292
Sheppard, J. W., and Kaufman, M. A. (2005). A Bayesian approach to diagnosis and prognosis using built-in test. IEEE Trans. Instrum. Meas. 54, 1003–1018. doi: 10.1109/TIM.2005.847351
Shinar, D., Gross, C. R., Price, T. R., Banko, M., Bolduc, P. L., and Robinson, R. G. (1986). Screening for depression in stroke patients: the reliability and validity of the Center for Epidemiologic Studies Depression Scale. Stroke 17, 241–245. doi: 10.1161/01.STR.17.2.241
Šimundić, A. M. (2008). Measures of diagnostic accuracy: basic definitions. Med. Biol. Sci. 22, 61–65.
Spitzer, R. L., Williams, J. B., Kroenke, K., Linzer, M., deGruy, F. V. III., Hahn, S. R., et al. (1994). Utility of a new procedure for diagnosing mental disorders in primary care. The PRIME-MD 1000 study. JAMA 272, 1749–1756. doi: 10.1001/jama.1994.03520220043029
Sprinkle, S. D., Lurie, D., Insko, S. L., Atkinson, G., Jones, G. L., Logan, A. R., et al. (2002). Criterion validity, severity cut scores, and test-retest reliability of the Beck Depression Inventory-II in a university counseling center sample. J. Couns. Psychol. 49, 381–385. doi: 10.1037/0022-0167.49.3.381
Strik, J. J., Honig, A., Lousberg, R., and Denollet, J. (2001). Sensitivity and specificity of observer and self-report questionnaires in major and minor depression following myocardial infarction. Psychosomatics 42, 423–428. doi: 10.1176/appi.psy.42.5.423
Thompson, W. M., Harris, B., Lazarus, J., and Richards, C. (1998). A comparison of the performance of rating scales used in the diagnosis of postnatal depression. Acta Psychiatr. Scand. 98, 224–227. doi: 10.1111/j.1600-0447.1998.tb10071.x
Turner, A., Hambridge, J., White, J., Carter, G., Clover, K., Nelson, L., et al. (2012). Depression screening in stroke: a comparison of alternative measures with the structured diagnostic interview for the diagnostic and statistical manual of mental disorders, (major depressive episode) as criterion standard. Stroke 43, 1000–1005. doi: 10.1161/STROKEAHA.111.643296
Uslu, R. I., Kapci, E. G., Oncu, B., Ugurlu, M., and Turkcapar, H. (2008). Psychometric properties and cut-off scores of the Beck Depression Inventory-II in Turkish adolescents. J. Clin. Psychol. Med. Settings 15, 225–233. doi: 10.1007/s10880-008-9122-y
Van Stralen, K. J., Stel, V. S., Reitsma, J. B., Dekker, F. W., Zoccali, C., and Jager, K. J. (2009). Diagnostic methods I: sensitivity, specificity, and other measures of accuracy. Kidney Int. 75, 1257–1263. doi: 10.1038/ki.2009.92
Viertl, R. (2012). Probability and Bayesian statistics. New York, NY: Springer Science & Business Media.
Wang, Y. P., and Gorenstein, C. (2013). Psychometric properties of the Beck Depression Inventory-II: a comprehensive review. Rev. Brasil. Psiquiatr. 35, 416–431. doi: 10.1590/1516-4446-2012-1048
Warmenhoven, F., van Rijswijk, E., Engels, Y., Kan, C., Prins, J., Van Weel, C., et al. (2012). The Beck Depression Inventory (BDI-II) and a single screening question as screening tools for depressive disorder in Dutch advanced cancer patients. Support. Care Cancer 20, 319–324. doi: 10.1007/s00520-010-1082-8
Weissman, M. M., Sholomskas, D., Pottenger, M., Prusoff, B. A., and Locke, B. Z. (1977). Assessing depressive symptoms in five psychiatric populations: a validation study. Am. J. Epidemiol. 106, 203–214. doi: 10.1093/oxfordjournals.aje.a112455
Westbury, C. F. (2010). Bayes' rule for clinicians: an introduction. Front. Psychol. 1:192. doi: 10.3389/fpsyg.2010.00192
Williams, J. R., Hirsch, E. S., Anderson, K., Bush, A. L., Goldstein, S. R., Grill, S., et al. (2012). A comparison of nine scales to detect depression in Parkinson disease which scale to use? Neurology 78, 998–1006. doi: 10.1212/WNL.0b013e31824d587f
Witteman, C. L., Harries, C., Bekker, H. L., and Van Aarle, E. J. (2007). Evaluating psychodiagnostic decisions. J. Eval. Clin. Pract. 13, 10–15. doi: 10.1111/j.1365-2753.2006.00689.x
World Health Organization (1992). The ICD-10 Classification of Mental and Behavioural Disorders: Clinical Descriptions and Diagnostic Guidelines. Geneva: World Health Organization.
Zhou, X. H. (1998). Correcting for verification bias in studies of a diagnostic test's accuracy. Stat. Methods Med. Res. 7, 337–353. doi: 10.1177/096228029800700403
Zich, J. M., Attkisson, C. C., and Greenfield, T. K. (1990). Screening for depression in primary care clinics: the CES-D and the BDI. Int. J. Psychiatr. Med. 20, 259–277. doi: 10.2190/LYKR-7VHP-YJEM-MKM2
Zung, W. W. (1965). A self-rating depression scale. Arch. Gen. Psychiatr. 12, 63–70. doi: 10.1001/archpsyc.1965.01720310065008
Zung, W. W. (1973). From art to science: the diagnosis and treatment of depression. Arch. Gen. Psychiatr. 29, 328–337. doi: 10.1001/archpsyc.1973.04200030026004
Keywords: diagnostic accuracy, Bayes' theorem, depression, clinical psychology, sensitivity and specificity
Citation: Tommasi M, Ferrara G and Saggino A (2018) Application of Bayes' Theorem in Valuating Depression Tests Performance. Front. Psychol. 9:1240. doi: 10.3389/fpsyg.2018.01240
Received: 15 March 2018; Accepted: 28 June 2018;
Published: 23 July 2018.
Edited by:
Elisa Pedroli, Istituto Auxologico Italiano (IRCCS), ItalyReviewed by:
Alexander V. Favorov, Johns Hopkins University, United StatesJingjing Ye, United States Food and Drug Administration, United States
K. C. Santosh, University of South Dakota, United States
Copyright © 2018 Tommasi, Ferrara and Saggino. This is an open-access article distributed under the terms of the Creative Commons Attribution License (CC BY). The use, distribution or reproduction in other forums is permitted, provided the original author(s) and the copyright owner(s) are credited and that the original publication in this journal is cited, in accordance with accepted academic practice. No use, distribution or reproduction is permitted which does not comply with these terms.
*Correspondence: Marco Tommasi, bWFyY28udG9tbWFzaUB1bmljaC5pdA==