 Xiaoli Wang
 Libing Liao
- 1Institute of Mineralogy, TU Bergakademie Freiberg, Freiberg, Germany
- 2Key Laboratory of Materials Utilization of Nonmetallic Minerals and Solid Wastes, National Laboratory of Mineral Materials, School of Materials Science and Technology, China University of Geosciences, Beijing, China
The Rietveld analysis of X-ray powder diffraction patterns is used widely for obtaining the structural information of clay minerals. However, the complex hydration behavior and the variability of interlayer contents are often considered difficult to be described correctly by a simple structure model. In the present work, the use of Cu-triethylenetetramine (Cu-trien)-exchanged nontronites has been proposed to simplify the interlayer structure. This method provides a potential to obtain the structural information of nontronites, for example, the layer charge density, occupancies of cis-octahedral sites, and the iron content by the Rietveld analysis from the X-ray powder diffraction patterns. The approach was demonstrated on three Cu-trien-exchanged nontronite samples. The Rietveld refinements were carried out first on the purified samples and the results showed a good peak fitting between measured and calculated patterns. The refined iron content and the occupancies of cis-octahedral sites are in general agreement with the reference data, which have been obtained from chemical and thermal analyses. The refinement of layer charge density showed lower values compared with the reference. It may be due to the assumption of temperature factor of Cu-trien in the interlayer. A raw sample with natural impurities was chosen to test the applicability of this method. The refinement pattern of the raw sample led to good agreement with the observed data. The results of the iron content and the occupancies of cis-octahedral sites showed the same tendency as purified samples. This study showed that this approach allows for obtaining some structural details of nontronites directly from X-ray powder diffraction patterns of Cu-trien-exchanged samples.
Introduction
Nontronite is the iron-rich dioctahedral smectite. The dominant cation in the tetrahedral sheet is Si4+, which can be substituted by Al3+ commonly (Manceau et al., 2000a). The octahedral sheet contains predominantly Fe3+, partially Al3+, and a minor amount of Mg2+. Only two-thirds of the octahedral positions are occupied by cations in dioctahedral smectites. In general, octahedral sheet shows two different configurations, that is, cis- and trans-octahedron that relate to the disposition of hydroxyl groups. In the cis-octahedron, the OH groups are on the same side, whereas in the trans-octahedron, the OH groups are on the opposite side. Tsipursky and Drits (1984) found that natural dioctahedral smectites may cover a wide range of cis-vacant (cv) and trans-vacant (tv) proportions. Based on the oblique-texture electron diffraction and X-ray diffraction analyses, Besson et al. (1983) and Tsipursky and Drits (1984) demonstrated that for Fe-rich dioctahedral smectites, cis-octahedral positions were occupied and trans-octahedral sites were vacant. In general, nontronites show turbostratic stacking disorder (Biscoe and Warren, 1942) due to the weak bonds between the 2:1 layers (Moore and Reynolds, 1997). This kind of disorder can be described when the layers rotate or translate randomly to each other along the c* direction (Moore and Reynolds, 1997). This kind of structural defect leads to non-Bragg diffraction effects and restricts the applicability of the conventional Rietveld method (Bish, 1993) to smectite. Several attempts of the Rietveld refinement have been done on turbostratically disordered structure (Taylor and Matulis, 1994; Viani et al., 2002; Gournis et al., 2008). However, these authors assumed more or less the ordered structure models, but not a real turbostratically disordered structure. The BGMN software can describe turbostratic disorder features of the diffraction patterns successfully by using the structure model containing a single-layer approach (Ufer et al., 2004). This method allowed an acceptable quantification of the smectite content in bentonites (Ufer et al., 2008). Later, it was applied for the Rietveld refinement of illite-smectite mixed-layer minerals (Ufer et al., 2012). However, this approach cannot handle the complex hydration behavior in the interlayer (Sato et al., 1992, 1996; Ferrage et al., 2005b).
Sposito et al. (1999) concluded the hydration shells of the cations like Na+ and K+ and the results indicated a tendency of inhomogeneous distribution in the interlayer of montmorillonite. Ferrage et al. (2005a,b) showed the hydration behavior of the smectites and the configuration of the interlayer to be complex and varying. It seems that the correct description of the interlayer configuration is another difficulty for the Rietveld analysis of nontronites, except for the turbostratically disordered structure. Therefore, a defined and stable occupancy of the interlayer space, which is independent of humidity, may provide a potential for the modeling of such modified interlayer structures. In general, the intercalation of ethylene glycol (EG) in smectites is used for the characterization of smectites and vermiculites (MacEwan and Wilson, 1984). However, EG is not sufficiently stable for long-time measurements. The Cu-triethylenetetramine (Cu-trien) is a kind of stable complex and used routinely in the determination of the cation exchange capacity (CEC) (Meier and Kahr, 1999). The high selectivity of the index cation [Cu(trien)]2+makes the exchange with the interlayer content fast and complete (Bergaya et al., 2006). Kaufhold et al. (2011) investigated the swelling capacity of Cu-trien-exchanged smectites and concluded that the Cu-trien-exchanged smectites showed constant d001 spacing and without significant water uptake. It may offer a chance to obtain information on the layer charge density by refining the occupancy of the Cu-trien complex in the interlayer spacing.
The current work applied X-ray diffraction analysis to the Cu-trien-exchanged nontronites by using the Rietveld method. The main objectives of this study are given as follows: (I) to investigate if some structural details of nontronites such as the layer charge density, iron content, and the occupancies of the trans- and cis- octahedral sites can be obtained directly from the X-ray diffraction patterns of purified samples and (II) to test the applicability of this method to raw nontronite samples with natural impurities.
Materials and Methods
Sample Preparation
Two of the studied samples are from Uley Mine, South Australia (NAu-1 and NAu-2, Source Clays Repository) (Keeling et al., 2000). The other one is Washington nontronite (NWa). Keeling et al. (2000) found that both NAu-1 and NAu-2 showed high purity. This was also proved by primary X-ray diffraction analysis of samples. Thus, no further chemical treatment was performed for samples, NAu-1 and NAu-2, to remove impurities like carbonite, iron oxides, or organic matter. In contrast, sample NWa contained amounts of quartz and trace amounts of goethite (Figure 1 and Table 5). Due to the large size, quartz can be easily removed from samples by the particle size separation process. The common method for the dissolution of iron oxides is described by Mehra and Jackson (1960). However, Manceau et al. (2000a,b) found that more than 99% octahedral Fe3+ was reduced to Fe2+ after the removal of iron oxides by using this method. Also, the layer charge may also change during the reduction processes (Carrado et al., 2006). Therefore, this procedure was not applied on this sample to avoid the destruction of the structure. To get the enrichment of nontronites, the particle-size separation of the < 0.2 μm fraction from sodium-saturated samples was necessary. The excess salts were removed by dialysis and the < 0.2 μm fraction was obtained by centrifugation. Then, the purified samples (< 0.2 μm) were exchanged with Cu-trien complex: 0.8 g purified samples (< 0.2 μm) were suspended in 100 ml 0.1 M Cu-trien solution. After shaking for 24 h, the suspension was centrifuged and washed with deionized water. Then, 100 ml of fresh Cu-trien solution was added into the centrifuge tube and shaken for 3 h again to ensure the exchange reaction was completed. After washing, the dispersion was dialyzed to remove excess salts and then dried at room temperature.
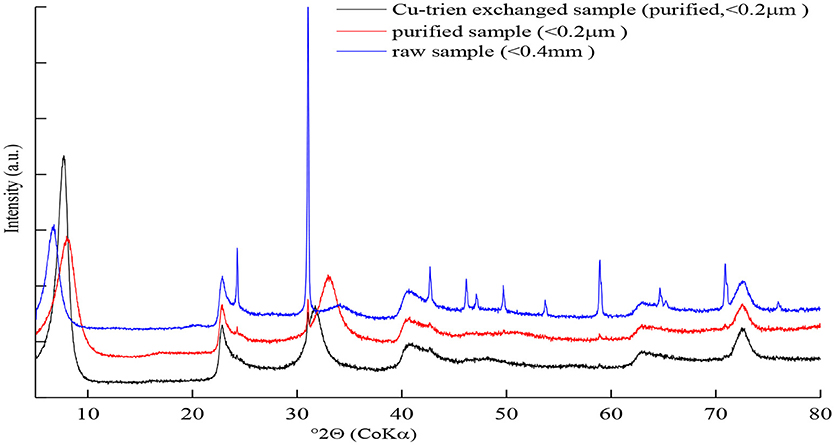
Figure 1. The XRD patterns of the sample NWa with different cation exchange states.
The chemical composition of Cu-trien-exchanged nontronite samples (Table 1) was calculated from the analysis of XRF (Table 2) using the method described by Köster (1977) (Table 1). The XRF measurement was performed on a MagiX PRO XRF-spectrometer (stimulation power: 3.2 KW) in the Institute of Geosciences, the Johannes Gutenberg University, Mainz. Sample NAu-2 showed higher iron content and lower aluminum content compared with sample NAu-1 (Table 1). The result is in good agreement with the study of Keeling et al. (2000). The other sample, NWa, showed significantly lower iron content and higher aluminum than NAu-1 and NAu-2 (Table 1). The layer charge density was determined by the alkyl ammonium method (AAM) (Lagaly and Weiss, 1976; Olis et al., 1990; Lagaly, 1991, 1994). The occupancies of cis- and trans-octahedral sites were calculated by fitting the derivative thermogravimetry (dTG) curves, which provided the information of the dehydroxylation temperature (Drits et al., 1995, 1998). The results showed that almost all cis-octahedral sites were occupied (Table 1) and the octahedral sheets were dominated by trans-vacant structure. The occupancy of iron cations in the octahedral sites was obtained by dividing the octahedral iron content by the octahedral occupancy (Table 1). The structural information obtained from the chemical and thermal analyses was used as independent references to evaluate the Rietveld refinements.

Table 1. Structural formulae and properties of nontronite samples (< 0.2 μm fraction).

Table 2. XRF analysis of the Cu-trien-exchanged nontronites (< 0.2 μm).
X-Ray Powder Diffraction Analysis
The X-ray powder diffraction patterns of nontronites were collected by using a URD 6 (Seifert, CoKα radiation) diffractometer with a secondary beam graphite monochromator, a 0.2-mm detector slit, and an automatic divergence slit (15-mm irradiated length). The measurements were performed from 5° to 80° 2θ, with a step width of 0.03° 2θ and 3–5 s/step. The patterns were analyzed by the Analyze RayfleX v.2.352 software. The dried samples (< 0.2 μm) were ground in an agate mortar by hand and filled into the sample holder by using a side-loading technique. To reduce the influence of the preferred orientation on X-ray powder diffraction patterns, a specific method for sample preparation was applied. The powders passed through a sieve with 100-μm mesh to destroy the aggregates, which had formed during the previous drying process and formed a rough surface.
Rietveld Refinements
The program BGMN (Bergmann et al., 1998) was applied for the Rietveld refinement. The single-layer approach (Ufer et al., 2004) was used to describe the turbostratically disordered structure of nontronites. A standard cell was elongated 10 times in the stacking direction and filled only by one single 2:1 layer (Ufer et al., 2004). The atomic coordinates of the 2:1 layers of nontronites were taken from the Manceau et al. (2000a) study and recalculated for an orthogonal unit cell (Table 3). The positions of the atoms were kept constant during the refinement. The start value for the lattice constant b was set at 0.906 nm and refined with the limits ranging from 0.90 to 0.93 nm, and the lattice constant a was connected to b setting as due to the assumption of the hexagonal layer symmetry (Manceau et al., 2000a). The start value of lattice constant c of Cu-trien-exchanged nontronites was set at 1.31 nm and refined with the limitation between 1.29 and 1.36 nm (Kaufhold et al., 2011). The atomic structure of the Cu-trien complex was derived from the Keramidas and Rentzeperis (1992) study. The Cu-trien molecule was placed in the middle of the interlayer and rotated parallel to the TOT layer. During the refinement, the atomic positions were kept fixed. The lattice constants were set as a = 0.7362 nm, b = 1.4708 nm, and c = 1.5551 nm (Keramidas and Rentzeperis, 1992). According to the study of Szczerba and Ufer (2018), the temperature factor of Cu-trien cation in the interlayer was set at 0.3 nm2, which should be significantly higher than the atoms in other positions.
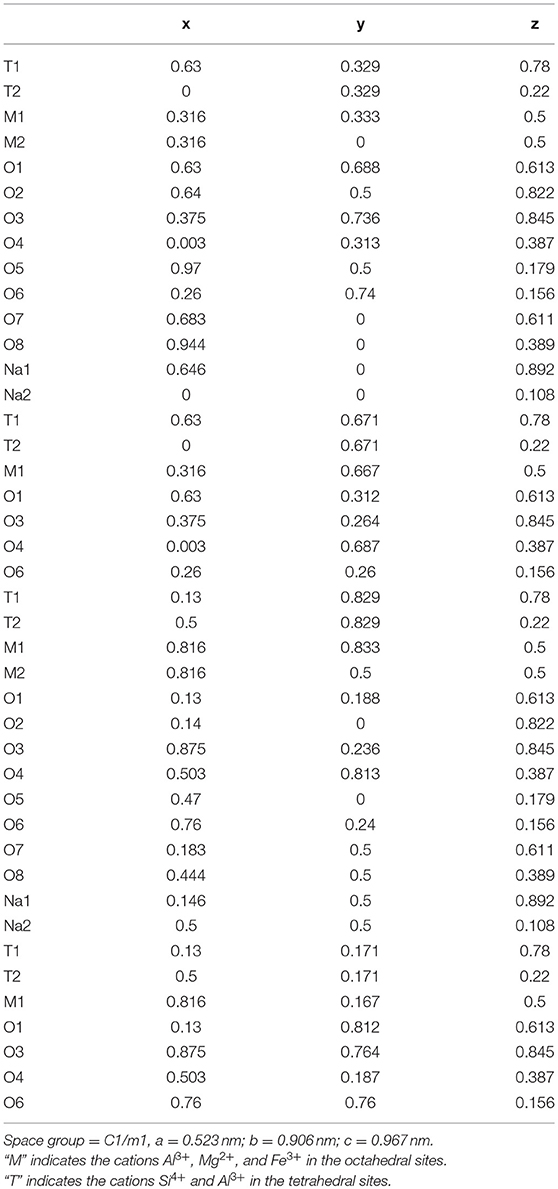
Table 3. Atomic coordinates of the orthogonalized unit cell for nontronite recalculated from Manceau et al. (2000a).
The occupancy of the Cu-trien complex in the interlayer P (Cutrien) and the iron occupation in the octahedral position P (Fe) were refined. The layer charge density was presented by the parameter P (Cutrien). Despite the nontronites being known to prefer the trans-vacant octahedral configuration, both cis- and trans-vacant sites are considered. The cis-site occupation P (cis-sites) was tried to be refined for checking this precondition. The scaling factor and the peak-broadening parameters were refined. The correction function for the preferred orientation was introduced and refined during the refinement. The zero-point shift correction and the sample displacement error were refined as nonstructural parameters.
Results and Discussion
Rietveld Refinement on Purified Cu-Trien-Exchanged Samples
The X-ray diffraction patterns of sample NWa with different treatments are shown in Figure 1. The patterns of the raw and purified Na-saturated sample displayed asymmetric and broad 001 reflection (Figure 1), which indicated complex hydration states and inhomogeneous layer charge distribution in the interlayer (Ferrage et al., 2005b, 2007). Thus, such a peak profile is difficult to be simulated by a simple structure model. After exchanging the interlayer contents with the Cu-trien, the intensity of the 001 reflection was enhanced and well-defined (Figure 1). This method makes the description of the interlayer structure much easier and provides a probability to obtain the layer charge density by refining the occupancy of the Cu-trien complex in the interlayer.
The refinement of the sample NAu-1 showed a good agreement between the measured and calculated patterns and gave reasonable results for the iron content and the cis-octahedral sites occupancies (Table 4). The value of Rwp was 6.79% (Figure 2). The refined value of P (Fe) = 0.86(8) agreed with the chemical data within the estimated confidence interval (Table 4). The cis-octahedral site occupancy P (cis-sites) = 0.97(2) was close to the expected value of 1. On the contrary, the occupancy of Cu-trien in the interlayer P (Cutrien) = 0.312(5) was underestimated compared with the value 0.37 obtained by the AAM method (Table 4).
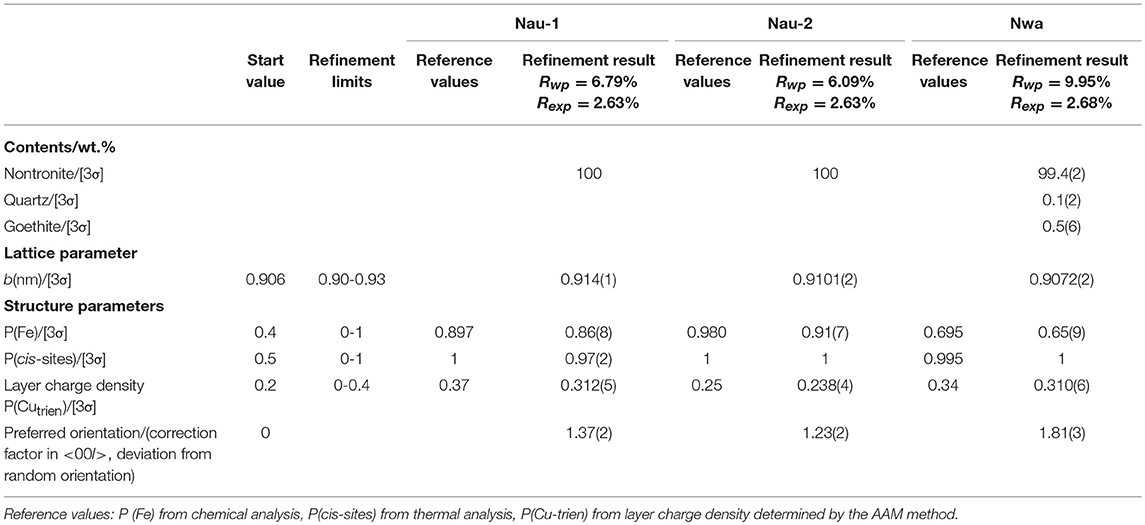
Table 4. The refinement results of the purified nontronite samples (< 0.2 μm).
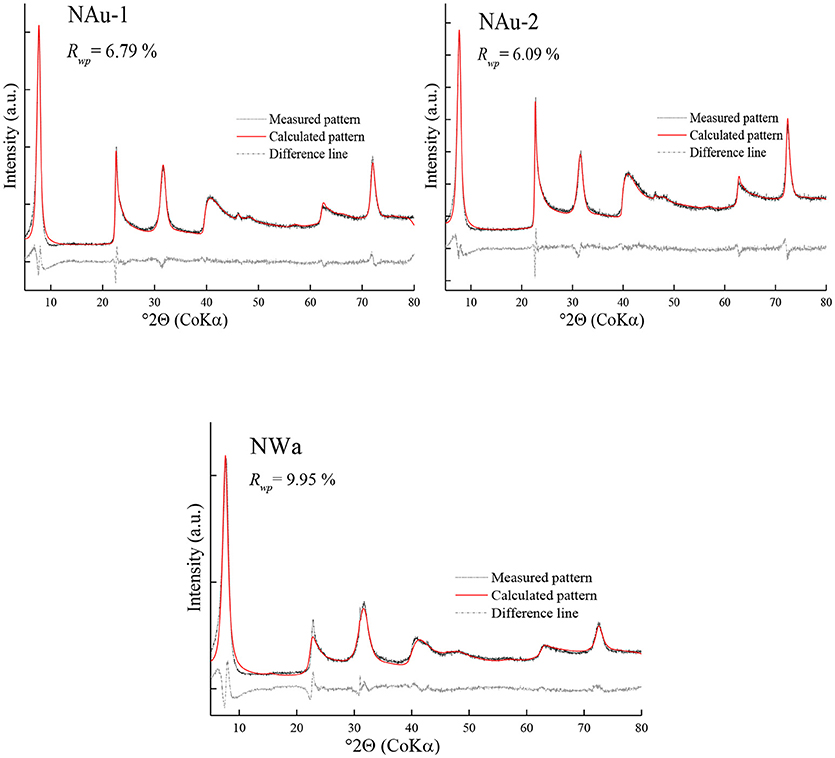
Figure 2. Rietveld refinements of purified nontronite samples.
The refinement of NAu-2 resulted in satisfactory results. The Rwp value was 6.09%. The iron content P (Fe) = 0.91(7) was near the value 0.980 as calculated from the structural formula. The refined values of P (Cutrien) = 0.238(4) and P (cis-sites) = 1 were in good agreement with the reference data (Table 4).
The refinement of the sample NWa got the Rwp value of 9.95% (Figure 2). Mismatches of two main profiles were present at the 21–26°2θ 02; 11 band and 30–33° 2θ 003 reflection. The high-measured intensities may be related to the high-preferred orientation (Table 4), which could not be compensated completely by the correction model. Alternatively, it may be considered that this sample has comparably low iron and high aluminum content in the octahedral sites. The coordinates derived from the Manceau et al. (2000a) study may not fit perfectly for such Al-rich varieties. The refined iron content P(Fe) = 0.65(9) was in agreement with the value of 0.695 (in the estimated confidence interval). The refined parameter P (cis-sites) = 1 was as expected from the results of the thermal analysis. The refined P (Cutrien) = 0.310(6) was lower compared with the value of 0.34 as determined by the AAM method (Table 4).
The obtained results showed that the refined cis-site occupancies and the iron content for purified samples were found to be comparatively consistent with the references. A tendency for underestimation of the layer charge density was observed. It may relate to the assumed values of the temperature factor. Despite the temperature factor of Cu-trien in the interlayer already having been enhanced according to Szczerba and Ufer (2018), there is still room for improvement if the temperature factor could be estimated independently, which, however, is hard to substantiate. The misfit of 001 reflection may be caused by the sample roughness, which can make deviation of peak profiles and intensities at a very low angle.
Rietveld Refinement of Raw Sample
The feasibility of the structural model was tested in a raw nontronite sample with natural impurities. As the Washington bulk nontronite (sample NWa) was the only one containing significant impurities, it was chosen as a representative example in this study. This raw sample was exchanged with the Cu-trien complex directly without purification and particle size-separation process.
The calculated pattern was fitted satisfactorily with the observed data (Figure 3). The intensity of 02; 11 band was enhanced and matched much better than the purified sample. This might be related to the low preferred orientation (Table 5). Generally, the bulk sample had bigger particle size and less aggregation than the purified sample, which may lead to lower preferred orientation (Table 5).
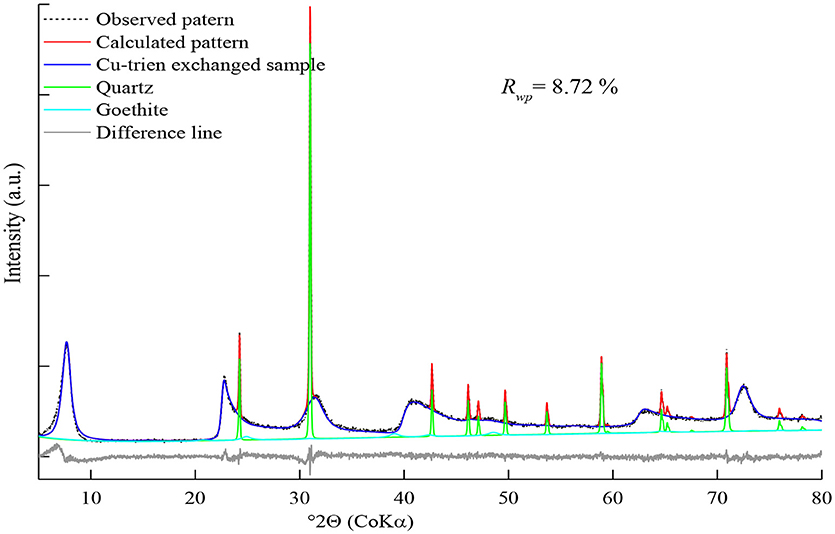
Figure 3. Refinement on raw Washington nontronite.
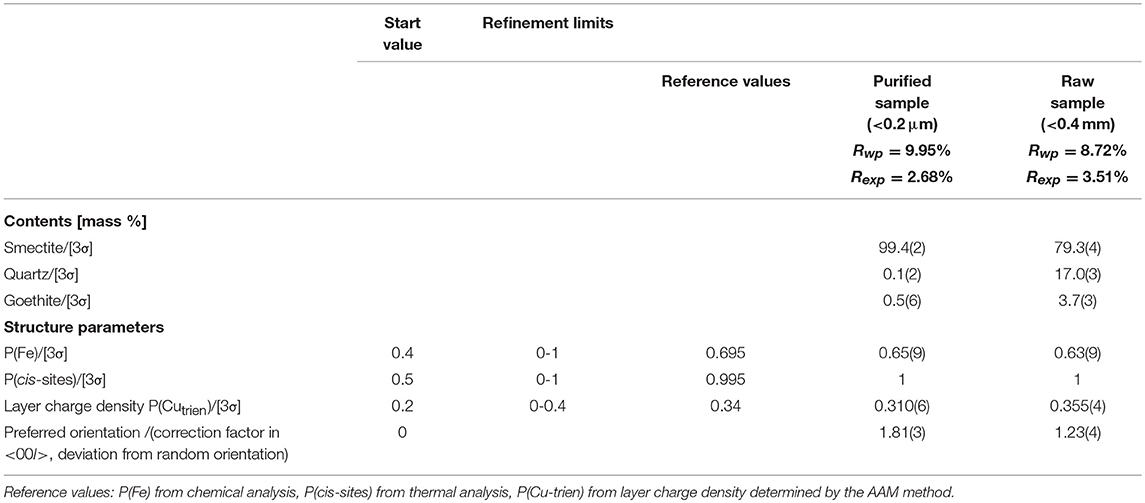
Table 5. Comparison of the refinement results for purified and raw Washington nontronite.
The measured pattern was covered with a large number of quartz reflections and small broadened peaks of goethite. The contents of the quartz and goethite were estimated as 17.0(3) and 3.7(3)% (Table 5). The Rwp value of raw NWa sample decreased to 8.72%, while the refinement result of the purified sample was 9.95% (Table 5). The refined value of cis-octahedral site occupancy P(cis-sites) = 1 was in good agreement with the value of 0.995, which came from the thermal analysis (Table 1). The refined iron content P (Fe) = 0.63(9) was lower than the value of 0.695 calculated from the structural formula. However, it displayed the same tendency for the purified sample (Table 5). The refinement result of P (Cu-trien) = 0.355 (4) was slightly higher than the reference; by contrast, the refined value for the purified sample was lower than the reference (Table 5).
The refinement result of raw nontronite samples showed that the refined cis-octahedral site occupancies and iron content led to the same trends as the purified sample. However, the refined value of the layer charge density resulted in a reverse tendency to that of the purified sample (Table 5). This may further confirm the previous discussion: the selected coordinates may not work satisfactorily for this specific sample with lower iron-content and higher aluminum-content nontronites (Tables 4, 5). The atomic coordinates applied to all samples were chosen identically (derived by Manceau et al., 2000a); however, such a choice might be a kind of simplification or compromise.
Summary and Conclusions
The Rietveld refinements of purified Cu-trien-exchanged nontronites led to comparatively reasonable results. The refined values of the iron content and the cis-octahedral sites were highly consistent with the references obtained from the chemical and thermal analyses. However, the refined layer charge density showed a tendency for underestimation. It may be attributed to the uncertainty of the temperature factor of Cu-trien in the interlayer. The test of the structural model on the raw Washington nontronite showed good agreement between calculated and measured patterns. The refinement results showed similar tendency for the iron content and occupancies of cis-octahedral sites, but an uncertain difference of layer charge densities between the raw and purified samples. It may be a consequence of the simplification of the atomic coordinates. However, the models should be applied to more nontronite samples with different iron contents in further research so as provide evidence for this presumption.
The results of this work show that the current structure model works better for nontronites with high iron content than those with low iron content. The structure information such as the layer charge density, iron content, and occupancies of cis-octahedral sites can be obtained directly from X-ray diffraction patterns by the Rietveld method. This study may offer a potential for refining more structural parameters of nontronites by using this novel approach. The temperature factor of the interlayer species should be considered seriously since the occupancy of the atoms in the interlayer is related to this parameter. On the other hand, further developments should also focus on the optimization of the atomic positions, which may cover nontronite variabilities.
Author Contributions
XW performed the experiments, derived the models, interpreted the data and wrote manuscript. LL supervised development of this work, helped in data interpretation and manuscript evaluation, and acted as corresponding author.
Conflict of Interest Statement
The authors declare that the research was conducted in the absence of any commercial or financial relationships that could be construed as a potential conflict of interest.
Acknowledgments
This research was supported by the National Key R&D Program of China (2017YFB0310704). The authors are very grateful to Dr. Reinhard Kleeberg (TU Bergakademie Freiberg) for his helpful suggestions and corrections for the manuscript. We would like to thank Dr. Kristian Ufer (Bundesanstalt für Geowissenschaften und Rohstoffe, BGR) for his assistance in the structural model creation. We are delighted to thank Dr. Katja Emmerich and Dr. Annett Steudel (Karlsruhe Institute of Technology, KIT) for their support in the laboratory for the measurement of layer charge density and the assistance in the thermal analysis. We would like to thank Prof. Dr. Gerhard Heide (TU Bergakademie Freiberg) for all the support during this work.
References
Bergaya, F., Lagaly, G., and Vayer, M. (2006). “Cation and anion exchange,” in Handbook of Clay Science, Vol. 1. eds F. Bergaya, B. K. G. Theng, and G. Lagaly (Clay Science), 988–995. doi: 10.1016/S1572-4352(05)01036-6
Bergmann, J., Friedel, P., and Kleeberg, R. (1998). BGMN – a new fundamental parameters based Rietveld program for laboratory X-ray sources; it's use in quantitative analysis and structure investigations. CPD Newslett. Commiss. Powder Diffract. Int Union Crystallogr. 20, 5–8.
Besson, G., Bookin, A. S., Dainyak, L. G., Rautureau, M., Tsipursky, S. I., Tchoubar, C., et al. (1983). Use of diffraction and Mössbauer methods for the structural and crystallochemicalcharacterisation of nontronites. J. Appl. Crystallogr. 16, 374–383. doi: 10.1107/S0021889883010651
Biscoe, J., and Warren, B. E. (1942). An X-ray study of carbon black. J. Appl. Phys. 13, 364–371. doi: 10.1063/1.1714879
Bish, D. L. (1993). “Studies of clays and clay minerals using X-ray powder diffraction and the Rietveld method,” in CMS Workshop, Lectures 5, Computer Applications to X-ray Powder Diffraction Analysis of Clay Minerals, eds J. R. Walker and R. C. Reynolds Jr. (Boulder, CO: The Clay Minerals Society), 79–112.
Carrado, K. A., Decarreau, A., Petit, S., Bergaya, F., and Lagaly, G. (2006). Synthetic clay minerals and purification of natural clays. Dev. Clay Sci. 1, 115–139. doi: 10.1016/S1572-4352(05)01004-4
Drits, V. A., Besson, G., and Muller, F. (1995). An improved model for structural transformations of heat-treated aluminous dioctahedral 2:1 layer silicates. Clays Clay Miner. 43, 718–731. doi: 10.1346/CCMN.1995.0430608
Drits, V. A., Lindgreen, H., Salyn, A. L., Ylagan, R., and McCarty, D. K. (1998). Semiquantitative determination of trans-vacantand cis-vacant 2:1 layers in illites and illitesmectites by thermal analysis and X-ray diffraction. Am. Mineral. 83, 1188–1198. doi: 10.2138/am-1998-11-1207
Ferrage, E., Lanson, B., Malikova, N., Planon, A., Sakharov, B. A., and andDrits, V. A. (2005a). New insights on the distribution of interlayer water in bi-hydrated smectite from X-ray diffraction profile modeling of 00 l reflections. Chem. Mater. 17, 3499–3512. doi: 10.2138/am.2005.1776
Ferrage, E., Lanson, B., Sakharov, B. A., and Drits, V. A. (2005b). Investigation of smectite hydration properties by modeling experimental X-ray diffraction pattern. Part I. Montmorillonite hydration properties. Am. Mineral. 90, 1358–1374. doi: 10.1021/cm047995v
Ferrage, E., Lanson, B., Sakharov, B. A., Geoffroy, N., Jacquot, E., and Drits, V. A. (2007). Investigation of dioctahedral smectite hydration properties by modeling of X-ray diffraction profiles: influence of layer charge and charge location. Am. Mineral. 92, 1731–1743. doi: 10.2138/am.2007.2273
Gournis, D., Lappas, A., Karakassides, M. A., Többens, D., and Moukarika, A. (2008). A neutron diffraction study of alkali cation migration in montmorillonites. Phys. Chem. Miner. 35, 49–58. doi: 10.1007/s00269-007-0197-z
Kaufhold, S., Dohrmann, R., Ufer, K., Kleeberg, R., and Stanjek, H. (2011). Termination of swelling capacity of smectites by Cu-trien exchange. Clay Miner. 46, 411–420. doi: 10.1180/claymin.2011.046.3.411
Keeling, J. L., Raven, M. D., and Gates, W. P. (2000). Geology and characterization of two hydrothermal nontronites from weathered metamorphic rocks at Uley graphite mine, South Australia. Clays Clay Miner. 48, 537–548. doi: 10.1346/CCMN.2000.0480506
Keramidas, K. G., and Rentzeperis, P. I. (1992). The crystal structure of triethylenetetramine copper(II) fluorophosphate, Cu(trien)(PF6)2. Zeitschrift für Kristallographie 201, 171–176.
Köster, H. M. (1977). Die Berechnung kristallchemischer Strukturformeln von 2:1 Schichtsilikaten unter Berücksichtigung der gemessenen Zwischenschichtladungen und Kationenumtauschkapazitäten, sowie der Darstellung der Ladungsverteilung in der Strukturmittels Dreieckskoordinaten. Clay Miner. 12, 45–54. doi: 10.1180/claymin.1977.012.1.03
Lagaly, G. (1991). Erkennung und Identifizierung von Tonmineralen mit organischen Stoffen. eds H. Tributh and G. Lagaly (Gießen: DTTG), 86–130.
Lagaly, G. (1994). “Layer charge determination by alkylammonium ions,” in CMS Workshop, Lectures 6, Layer Charge Characteristics of 2:1 Silicate Clay Minerals, ed A. R. Mermut (Aurora, CO: The Clay Minerals Society), 1–46.
Lagaly, G., and Weiss, A. (1976). “The layer charge of smectitic layer silicates,” in Proceedings of the International Clay Conference (Mexico), 157–172.
MacEwan, D. M. C., and Wilson, M. J. (1984). “Interlayer and intercalation complexes of clay minerals,” in Crystal Structures of Clay Minerals and Their x-ray Identification, eds G. W. Brindley, and G. Brown (London: Mineralogical Society), 197–248.
Manceau, A., Lanson, B., Drits, V. A., Chateigner, D., Gates, W. P., Wu, J., et al. (2000a). Oxidationreduction mechanism of iron in dioctahedral smectites. I. Crystal chemistry of oxidized reference nontronites. Am. Mineral. 85, 133–152. doi: 10.2138/am-2000-0114
Manceau, A., Lanson, B., Drits, V. A., Chateigner, D., Gates, W. P., Wu, J., et al. (2000b). Oxidationreduction mechanism of iron in dioctahedral smectites. II. Crystal chemistry of reduced Garfield nontronite. Am. Mineral. 85, 153–172. doi: 10.2138/am-2000-0115
Mehra, O. P., and Jackson, M. L. (1960). “Iron oxide removal from soils and clays by a dithionite-citrate-system buffered with sodium bicarbonate,” in 7th National Conference on Clays and Clay Minerals, ed A. Swineford (Washington, DC: Pergamon Press), 317–327.
Meier, L. P., and Kahr, G. (1999). Determination of the cation exchange capacity (CEC) of clay minerals using the complexes of copper (II) ion with triethylenetetramine and tetraethylenepentamine. Clays Clay Miner. 47, 386–388. doi: 10.1346/CCMN.1999.0470315
Moore, D. M., and Reynolds, R. C. Jr. (1997). X-ray Diffraction and the Identification and Analysis of Clay Minerals. New York, NY: Oxford University Press, 335–339.
Olis, A. C., Malla, P. B., and Douglas, L. A. (1990). The rapid estimation of the layer charges of 2:1 expanding clays from a single alkylammonium ion expansion. Clay Miner. 25, 39–50. doi: 10.1180/claymin.1990.025.1.05
Sato, T., Murakami, T., and Watanabe, T. (1996). Change in layer charge of smectites and smectitelayers in illite/smectite during diagenetic alteration. Clays Clay Miner. 44, 460–469. doi: 10.1346/CCMN.1996.0440403
Sato, T., Watanabe, T., and Otsuka, R. (1992). Effects of layer charge, charge location, and energy change on expansion properties of dioctahedral smectites. Clays Clay Miner. 40, 103–113. doi: 10.1346/CCMN.1992.0400111
Sposito, G., Skipper, N. T., Sutton, R., Park, S., Soper, A. K., and Greathous, J. A. (1999). Surface geochemistry of the clay minerals. Proc. Natl. Acad. Sci. USA. 96, 3358–3364. doi: 10.1073/pnas.96.7.3358
Szczerba, M., and Ufer, K. (2018). New model of ethylene glycol intercalate in smectites for XRD modelling. Appl. Clay Sci. 153, 113–123. doi: 10.1016/j.clay.2017.12.010
Taylor, J. C., and Matulis, C. E. (1994). A new method for Rietveld clay analysis: part 1. Use of a universally measured standard profile for Rietveld quantification of montmorillonites. Powder Diffract. 9, 119–123. doi: 10.1017/S0885715600014093
Tsipursky, S. I., and Drits, V. A. (1984). The distribution of octahedral cations in the 2:1 layers of dioctahedral smectites studied by oblique-texture electron diffraction. Clay Miner. 19, 177–193. doi: 10.1180/claymin.1984.019.2.05
Ufer, K., Kleeberg, R., Bergmann, J., and Dohrmann, R. (2012). Rietveld refinement of disordered illite-smectite mixed-layer structures by a recursive algorithm – II: powder-pattern refinement and quantitative phase analysis. Clays Clay Miner. 60, 535–552. doi: 10.1346/CCMN.2012.0600508
Ufer, K., Roth, G., Kleeberg, R., Stanjek, H., Dohrmann, R., and Bergmann, J. (2004). Description of X-ray powder pattern of turbostratically disordered layer structures with a Rietveld compatible approach. Z. Kristallogr. 219, 519–527. doi: 10.1524/zkri.219.9.519.44039
Ufer, K., Stanjek, H., Roth, G., Kleeberg, R., Dohrmann, R., and Kaufhold, S. (2008). Quantitative phase analysis of bentonites by the Rietveld method. Clays Clay Miner. 56, 272–282. doi: 10.1346/CCMN.2008.0560210
Keywords: nontronites, Rietveld refinement, Cu-triethylenetetramine, crystal structure, X-ray powder diffraction
Citation: Wang X and Liao L (2018) Rietveld Structure Refinement of Cu-Trien Exchanged Nontronites. Front. Chem. 6:558. doi: 10.3389/fchem.2018.00558
Received: 27 July 2018; Accepted: 29 October 2018;
Published: 20 November 2018.
Edited by:
Wenbo Wang, Lanzhou Institute of Chemical Physics (CAS), ChinaReviewed by:
Luyi Sun, University of Connecticut, United StatesJianxi Zhu, Guangzhou Institute of Geochemistry (CAS), China
Yunfei Xi, Queensland University of Technology, Australia
Copyright © 2018 Wang and Liao. This is an open-access article distributed under the terms of the Creative Commons Attribution License (CC BY). The use, distribution or reproduction in other forums is permitted, provided the original author(s) and the copyright owner(s) are credited and that the original publication in this journal is cited, in accordance with accepted academic practice. No use, distribution or reproduction is permitted which does not comply with these terms.
*Correspondence: Libing Liao, Q2xheWxAY3VnYi5lZHUuY24=