 Dong Xu
 Shufang Yu1,2
 Qinlu Lin
 Zhiqin Yuan
- 1National Engineering Laboratory for Rice and By-Products Further Processing, College of Food Science and Engineering, Central South University of Forestry and Technology, Changsha, China
- 2Hunan Key Laboratory of Processed Food for Special Medical Purpose, College of Food Science and Engineering, Central South University of Forestry and Technology, Changsha, China
- 3State Key Laboratory of Chemical Resource Engineering, Beijing University of Chemical Technology, Beijing, China
Reliable and sensitive methods to monitor mercury levels in real samples are highly important for environment protection and human health. Herein, a label-free colorimetric sensor for Hg2+ quantitation using gold nanostar (GNS) has been demonstrated, based on the formation of Au-Hg amalgamate that leads to shape-evolution of the GNS and changes in its absorbance. Addition of ascorbic acid (AA) to GNS solution is important for quantitation of Hg2+, mainly because it can reduce Hg2+ to Hg to enhance amalgamation on the GNSs and stabilize GNSs. In addition to transmission electron microscopy images, the distribution of circular ratios of GNSs in the presence of 2 mM AA and various concentrations of Hg2+ are used to show the morphology changes of the GNSs. Upon increasing the concentration of Hg2+, the average circular ratio of GNSs decreases, proving GNS is approaching to sphere. The morphology change alters the longitudinal localized surface plasmonic resonance (LSPR) absorbance of the GNSs significantly. Under the optimum conditions, our sensor exhibits a dynamic response for Hg2+ in the range of 1–4,000 nM with a detection limit of 0.24 nM. Upon Increasing Hg2+ concentration, the solution color changes from greenish-blue, purple to red, which can be distinguished by the naked eye when the Hg2+ concentration is higher than 250 nM. Owing to having a high surface-to-volume ratio and affinity toward Hg0, the GNS is sensitive and selective (at least 50-fold over tested metal ions like Pb2+) toward Hg2+ in the presence of AA. Practicality of this assay has been validated by the analysis of water samples without conducting tedious sample pretreatment.
Introduction
Mercury has been recognized as one of the most toxic elements. Once taken in by human body, it cannot easily be exerted and accumulates in organs, potentially resulting in serious diseases such as memory loss, kidney damage, and even death at its high content (Boening, 2000; Tchounwou et al., 2003; Baughman, 2006). Because mercury could be released from natural processes (Gustin, 2003; Leopold et al., 2010) and human activities (Streets et al., 2011, 2017; Driscoll et al., 2013) to the ecosystem, its contamination is still a rising global issue. Owing to its high toxicity, the safety contents for mercury in food and environment were set to be extremely low. For example, the maximum allowable levels of mercuric ion (Hg2+) in drinking water are as low as 10 and 30 nM according to the US Environmental Protection Agency (EPA) and the World Health Organization (WHO), respectively. Currently, common methods used for quantitation of Hg2+ include atomic absorption spectrometry (Hatch and Ott, 1968), inductively coupled plasma-mass spectrometry (Wu et al., 2011), and selective cold vapor atomic fluorescence spectrometry (Bendl et al., 2006). These methods involve commercial instruments and are rather complicated, time-consuming, costly, and inappropriate for on-site applications. In the last decade, colorimetric approaches (Du et al., 2013; Chansuvarn et al., 2015; Chen et al., 2015; Xu et al., 2015; Ding et al., 2016) using gold nanomaterials have become an alternative for Hg2+ quantitation due to their characteristics of simplicity, rapidness, selectivity, and sensitivity. In addition, the color change can be observed by the naked eye. Generally, these assays are based on the assembly or disassembly of gold nanoparticles having surface DNA molecules (Lee et al., 2007; Li et al., 2008; Xue et al., 2008), peptides (Si et al., 2007; Du et al., 2011) and organic molecules (Chai et al., 2010; Wang et al., 2018) through their high affinity for Hg2+. However, they are disadvantageous for the quantitation of Hg2+ in most real samples. To begin with, the limits of detection (LOD) of the most reported Hg2+ sensors are higher than 10 nM, limiting their real applications. Secondly, they sometimes do not provide satisfactory selectivity toward Hg2+ over some potential heavy metal ions such as Cu2+ and Cd2+ (Guo et al., 2011; Mehta and Kailasa, 2014; Wang et al., 2018), especially those based on coordination chemistry. Thirdly, stability of the functional gold nanoparticles in high-ionic-strength samples is a concern. Lastly, their functionalization usually involves complex procedures and time consuming. Therefore, developing label-free assays for accurate, selective and reliable mercury quantitation is still a challenging task.
Amalgamation—the reaction of mercury with other metals—is a normal but unique phenomenon in chemistry since mercury has a lower cohesive energy (0.69 eV) than other metals such as Au (3.7 eV) and Ag (2.95 eV). Amalgamation has become interesting in the field of nanotechnology. For example, the formation mechanism of Ag@Hg nanoalloys was investigated by monitoring in situ the growth of single silver nanoparticles with different shapes under a dark-field microscope (Liu and Huang, 2013). It has been confirmed that in the amalgamation process, mercury atoms are adsorbed onto the nanoparticle surfaces first, and then diffuse to interact with the silver atoms to form sphere nanoalloys. The process of slow diffusion of mercury into nanoparticles lattice was also evident in the formation of Au@Hg nanoalloys through transmission electron microscopy and high-angle annular dark field scanning transmission electron microscopy measurements, which was further supported with computer simulations (Mertens et al., 2011). The dynamic processes of amalgamation between gold nanorods and mercury atoms were investigated by conducting single nanoparticle spectroscopy and spectroelectrochemistry, revealing amalgam formation and consequent shape transformation from nanorods to spherical particles (Schopf et al., 2016). All of the results suggest that amalgamation can lead to shape-evolution of nanoparticle and nanoalloy formation, altering their localized surface plasmonic resonance. Accordingly, several selective assays toward Hg2+ ion detection using gold nanoparticles (Qi et al., 2012; Chaudhary et al., 2015; Park et al., 2016) and gold nanorods (Jin and Han, 2014; Schopf et al., 2017) have been developed based on nanoalloy formation. But, the sensitivity is not satisfied for real sample testings.
Gold nanostar (GNS) possesses unique physical and chemical properties originating from its branched nanostructures (Hao et al., 2004; Aad et al., 2011), which has become one of interesting gold nanomaterials and has been used in various fields such as surface-enhanced Raman scattering (Hrelescu et al., 2009; Esenturk and Walker, 2010), catalysis (Miao et al., 2011; Zhou et al., 2011; Yang et al., 2018) and biomedicine (Rodrĩguez-Oliveros and Sánchez-Gil, 2012; Wang et al., 2015). There are two plasmonic resonance modes for GNS–the longitudinal localized surface plasmonic resonance (LSPR) originating from its branches and the transverse localized surface plasmonic resonance (TSPR) depending on its core size. GNS with high yield could be readily and repeatedly prepared by using 4-(2-hydroxyethyl)-1-piperazineethanesulfonic acid (HEPES) as reducing, stabilizing and shape-directing agents. The LSPR of GNS can be readily tuned from the visible to the near infrared region by changing its shape, number density and length of its branches through altering the dosage of reagents (Hao et al., 2007; Liu et al., 2014). Because of its irregular structure and large surface-to-volume ratio, GNS has unique optical properties such as strong light scattering and extinction (de Puig et al., 2015). The incident electromagnetic radiation of GNS is prone to penetration to its protruding tips, allowing more efficient heat generation, and thus it is more suitable for photothermal therapy than gold nanorod (Rodrĩguez-Oliveros and Sánchez-Gil, 2012). The distinctive morphology of GNS governs the arrangement of atoms on its surface to form different types of facets, creating higher surface energy and greater catalytic activity (Zhou et al., 2011). More importantly, the sharp edges and tips provide GNS with a greater sensitivity toward local changes in the dielectric environment (Dondapati et al., 2010; Jana et al., 2015) as well as a large electric field enhancement (Esenturk and Walker, 2010; Liu et al., 2014), which make GNS as a good candidate for optical sensing applications. For example, surface-enhanced Raman scattering (SERS) signal of 4-mercaptobenzoic acid on a single GNS was detected without the need of forming hotspot through aggregation (Hrelescu et al., 2009). Through Hg2+ induced the formation of DNA capped-GNS dimer, SERS allows quantitation of Hg2+ in the linear ranges of 0.002–1 ng/mL. Among various shapes of gold nanomaterials, GNS is one of the most sensitive materials to the environmental change. GNS provides a refractive index sensitivity of 703 nm/RIU while that is only 44 nm/RIU for sphere gold nanoparticle (Chen et al., 2008). Streptavidin at the concentration of as lows as 0.1 nM led to an LSPR shift of 2.3 nm when using GNS (Dondapati et al., 2010). Nevertheless, its application in the convenient colorimetric assay for quantitation of mercury has not been reported.
In the present study, we propose a label-free, sensitive and selective method for Hg2+ detection by using GNS as a probe. The sensing principle is based on the LSPR change of GNS through mercury induced transformation of its morphology. A new term, namely, circular ratio that is highly related to the shape evolution of GNS in the presence of Hg2+ was used to evaluate the morphology change of GNSs. Transmission electron microscopy (TEM) images of GNSs at different Hg2+ concentrations were recorded to support our results. Because GNS has a high surface-to-volume ratio and forms amalgamate with mercury, it allows efficient capture of mercury. Correspondingly, our strategy for Hg2+ detection through UV-Vis spectroscopy measurement is very sensitive and the solution color change can be observed easily by the naked eye. The prominent sensitivity and selectivity of our assays facilitate their applications in the analysis of real samples.
Methods
Materials, Reagents, and Instruments
Hydrogen tetrachloroaurate(III) trihydrate (HAuCl4·3H2O). Ascorbic acid (AA, 99%) and HEPES were brought from Sigma-Aldrich (Milwaukee, WI, USA). Barium chloride (BaCl2), calcium chloride (CaCl2), cobalt sulfate heptahydrate (CoSO4·7H2O), copper sulfate pentahydrate (CuSO4·5H2O), hydrochloric acid (HCl, 36%), lead nitrate (Pb(NO3)2), manganese sulfate (MnSO4), mercuric nitrate (Hg(NO3)2), nitric acid (HNO3), potassium chloride (KCl), silver nitrate (AgNO3), sodium chloride (NaCl), sodium hydroxide, Tween 20 and zinc acetate dihydrate (C4H6O4Zn·2H2O) were purchased from Sinophorarm Chemical Reagent Corporation (Shanghai, China). Cr standard solution (1,000 μg/mL, Cr(NO3)3, GSB 04-1723) was obtained from National Center of Analysis and Testing for Non-ferrous Metals and Electronic Materials (Beijing, China). UV–Vis absorption spectra were recorded on a Shimadzu UV-1800 Spectrometer (Tokyo, Japan). The photos of GNS solution was taken by using an Iphone6 smartphone. Ultrapure water with an electric resistance of 18.2 MΩ was supplied with a Milli-Q water purification system (Billerica, MA, USA). Morphology characterization of GNSs was performed using a transmission electron microscope (TEM; JEM 1230, JEOL, Tokyo, Japan). All glassware used in the experiments was washed with aqua regia (HCl:HNO3 = 3:1 by volume) and rinsed with ultrapure water.
GNS Synthesis
GNSs were prepared using a similar procedure according to the literature (Xie et al., 2007). The method was very convenient and only HAuCl4 and HEPES were used, where HEPES serves as both a reducing agent and a soft template for structure formation. Typically, 20 mL of 0.1 M HEPES aqueous solution at pH 7.4 was mixed with 79 mL of ultrapure water in 100-mL volumetric flask, 823 μL of 24.28 mM HAuCl4 was then added to the mixture drop by drop, and finally ultrapure water was added to the mark. Next, the solution was kept undisturbed at room temperature for 30 min. The solution color varied from light yellow to mauve to greenish-blue, indicating the formation of nanoparticles. Accordingly, GNSs with various LSPR bands were obtained by varying the concentration of HEPES buffer (Xie et al., 2007; Dam et al., 2012; Liu et al., 2014). Finally, 90 μl of Tween-20 was added to 100 mL GNS solutions to stabilize the GNS and to reduce their adsorption onto the container surfaces, which were further stored at 4°C.
Hg2+ Detection
A stock solution of Hg(NO3)2 (1,000 g/L) was prepared for preparation of standard solutions through a serial dilution. To optimize the sensitivity and selectivity of our assay for Hg2+ detection, the solution pH value, incubation time, the LSPR of GNS and the AA content were optimized preliminarily. For the detection of Hg2+, 1.568 mL GNS solution (pH 5.0) and 32 μL of 0.1 M AA were added into a 2-mL centrifuge tube. After gentle shaking, aliquots (320 μL) of Hg2+ solution (ultimate concentrations: 0, 1, 5, 10, 50, 100, 250, 500, 1,000, 2,000, and 4,000 nM) were injected separately into each tube. After mixing and placing at room temperature for 150 min, the photos and UV-Vis spectra of the solutions were taken. To investigate the selectivity of our assay toward Hg2+, the above procedure was repeated, but Hg2+ was replaced with 100 μM of other metal ions, including Cu2+, Na+, K+, Ca2+, Mn2+, Pb2+, Co2+, Zn2+, Ba2+, and Cr3+. All the experiments are repeated three times.
Analysis of Real Samples
Tap and pond water samples were collected from the campus of Central South University of Forestry and Technology. River water was collected from Xiang River (Changsha, Hunan). Before the analyses, each of the water samples was filtered through a 0.2-μm membrane. The spiked water samples were made by the addition of the standard Hg2+ solution to certain concentrations. All the water samples were mixed separately with 1.568 mL GNS solution (pH 5.0) and 32 μL of 0.1 M AA for analysis.
Results and Discussion
Response of GNS Toward Hg2+ in the Presence of AA
A typical GNS solution was prepared from HAuCl4 in the presence of 75 mM HEPES (pH 7.35), showing two absorption peaks at 520 and 690 nm that are assigned to the TSPR and LSPR bands of the GNS, respectively (spectrum a in Figure 1A). The solution color is greenish-blue as shown in photo (a) (Figure 1B). GNS was proven to have excellent response toward Hg2+ in the presence of AA (Figures 1A,B). The addition of AA is important because it allows reduction of Hg2+ to Hg0 that subsequently undergoes amalgamation with the GNS. The introduction of AA (final concentration 2 mM) to GNS solution did not induce any significant change in the UV-Vis absorption spectrum of GNS. With increasing the concentration of Hg2+, the absorption spectrum of GNS changes more significantly. In the presence of 2 mM AA and 4 μM Hg2+, the LSPR absorbance decreases from 1.15 to 1.08, accompanied with a blue shift from 690 to 672 nm. In contrast, in the absence of 2 mM AA, addition of 4 μM Hg2+ to GNS solution only caused a small decrease in the LSPR absorbance, with a blue shift of 10 nm in the LSPR. The blue shift is mainly because of adsorption of Hg2+ onto GNS surfaces that alters the surrounding dielectric constant (Ojea-Jiménez et al., 2012). When the concentration of Hg2+ is 8 μM in the presence of 2 mM AA, a single UV-Vis absorption peak at 520 nm was observed. Correspondingly, the solution color turned to red from greenish blue, indicating that the GNS transformed to form a spherical structure. The TEM images displayed in Figure 1C clearly show different morphologies of the nanoparticles under different conditions. The left TEM image supports the formation of GNSs, which possess various number of corners and tips. The GNSs with an average size of 28 nm contain 2–5 branches (Figure 1C). Besides GNSs, some spherical gold nanoparticles are existent in the presence of 4 μM Hg2+ as shown in the middle TEM image. Only spherical gold nanoparticles are existent in the presence of 8 μM Hg2+ as shown in the right TEM image. The TEM images support Hg inducing morphology changes in the GNSs, leading to changes in their absorption spectra. Similar changes of non-sphere nanomaterials to sphere nanoparticles have been reported (Rex et al., 2006; Schopf et al., 2017). We note that an excess amount of AA relate to Hg2+ in the solution is required for complete reduction of Hg2+ to Hg0, leading to greater shape evolution of GNS. For the purpose of evaluating shape transformation numerically, we introduced a new parameter—circular ratio (C). C can be calculated using Equation (1).
where P is perimeter of each nanoparticle and A represents the area of the nanoparticle. Both P and A can be automatically acquired from the TEM images (Figure 1C) using the software ImageJ. In brief, after opening a TEM image and setting a threshold value to separate object and background, P and A of each GNS were calculated automatically. For a nanoparticle with a constant area, its P increases as its morphology becomes more irregular. In other words, the larger the C value is, the more irregular nanoparticles are. When the nanoparticles are perfect spheres, C is the smallest (4π) among all shapes. Thus, the shape transformation of GNSs can be evaluated quantitatively. In the reported methods, the shapes of GNSs were described by their length and number of branches, spherical core diameter, branch base width and overall size (Khoury and Vodinh, 2008; Senthil Kumar et al., 2008). Although they can describe roughness and morphology change of GNS to a certain degree during amalgamation, they are inconvenient and not accurate to show shape evolution of nanoparticles. The statistical results (Figure 1D) display that C value has a wide distribution in the absence of Hg2+. Upon increasing Hg2+ concentration, the distribution of C value becomes narrower. For example, the half-peak widths of the fitting Gauss curves in the absence and presence of 4 μM Hg2+ are 7.4 and 1.9, respectively. The C values for GNS at the Hg2+ concentration of 0, 4, and 8 μM are 18.22, 14.68, and 13.32, respectively. The results support Hg induced shape evolution of GNS. Based on the results, we propose a sensing route of our methodology as illustrated in Figure 2. When using GNS in the presence of AA, the concentration of Hg2+ can be easily monitored through the change of its absorption spectrum as a result of the morphology change of GNS due to formation of Au/Hg amalgams. When compared to the TSPR band, the LSPR is more susceptible to the shape evolution of GNSs induced by Hg2+.
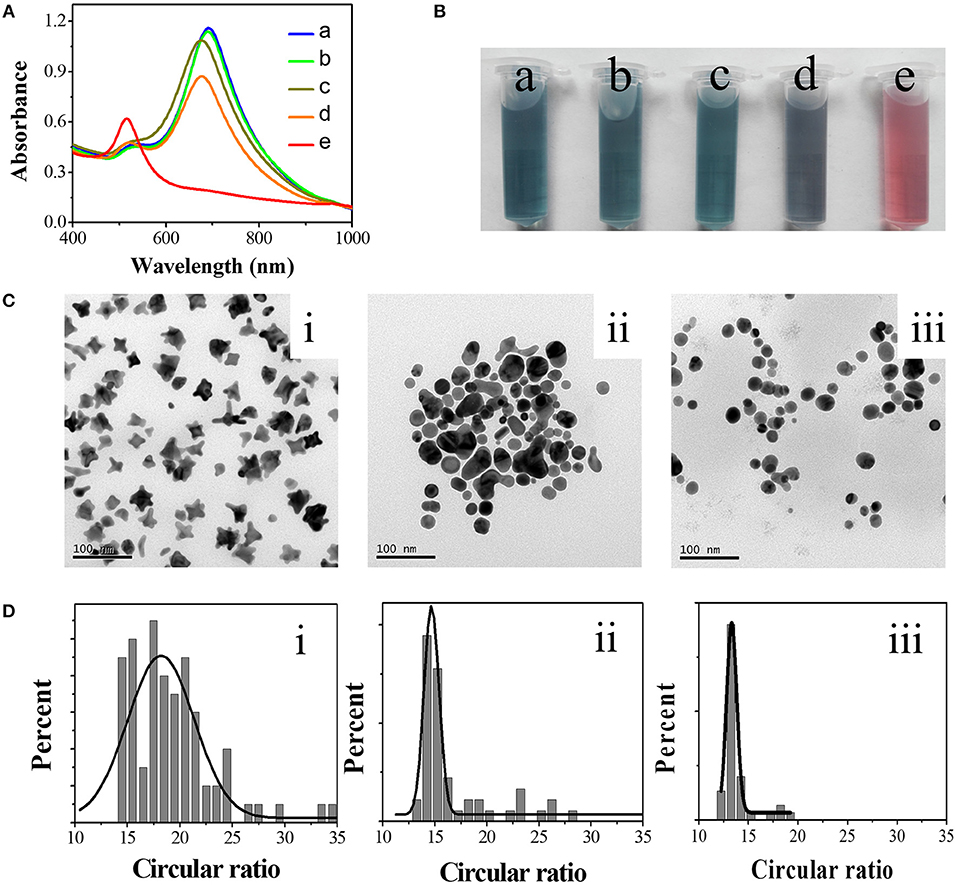
Figure 1. Response of GNS toward Hg2+ in the presence of AA. UV-Vis spectra (A) and photos (B) of solutions containing GNS (a), GNS + 2 mM AA (b), GNS + 4 μM Hg2+ (c), GNS + 2 mM AA + 4 μM Hg2+ (d), GNS + 2 mM AA + 8 μM Hg2+ (e). TEM images (C) and the statistical circular ratios (D) of the as-formed nanoparticles in the presence of 2 mM AA and 0 (i), 4 (ii), and 8 (iii) μM Hg2+, respectively. GNS was prepared in the presence of 75 mM HEPES.
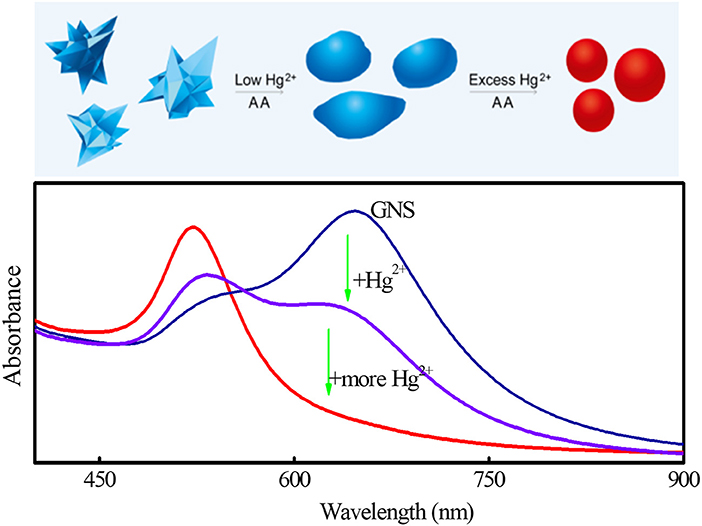
Figure 2. Scheme of sensing of Hg2+ through its inducing morphological transformation of GNS, leading to changes in the absorption spectra of GNS.
Optimization of Experimental Conditions for Hg2+ Sensing
To achieve high sensitivity, the LSPR of GNS, AA concentration, solution pH and the incubation time were systematically tested as shown in Figure 3. To minimize the effects of concentration and structure variation of GNS on quantitation, ΔA/A0, not ΔA, was applied to evaluate the spectra changes under various conditions in this study, where A0, is the maximum absorbance at the LSPR of GNS in the absence of Hg2+ and ΔA is the absorbance difference at the LSPR after addition of Hg2+. Firstly, GNSs with various structures were prepared in the presence of different concentrations of HEPES (Figure 3A) (Xie et al., 2007; Dam et al., 2012; Liu et al., 2014). By increasing HEPES concentration from 25 to 200 mM meanwhile keeping other parameters constant, GNSs with various LSPR wavelengths (580–730 nm) were prepared. The absorbance values at their corresponding LSPR wavelength increase upon increasing HEPES concentration and reach a maximum at 100 mM, with absorbance of 0.95 at 704 nm. Similar trend has also been reproted (de Puig et al., 2015; Chandra et al., 2016), where the role of HEPES was to reduce Au3+ and direct GNS growth, and the increase of HEPES concentration in synthesis procedure could result in longer branches. When the HEPES concentration is lower than 25 mM, no GNS was formed, with a support of no TSPR band. When using the GNS with an LSPR band at 656 nm, 4 μM Hg2+ induces a maximum ΔA/A0 change. A smaller change in ΔA/A0 was obtained when using GNSs with the LSPR wavelength longer than 656 nm, because they usually have longer branches (de Puig et al., 2015) that need greater amount of mercury to induce their structural change to form a spherical shape. HEPES itself has no apparent impact on Hg2+ determination, because GNS treated with centrifugation or adding more HEPES have almost the same response. The approximate concentration of GNS in testing solution is 0.23 nM, calculated by the total amount of HAuCl4 and the size of GNS obtained under TEM images. Secondly, the AA concentrations in the range of 0–5 mM were investigated, while keeping other conditions constant. As Figure 3B illustrates, increasing AA concentration leads to greater Hg2+ induced changes in the LSPR absorbance. When the concentration of AA is higher than 1.68 mM, the LSPR did not change further, mainly because Hg2+ ions were reduced completely by AA. Thirdly, the solution pH values from 4.0 to 9.0 were tested for Hg2+ sensing (Figure 3C and Figure S1), revealing that pH 5.0 is optimal. At pH < 5.0, GNS becomes unstable, while at higher pH values, formation of mercuric hydroxides is problematic. Finally, reaction time of 150 min was selected as shown in Figure 3D and Figure S2. Based on the above results, the optimal analytical conditions for quantitation of Hg2+ are GNS prepared in the presence of 50 mM HEPES, 1.68 mM AA, pH 5.0 and reaction time of 150 min.
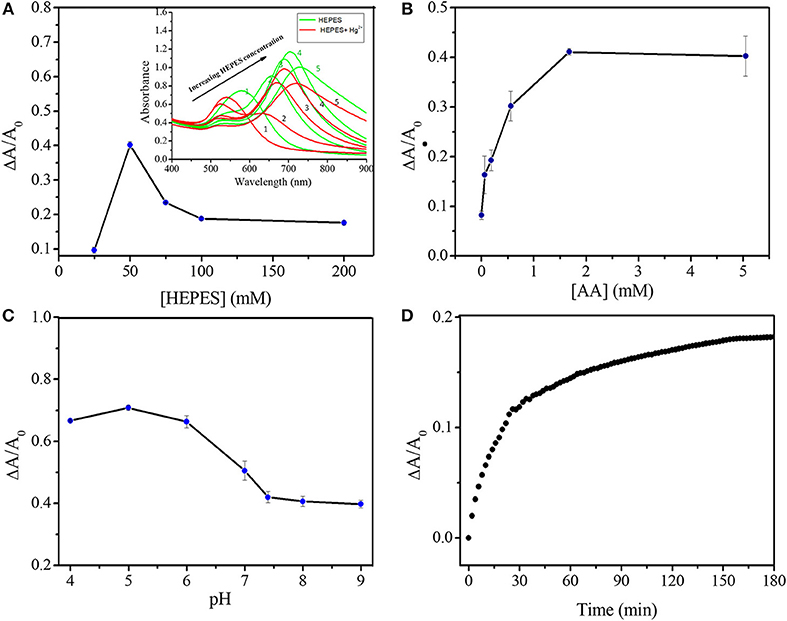
Figure 3. Optimization of experimental conditions on Hg2+ sensing. (A) ΔA/A0 of GNS solutions (pH 7.35) in the presence of 2 mM AA and 4 μM Hg2+ with incubation time of 102 min. Inset to A is the corresponding UV-Vis spectra of GNS solutions before (in red lines) and after (in blue lines) the addition of mercuric ions. The LSPR of GNS varies by increasing HEPES concentration (1–5 are corresponding to HEPES concentrations of 25, 50, 75, 100, and 200 mM, respectively). (B) Effect of AA concentration on ΔA/A0 of GNS solutions (pH 7.35) containing 4 μM Hg2+. (C) Effect of solution pH on the ΔA/A0 variation in the presence of 1.68 mM AA and 4 μM Hg2+. (D) Effect of reaction time on ΔA/A0 of GNS solutions (pH 5.0) in the presence of 1.68 mM AA and 1 μM Hg2+. GNS used in B-D were prepared in the presence of 50 mM HEPES.
Sensitivity and Selectivity
To evaluate the sensitivity of our assay, the UV-Vis spectra of GNS solutions after the addition of different concentrations (1–4,000 nM) of Hg2+ solutions were taken. As Figure 4 shows, under the optimal conditions, increasing Hg2+ concentration (0, 1, 5, 10, 50, 100, 250, 500, 1,000, 2,000, and 4,000 nM) results in decreasing the LSPR absorbance and inducing greater blue shift of the LSPR. The solution color gradually changed from greenish-blue to red, due to the transformation of GNSs to spherical nanoparticles. The color change can be easily observed by the naked eye when Hg2+ concentration is above 250 nM. A linear relationship between ΔA/A0 and Hg2+ concentration was established (ΔA/A0 = 0.01858 CHg2+ + 0.00018) with a coefficient of 0.997. The detection upper limit of our assay is 4,000 nM and the limit of detection (LOD) is 0.24 nM calculated by 3σ, which is lower than the values set by both EPA and WHO standards. When compared to the probe using gold nanorods, our assay is more sensitive for quantitation of Hg2+ as shown in Figure S3. We note that the sides of gold nanorod are capped with CTAB molecules, limiting the deposition of Hg (Hg2+) onto most of their surfaces. Some Hg (Hg2+) can only be deposited onto their two ends, leading to a slightly higher aspect ratio and insignificant changes in their LSTR absorbance. For example, addition of Hg2+ at 10,000 nM to gold nanorods solution under the same conditions only leads to a very small change in the LSPR absorbance (0.13) at 653 nm. When compared to other shaped nanomaterials toward Hg2+, GNS provides higher sensitivity due to its greater surface area. More importantly, the LSPR absorbance of GNS is highly sensitive to the change in its morphology. As a result, our method over most of the existing colorimetric methods (Lee et al., 2007; Li et al., 2008; Xue et al., 2008; Chai et al., 2010; Du et al., 2011) is more sensitive for Hg2+ quantitation, also see Table S1. Unlike most reported nanoparticle based approaches that are dependent on aggregation or disaggregation, our assay is based on Hg2+ induced morphological transformation of GNS. In addition, our assay is more sensitive than atomic absorption spectroscopy (Hatch and Ott, 1968) and fluorescence methods (Chen et al., 2015).
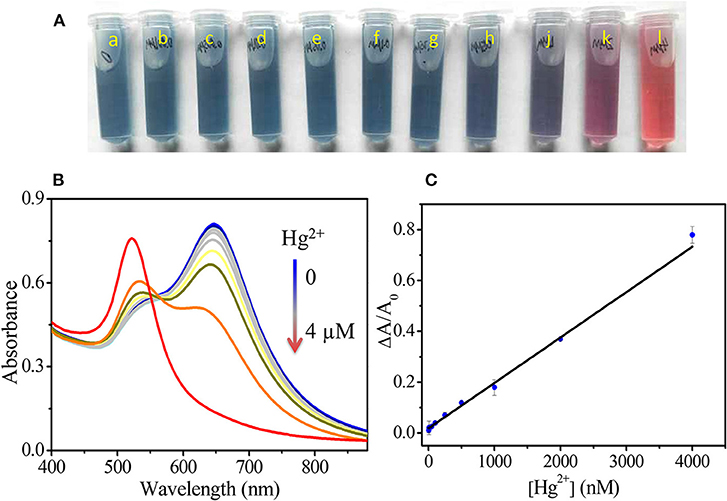
Figure 4. Photos (A) and UV-Vis spectra (B) of GNS solutions after addition of different amounts of Hg2+. a–j in A are corresponding to 0, 1, 5, 10, 50, 100, 250, 500, 1,000, 2,000 and 4,000 nM Hg2+, respectively. (C) A plot of ΔA/A0 vs. Hg2+ concentration. The fitting linear equation is ΔA/A0 = 0.01858 CHg2+ + 0.00018.
Our assay also has excellent selectivity toward Hg2+ (2 μM) over the tested metal ions (100 μM), including Cu2+, Na+, K+, Ca2+, Mn2+, Pb2+, Co2+, Zn2+, Ba2+, and Cr3+, as shown in Figure 5. The ability of metal to form alloys with mercury is related to its solubility in mercury. In general, metals with similar property and near in the Periodic Table have higher solubility (Gumiński, 2015). Thus, when compared to other metals, Au forms alloys with Hg more strongly. In addition, AA cannot reduce most of the tested metal ions at pH 5.0, but can form complexes with some of them to further minimize their interactions with the GNSs (Martell, 1982). The role of AA in stabilizing the GNS to minimize the salt inducing aggregation of GNSs is also evident.
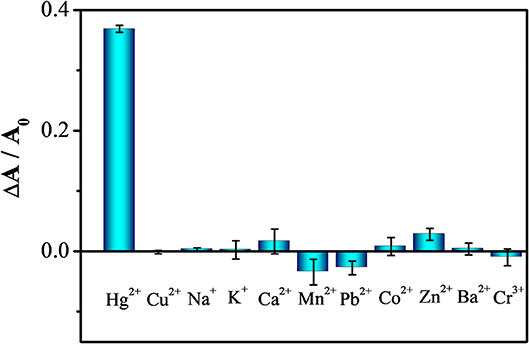
Figure 5. Selectivity of GNS toward 2 μM Hg2+ over 100 μ M of other metal ions, including Cu2+, Na+, K+, Ca2+, Mn2+, Pb2+, Co2+, Zn2+, Ba2+ and Cr3+.
Mercury Quantitation in Real Samples
Having such a high sensitivity, selectivity, and stability in high-ionic-strength solution, our assay is expected to be suitable for Hg2+ quantitation in real samples. To validate our assay for real applications, Hg2+ spiked tap, pond, and river water samples were analyzed, with results listed in Table 1. The Hg2+ concentrations in the three samples (each with three measurements) were found to be 0.29 (±0.03), 0.62 (±0.03) and 0.71 (±0.06) nM, respectively. Their concentrations are all below the allowable standards of EPA and WHO. The recoveries of Hg2+ in the spiked samples are satisfactory, showing the potential of this assay for Hg2+ quantitation in real samples.
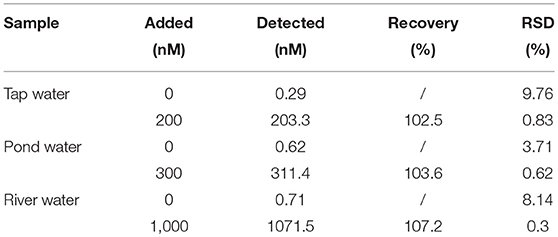
Table 1. Quantitationof Hg2+ in water samples (n = 3).
Conclusion
A highly sensitive methodology for mercury quantitation using GNS probe was proposed. The assay is based on the formation of Au-Hg amalgamates on GNSs in the presence of AA, leading to significant changes in their LSPR absorbance. With very high sensitivity of the LSPR absorbance of GNS to its morphology changes and specificity of GNS toward Hg, our assay is highly sensitive (LOD 0.24 nM) and selective for Hg2+ quantitation. In this study, we also found that AA plays several important roles, acting as a reducing agent to reduce Hg2+, a capping agent to stabilize the GNS, and a complexing agent to form complexes with the potential interfering species. Using the average circular ratio of GNSs, the Hg induced morphological transformation of GNSs can be described easily. Based on the fact that the assay is sensitive and selective for Hg2+ quantitation, we can foresee its application for quantitation of toxic organic mercury species.
Author Contributions
DX and QL designed the work and were part of the manuscript write-up. DX, SY, YY, and SW carried out the experiments, interpreted some of the results and were also involved in the manuscript preparation. ZY revised and edited the manuscript. All the authors reviewed the manuscript and have agreed to its publication.
Funding
This study was financially supported by National Natural Science Foundation of China (No.21505162, 31571874, 81501619), Scientific Research Project of Hunan Provincial Education Department (No.17A228), the Natural Science Foundation of Hunan Province (2016JJ3183), Fund of Hunan Provincial Education Department (No. 16C1654) and Training Program for Excellent Young Innovators of Changsha (kq1707020).
Conflict of Interest Statement
The authors declare that the research was conducted in the absence of any commercial or financial relationships that could be construed as a potential conflict of interest.
Supplementary Material
The Supplementary Material for this article can be found online at: https://www.frontiersin.org/articles/10.3389/fchem.2018.00566/full#supplementary-material
References
Aad, G., Abbott, B., Abdallah, J., Abdelalim, A. A., Abdesselam, A., Abdinov, O., et al. (2011). Nanostars shine bright for you: colloidal synthesis, properties and applications of branched metallic nanoparticles. Curr. Opin. Colloid Inter. Sci. 16, 118–127. doi: 10.1016/j.cocis.2010.12.007
Baughman, T. A. (2006). Elemental mercury spills. Environ. Health Perspect. 114, 147–152. doi: 10.1289/ehp.7048
Bendl, R. F., Madden, J. T., Regan, A. L., and Fitzgerald, N. (2006). Mercury determination by cold vapor atomic absorption spectrometry utilizing UV photoreduction. Talanta 68, 1366–1370. doi: 10.1016/j.talanta.2005.07.061
Boening, D. W. (2000). Ecological effects, transport, and fate of mercury: a general review. Chemosphere 40, 1335–1351. doi: 10.1016/S0045-6535(99)00283-0
Chai, F., Wang, C., Wang, T., Ma, Z., and Su, Z. (2010). L-cysteine functionalized gold nanoparticles for the colorimetric detection of Hg2+ induced by ultraviolet light. Nanotechnology 21:025501. doi: 10.1088/0957-4484/21/2/025501
Chandra, K., Culver, K. S. B., Werner, S. E., Lee, R. C., and Odom, T. W. (2016). Manipulating the anisotropic structure of gold nanostars using good's buffers. Chem. Mater. 28, 6763–6769. doi: 10.1021/acs.chemmater.6b03242
Chansuvarn, W., Tuntulani, T., and Imyim, A. (2015). Colorimetric detection of mercury(II) based on gold nanoparticles, fluorescent gold nanoclusters and other gold-based nanomaterials. Trends Anal. Chem. 65, 83–96. doi: 10.1016/j.trac.2014.10.013
Chaudhary, J. P., Kumar, A., Paul, P., and Meena, R. (2015). Carboxymethylagarose-AuNPs generated through green route for selective detection of Hg2+ in aqueous medium with a blue shift. Carbohydr. Polym. 117, 537–542. doi: 10.1016/j.carbpol.2014.10.016
Chen, G., Guo, Z., Zeng, G., and Tang, L. (2015). Fluorescent and colorimetric sensors for environmental mercury detection. Analyst 140, 5400–5443. doi: 10.1039/C5AN00389J
Chen, H., Kou, X., Yang, Z., Ni, W., and Wang, J. (2008). Shape- and size-dependent refractive index sensitivity of gold nanoparticles. Langmuir 24, 5233–5237. doi: 10.1021/la800305j
Dam, D. H., Lee, J. H., Sisco, P. N., Co, D. T., Zhang, M., Wasielewski, M. R., et al. (2012). Direct observation of nanoparticle-cancer cell nucleus interactions. ACS Nano 6, 3318–3326. doi: 10.1021/nn300296p
de Puig, H., Tam, J. O., Yen, C. W., Gehrke, L., and Hamad-Schifferli, K. (2015). Extinction coefficient of gold nanostars. J. Phys. Chem. C 119, 17408–17415. doi: 10.1021/acs.jpcc.5b03624
Ding, Y., Wang, S., Li, J., and Chen, L. (2016). Nanomaterial-based optical sensors for mercury ions. Trends Anal. Chem. 82, 175–190. doi: 10.1016/j.trac.2016.05.015
Dondapati, S. K., Sau, T. K., Hrelescu, C., Klar, T. A., Stefani, F. D., and Feldmann, J. (2010). Label-free biosensing based on single gold nanostars as plasmonic transducers. ACS Nano 4, 6318–6322. doi: 10.1021/nn100760f
Driscoll, C. T., Mason, R. P., Chan, H. M., Jacob, D. J., and Pirrone, N. (2013). Mercury as a global pollutant: sources, pathways, and effects. Environ. Sci. Technol. 47, 4967–4983. doi: 10.1021/es305071v
Du, J., Jiang, L., Shao, Q., Liu, X., Marks, R. S., Ma, J., et al. (2013). Colorimetric detection of mercury ions based on plasmonic nanoparticles. Small 9, 1467–1481. doi: 10.1002/smll.201200811
Du, J., Sun, Y., Jiang, L., Cao, X., Qi, D., Yin, S., et al. (2011). Flexible colorimetric detection of mercuric ion by simply mixing nanoparticles and oligopeptides. Small 7, 1407–1411. doi: 10.1002/smll.201002270
Esenturk, E. N., and Walker, A. R. H. (2010). Surface-enhanced raman scattering spectroscopy via gold nanostars. J. Raman Spectrosc. 40, 86–91. doi: 10.1002/jrs.2084
Gumiński, C. (2015). Solubility and the periodic table of elements. Pure Appl. Chem. 87, 477–485. doi: 10.1515/pac-2014-0935
Guo, Y., Wang, Z., Qu, W., Shao, H., and Jiang, X. (2011). Colorimetric detection of mercury, lead and copper ions simultaneously using protein-functionalized gold nanoparticles. Biosens. Bioelectron. 26, 4064–4069. doi: 10.1016/j.bios.2011.03.033
Gustin, M. S. (2003). Are mercury emissions from geologic sources significant? a status report. Sci. Total Environ. 304, 153–167. doi: 10.1016/S0048-9697(02)00565-X
Hao, E., Bailey, R. C., Schatz, G. C., And, J. T. H., and Li, S. (2004). Synthesis and optical properties of “branched” gold nanocrystals. Nano Lett. 4, 327–330. doi: 10.1021/nl0351542
Hao, F., Nehl, C. L., Hafner, J. H., and Nordlander, P. (2007). Plasmon resonances of a gold nanostar. Nano Lett. 7, 729–732. doi: 10.1021/nl062969c
Hatch, W. R., and Ott, W. L. (1968). Determination of submicrogram quantities of mercury by atomic absorption spectrophotometry. Anal. Chem. 40, 2085–2087. doi: 10.1021/ac50158a025
Hrelescu, C., Sau, T. K., Rogach, A. L., Jäckel, F., and Feldmann, J. (2009). Single gold nanostars enhance Raman scattering. Appl. Phys. Lett. 94:153113. doi: 10.1063/1.3119642
Jana, D., Matti, C., He, J., and Sagle, L. (2015). Capping agent-free gold nanostars show greatly increased versatility and sensitivity for biosensing. Anal. Chem. 87, 3964–3972. doi: 10.1021/acs.analchem.5b00014
Jin, L.-H., and Han, C.-S. (2014). Eco-friendly colorimetric detection of mercury(II) ions using label-free anisotropic nanogolds in ascorbic acid solution. Sensor. Actuat. B Chem. 195, 239–245. doi: 10.1016/j.snb.2014.01.020
Khoury, C. G., and Vodinh, T. (2008). Gold nanostars for surface-enhanced raman scattering: synthesis, characterization and optimization. J. Phys. Chem. C 112, 18849–18859. doi: 10.1021/jp8054747
Lee, J. S., Han, M. S., and Mirkin, C. A. (2007). Colorimetric detection of mercuric ion (Hg2+) in aqueous media using DNA-functionalized gold nanoparticles. Angew. Chem. 119, 4171–4174. doi: 10.1002/ange.200700269
Leopold, K., Foulkes, M., and Worsfold, P. (2010). Methods for the determination and speciation of mercury in natural waters–a review. Anal. Chim. Acta 663, 127–138. doi: 10.1016/j.aca.2010.01.048
Li, D., Wieckowska, A., and Willner, I. (2008). Optical analysis of Hg2+ ions by oligonucleotide-gold-nanoparticle hybrids and DNA-based machines. Angew. Chem. 47, 3927–3931. doi: 10.1002/anie.200705991
Liu, X.-L., Wang, J.-H., Liang, S., Yang, D.-J., Nan, F., Ding, S.-J., et al. (2014). Tuning plasmon resonance of gold nanostars for enhancements of nonlinear optical response and Raman scattering. J. Phys. Chem. C 118, 9659–9664. doi: 10.1021/jp500638u
Liu, Y., and Huang, C. Z. (2013). Real-time dark-field scattering microscopic monitoring of the in situ growth of single Ag@Hg nanoalloys. ACS Nano 7, 11026–11034. doi: 10.1021/nn404694e
Martell, A. E. (1982). “Chelates of ascorbic acid,” in ascorbic acid: chemistry, metabolism, and uses. Adv. Chem. 200, 153–178. doi: 10.1021/ba-1982-0200.ch007
Mehta, V., and Kailasa, S. (2014). Malonamide dithiocarbamate functionalized gold nanoparticles for colorimetric sensing of Cu2+ and Hg2+ ions. RSC Adv. 5, 4245–4255. doi: 10.1039/C4RA11640B
Mertens, S. F., Gara, M., Sologubenko, A. S., Mayer, J., Szidat, S., Krämer, K. W., et al. (2011). Au@ Hg nanoalloy formation through direct amalgamation: structural, spectroscopic, and computational evidence for slow nanoscale diffusion. Adv. Funct. Mater. 21, 3259–3267. doi: 10.1002/adfm.201100409
Miao, X., Wang, T., Chai, F., Zhang, X., Wang, C., and Sun, W. (2011). A facile synthetic route for the preparation of gold nanostars with magnetic cores and their reusable nanohybrid catalytic properties. Nanoscale 3, 1189–1194. doi: 10.1039/c0nr00704h
Ojea-Jiménez, I., López, X., Arbiol, J., and Puntes, V. (2012). Citrate-coated gold nanoparticles as smart scavengers for mercury(ii) removal from polluted waters. ACS Nano 6, 2253–2260. doi: 10.1021/nn204313a
Park, J.-H., Byun, J.-Y., Yim, S.-Y., and Kim, M.-G. (2016). A Localized Surface Plasmon Resonance (LSPR)-based, simple, receptor-free and regeneratable Hg2+ detection system. J. Hazard. Mater. 307, 137–144. doi: 10.1016/j.jhazmat.2015.12.040
Qi, W. J., Wang, Y., Wang, J., and Huang, C. Z. (2012). Light scattering investigations on mercury ion induced amalgamation of gold nanoparticles in aqueous medium. Sci. Chi. Chem. 55, 1445–1450. doi: 10.1007/s11426-012-4494-0
Rex, M., Hernandez, F. E., and Campiglia, A. D. (2006). Pushing the limits of mercury sensors with gold nanorods. Anal. Chem. 78, 445–451. doi: 10.1021/ac051166r
Rodrĩguez-Oliveros, R., and Sánchez-Gil, J. A. (2012). Gold nanostars as thermoplasmonic nanoparticles for optical heating. Opt. Exp. 20, 621–626. doi: 10.1364/OE.20.000621
Schopf, C., Martín, A., and Iacopino, D. (2017). Plasmonic detection of mercury via amalgam formation on surface-immobilized single Au nanorods. Sci. Technol. Adv. Mat. 18, 60–67. doi: 10.1080/14686996.2016.1258293
Schopf, C., Wahl, A., Martin, A., O'riordan, A., and Iacopino, D. (2016). Direct observation of mercury amalgamation on individual gold nanorods using spectroelectrochemistry. J. Phys. Chem. C 120, 19295–19301. doi: 10.1021/acs.jpcc.6b04668
Senthil Kumar, K. P., Pastoriza-Santos, I., Rodríguez-González, B., Javier García de Abajo, F., and Liz-Marzán, L. M. (2008). High-yield synthesis and optical response of gold nanostars. Nanotechnology 19:015606. doi: 10.1088/0957-4484/19/01/015606
Si, S., Kotal, A., and Mandal, T. K. (2007). One-dimensional assembly of peptide-functionalized gold nanoparticles: an approach toward mercury ion sensing. J. Phys. Chem. C 111, 1248–1255. doi: 10.1021/jp066303i
Streets, D. G., Devane, M. K., Lu, Z., Bond, T. C., Sunderland, E. M., and Jacob, D. J. (2011). All-time releases of mercury to the atmosphere from human activities. Environ. Sci. Technol. 45, 10485–10491. doi: 10.1021/es202765m
Streets, D. G., Horowitz, H. M., Jacob, D. J., Lu, Z., Levin, L., Schure, A. F. H., et al. (2017). Total mercury released to the environment by human activities. Environ. Sci. Technol. 51, 5969–5977. doi: 10.1021/acs.est.7b00451
Tchounwou, P. B., Ayensu, W. K., Ninashvili, N., and Sutton, D. (2003). Environmental exposure to mercury and its toxicopathologic implications for public health. Environ. Toxicol. 18, 149–175. doi: 10.1002/tox.10116
Wang, J., Fang, X., Cui, X., Zhang, Y., Zhao, H., Li, X., et al. (2018). A highly sensitive colorimetric probe for Cd2+, Hg2+ and ascorbic acid determination based on trithiocyanuric acid-AuNPs. Talanta 188, 266–272. doi: 10.1016/j.talanta.2018.05.084
Wang, L., Meng, D., Hao, Y., Zhao, Y., Li, D., Zhang, B., et al. (2015). Gold nanostars mediated combined photothermal and photodynamic therapy and X-ray imaging for cancer theranostic applications. J. Biomater. Appl. 30, 547–557. doi: 10.1177/0885328215594481
Wu, X., Yang, W., Liu, M., Hou, X., and Zheng, C. (2011). Vapor generation in dielectric barrier discharge for sensitive detection of mercury by inductively coupled plasma optical emission spectrometry. J. Anal. At. Spectrom. 26, 1204–1209. doi: 10.1039/c1ja10016e
Xie, J., Lee, J. Y., and Wang, D. I. C. (2007). Seedless, surfactantless, high-yield synthesis of branched gold nanocrystals in HEPES buffer solution. Chem. Mater. 19, 2823–2830. doi: 10.1021/cm0700100
Xu, X., Li, Y. F., Zhao, J., Li, Y., Lin, J., Li, B., et al. (2015). Nanomaterial-based approaches for the detection and speciation of mercury. Analyst 140, 7841–7853. doi: 10.1039/C5AN01519G
Xue, X., Wang, F., and Liu, X. (2008). One-step, room temperature, colorimetric detection of mercury (Hg2+) using DNA/nanoparticle conjugates. J. Am. Chem. Soc. 130, 3244–3245. doi: 10.1021/ja076716c
Yang, P. C., Wu, T., and Lin, Y. W. (2018). Label-free colorimetric detection of mercury (ii) ions based on gold nanocatalysis. Sensors 18:2807. doi: 10.3390/s18092807
Keywords: gold nanostar, amalgamation, Hg2+ quantification, morphological transformation, LSPR sensing
Citation: Xu D, Yu S, Yin Y, Wang S, Lin Q and Yuan Z (2018) Sensitive Colorimetric Hg2+ Detection via Amalgamation-Mediated Shape Transition of Gold Nanostars. Front. Chem. 6:566. doi: 10.3389/fchem.2018.00566
Received: 01 October 2018; Accepted: 31 October 2018;
Published: 27 November 2018.
Edited by:
Huan-Tsung Chang, National Taiwan University, TaiwanReviewed by:
Chih-Ching Huang, National Taiwan Ocean University, TaiwanYang-Wei Lin, National Changhua University of Education, Taiwan
Copyright © 2018 Xu, Yu, Yin, Wang, Lin and Yuan. This is an open-access article distributed under the terms of the Creative Commons Attribution License (CC BY). The use, distribution or reproduction in other forums is permitted, provided the original author(s) and the copyright owner(s) are credited and that the original publication in this journal is cited, in accordance with accepted academic practice. No use, distribution or reproduction is permitted which does not comply with these terms.
*Correspondence: Qinlu Lin, bGlucWwwNDAzQDE2My5jb20=