Abstract
Rondeletia odorata Jacquin is a flowering plant that belongs to the coffee family. As a rich source of polyphenols with significant antioxidant potential, R. odorata may have health benefits. Therefore, in the current work, ethanolic extract of aerial parts and its n-hexane, ethyl acetate, and n-butanol soluble fractions were analyzed for their antioxidant potential and various enzyme inhibition properties. The total phenolic and flavonoid contents of the crude ethanol extract (ROE) and its n-hexane (ROH), ethyl acetate (ROEA), and n-butanol (ROB) fractions were determined spectrophotometrically, while metabolic profiling was established through UHPLC-MS analysis, which revealed the presence of 58 phytochemicals. Total phenolic and flavonoid contents of ROE extract were measured as 51.92 mg GA.Eq./g of dry extract and 52.35 mg Qu.Eq./g of the dry extract, respectively. In the DPPH radical scavenging activity assay, ROE and ROEA showed the highest potential with values of 62.13 ± 0.62 and 76.31% ± 1.86%, respectively, comparable to quercetin (80.89% ± 0.54%). Similarly, in the FRAP assay, the same pattern of the activity was observed with ROE and ROEA, which displayed absorbance values of 1.32 ± 0.01 and 0.80 ± 0.02 at 700 nm, respectively, which are comparable (1.76 ± 0.02) with the reference compound quercetin, whereas the ROH showed maximum metal-chelating capacity (62.61% ± 1.01%) among all extracts and fractions. Antibacterial activity assay indicated that the ROEA fraction was the most active against Serratia marcescens, Stenotrophomonas maltophilia, Bacillus subtilis, Klebsiella pneumonia, and Staphylococcus aureus, while the rest of the fractions showed good to moderate activity. Enzyme inhibition assays showed that ROEA fraction exhibited the highest activity with IC50 values of 2.78 ± 0.42 and 3.95 ± 0.13 mg/mL against urease and carbonic anhydrase (CA), respectively. Furthermore, the docking studies of some of the major compounds identified in the extract revealed a strong correlation with their inhibitory activity. All extracts and fractions were also tested for their thrombolytic activity, and the ROB fraction showed a notable potential. Antiviral assay led to remarkable outcomes. Thus, it can be inferred that aerial parts of R. odorata are potential sources of bioactive components with several significant pharmacological activities.
1 Introduction
Natural products have played a crucial role in medicine and health throughout the course of human evolution. Natural remedies have frequently been used for treating illnesses and wounds since our earliest ancestors chewed particular herbs to relieve pain or wrapped leaves around wounds to improve healing. In the modern era, researchers can now properly explain the biological impact of natural substances on individuals and find potential synergies thanks to modern chemistry and biology. This has enormous promise for the development of cutting-edge therapies for a variety of crippling illnesses. Therefore, it is crucial to carry out continuous natural source screening for the development of therapies for a number of debilitating diseases (Ji et al., 2009).
Among countless medicinal herbs, Rondeletia odorata Jacquin (Syn: R. speciosa Lodd; R. brilliantissima Hend; R. coccinea and R. obovata L.) (List, 2013) of the family Rubiaceae is an evergreen shrub, native to Cuba and Panama. In Pakistan, it is grown as an ornamental plant. Common names for the plant are “sweet-smelling Rondeletia” or “fragrant Panama rose” (Mazza, 2009). A literature search revealed that Rubiaceous plants produce new potential metabolites and therapeutic prototypes (Martins and Nunez, 2015). Phenolics, anthraquinones, alkaloids, coumarins, flavonoids, and terpenes are only a few of the secondary metabolites they produce, many of which have pharmacological effects (Heitzman et al., 2005). Furthermore, the Rubiaceae plants show high antioxidant activity (Mavi et al., 2004; Soobrattee et al., 2008; Lakić et al., 2010; Torey et al., 2010), which is due to its secondary metabolites. Rondeletia is an important genus of Rubiaceae, which is used traditionally in different countries around the world (Michel et al., 2007; Carlomagno et al., 2015). R. panamensis DC. is a Panamanian plant, which produces cytotoxic diterpenes (Koike et al., 1980). According to the literature, Rondeletia displays interspecific variation, with some species having negative results for alkaloids and others yielding positive results for alkaloids of varying concentrations, and this variation is attributed to different possible metabolic pathways to produce different compounds. This complication makes biological screening more intriguing for Rondeletia plants (Soto-Sobenis et al., 2001). Despite its biological importance and interesting metabolic behavior, the Rondeletia genus is underexplored. Likewise, no report so far has been found in the literature on the phytochemical and biological screening of R. odorata. Therefore, based on various folkloric uses of the plants from the coffee family and their reported biological activities, we designed the current study on R. odorata to identify its phytochemicals and evaluate it for medicinal potential as a component of nutraceuticals and functional foods.
2 Materials and methods
2.1 Collection of the plant material and identification
The aerial parts of the plant were collected in February 2019, near Pattoki Bypass, Kasur, Punjab, Pakistan, where it was grown as an ornamental plant. It was authenticated by Dr. Ghulam Sarwar from the Department of Botany, The Islamia University of Bahawalpur, and was deposited in the herbarium with specimen No. 167/Botany.
2.2 Extraction and fractionation
Plant material was first rinsed with distilled water to remove dirt and shade-dried for 15 days and got 2.5 kg dried plant material. The dried material was extracted with aqueous ethanol (80%) by maceration for a period of 15 days with occasional vigorous shaking. The filtrate was concentrated using a rotary evaporator. The crude extract (85 g) obtained was suspended in 250 ml of distilled water and successively fractionated with solvents of increasing polarity such as n-hexane, ethyl acetate, and n-butanol to respective fractions denoted as ROH (15 g), ROEA (20 g), and ROB (30 g). All fractions obtained were stored at 4°C for further studies.
2.3 Measurement of total phenolic and flavonoid contents
The total phenolic contents (TPCs) of the fractions were measured using the Folin–Ciocalteu reagent, while their total flavonoid contents (TFCs) were assessed using the AlCl3 colorimetric method (Slinkard and Singleton, 1977; Zengin et al., 2016). In these analyses, the phenolic and flavonoid contents were presented as equivalents of gallic acid (mg GA.Eq./g dried extract) and quercetin (mg Qu.Eq./g of dry extract), respectively.
2.4 UHPLC-MS analysis of the ethanolic extract (ROE)
Phytochemical profiling was accomplished through UHPLC-MS analysis, which was performed on an Agilent 1290 infinity UHPLC system coupled with an Agilent 6520 accurate mass Q-TOF mass spectrometer with a dual ESI source. For metabolite separation, an Agilent Zorbax Eclipse XDB-C18 column (2.1150 mm, 3.5 m) was employed. Mobile phase A was a 0.1% formic acid solution in water, and mobile phase B was a 0.1% formic acid solution in acetonitrile. A Rheodyne-type injector was used to load 1.0 μL of injection volume, and the experiment was run with a flow rate of 0.5 ml/min and an acquisition time of 25 min. The electrospray ion source was used to perform 100–1000 MS scans in the positive mode. With a flow rate of 25 and 600 L/h, respectively, and a drying gas temperature of 350°C, nitrogen gas was employed for nebulizing and drying. The capillary voltage for analysis was 3500 V, whereas the fragmentation voltage was tuned at 125 V. The secondary metabolites were identified using the METLIN database (Khan et al., 2019).
2.5 Antibacterial assays (broth microliter plate dilution method)
Two Gram-positive strains, Staphylococcus aureus and Bacillus subtilis, and eight Gram-negative strains, Escherichia coli, Citrobacter koseri, Klebsiella pneumonia, Pseudomonas aeruginosa, Proteus mirabilis, Morganella morganii, Stenotrophomonas maltophilia, and Serratia marcescens, were provided by the Department of Medical Laboratory Sciences, Bahawal Victoria Hospital, Bahawalpur, Pakistan. These bacterial strains were used to evaluate the antibacterial potential of the extracts through the broth microtiter plate dilution method in sterilized 96-well ELISA microplates (Rehman and Ahmad, 2019). The total assay mixture volume was kept at 150 μL in each well, which constituted 75 μL of extract/fraction solutions (concentration of 5 mg/ml dried extract/fractions in DMSO each) and 75 μL of bacterium inoculums. The absorbance of all of these clear solutions was measured at 540 nm on a BioTek Synergy HT ELISA microplate reader and was considered as pre-read. Then, 96-well ELISA microplates were incubated for 24 h at 37°C, and again the absorbance was determined at 540 nm, which was regarded as after-read. The difference of after-read subtracted by pre-read was attributed to the bacterial growth inhibition index. Ceftriaxone (1 mg/ml in DMSO) was employed as the + ve control, whereas distilled water was used as the -ve control. Inhibition (%) of bacterial strains was enumerated by the formula given below:
Serial dilutions (2,500, 1250, 625, 312.5, 156.2, and 78.12 μg/ml) of the extract/fractions and ceftriaxone solution (reference drug) were prepared to estimate their antibacterial potential by measuring MIC50, which was obtained using software “EZ-Fit™ Perrella Scientific Amherst United States”. All of the experiments were carried out in triplicate.
2.6 Antioxidant activity assays
2.6.1 DPPH radical scavenging activity assay
The antioxidant capacity of the corresponding samples was computed from the bleaching property of the violet-colored methanol solution of 2,2-diphenyl-1-picrylhydrazyl (DPPH, Sigma, United States). The stable DPPH radical scavenging activity was determined by the method of Hatano et al. (1988) with minor modifications (Barros et al., 2007). Next, 10 µL of the samples/reference dissolved in EtOH was transferred to 96-well plates. Then, 90 µL of DPPH solution (1.5 × 10⁻⁴ M) prepared in EtOH was added to each well using a multichannel pipette (Eppendorf Research, Germany). The remaining quantity of DPPH was then measured by spectrophotometry using an ELISA microplate reader (Molecular Devices, SpectraMax i3x microplate reader, United States) at 515 nm following incubation at 37°C for 30 min. The results were compared to quercetin (1000 μg/ml, Sigma, United States), which was used as the reference. Measurements were taken in triplicate.
2.6.2 Ferric-reducing antioxidant power assay
The ferric-reducing ability of the samples was examined using the Oyaizu assay with minor modifications to measure the antioxidant capability (Oyaizu, 1986). The assay was based on the reducing power of the conversion of ferric ion (Fe3+) to ferrous ion (Fe2+), which creates a blue complex (Fe2+/TPTZ) that enhances absorbance at 700 nm. Briefly, 10 μL of the samples and reference in EtOH (96%) were transferred to a 96-well microplate and preincubated at 50°C for 20 min after being treated with 25 ml of phosphate buffer (pH 6.6) and 25 µL of [K3Fe(CN)6] (1%, w/v, Sigma, United States ). Then, 25 µL of trichloroacetic acid (10%, Sigma, United States), 85 µL of distilled water, and 17 µL of FeCl3 (0.1%, w/v) were added and incubated at room temperature for 30 min. The absorbance of the generated complex was measured at 700 nm using an ELISA microplate reader (Molecular Devices, SpectraMax i3x microplate reader, United States). Quercetin (1000 μg/ml, Sigma, United States) was the reference in this assay. The analysis was performed in triplicate.
2.6.3 Metal-chelating activity assay
Carter’s modified approach was used to determine the metal-chelating impact of the samples, where the reference was ethylenediaminetetraacetic acid (EDTA, Sigma, United States) (Carter, 1971; Lantto et al., 2009). In brief, 20 μL of each sample and reference was incubated for 10 min at ambient temperature with EtOH (96%), 2 mM FeCl2 (Sigma, United States), and ferrozine (5 mM, Sigma, United States) solutions. The absorbance of the ferrozine-Fe2+ complex formed was measured at 562 nm using an ELISA microplate reader (Molecular Devices, SpectraMax i3x microplate reader, United States).
2.6.4 Data processing for antioxidant activity assays
DPPH radical scavenging and metal-chelating activity assay findings of the samples were calculated as given below, then represented as percent inhibition (I%).where Ablank denotes the absorbance of the control reaction (all reagents except the test sample) and Asample denotes the absorbance of the samples/reference. Analyses were performed in triplicate, and the data were reported as averages with standard deviations (S.D.). FRAP assay was likewise performed in triplicate, and the higher absorbance of the reaction signified higher reducing power in this assay.
2.7 Enzyme inhibition assays
2.7.1 Cholinesterase inhibition assays
Inhibitory activity of the extract/fractions against AChE and BChE was determined using a slightly modified version of Ellman’s method (1961). Electric eel AChE (type-VI-S, EC 3.1.1.7, Sigma) and equine serum BChE (EC 3.1.1.8, Sigma) were employed as the enzyme sources, while acetylthiocholine iodide and butyrylthiocholine chloride (Sigma, St. Louis, MO, United States) were used as reaction substrates. 5,5´-Dithio-bis(2-nitrobenzoic) acid (DTNB, Sigma, St. Louis, MO, United States) was used for measurement of the cholinesterase activity. First, 140 µL of 0.1 mM sodium phosphate buffer (pH 8.0) was added to the 96-well microplate with a multichannel automatic pipette (Eppendorf Research, Germany), and then 20 µL of the sample/EtOH (negative control) was added at dilutions ranging from 25 to 200 μg/ml. Then, 20 µL of 0.2 M AChE/BChE solution was added using a multichannel automatic pipette (Gilson Pipetman, France). After that, it was incubated at room temperature for 10 min. The reaction was started by adding 10 μL of 0.2 M acetylthiocholine iodide/butyrylthiocholine chloride as substrates to the 96-well microplate. Thiol esters used as substrates are hydrolyzed by AChE or BChE to release thiocholine. As a result of the reaction of thiocholine with DTNB, 2-nitro-5-thiobenzoate (TNB) is formed as the yellow product. The formation rate and color intensity of the product, which formed as a result of the reaction, were measured using an ELISA microplate reader (Molecular Devices, SpectraMax i3x microplate reader, United States) at a wavelength of 412 nm. Galanthamine hydrobromide (Sigma, United States) was used as the reference drug in both experiments. All experiments were performed in triplicate. Based on a comparison of rates of enzyme reaction between the sample and the blank sample (ethanol in phosphate buffer, pH 8) using formula (1-S/E)*100, where E is enzyme activity without test sample and S is enzyme activity with the test sample, we determined the percentage of inhibition of AChE and BChE. GraphPad Prism 6.01 was used to compute IC50 values of understudy aerial extract/fractions.
2.7.2 Urease inhibition assay
Urease inhibition assay was carried out as detailed by Bashir et al. (2017) with minor alterations. The total volume of the assay mixture was 200 μL, which contained 15 μL of urease enzyme solution (0.25 mg of urease in 1 ml of 1M phosphate buffer; pH 7), 15 μL of 1M phosphate buffer solution (pH 7), and 15 μL of extract/fraction solutions (5 mg/ml each). All solutions were poured into sterilized 96-well ELISA microplates and incubated for 15 min at 37°C. Urea solution (40 μL) was then added as the reaction substrate, and the ELISA plate was reincubated under similar conditions. After incubation, the pre-read was measured by taking absorbance at a wavelength of 630 nm. After taking pre-read, a 45 μL volume of phenol solution with a 70 μL volume of alkali reagents was mixed in the reaction mixture. The microplate reaction mixture was incubated again for 50 min at 37°C. Absorbance was taken again at a wavelength of 630 nm and was regarded as post-read. Thiourea was taken as a reference, while methanol was considered as a control. Percentage inhibitions (%) by various test solutions were measured by the formula given below:
Inhibition (%) of urease = 100—[(S.V. of control solution—S.V. of test solution)/S.V. of control solution] ∗ 100.
IC50 values of the extract/fractions were determined by making various dilutions of different concentrations (2,500, 1250, 625, 312.5, 156.2, and 78.12 μg/ml) of the first concentration (5,000 μg/ml). All of the experiments were performed in triplicate.
2.7.3 Carbonic anhydrase inhibition assay
CA inhibition procedure was performed as stated in the method by (Ashiq et al., 2017) with minute modifications. Acetazolamide was taken as the reference. The total assay volume was 200 μL. Tris-HEPES buffer of pH 7.4 (140 μL) with 20 μL of CA (0.2 mg of CA in 1 ml of deionized water) and 20 μL of each sample solution (concentration of 5,000 μg/ml each) were mixed in sterilized 96-well ELISA microplates and incubated for 15 min at 25°C. Absorbance was noted at 400 nm as pre-read. Then, 20 μL of substrate, which was 4-nitrophenol acetate (0.7 mM), was added, the microplate was reincubated at the same temperature for 30 min, and the post-read was determined at the same wavelength. All of the experimentation was carried out in triplicates, and Percentage (%) inhibition of CA was determined by the formula given below:
Inhibition (%) of CA = [100 − (S.V. of control solution—S.V. of test solution)/(S.V. of control solution)] ∗ 100.
IC50 values of the extract/fractions were determined by making various dilutions of different concentrations (2,500, 1250, 625, 312.5, 156.2, and 78.12 μg/ml) of the first concentration (5,000 μg/ml). All of the experiments were performed in triplicate.
2.7.4 Tyrosinase inhibition assay
Inhibition of tyrosinase (EC 1.14.1.8.1, 30 U, mushroom tyrosinase, Sigma) was determined using the modified dopachrome method with L-DOPA as substrate (Masuda et al., 2005). The assays were conducted in a 96-well microplate using an ELISA microplate reader (VersaMax Molecular Devices, United States) to measure absorbance at 475 nm. An aliquot of the extracts dissolved in DMSO with 80 μL of phosphate buffer (pH 6.8), 40 μL of tyrosinase, and 40 μL of L-DOPA were put in each well. Results were compared with the control (DMSO). Alpha-kojic acid (Sigma, St. Louis, MO, United States) was used as the reference.
2.8 Hemolytic assay
The hemolytic effect of the extract/fractions was evaluated using (Diaconu et al., 2020) with slight modifications. 10 ml of blood from human volunteers was collected and then poured into a top-screwed EDTA tube and centrifuged for 5 min. The upper layer was separated out, and red blood cells were washed many times with 10 ml of cooled sterilized isotonic phosphate buffer saline (PBS) having pH 7.4. Washed cells were again suspended in 20 ml of PBS, and the test samples (1 mg/ml dried extract/fractions in methanol) each were added to this mixture separately and incubated at 37°C for 60 min. The hemolysis rate was calculated by determining the absorbance of hemoglobin present in the supernatant at the wavelength of 540 nm. Triton X-100 (0.1%) was used as the positive control and PBS as the negative control. Hemolysis (%) was calculated through their absorbance (A) using the following formula:
2.9 Thrombolytic assay
To perform thrombolytic assay with the extracts, healthy human volunteers (who did not have any history of undergoing anticoagulant and oral contraceptive therapy from the last 7 days) were selected. Venous blood (5 ml) was collected from each volunteer and poured into preweighed and sterile specific centrifuge tubes. Incubation of these tubes was carried out at 37°C for 45 min. After the blood clot was formed, the entire fluid from each centrifuge tube was discharged. Blood clot weight was determined by subtracting the weight of the empty centrifuge tube from the one containing the clot. Streptokinase was used as the reference, which was prepared by diluting the commercially available streptokinase (1,500,000 I.U.) injection with 5 ml of sterilized water. Then, 100 µL of streptokinase (30,000 I.U) was used as the positive control, while 100 µL of distilled water was the negative control. Each extract/fraction was added to the centrifuge tube containing the clot, and then all tubes were incubated at 37°C for 90 min. After that, examination of clot lysis was performed and all of the extra fluid from the tubes was discarded. The centrifuge tubes were again weighed to observe the weight variation subsequent to clot lysis (Saleem et al., 2015). The percentage of clot lysis was determined using the following formula:
2.10 Antiviral assay
2.10.1 Inoculation of viruses in chicken embryonated eggs (cultivation of viral strains)
Chicken embryonated eggs are the most widely used medium for inoculation studies as the inoculive-stock is very valuable. The eggs may be used for the initial growth of viruses, propagation, and development of new vaccines. The excellent yield of viruses from chicken eggs has made them the most used medium for viral culturing. Poultry eggs are easily available, easy to handle, need no extra care, are least expensive, can be used in aseptic conditions, and require little space . This makes them the best source of studies on viral inoculations. During the incubation period, the virus replicates and gets accumulated in the chorio-allantoic membrane fluid. In 7–11-day-old embryonated eggs of chicken, all viral strains were cultured. From the Government Poultry Farm, Model Town A Bahawalpur, pathogen-free eggs were taken. With the help of a 5 cc-syringe, the viral strains were inoculated through the chorio-allantoic route. The eggs were sterilized with 70% EtOH, and a hole was made with the help of a sterilized common pin. After inoculation, the hole was closed with melted wax. The eggs were incubated at 37°C for 48–72 h. The allantoic fluid was collected and exposed to hemagglutination (HA) and indirect hemagglutination (IHA) to assess the titers of virus. Different sites can be used for viral inoculation, that is, chorio-allantoic membrane, allantoic cavity, amniotic cavity, and yolk sac (Andleeb et al., 2020).
2.10.2 Hemagglutination (HA) test
Alsever solution (20 ml) is poured into a test tube, and after that, 5 ml of fresh chicken blood is added to it. Blood (10 ml) was centrifuged at 4,000 rpm for 5 min, and the supernatant was discarded. The process was repeated three times for further purification and to obtain a better result. RBC solution (1%) was prepared by adding 10 µL of packed RBCs into 1 ml of PBS solution (pH 7.4) placed in Eppendorf tubes. The tubes were shaken gently to avoid any kind of precipitation. PBS (50 µL) was added in each well of a 96-well round-bottom microtiter plate. Then, 50 µL of viral sample or allantoic fluid was added in the first column and serially diluted to the 11th well. The 12th well was left as a negative control (PBS only). Then, 50 µL of 1% RBC solution was added to each well and the plate was incubated for 2–3 h at 37°C. Red dots at the bottoms of the wells indicated positive results, while a uniform reddish color pointed out negative results. The highest dilution number was the HA titer that showed a positive result. The test was used for testing the titer of NDV, IBV, and H9N2 (Harazem et al., 2019).
2.11 Docking experiments
Six compounds selected for inhibitory activity against urease and carbonic anhydrase were drawn in ChemDraw 3D (Mills, 2006) and optimized, while energy was minimized using MMFF94. The stable energy-minimized conformations for the compounds were used for docking studies. The 3D structures for urease (PDB I.D. 4H9M) and carbonic anhydrase (PDB I.D. 3DC3) were retrieved from the RCSB Protein Data Bank (PDB) (Sussman et al., 1998). Prior to docking studies, co-crystallized ligands, water, and small molecules were removed from the proteins. Docking was performed using AutoDock 4.2 software. The protonation state of both proteins was satisfied by adding polar hydrogen. The Kollman charges were also added to both the proteins, while Gasteiger charges were added to ligands using AutoDock. The proteins and ligands were saved in PDBQT format as separate files. The position of the grid box was adjusted so that it was centered on the co-crystallized ligand, while dimensions were set as 40*40*40 A° in x, y, and z coordinates. The docking protocols were set for 250 runs using the Lamarckian genetic algorithm.
2.12 Statistical analysis
Whole experimentation was carried out in triplicate, and the results were represented as average ± S.D. (standard deviation). One-way ANOVA was applied pursued by the LSD test for comparing various study groups. Statistix version 8.1 was used for analyzing the results.
3 Results and discussion
3.1 Percentage yields of extracts
The percentage of the extract recovery was estimated for different solvent extraction obtained through solid–liquid extraction as given in (Table 1). Maximum extract yields among different solvents, for example, 80% ethanol–water, n-hexane, ethyl acetate, and n-butanol, were observed for 80% ethanol–water extract with 8.6% ± 0.2%, followed by 5.4% ± 0.3% for n-butanol, 1.6% ± 0.5% for ethyl acetate, and 1.3% ± 0.1% for n-hexane. The current scientific assessment has validated that the recovery of bioactive constituents and extraction yield is totally reliant on extraction time, extraction technique, and solvent polarity (Zohra et al., 2019).
TABLE 1
| Plant samples | Percentage age of extractive value |
|---|---|
| ROE | 8.6 ± 0.2a |
| ROH | 1.3 ± 0.1d |
| ROEA | 1.6 ± 0.5c |
| ROB | 5.4 ± 0.3b |
Results of % age extractive yield for ground plant material using different solvents.
Experimentation was carried out in triplicate, and results are represented by [mean ± S.D.] with different superscripts a–d showing that all of the values were momentously different from one another (p ≤ 0.05). ROE, hydroethanolic fraction; ROH = n-hexane fraction; ROEA, ethyl acetate fraction; and ROB = n-butanol fraction.
3.2 Total bioactive contents and UHPLC-MS analysis
In the present study, crude aq. ethanolic extracts of R. odorata and its fractions were estimated for their total phenolic and flavonoid contents. It was observed that overall the extracts contained more flavonoid content than the phenolics. The ROEA fraction comprised of the highest amount of phenolics and flavonoids (246.48 mg GA.Eq./g and 300 mg Qu.Eq./g of dried extract), followed by ROB (36.32 mg GA.Eq./g and 136.47 mg Qu.Eq./g of dried extract), ROE (51.92 mg GA.Eq./g and 52.35 mg Qu.Eq./g of dried extract), and ROH fraction (6.48 mg GA.Eq./g and 161.17 mg QEq/g extract) (Table 2). These results indicated that ethyl acetate could extract the maximum amount of phenolics and flavonoids, which is exactly in line with various literature reports (Hossain et al., 2019; Khan et al., 2019).
TABLE 2
| Sample codes | Total phenolic contents (mg GA.Eq./g of dry extract) | Total flavonoid contents (mg Qu.Eq./g of dry extract) |
|---|---|---|
| ROE | 51.92 | 52.35 |
| ROH | 6.48 | 161.17 |
| ROEA | 246.48 | 300 |
| ROB | 36.32 | 136.47 |
Results of total phenolic and flavonoid contents of the R. odorata extract/fractions.
3.2.1 Secondary metabolites profiling through UHPLC MS analysis
To have a deep look into the metabolic profile of R. odorata, the crude aq. ethanolic extract (ROE) was subjected to UHPLC-MS analysis (Table 3), which led to the identification of 58 compounds of alkaloid, phenolic, flavonoid, terpenoid, and steroid classes. The identified compounds include nigellimine N-oxide, an alkaloid, which is the main component isolated from the seeds of Nigella sativa (MALIK et al., 1985) and is known for its antioxidant, antimicrobial, anticancer, antidiabetic, and anti-inflammatory activities (Manoharan et al., 2021). Other identified alkaloids mostly belong to indole, quinoline, and isoquinoline subclasses, viz., robustine, (R)-norreticuline, nepharadione A, nristolodione, piperolactam A, α,β-didehydrotryptophan, oxoaporphine, liriodenine, and atheroline. Piperolactam A was reported to have antiviral activity (Kothandan et al., 2021). These alkaloids are characteristic features of the coffee family, which make R. odorata important with respect to antioxidant, antibacterial, and antiviral activities. Furthermore, the presence of phenolics in a higher concentration along with flavonoids and withanolide makes R. odorata more important. In addition, docking studies of some of these metabolites against some enzymes substantiated their medicinal properties. According to these findings, R. odorata produces a variety of compounds and is not limited to a specific class of secondary metabolites. Therefore, it is concluded that R. odorata is a valuable herb with a wide range of bioactivities due to its chemodiversity.
TABLE 3
| Sr No. | Analyte peak mass | Retention time | Area/height | Identified compounds | Class of compound | Molecular formula | Molecular mass |
|---|---|---|---|---|---|---|---|
| 1 | 220.1000 | 1.35 | 6.83 | Nigellimine N-oxide | Alkaloid | C12H13NO3 | 219.08 |
| 2 | 363.0467 (M + K+) | 1.46 | 4.24 | Mahaleboside | Coumarin | C15H16O8 | 324.28 |
| 3 | 245.0943 (M + NH4+) | 1.49 | 5.93 | Mukeic acid | Carbazole | C13H9NO3 | 227.21 |
| 4 | 217.0507 | 1.53 | 11.70 | Norvisnagin | Phenolic | C12H8O4 | 216.19 |
| 5 | 371.1216 (M + Na+) | 1.52 | 8.41 | Trans-anhydrotephrostachin | Flavonoid | C22H20O4 | 348.40 |
| 6 | 393.1440 | 1.55 | 8.09 | Shanzhiside | Terpene | C16H24O11 | 392.13 |
| 7 | 415.1276 (M + Na+) | 1.53 | 9.52 | Caryoptosidic acid | Terpene | C16H24O11 | 392.35 |
| 8 | 216.0689 | 1.64 | 10.63 | Robustine | Alkaloid | C12H9NO3 | 215.20 |
| 9 | 242.0635 | 2.75 | 5.16 | 2,4-Dihydroxy-6,7-dimethoxy-2H-1,4-benzoxazin-3(4H)-one | Phyto | C10H11NO6 | 241.20 |
| 10 | 343.0808 | 2.75 | 7.78 | 8-Hydroxygalangin 7-methyl ether 8-acetate | Flavonoid | C18H14O7 | 342.073 |
| 11 | 163.0237 (M + CH3OH + H+) | 3.03 | 8.26 | 2-Thiophenemethanethiol | Phyto | C5H6S2 | 130.2 |
| 12 | 273.0581 | 3.19 | 10.64 | Fukiic acid | Phenolic | C11H12O8 | 272.21 |
| 13 | 197.0637 | 3.48 | 12.71 | Gulonic acid | Phenolic | C6H12O7 | 196.16 |
| 14 | 185.0808 | 3.50 | 7.77 | 1-(3-Hydroxy-4-methoxyphenyl)-1,2-ethanediol | Phenolic | C9H12O4 | 184.19 |
| 15 | 230.0817 | 3.50 | 7.98 | Fenamisal | Phenolic | C13H11NO3 | 229.23 |
| 16 | 300.0872 | 3.51 | 8.07 | Avenanthramide 1c | Phenolic | C16H13NO5 | 299.28 |
| 17 | 244.0972 | 3.51 | 8.08 | N-Desmethyltolmetin | Phyto | ||
| 18 | 227.0735 (M + CH3OH + H+) | 3.79 | 6.97 | D-Glucuronic acid | Sugar | C6H10O7 | 194.25 |
| 19 | 316.1553 | 3.83 | 7.36 | (R)-Norreticuline | Alkaloid | C18H21NO4 | 315.4 |
| 20 | 297.0745 (M + Na+) | 4.07 | 9.30 | Guibourtinidol-4α-ol | Phenolic | ||
| 21 | 288.0664 | 4.33 | 7.85 | Piperolactam A | Alkaloid | C16H11NO3 | 265.26 |
| 22 | 291.0657 | 4.33 | 7.36 | 6-Hydroxy-2'-methoxyflavone | Flavonoid | C16H12O4 | 268.26 |
| 23 | 225.0580 | 4.50 | 7.51 | α, β-Didehydrotryptophan | Alkaloid | C11H10N | 202.209 |
| 24 | 427.0956 (M + Na+) | 4.51 | 7.47 | Distemonatin | Flavonoid | C20H20O9 | 404.4 |
| 25 | 227.1096 | 4.54 | 8.77 | Phenylmethyl benzeneacetate | Phenolic | C15H14O2 | 226.0994 |
| 26 | 197.0640 | 4.79 | 7.17 | Gulonic acid | Phyto | C6H12O7 | 196.05 |
| 27 | 359.1472 | 4.62 | 6.79 | 2',4',5,7-Tetramethoxy-8-methylflavanone | Flavonoid | C20H22O6 | 358.14 |
| 28 | 387.1779 | 4.62 | 10.76 | 3,5-Di-O-methyl-8-prenylafzelechin-4β-ol | Flavonoid | C22H26O6 | 386.4 |
| 29 | 375.1208 (M + CH3OH + H+) | 4.71 | 7.26 | Glucocaffeic acid | Phenolic | C15H18O9 | 342.30 |
| 30 | 413.1173 | 4.79 | 6.73 | (2E)-5,7-Dihydroxy-3,6-dimethoxy-4-oxo-2-phenyl-4H-1-benzopyran-8-yl ester 2-methyl-2-butenoic acid | Phenolic | ||
| 31 | 193.0693 | 4.79 | 6.70 | Quinic acid | Phyto | C7H12O6 | 192.17 |
| 32 | 306.0762 | 4.82 | 7.19 | Cepharadione A | Alkaloid | C18H11NO4 | 305.3 |
| 33 | 301.0861 (M + K+) | 4.82 | 7.84 | Dihydrosuberenol | Phenolics | C15H18O4 | 262.30 |
| 34 | 325.1177 (M + NH4+) | 5.02 | 6.32 | Aristolodione | Alkaloid | C18H13NO4 | 307.3 |
| 35 | 545.1708 (M + Na+) | 5.02 | 6.86 | Melampodinin | Terpenoid | C25H30O12 | 522.5 |
| 36 | 308.0919 (M + CH3OH + H+) | 5.19 | 7.46 | Liriodenine | Alkaloid | C17H9NO3 | 275.26 |
| 37 | 448.1919 (M + NH4+) | 5.35 | 6.78 | Aliarin 4'-methyl ether | Flavonoid | C23H26O8 | 430.4 |
| 38 | 313.0707 | 5.33 | 10.39 | 3',4,4'-Trihydroxypulvinone | Phenolics | C17H12O6 | 312.27 |
| 39 | 412.1937 (M + NH4+) | 5.36 | 10.34 | Gibberellin A28 | Terpenoid | C20H26O8 | 394.4 |
| 40 | 313.0709 | 5.59 | 8.17 | 8-Hydroxy-3-methoxy-1-methylanthraquinone-2-carboxylic acid | Phenolic | C17H12O6 | 312.27 |
| 41 | 343.0805 | 5.54 | 9.55 | 8-Hydroxygalangin 7-methyl ether 8-acetate | Phenolic | C18H14O7 | 342.07 |
| 42 | 167.0549 | 5.62 | 9.02 | Apionic acid | Phyto | C5H10O6 | 166.13 |
| 43 | 165.0744 | 5.51 | 9.12 | α-L-fucose | Sugar | C6H12O5 | 164.16 |
| 44 | 347.1266 M + CH3OH + H+ | 6.07 | 9.60 | 2-Hydroxyphenylacetic acid O-β-D-glucoside | Phenolic | C14H18O8 | 314.29 |
| 45 | 338.0979 | 6.11 | 6.65 | Atheroline | Alkaloid | C19H15NO5 | 337.3 |
| 46 | 163.0237 | 6.51 | 6.27 | 4-Hydroxy-2-oxo-glutaric acid | Sugar | C5H6O6 | 162.10 |
| 47 | 259.1349 M + CH3OH + H+ | 6.59 | 7.63 | 2-Phenylethyl benzoate | Phenolic | C15H14O2 | 226.27 |
| 48 | 425.3140 | 6.69 | 8.10 | Norselic acid C | Steroid | C28H40O3 | 424.6 |
| 49 | 501.2110 M + H + Na2+ | 6.96 | 8.08 | Senegin II | Saponin | C70H104O32 | 1457.6 |
| 50 | 407.2199 | 6.95 | 7.64 | Erycristin | Isoflavonoid | C26H30O4 | 406.5 |
| 51 | 423.3009 | 7.32 | 6.77 | Cholic acid methyl ester | Steroid | C25H42O5 | 422.6 |
| 52 | 667.3922 | 7.36 | 5.61 | Lucyoside R | Saponin | C36H58O11 | 666.3979 |
| 53 | 666.3891 M + NH4+ | 7.35 | 8.11 | Cytotrienin A | Phyto | C37H48N2O8 | 648.8 |
| 54 | 671.3452 M + Na+ | 7.35 | 6.04 | Lyciumoside III | Terpenoids | C32H56O13 | 648.7792 |
| 55 | 470.3085 | 7.86 | 10.31 | Methymycin | Macrolide | C25H43NO7 | 469.6 |
| 56 | 471.3103 | 8.29 | 8.46 | Minabeolide-8 | withanolide | C29H42O5 | 470.6 |
| 57 | 423.3009 | 8.28 | 7.43 | Minabeolide-1 | withanolide | C28H38O3 | 422.6 |
| 58 | 699.3232 | 8.95 | 5.90 | Evasterioside A | Steroid | C33H55NaO12S | 698.84 |
UHPLC-MS-based identification of secondary metabolites in ROE.
3.3 Antibacterial activity
The broth microtiter plate dilution method (BMPDM) (Balouiri et al., 2016) was used to study the antibacterial potential of the extract and fractions obtained from R. odorata aerial parts. BMPDM determines the minimal inhibitory concentration (MIC50) value, which is defined as the lowest concentration of antibacterial agent that inhibits the growth of tested microorganisms by 50% in microplates; the results are expressed in Table 4. In the present study, all extract/fractions were tested against two Gram-positive bacteria (S. aureus and B. subtilis) and eight Gram-negative bacterial strains (K. pneumonia, M. morganii, S. maltophilia, E. coli, C. koseri, S. marcescens, P. aeruginosa, and P. mirabilis). All extracts showed good results (Table 4) against bacterial strains, except E. coli, C. koseri, P. aeruginosa, and P. mirabilis. Results indicated that ROEA extract was active against maximum numbers of the bacterial strains, including S. marcescens, S. maltophilia, B. subtilis, K. pneumonia, and S. aureus, with MIC50 values of 362 ± 0.13, 413 ± 0.49, 390 ± 0.37, 263 ± 0.82, and 483 ± 0.43 μg/ml, respectively. The ROE, ROH, and ROB extracts also showed good to moderate inhibition against most of the bacterial strains as presented in Table 4. These activities could be attributed to the combined effects of diverse classes of secondary metabolites.
TABLE 4
| % Inhibition [MIC50 (µg/mL ± S.D.a)] | ||||||||||
|---|---|---|---|---|---|---|---|---|---|---|
| Sample codes | E. coli | S. aureus | C. Koseri | K. Pneumonia | P. aeruginosa | P. mirabilis | M. morganii | B. subtilis | S. maltophilia | S. marcescens |
| ROE | 39 ± 0.4b | 70 ± 0.83b (286 ± 0.65) | 26 ± 0.62e | 42 ± 0.44d | 34 ± 0.58e | 7 ± 0.32d | 67 ± 0.58b (512 ± 0.22) | 88 ± 0.40b (137 ± 0.66) | 34 ± 0.57e | 96 ± 0.31a (55 ± 0.46) |
| ROH | 36 ± 0.61c | 34 ± 0.61d | 29 ± 0.86d | 26 ± 0.45e | 38 ± 0.35d | 9 ± 0.60e | 50 ± 0.57c (503 ± 0.47 | 85 ± 0.71c (173 ± 0.36) | 50 ± 0.41b (482 ± 0.39) | 59 ± 0.83c (381 ± 0.72) |
| ROEA | 4 ± 0.44 | 51 ± 0.29c (483 ± 0.43) | 34 ± 0.21b | 77 ± 0.24b (263 ± 0.82) | 39 ± 0.86b | 43 ± 0.76c | 44 ± 0.64d | 57 ± 0.52d (390 ± 0.37) | 53 ± 0.95c (413 ± 0.49) | 63 ± 0.95d (362 ± 0.13) |
| ROB | 14 ± 0.45e | 31 ± 0.65e | 36 ± 0.28c | 52 ± 0.43c (467 ± 0.24) | 8 ± 0.70c | 26 ± 0.84b | 51 ± 0.60d (481 ± 0.71) | 50 ± 0.64e (495 ± 0.12) | 46 ± 0.48d | 54 ± 0.64e (412 ± 0.59) |
| Ceftriaxone (references) | 84 ± 0.29a (325 ± 0.62) | 88 ± 0.44a (130 ± 0.22) | 84 ± 0.37a (275 ± 0.61) | 85 ± 0.35a (242 ± 0.71) | 88 ± 0.32a (121 ± 0.31) | 84 ± 0.46a (209 ± 0.43) | 87 ± 0.58a (135 ± 0.44) | 89 ± 0.60a (121 ± 0.54) | 86 ± 0.37a (152 ± 0.83) | 89 ± 0.41b (75 ± 0.51) |
Antibacterial activities of R. odorata extract/fractions.
aResults are represented as mean ± S.D., with numerous superscripts a–e that are considerably different from one another (p ≤ 0.05).
3.4 Antioxidant activity
The antioxidant potential of the R. odorata was evaluated through DPPH radical scavenging activity, FRAP, and metal-chelating capacity methods. The ability of antioxidants to donate hydrogen is assumed to be the reason for their action on DPPH (Baumann, 1979). Our results with the DPPH assay revealed that ROEA showed the highest antioxidant potential (76.31% ± 1.86%) followed by the ROE (62.13% ± 0.62%) and ROH (54.10% ± 0.70%), while ROB showed the weak activity (16.48% ± 0.87%) (Figure 1; Table 5). The higher radical scavenging activity of ROEA may be due to higher amounts of phenolic compounds in this extract as phenolic compounds possess hydrogen-donating abilities (Khouya et al., 2015; Labiad et al., 2017). Second, good radical scavenging activity of the extracts can further be justified with the presence of high flavonoid contents (Baumann, 1979; Huang et al., 2005), which are also a subclass of phenolics. Characterized by their absorbance values, the ROE extracts showed the highest FRAP activity [1.32 ± 0.01 (absorbance at 700 nm ± S.D.)] as compared to all other extracts, which was comparable with the standard compound quercetin (1.76 ± 0.02), whereas all other extracts exerted lesser inhibition (Table 5). The presence of higher phenolic contents in ROE extract contributes to its good inhibitory activity and several investigations have shown that phenolic-rich extracts are better antioxidants when evaluated by FRAP activity (Wojdyło et al., 2007; Firuzi et al., 2010; Mashkor, 2014; Sethi et al., 2020). Some of the plant metabolites have been reported to possess the ability to bind with metal ions, which forms chelation with harmful metal ions and makes complex structures that can be easily eliminated from the body. Therefore, the metal-chelating capacity of the plant extracts herein was measured and ROH showed a greater metal-chelating capacity with a value of 62.61% ± 1.01% followed by ROB (44.35% ± 1.83%), whereas ROE and ROEA were inactive.
FIGURE 1
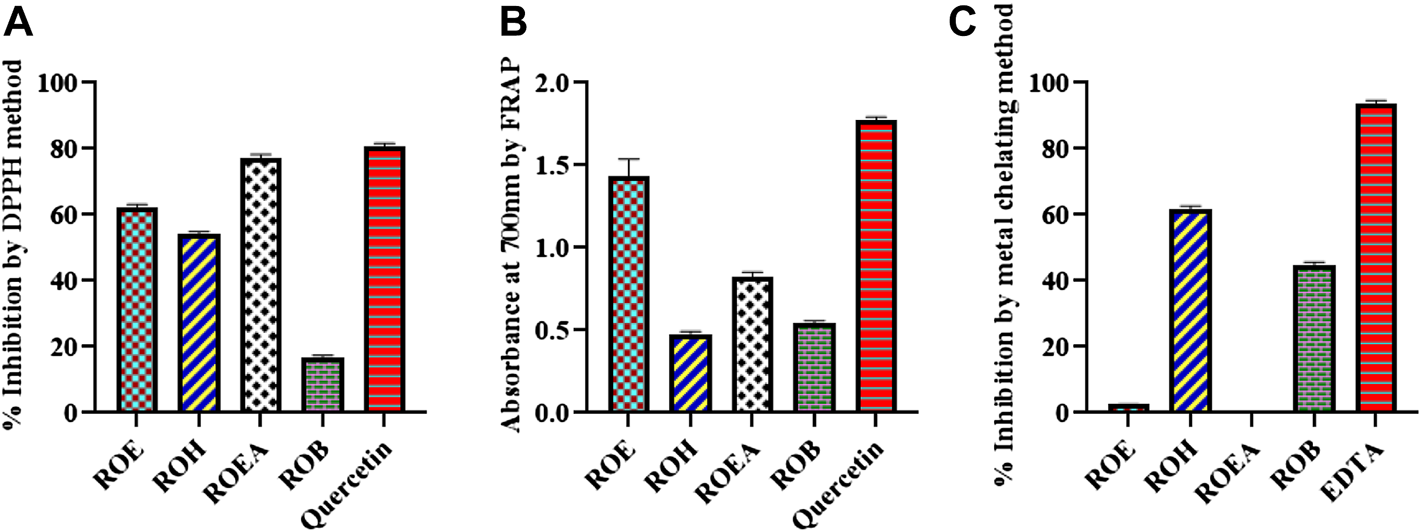
Graphical representation of the antioxidant activity through DPPH (A), FRAP (B), and metal chelating assay (C) of aerial extract/fractions of R. odorata.
TABLE 5
| Sample codes | DPPH radical scavenging activity (inhibition % ± S.D.a) | FRAP (absorbance at 700 nm ± S.D.)b | Metal-chelating capacity (inhibition % ± S.D.) |
|---|---|---|---|
| ROE | 62.13 ± 0.62 | 1.32 ± 0.01 | 2.53 ± 0.38 |
| ROH | 54.10 ± 0.70 | 0.48 ± 0.01 | 62.61 ± 1.01 |
| ROEA | 76.31 ± 1.86 | 0.80 ± 0.02 | NAc |
| ROB | 16.48 ± 0.87 | 0.53 ± 0.02 | 44.35 ± 1.83 |
| Quercetind | 80.89 ± 0.54 | 1.76 ± 0.02 | |
| EDTAe | 94.57 ± 0.62 |
Antioxidant activities of the R. odorata extract/fractions.
Standard deviation (n: 3).
Higher absorbance indicates higher antioxidant activity in FRAP.
No activity.
Reference for DPPH, radical scavenging activity at 1000 μg/ml.
Reference for metal-chelating capacity at 2000 μg/ml. Extract/fractions concentration for DPPH, FRAP, and metal chelating assay remained at 5 mg/ml in methanol.
3.5 Enzyme inhibition studies
Enzyme inhibitory potential of R. odorata (Figure 2; Table 6) was also assessed against five enzymes of clinical significance, which include AChE, BChE, TYR, urease, and CA. All of the test samples were found active against urease and CA, while ROEA extract had a maximum inhibition (IC50 values of 2.78 ± 0.42 mg/ml and 3.95 ± 0.13 mg/ml, respectively) against both the enzymes. The ROE, ROB, and ROH fractions were next in line of activity level (Table 6). In this assay, the standard compounds thiourea and acetazolamide showed IC50 values of 0.54 ± 0.11 mg/ml and 0.54 ± 0.08 mg/ml, respectively.
FIGURE 2
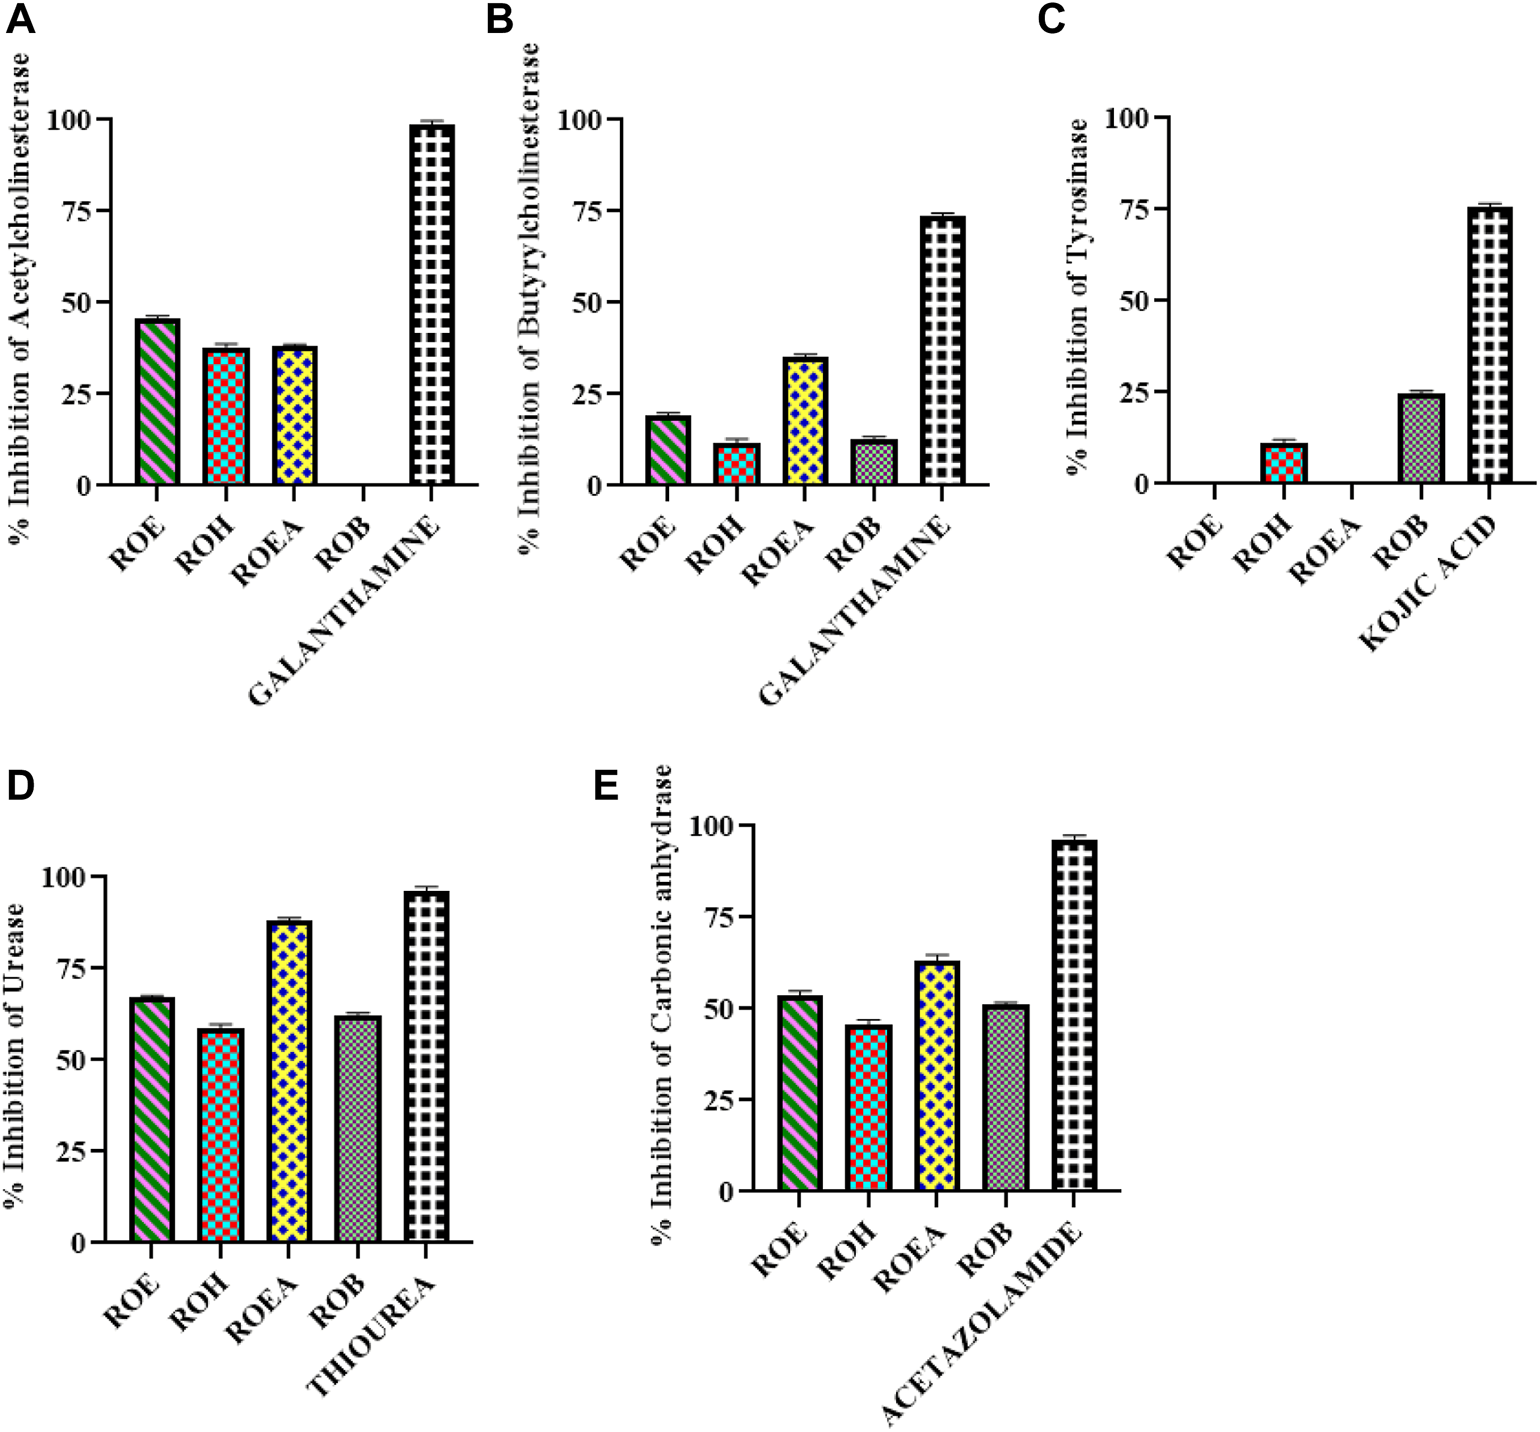
Graphical representation of AChE (A), BChE (B), TYR (C), urease (D), and CA (E) inhibition of aerial extract/fractions of R. odorata.
TABLE 6
| Sample codes | AChE (inhibition % ± S.D.a) At 200 µg/mL | BChE (inhibition % ± S.D.) at 200 μg/ml | TYR (inhibition % ± S.D.) at 100 μg/ml | Urease (inhibition % ± S.D.) at 5,000 μg/ml, IC50 (mg/ml) | CA (inhibition % ± S.D.) at 5,000 μg/ml, IC50 (mg/ml) |
|---|---|---|---|---|---|
| ROE | 45.85 ± 2.27 | 19.72 ± 2.52 | NAb | 67 ± 0.43 (IC50 : 3.94 ± 0.20) | 52 ± 2.13 (IC50 : 4.69 ± 0.35) |
| ROH | 38.92 ± 4.34 | 10.5 ± 0.15 | 10.52 ± 0.94 | 59 ± 0.62 (IC50 : 4.06 ± 0.18) | 44 ± 1.57 |
| ROEA | 37.67 ± 1.22 | 34.69 ± 3.56 | NA | 88 ± 0.39 (IC50 : 2.78 ± 0.42) | 64 ± 0.83 (IC50 : 3.95 ± 0.13) |
| ROB | NA | 11.48 ± 3.01 | 24.52 ± 2.46 | 61 ± 0.74 (IC50 : 4.08 ± 0.21) | 51 ± 0.82 (IC50 : 4.82 ± 0.07) |
| Galantaminec | 97.11 ± 1.26 (IC50: 0.68 ± 0.05 μg/ml) | 72.88 ± 2.61 (IC50: 42.85 ± 5.72 μg/ml) | |||
| α-Kojic acidd | 76.58 ± 0.85 (IC50: 52.42 ± 2.67 μg/ml) | ||||
| Thioureae | 97 ± 0.39 (IC50 : 0.54 ± 0.11) | ||||
| Acetazolamidef | 96 ± 0.51 (IC50 : 0.54 ± 0.08) |
Enzyme inhibitory activities of R. odorata extract/fractions.
Standard deviation (n: 3).
No activity.
Reference (100 μg/ml) for AChE and BChE inhibition.
Reference (200 μg/ml) for TYR inhibition.
Reference (0.375 mM) for urease inhibition.
Reference (0.1 mM) for CA inhibition.
3.6 Antiviral activity
COVID-19, a recent global pandemic produced by SARS-CoV-2, has wreaked havoc on communities all over the world. There is no specific drug to treat COVID-19 at the moment for the pandemic; therefore, it is very crucial to look into all possibilities for developing a much-needed therapeutic medication against SARS-CoV-2 (Stasi et al., 2020). As a result, antiviral research on infectious bronchitis virus (IBV) is very important, which has properties comparable to the coronavirus (Wang et al., 2020) and should be useful as a target microorganism in the development of novel antiviral medicines. Furthermore, infected bursal disease virus (IBDV) is also a devastating virus due to the lack of antiviral brands on the market. Several studies have discovered evidence of the usage of therapeutic herbs to treat the deadly IBDV (Pant et al., 2012). IBDV is often known as HIV for poultry since it causes immunosuppression (HIV causes AIDS in humans) (Fauci, 2003). Consequently, an antiviral study of all of the fractions of R. odorata extract was carried out against four viruses, including IBV and IBDV, and significant results were obtained as shown in Table 7. The experiment was performed with a concentration of 25 mg/ml in methanol for each extract/fraction; PBS was used as a –ve control, while acyclovir was used as a +ve control. The numbers in Table 7 indicate the titer score. The extracts’ efficacy was measured in terms of viral growth; therefore, the titer score is directly proportional to the number of viral particles (Musaddiq et al., 2020). In this work, the extract and fractions showed good antiviral efficacy against all of the target viruses, including avian influenza virus (AIV) H9N2, IBV, Newcastle disease virus (NDV), and (IBDV), with very little viral titer growth (Table 7; Figures 3–6). ROH and ROB extracts showed a weaker antiviral activity with a viral titer of 64 (NDV) and 16 (IBDV), whereas ROE expressed good activity with a viral titer of 0–2 against all of the viruses and ROEA displayed the highest activity with no viral titer. These activities were also correlated with the phenolic and flavonoid contents. Therefore, it is concluded that R. odorata may have a notable potential as an antiviral agent or may pave the way for the development of novel antiviral compounds derived from this plant to battle viral infections.
TABLE 7
| Sample codes | H9N2 | Control | IBV | Control | NDV | Control | IBDV | Control |
|---|---|---|---|---|---|---|---|---|
| ROE | 00 | 2048 | 00 | 1024 | 02 | 2048 | 02 | 1024 |
| ROH | 08 | 2048 | 16 | 1024 | 64 | 2048 | 00 | 1024 |
| ROEA | 00 | 2048 | 00 | 1024 | 00 | 2048 | 00 | 1024 |
| ROB | 02 | 2048 | 00 | 1024 | 00 | 2048 | 16 | 1024 |
Antiviral activities of R. odorata extract/fractions against H9, IBV, NDV, and IBDV viral strains.
FIGURE 3
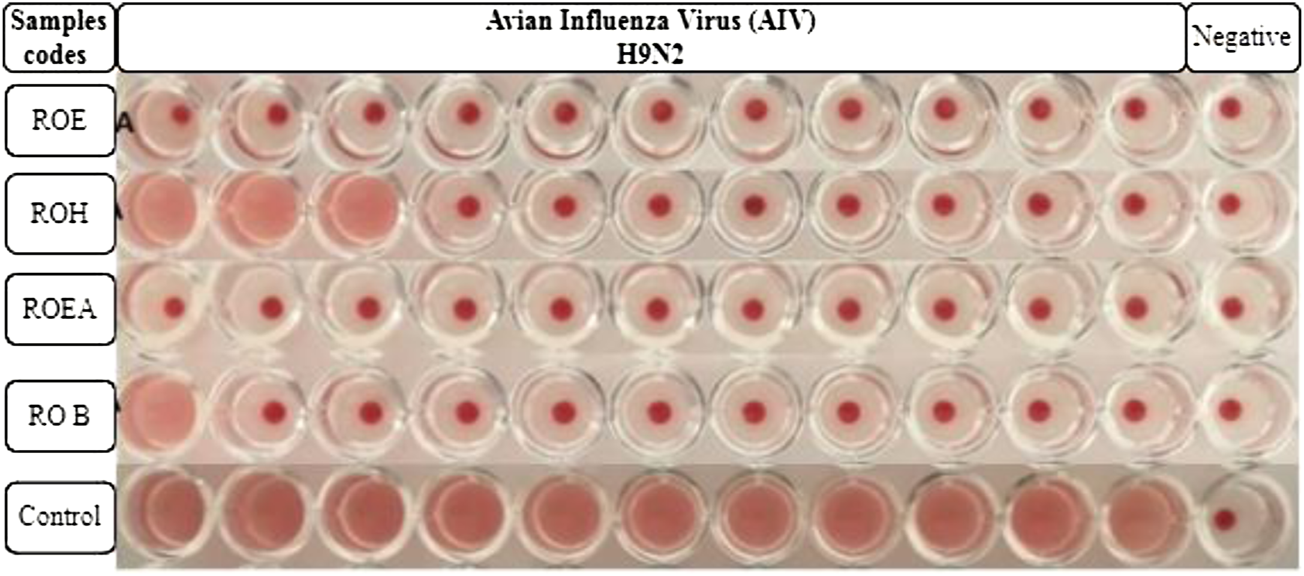
Antiviral activity of all of the extracts against avian influenza virus (AIV) H9N2.
FIGURE 4
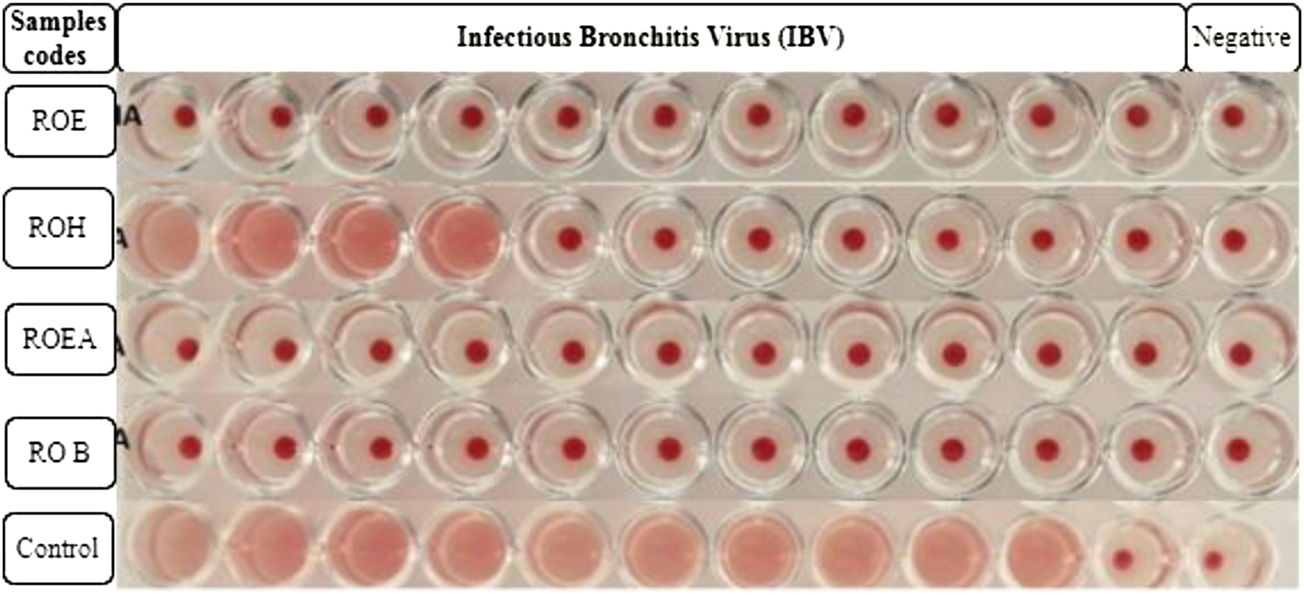
Antiviral activity of all of the extracts against infectious bronchitis virus (IBV).
FIGURE 5
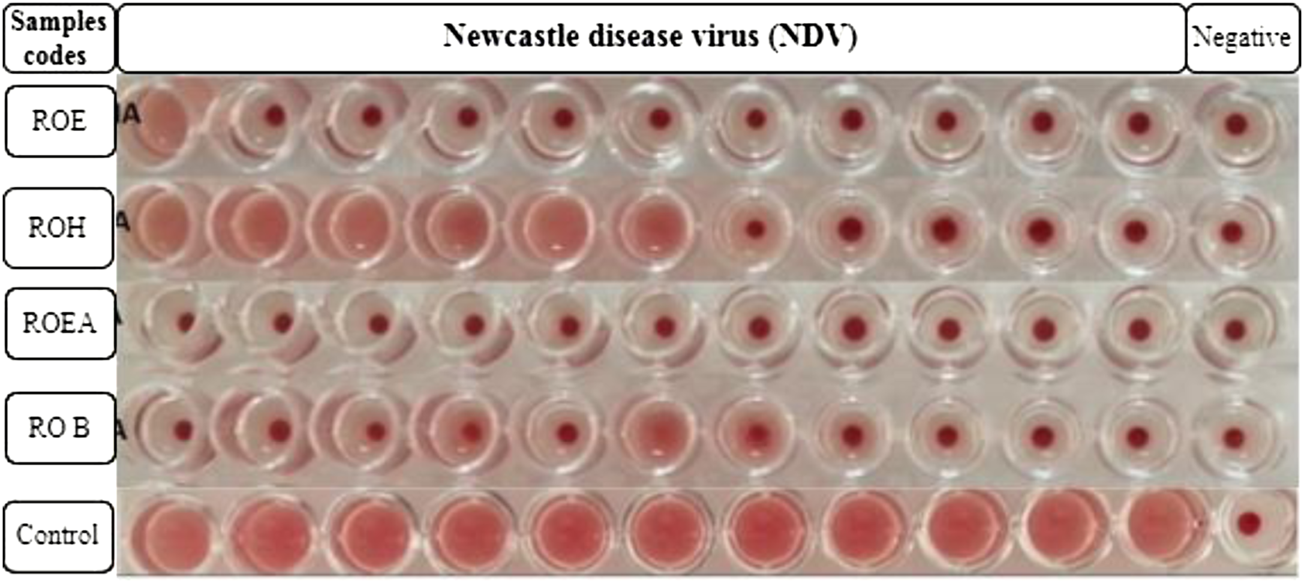
Antiviral activity of all of the extracts against Newcastle disease virus (NDV).
FIGURE 6
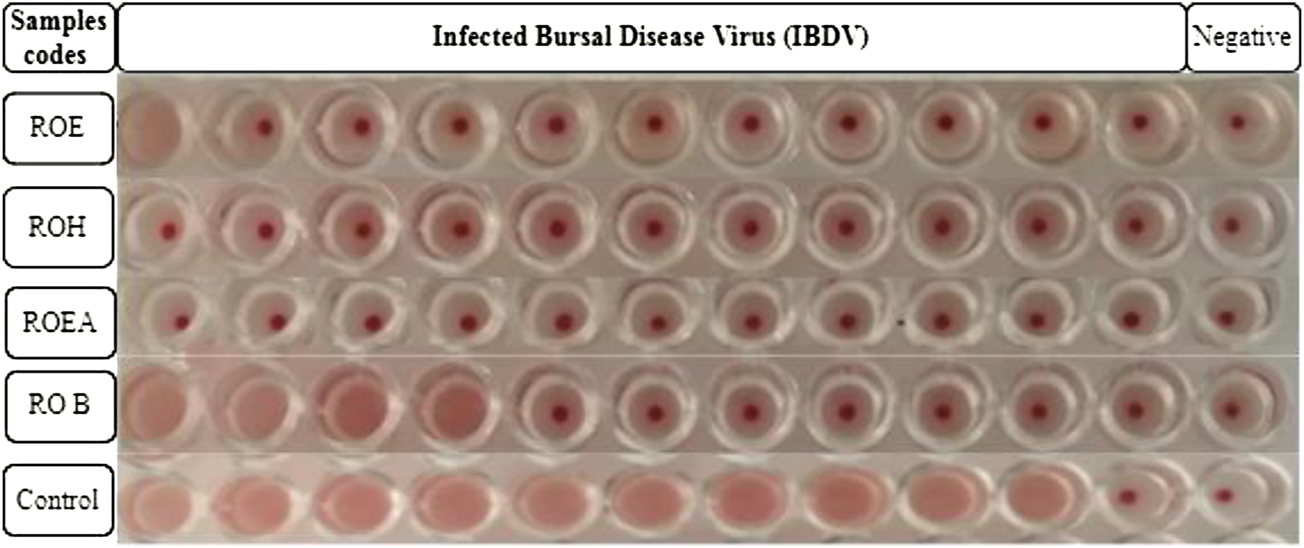
Antiviral activity of all of the extracts against infected bursal disease virus (IBDV).
3.7 Hemolytic activity
In order to check the cytotoxic activity of the plant extract and its fractions, the hemolysis assay, which causes lysis and cell death by damaging the cytoplasmic membrane of red blood cells, was performed. All of the extracts showed very weak hemolytic activity as presented in Table 8. This study indicated that the plant is safe to be used as a potential medicinal herb.
TABLE 8
| Sample codes | Hemolysis % | Thrombolytic activity % |
|---|---|---|
| ROE | 10.1 | 3.8 |
| ROH | 7.2 | 3.8 |
| ROEA | 8.7 | 3.8 |
| ROB | 2.2 | 13.5 |
| Triton × 100 (control) | 93.5 | — |
| PBS | 0.0 | — |
| Streptokinase (references) | 91.1 |
Cytotoxic and thrombolytic activities of R. odorata extract/fractions.
3.8 Thrombolytic activity
A major problem among non-communicable diseases is failure of hemostasis, which causes thrombus (blood clot) development and may cause a partial or complete blockage in small vessels of the blood circulatory system. This arterial blockage can result in life-threatening thrombotic disorders, including acute myocardial or cerebral infarction leading to death (Merlyn Keziah and Subathra Devi, 2018). Thrombolytic medicines such as streptokinase, alteplase, anistreplase, urokinase, and tissue plasminogen activator (tPA) are commonly used to dissolve thrombus. Most of them are synthetic and have side effects. Additionally, people from developing countries have very little access to modern health facilities and they keenly depend on the local medicinal system (Li et al., 2020). Therefore, there is a critical need to explore indigenous sources for novel, safer, and more effective thrombolytic agents. In the current work, all extracts were checked for their thrombolytic activity and ROB was found to be the most active fraction among all extracts (Table 8). ROB could have glycosides of various metabolites, which predicts that highly polar metabolites could be responsible for this activity.
3.9 Docking studies
Molecular docking provides a scaffold to understand the biomolecular interactions between potential drugs and receptor proteins. The docking of compounds with potential drug targets helps in understanding the mechanistic approach of how it binds with its receptor proteins through noncovalent interactions and gives an idea about the stability of ligand–receptor complex along with potential efficacy and specificity (Rohs et al., 2005; Guedes et al., 2014). Therefore, docking studies of some compounds were performed, which were selected on the base concentration with respect to class, and results are presented in Table 9 and Table 10.
TABLE 9
| Ligands | CA | Urease | ||
|---|---|---|---|---|
| Binding free energy | Estimated inhibition constant | Binding free energy | Estimated inhibition constant | |
| a Control | −6.65 | 13.37 uM | −3.11 | 5.27 mM |
| Caryoptosidic acid | −5.73 | 63.50 uM | −5.07 | 191.93 uM |
| Methymycin | −7.90 | 1.61 uM | −2.28 | 21.34 mM |
| Minabeolide-1 | −9.59 | 93.81 nM | −6.85 | 9.52 uM |
| Minabeolide-8 | −9.57 | 96.19 nM | −9.00 | 253.77 nM |
| Norselic acid | −7.80 | 1.92 uM | −5.37 | 116.12 uM |
| Piperolactam A | −7.54 | 2.95 uM | −6.30 | 24.09 uM |
Binding free energy and inhibition constants of docked complexes against CA and urease enzymes.
For CA, acetazolamide is used as a reference, while for urease, thiourea is used as a reference compound for docking studies.
TABLE 10
| Ligands | Bond category | Bond distance | Bond type | Interactions | |||
|---|---|---|---|---|---|---|---|
| Residue name and groups | From chemistry | Residue name and groups | To chemistry | ||||
| Interaction patterns for urease enzyme | |||||||
| Acetazolamide | Hydrogen bond | 2.84853 | Conventional hydrogen bond | A:SER65:HG:B | C-H | A:AZM263:O2 | H-Acceptor |
| 2.77235 | A:GLN92:HE22 | A:AZM263:N1 | |||||
| 2.76614 | A:THR199:HG1 | A:AZM263:N2 | |||||
| Electrostatic | 3.3013 | Pi–Cation | A:ZN262:ZN | Positive | A:AZM263 | ||
| Hydrogen bond | 3.60807 | Pi–Donor hydrogen bond | A:AZM263:N1 | H-Donor | A:HIS94 | Pi-Orbitals | |
| Other | 3.76389 | Pi–Sulfur | A:AZM263:S1 | Sulfur | A:HIS94 | Pi-Orbitals | |
| Hydrophobic | 4.22618 | Pi–Pi Stacked | A:HIS94 | Pi-Orbitals | A:AZM263 | Pi-Orbitals | |
| Hydrophobic | 4.1873 | Alkyl | A:AZM263:C4 | Alkyl | A:VAL143 | Alkyl | |
| 4.35352 | A:AZM263:C4 | A:LEU198 | |||||
| 4.01591 | A:AZM263:C4 | A:VAL207 | |||||
| Hydrophobic | 4.71578 | Pi–Alkyl | A:TRP209 | Pi-Orbitals | A:AZM263:C4 | Alkyl | |
| 4.13746 | A:TRP209 | A:AZM263:C4 | |||||
| Minabeolide-1 | Hydrophobic | 3.60303 | Pi–Sigma | LIG:C | C-H | A:HIS94 | Pi-Orbitals |
| Hydrophobic | 4.86143 | Alkyl | A:LEU198 | Alkyl | LIG | Alkyl | |
| 4.62259 | LIG:C | A:VAL135 | |||||
| 4.95599 | LIG:C | A:PRO202 | |||||
| 3.6865 | LIG:C | A:VAL143 | |||||
| 4.56869 | LIG:C | A:LEU198 | |||||
| 3.55419 | LIG:C | A:VAL207 | |||||
| 3.26595 | LIG:C | A:VAL121 | |||||
| 4.78682 | LIG:0043 | A:LEU141 | |||||
| 4.0555 | LIG:C | A:VAL143 | |||||
| 4.74499 | LIG:C | A:LEU198 | |||||
| Hydrophobic | 5.00704 | Pi–Alkyl | A:HIS94 | Pi-Orbitals | LIG | Alkyl | |
| 4.96148 | A:HIS96 | LIG:C | |||||
| 5.17453 | A:PHE131 | LIG:C | |||||
| 5.3508 | A:PHE131 | LIG | |||||
| 4.53749 | A:TRP209 | LIG:C | |||||
| 4.02569 | A:TRP209 | LIG:C | |||||
| Minabeolide-8 | Hydrogen bond | 3.16814 | Carbon hydrogen bond | A:HIS64:CE1:B | H-Donor | LIG:O | H-Acceptor |
| Hydrophobic | 3.7703 | Pi–Sigma | LIG:C | C-H | A:HIS94 | Pi-Orbitals | |
| Hydrophobic | 3.50985 | Alkyl | LIG:C | Alkyl | A:VAL143 | Alkyl | |
| 5.12415 | LIG:C | A:LEU198 | |||||
| 4.33114 | LIG:C | A:PRO202 | |||||
| Hydrophobic | 4.29031 | Pi–Alkyl | A:HIS94 | Pi-Orbitals | LIG | Alkyl | |
| 5.17523 | A:HIS94 | LIG | |||||
| 5.00028 | A:HIS96 | LIG | |||||
| 4.66563 | A:HIS96 | LIG:C | |||||
| 5.1792 | A:HIS119 | LIG | |||||
| 5.18126 | A:TRP209 | LIG:C | |||||
| 4.08923 | A:TRP209 | LIG:C | |||||
| Interaction patterns for urease enzyme | |||||||
| Thiourea | Hydrogen bond | 2.23669 | Conventional hydrogen bond | A:THR520:HN | H-Donor | A:TOU101:S | H-Acceptor |
| 2.9712 | A:HIS545:HD1 | A:TOU101:S | |||||
| 2.82557 | A:TOU101:N2 | A:ILE518:O | |||||
| Other | 4.18268 | Pi–Sulfur | A:TOU101:S | Sulfur | A:HIS545 | Pi-Orbitals | |
| Minabeolide-1 | Hydrogen bond | 2.74059 | Conventional hydrogen bond | A:HIS519:HE2 | H-Donor | LIG:O | H-Acceptor |
| Other | 2.71871 | Sulfur–X | A:MET588:SD | Sulfur | LIG:O | O,N,S | |
| Hydrophobic | 3.05226 | Alkyl | A:ALA440 | Alkyl | LIG:C | Alkyl | |
| 4.42443 | A:ALA440 | LIG | |||||
| 4.94936 | A:ALA636 | LIG | |||||
| 4.4799 | LIG:C | A:ARG439 | |||||
| 3.77426 | LIG:C | A:MET588 | |||||
| 4.70633 | LIG:C | A:MET637 | |||||
| Hydrophobic | 4.26942 | Pi–Alkyl | A:HIS492 | Pi-Orbitals | LIG:C | Alkyl | |
| 4.1535 | A:HIS593 | LIG | |||||
| Minabeolide-8 | Hydrophobic | 4.47773 | Alkyl | A:ALA440 | Alkyl | LIG | Pi-Orbitals |
| 4.46281 | LIG:C | A:MET588 | |||||
| 5.31266 | LIG | A:MET588 | |||||
| 4.54221 | LIG:C | A:ARG439 | |||||
| Hydrophobic | 4.04795 | Pi–Alkyl | A:HIS593 | Pi-Orbitals | LIG | Alkyl | |
Binding interaction patterns of best-docked complexes for urease.
3.9.1 Postdock analysis
The docking results were analyzed on the basis of RMSD clustering, and top-ranked clusters were identified. Thiourea was used as the reference for urease docking while acetazolamide was the reference for CA. The validation of the docking protocol was performed through the redocking of co-crystallized ligands for their respective enzymes. The redocking of co-crystallized ligands showed that acetazolamide showed an RMSD of 1.203 A° from co-crystallized ligand (Figure 7A) while thiourea exhibited an RMSD of 0.621 A° (Figure 7B). The re-docking results validate that the docking protocol as RMSD within the range of 2 A° is acceptable (Kramer et al., 1999). The comparison of the binding potential of compounds to the reference compound revealed that all of the compounds except methymycin showed an increased binding affinity against urease than thiourea, while the binding potential of caryoptosidic acid for CA is less than that of the reference. The docking studies revealed that these compounds have a better binding potential for urease and CA (Table 9). Docking results revealed that compounds minabeolide-1 and -8 exhibited binding free energy of −9.59 and −9.57 kcal/mol, respectively, against CA, while acetazolamide as the reference has a binding potential of −6.65 kcal/mol. This indicates that these two compounds interact more efficiently with active site residue of carbonic anhydrase than acetazolamide. The clustering of ligands showed that all ligands cluster within the active site of CA (Figure 8). These two compounds outperformed in docking studies against urease and showed the binding potential of −6.85 and −9.00 kcal/mol, respectively. All ligands were visualized on the co-crystallized ligand of carbonic anhydrase (Figure 8A) and urease (Figure 8B) via Discovery Studio Visualizer in order to obtain an insight if these ligands bind at the same site. For carbonic anhydrase, all ligands superimposed on acetazolamide present within the active site of the crystal structure and interacted with amino acid residues within active site of the enzyme, as shown in Figure 8A. The same pattern was observed for urease enzyme (Figure 8B): the top docked conformation of all ligands was bound at the same active site and found to be superimposed on thiourea when visualized. The top binding poses of all ligands were clustered within the active site of the receptor protein (Figure 7).
FIGURE 7
(A) Superimposed re-docked acetazolamide (brick red) on co-crystallized acetazolamide (turquoise colored). (B) Superimposed re-docked thiourea (brick red) on co-crystallized thiourea (turquoise colored). Binding interaction patterns for carbonic anhydrase and urease in complex with ligands having high affinity toward respective enzymes.
FIGURE 8
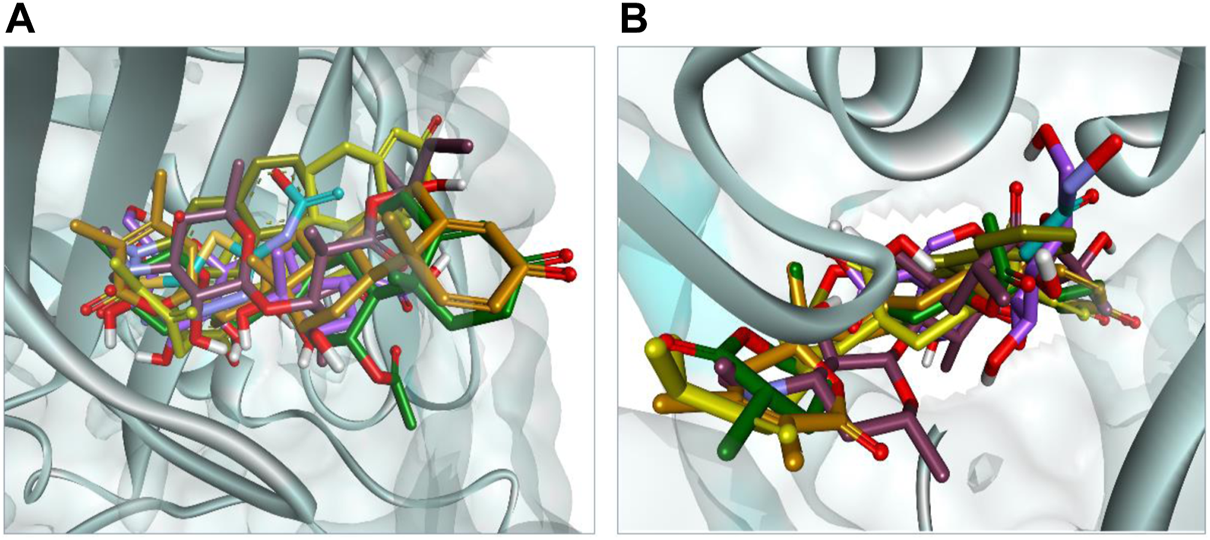
(A) Binding pose of top-ranked docked conformation of all ligands compared on co-crystallized acetazolamide (turquoise colored) with in active site of carbonic anhydrase. (B) Binding pose of top-ranked docked conformation of all ligands compared on co-crystallized thiourea (turquoise colored) with in active site of urease.
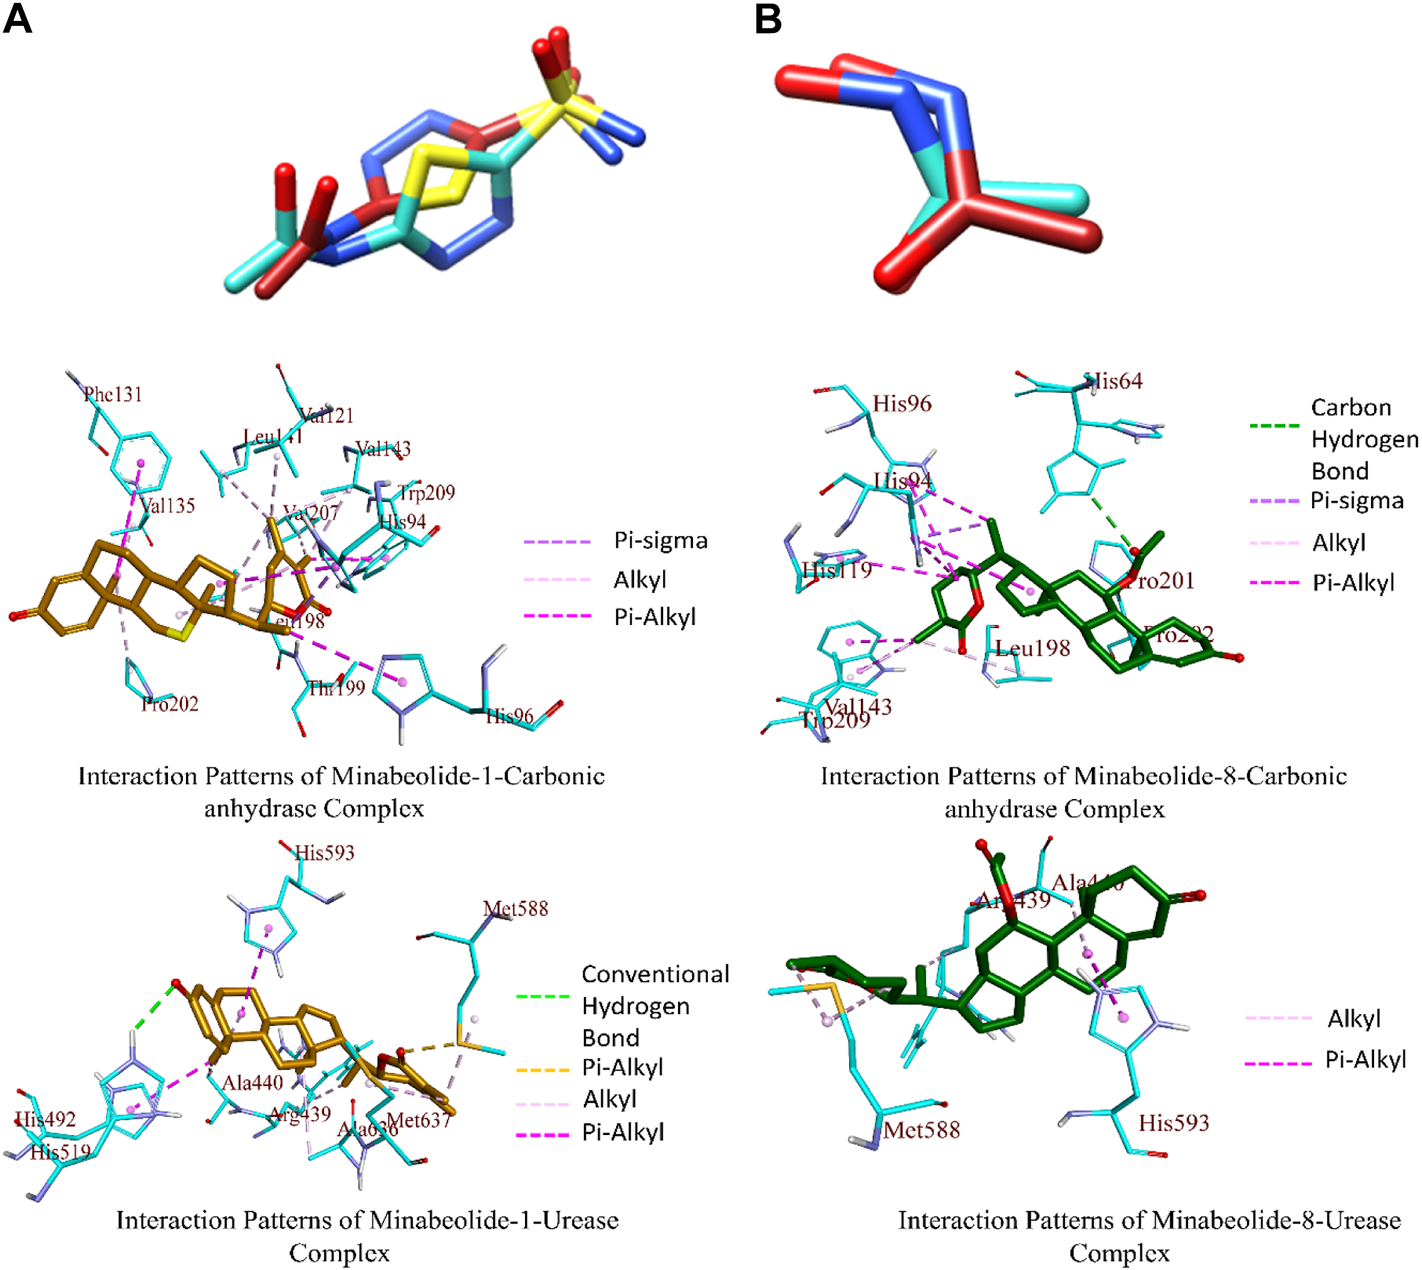
The top-ranked docked complexes were further analyzed through the Discovery Studio Visualizer to identify the binding interaction patterns. The minabeolide-1 mediated three types of hydrophobic interactions with CA, namely, pi–sigma, alkyl, and pi–alkyl. The amino acid residue HIS94 mediated pi–sigma interactions; LEU198, VAL135, PRO202, VAL143, LEU198, VAL207, VAL121, LEU141, and LEU198 mediated alkyl-type interactions, while HIS94, HIS96, PHE131, and TRP209 mediated pi–alkyl interactions involving pi-orbitals of ligand (Figure 7). The analysis of binding interactions for minabeolide-8 exhibited that HIS64 was involved in forming a carbon–hydrogen bond, and pi–sigma bond was mediated by HIS94 (Figure 7). The alkyl and pi–alkyl interactions were also mediated by a number of protein residues provided in Table 10.
The minabeolide-1 and -8 also outperformed in the case of docking studies against urease. The analysis of the binding interaction of these two compounds showed that minabeolide-1 mediated conventional hydrogen bond, hydrophobic interactions, and some other interactions involving sulfur of MET588 residue of proteins, while minabeolide-8 mediated two types of hydrophobic interactions, namely, alkyl and pi–alkyl interactions. The details of interactions, residues involved, and bond distance are provided in Table 10.
4 Conclusion
The present study offers a deep insight into the chemical and biological diversity of R. odorata. Estimation of total bioactive contents revealed that this plant produces a high amount of phenolics and flavonoids with significant antioxidant activity, which offers the candidature of this plant as a potential ingredient of nutraceuticals and functional foods. The presence of diverse secondary metabolites and a variety of biological activities of the extract and fractions of R. odorata substantiates the aforementioned deduction. Since it is the first investigation on R. odorata, further studies may unveil this plant as a promising source of antioxidant, antibacterial, antiulcer, diuretic, and antiviral agents. Thus, further in vivo studies and toxicity testing on R. odorata are strongly recommended to authenticate this plant as a prospective source of natural biologically active agents.
Statements
Data availability statement
The original contributions presented in the study are included in the article/Supplementary Materials; further inquiries can be directed to the corresponding authors.
Author contributions
AK, SA, MS, K-RK, UK, and MT: conceptualization, methodology, and performed the experiments, investigation and writing—original draft. IO, NA, MI and MY: investigation, data analysis, performed the experiments and writing—original draft, ST, RU, JK, and SC: conceptualization, writing—original draft, software, and docking studies.
Acknowledgments
MI expresses appreciation to the Deanship of Scientific Research at King Khalid University Saudi Arabia through the research groups program under Grant Number R.G.P. 2/3/42. SC is grateful for support from the Affiliated Hospital of Southwest Medical University, China.
Conflict of interest
The authors declare that the research was conducted in the absence of any commercial or financial relationships that could be construed as a potential conflict of interest.
Publisher’s note
All claims expressed in this article are solely those of the authors and do not necessarily represent those of their affiliated organizations, or those of the publisher, the editors, and the reviewers. Any product that may be evaluated in this article, or claim that may be made by its manufacturer, is not guaranteed or endorsed by the publisher.
References
1
Andleeb R. Ashraf A. Muzammil S. Naz S. Asad F. Ali T. et al (2020). Analysis of bioactive composites and antiviral activity of Iresine herbstii extracts against Newcastle disease virus in ovo. Saudi J. Biol. Sci.27, 335–340. 10.1016/j.sjbs.2019.10.002
2
Ashiq U. Jamal R. A. Saleem M. Mahroof-Tahir M. (2017). Alpha-glucosidase and carbonic anhydrase inhibition studies of Pd (II)-hydrazide complexes. Arabian J. Chem.10, 488–499. 10.1016/j.arabjc.2015.02.024
3
Balouiri M. Sadiki M. Ibnsouda S. K. (2016). Methods for in vitro evaluating antimicrobial activity: A review. J. Pharm. analysis6, 71–79. 10.1016/j.jpha.2015.11.005
4
Barros L. Baptista P. Ferreira I. C. (2007). Effect of Lactarius piperatus fruiting body maturity stage on antioxidant activity measured by several biochemical assays. Food Chem. Toxicol.45, 1731–1737. 10.1016/j.fct.2007.03.006
5
Bashir K. Ahmad B. Rauf A. Bawazeer S. Ur Rahman K. Rehman T. et al (2017). Urease inhibition potential and molecular docking of dihydroquercetin and dihydromyricetin isolated from Picea smithiana (wall) Boiss. Biomed. Res.28.
6
Baumann J. (1979). Prostaglandin synthetase inhibiting O_2-radical scavenging properties of some flavonoids and related phenolic compounds. Schmiedeb. Arch. Pharmacol.308, 27–32.
7
Carlomagno A. Pardini A. Contino Y. , Medicinal plants in ethnobotanical and religious traditions in Cuba: A first review and updating. (2015).
8
Carter P. (1971). Spectrophotometric determination of serum iron at the submicrogram level with a new reagent (ferrozine). Anal. Biochem.40, 450–458. 10.1016/0003-2697(71)90405-2
9
Diaconu M. Pavel L. V. Hlihor R.-M. Rosca M. Fertu D. I. Lenz M. et al (2020). Characterization of heavy metal toxicity in some plants and microorganisms—a preliminary approach for environmental bioremediation. New Biotechnol.56, 130–139. 10.1016/j.nbt.2020.01.003
10
Fauci A. S. (2003). HIV and AIDS: 20 years of science. Nat. Med.9, 839–843. 10.1038/nm0703-839
11
Firuzi O. Javidnia K. Gholami M. Soltani M. Miri R. (2010). Antioxidant activity and total phenolic content of 24 Lamiaceae species growing in Iran. Nat. Product. Commun.5, 1934578X1000500. 10.1177/1934578x1000500219
12
Guedes I. A. de Magalhães C. S. Dardenne L. E. J. B. r. (2014). Receptor–ligand molecular docking. Biophys. Rev.6, 75–87. 10.1007/s12551-013-0130-2
13
Harazem R. El Rahman S. A. El-Kenawy A. (2019). Evaluation of antiviral activity of allium cepa and allium sativum extracts against Newcastle disease virus. Alex. J. Vet. Sci.61, 108. 10.5455/ajvs.29663
14
Hatano T. Kagawa H. Yasuhara T. Okuda T. (1988). Two new flavonoids and other constituents in licorice root: Their relative astringency and radical scavenging effects. Chem. Pharm. Bull.36, 2090–2097. 10.1248/cpb.36.2090
15
Heitzman M. E. Neto C. C. Winiarz E. Vaisberg A. J. Hammond G. B. (2005). Ethnobotany, phytochemistry and pharmacology of uncaria (Rubiaceae). Phytochemistry66, 5–29. 10.1016/j.phytochem.2004.10.022
16
Hossain M. A. Weli A. M. Ahmed S. H. I. (2019). Comparison of total phenols, flavonoids and antioxidant activity of various crude extracts of Hyoscyamus gallagheri traditionally used for the treatment of epilepsy. Clin. Phytosci.5, 20–28. 10.1186/s40816-019-0114-2
17
Huang D. Ou B. Prior R. L. (2005). The chemistry behind antioxidant capacity assays. J. Agric. Food Chem.53, 1841–1856. 10.1021/jf030723c
18
Ji H. F. Li X. J. Zhang H. Y. (2009). Natural products and drug discovery: Can thousands of years of ancient medical knowledge lead us to new and powerful drug combinations in the fight against cancer and dementia?EMBO Rep.10, 194–200.
19
Khan S. Nazir M. Saleem H. Raiz N. Saleem M. Anjum S. M. M. et al (2019). Valorization of the antioxidant, enzyme inhibition and phytochemical propensities of berberis calliobotrys bien. Ex koehne: A multifunctional approach to probe for bioactive natural products. Industrial Crops Prod.141, 111693. 10.1016/j.indcrop.2019.111693
20
Khouya T. Ramchoun M. Hmidani A. Amrani S. Harnafi H. Benlyas M. et al (2015). Anti-inflammatory, anticoagulant and antioxidant effects of aqueous extracts from Moroccan thyme varieties. Asian pac. J. Trop. Biomed.5, 636–644. 10.1016/j.apjtb.2015.05.011
21
Koike K. Cordell G. A. Farnsworth N. R. Freer A. A. Gilmore C. J. Sim G. A. (1980). New cytotoxic diterpenes from Rondeletia panamensis (Rubiaceae). Tetrahedron36, 1167–1172. 10.1016/0040-4020(80)87013-x
22
Kothandan R. Rajan C. A. S. G. Arjun J. Raj R. R. M. Syed S. (2021). Virtual screening of phytochemical compounds as potential inhibitors against SARS-CoV-2 infection. Beni. Suef. Univ. J. Basic Appl. Sci.10, 9–7. 10.1186/s43088-021-00095-x
23
Kramer B. Rarey M. Lengauer T. J. P. S. (1999). Evaluation of the FLEXX incremental construction algorithm for protein-ligand docking. Proteins.37, 228–241. 10.1002/(sici)1097-0134(19991101)37:2<228::aid-prot8>3.0.co;2-8
24
Labiad M. Harhar H. Ghanimi A. Tabyaoui M. (2017). Phytochemical screening and antioxidant activity of Moroccan Thymus satureioïdes extracts. J. Mater. Environ. Sci.8, 2132–2139.
25
Lakić N. S. Mimica-Dukić N. M. Isak J. M. Božin B. N. (2010). Antioxidant properties of Galium verum L.Rubiaceae extracts. Open Life Sci.5, 331–337. 10.2478/s11535-010-0022-4
26
Lantto T. A. Dorman H. D. Shikov A. N. Pozharitskaya O. N. Makarov V. G. Tikhonov V. P. et al (2009). Chemical composition, antioxidative activity and cell viability effects of a Siberian pine (Pinus sibirica Du Tour) extract. Food Chem.112, 936–943. 10.1016/j.foodchem.2008.07.008
27
Li T. Yuan D. Yuan J. (2020). Antithrombotic drugs—Pharmacology and perspectives. Adv. Exp. Med. Biol.1177, 101–131. 10.1007/978-981-15-2517-9_4
28
List P. (2013). Version 1.1. Published on the internet. Available at http://www.theplantlist.org (accessed January 31, 2016).
29
Malik S. Ahmad S. Chaudhary I. (1985). Nigellimine N-oxide-a new isoquinoline alkaloid from the seeds of Nigella sativa. Heterocycles (Sendai)23, 953–955. 10.3987/r-1985-04-0953
30
Manoharan N. Jayamurali D. Parasuraman R. Govindarajulu S. (2021). Phytochemical composition, therapeutical and pharmacological potential of Nigella sativa: A review. Tradit. Med. Res.6, 32. 10.53388/tmr20210118216
31
Martins D. Nunez C. V. (2015). Secondary metabolites from Rubiaceae species. Molecules20, 13422–13495. 10.3390/molecules200713422
32
Mashkor I. (2014). Phenolic content and antioxidant activity of fenugreek seeds extract. Int. J. Pharmacogn. Phytochemical Res.6, 841–844.
33
Masuda T. Yamashita D. Takeda Y. Yonemori S. (2005). Screening for tyrosinase inhibitors among extracts of seashore plants and identification of potent inhibitors from Garcinia subelliptica. Biosci. Biotechnol. Biochem.69, 197–201. 10.1271/bbb.69.197
34
Mavi A. Terzi Z. Özgen U. Yildirim A. Coşkun M. (2004). Antioxidant properties of some medicinal plants: Prangos ferulacea (Apiaceae), Sedum sempervivoides (Crassulaceae), malva neglecta (malvaceae), Cruciata taurica (Rubiaceae), Rosa pimpinellifolia (Rosaceae), Galium verum subsp. verum (Rubiaceae), urtica dioica (urticaceae). Biol. Pharm. Bull.27, 702–705. 10.1248/bpb.27.702
35
Mazza G. (2009). Rondeletia odorata. Monaco nat. Encycl. Available at https://www.monaconatureencyclopedia.com/rondeletia-odorata.
36
Merlyn Keziah S. Subathra Devi C. (2018). Focalization of thrombosis and therapeutic perspectives: A memoir. Orient. Pharm. Exp. Med.18, 281–298. 10.1007/s13596-018-0331-0
37
Michel J. Duarte R. E. Bolton J. L. Huang Y. Caceres A. Veliz M. et al (2007). Medical potential of plants used by the Q’eqchi Maya of Livingston, Guatemala for the treatment of women's health complaints. J. Ethnopharmacol.114, 92–101. 10.1016/j.jep.2007.07.033
38
Mills N. (2006). “ChemDraw ultra 10.0 CambridgeSoft, 100 CambridgePark drive,” in Commercial price: 1910fordownload, 2150 for CD-ROM; academic price: 710fordownload, 800 for CD-ROM (Cambridge, MA: ACS Publications).
39
Musaddiq S. Shahzad M. I. Firdous F. Iqbal A. Tanveer M. Ashraf A. et al (2020). Thiazolidines: Potential anti-viral agents against avian influenza and infectious bronchitis viruses, veterinary research forum, faculty of veterinary medicine. Urmia, Iran: Urmia University, 415.
40
Oyaizu M. (1986). Studies on products of browning reaction antioxidative activities of products of browning reaction prepared from glucosamine. Jpn. J. Nutr. Diet.44, 307–315. 10.5264/eiyogakuzashi.44.307
41
Pant M. Ambwani T. Umapathi V. (2012). Antiviral activity of Ashwagandha extract on infectious bursal disease virus replication. Indian J. Sci. Technol.5, 1–2. 10.17485/ijst/2012/v5i5.20
42
Rehman T. Ahmad S. (2019). Evaluation of antibacterial and antioxidant potential of some homoeopathic mother tinctures. Indian J. Res. Homoeopathy13, 100. 10.4103/ijrh.ijrh_44_17
43
Rohs R. Bloch I. Sklenar H. Shakked Z. J. N. a. r. (2005). Molecular flexibility in ab initio drug docking to DNA: Binding-site and binding-mode transitions in all-atom Monte Carlo simulations. Nucleic Acids Res.33, 7048–7057. 10.1093/nar/gki1008
44
Saleem A. Nasir S. Rasool N. Bokhari T. H. Rizwan K. Shahid M. et al (2015). In vitro antimicrobial and haemolytic studies of Kalanchoe pinnata and Callistemon viminalis. Int. J. Chem. Biochem. Sci.7, 29–34.
45
Sethi S. Joshi A. Arora B. Bhowmik A. Sharma R. Kumar P. (2020). Significance of FRAP, DPPH, and CUPRAC assays for antioxidant activity determination in apple fruit extracts. Eur. Food Res. Technol.246, 591–598. 10.1007/s00217-020-03432-z
46
Slinkard K. Singleton V. L. (1977). Total phenol analysis: Automation and comparison with manual methods. Am. J. enology Vitic.28, 49–55.
47
Soobrattee M. A. Bahorun T. Neergheen V. S. Googoolye K. Aruoma O. I. (2008). Assessment of the content of phenolics and antioxidant actions of the Rubiaceae, Ebenaceae, Celastraceae, Erythroxylaceae and Sterculaceae families of Mauritian endemic plants. Toxicol. vitro22, 45–56. 10.1016/j.tiv.2007.07.012
48
Soto-Sobenis A. Castillo B. Delgado A. González A. Montenegro R. (2001). Alkaloid screening of herbarium samples of Rubiaceae from Panama. Pharm. Biol.39, 161–169. 10.1076/phbi.39.3.161.5925
49
Stasi C. Fallani S. Voller F. Silvestri C. (2020). Treatment for COVID-19: An overview. Eur. J. Pharmacol.889, 173644. 10.1016/j.ejphar.2020.173644
50
Sussman J. L. Lin D. Jiang J. Manning N. O. Prilusky J. Ritter O. et al (1998). Protein Data Bank (PDB): Database of three-dimensional structural information of biological macromolecules. Acta Crystallogr. D. Biol. Crystallogr.54, 1078–1084. 10.1107/s0907444998009378
51
Torey A. Sasidharan S. Latha L. Y. Sudhakaran S. Ramanathan S. (2010). Antioxidant activity and total phenolic content of methanol extracts of Ixora coccinea. Pharm. Biol.48, 1119–1123. 10.3109/13880200903490505
52
Wang Y. Cui X. Chen X. Yang S. Ling Y. Song Q. et al (2020). A recombinant infectious bronchitis virus from a chicken with a spike gene closely related to that of a Turkey coronavirus. Arch. Virol.165, 703–707. 10.1007/s00705-019-04488-3
53
Wojdyło A. Oszmiański J. Czemerys R. (2007). Antioxidant activity and phenolic compounds in 32 selected herbs. Food Chem.105, 940–949. 10.1016/j.foodchem.2007.04.038
54
Zengin G. Nithiyanantham S. Locatelli M. Ceylan R. Uysal S. Aktumsek A. et al (2016). Screening of in vitro antioxidant and enzyme inhibitory activities of different extracts from two uninvestigated wild plants: Centranthus longiflorus subsp. longiflorus and Cerinthe minor subsp. auriculata. Eur. J. Integr. Med.8, 286–292. 10.1016/j.eujim.2015.12.004
55
Zohra T. Ovais M. Khalil A. T. Qasim M. Ayaz M. Shinwari Z. K. (2019). Extraction optimization, total phenolic, flavonoid contents, HPLC-DAD analysis and diverse pharmacological evaluations of Dysphania ambrosioides (L.) Mosyakin & Clemants. Nat. Prod. Res.33, 136–142. 10.1080/14786419.2018.1437428
Summary
Keywords
Rondeletia odorata , phytochemical profiling, in vitro biological activity, docking studies, cytotoxicity assessments
Citation
Khursheed A, Ahmad S, Saleem M, Khan K-u-R, Khan J, Orhan IE, Abaci N, Imran M, Tauseef S, Uddin R, Yawer MA, Tousif MI, Ojha SC and Khurshid U (2022) Phytochemical profiling, in vitro biological activity, docking studies, and cytotoxicity assessments of Rondeletia odorata Jacquin: An unexplored plant of the coffee family. Front. Chem. 10:1017577. doi: 10.3389/fchem.2022.1017577
Received
16 August 2022
Accepted
19 October 2022
Published
11 November 2022
Volume
10 - 2022
Edited by
Parasuraman Jaisankar, Indian Institute of Chemical Biology (CSIR), India
Reviewed by
Suleyman Akocak, Adiyaman University, Türkiye
Xiaoxiao Huang, Shenyang Pharmaceutical University, China
Updates
Copyright
© 2022 Khursheed, Ahmad, Saleem, Khan, Khan, Orhan, Abaci, Imran, Tauseef, Uddin, Yawer, Tousif, Ojha and Khurshid.
This is an open-access article distributed under the terms of the Creative Commons Attribution License (CC BY). The use, distribution or reproduction in other forums is permitted, provided the original author(s) and the copyright owner(s) are credited and that the original publication in this journal is cited, in accordance with accepted academic practice. No use, distribution or reproduction is permitted which does not comply with these terms.
*Correspondence: Muhammad Imran Tousif, Imran.tousif@ue.edu.pk; Suvash Chandra Ojha, suvash_ojha@swmu.edu.cn
This article was submitted to Chemical Biology, a section of the journal Frontiers in Chemistry
Disclaimer
All claims expressed in this article are solely those of the authors and do not necessarily represent those of their affiliated organizations, or those of the publisher, the editors and the reviewers. Any product that may be evaluated in this article or claim that may be made by its manufacturer is not guaranteed or endorsed by the publisher.