 Shahid Mehmood1Faheem Ullah Khan1Muhmmad Naeem Shah1
 Junxian Ma1Yatao Yang1Guijun Li2
 Wei Xu1,3Xiaojin Zhao1Wei He1
 Xiaofang Pan1*
- 1College of Electronics and Information Engineering, Shenzhen University, Shenzhen, China
- 2Key Labortary of Optoelectronics Devices and System of Ministry of Education and Guangdong Province, College of Physics and Optoelctronics Engineering, Shenzhen University, Shenzhen, China
- 3Huazhong University of Science and Technology, Wuhan, China
Ternary composite with great modulation of electron transfers has attracted a lot of attention from the field of high-performance room-temperature (RT) gas sensing. Herein, walnut-like WO3-Ni–graphene ternary composites were successfully synthesized by the hydrothermal method for formaldehyde (HCHO) sensing at RT. The structural and morphological analyses were carried out by scanning electron microscopy (SEM), transmission electron microscopy (TEM), X-ray diffraction (XRD), Raman spectroscopy, and X-ray photoelectron spectroscopy (XPS). SEM and TEM studies confirmed that walnut-like WO3 nanostructures with an average size of 53 ± 23 nm were functionalized. The Raman and XPS results revealed that, due to the deformation of the O-W-O lattice, surface oxygen vacancies Ov and surface-adsorbed oxygen species Oc were present. The gas-sensing measurement shows that the response of the WO3-Ni-Gr composite (86.8%) was higher than that of the Ni-Gr composite (22.7%) for 500 ppm HCHO at RT. Gas-sensing enhancement can be attributed to a p-n heterojunction formation between WO3 and Ni-Gr, Oc, spill-over effect of Ni decoration, and a special walnut-like structure. Moreover, long term stability (%R = 61.41 ± 1.66) for 30 days and high selectivity in the presence of other gases against HCHO suggested that the proposed sensor could be an ideal candidate for future commercial HCHO-sensing in a real environment.
Introduction
The precise detection of volatile organic compounds (VOCs), including formaldehyde (HCHO), ammonia (NH3), isopropyl alcohol (IPA), ethanol, acetone, and carbon monoxide (CO) in both indoor and outdoor environments is closely related to environmental evaluation, disease diagnosis, and food quality analysis (Chen et al., 2014; Park et al., 2014; Mu et al., 2015). Out of various VOCs, HCHO, a carcinogenic VOC, is threatening human health as an indoor air pollutant (El Sayed et al., 2016; Wang et al., 2018). Specifically, a low level of 1–3 ppm of HCHO can cause nose and eye irritations while contacting with a higher level of 15 ppm can cause death (El Sayed et al., 2016; Wang et al., 2018). Hence, for human health and environmental protection, an effective monitoring approach for HCHO is greatly needed. In addition, the sensor chip with mature and well-performed HCHO detection in human breath can be used in clinics with the advantage of early stage monitoring of diseases such as nasopharyngeal cancer and leukemia (Hopkinson and Schofield, 2018; Möhner et al., 2019). Therefore, in recent decades, different strategies of sensor fabrication have been employed for the detection of HCHO (Hu J. et al., 2021; Liu et al., 2021; Peng et al., 2022; Sun et al., 2022). Ion chromatography (Lorrain et al., 1981), gas chromatography (Yoo et al., 2021), high-performance liquid chromatography (Zhang et al., 2019), and spectrometry (Mohlmann, 1985) are conventionally used as instrumental techniques for HCHO detection. However, high cost of the spectroscopic method and complex/bulky instrumentation for the chromate-graphic technique limit their real-time and field-monitoring usage (Chung et al., 2013). Shortcomings such as long-time sample preparation, expensive operational cost, and large power consumption with the aforementioned traditional techniques have accelerated the development of portable, rapid, and highly sensitive novel sensors. Therefore, chemiresistive gas sensors (Guan et al., 2020; Khan et al., 2021), due to their simplicity and low cost, have motivated the researcher to use advanced nanotechnology-based gas-sensitive materials with extraordinary detection capabilities of HCHO.
In the last two decades, nanomaterials of metal oxides (MOX), conducting polymers, and carbons tubes have emerged as gas-sensitive materials. Among them, MOX, such as ZnO, TiO2, SnO2, and WO3 (Liu et al., 2017; Chen et al., 2018; Chang et al., 2021), based gas sensors because of their excellent sensing performance, environment friendly nature, long time usage, and low-cost properties have been intensively studied for the detection of various VOCs including HCHO. Among various MOXs, because of its superior chemical stability, WO3, a typical n-type semiconductor, is specifically used for HCHO detection (Dong et al., 2020). However, pure WO3 exhibits low sensitivity and requires high-operational temperature of 200–500°C (which leads to increased power consumption) (Dong et al., 2020). To improve the performance of WO3-based gas sensors, the surface of WO3 needs to be functionalized with some metal nanoparticles to meet the pre-requisite of practical applications. Ionescu et al. demonstrated the noble metals such as Au, Pt, Au/Pt, and Fe nanoparticles decorated with WO3 detected 5, 10, and 15 ppm HCHO under UV light irradiation (Bouchikhi et al., 2020). Herein, the catalytic oxidation of metal nanoparticles and electronic sensitization of WO3 in combination can effectively improve the gas-sensing performance. However, inhomogeneous dispersion of metal nanoparticles leading to a relatively poor utilization rate of the active sites for gas sensing still makes the sensors unable to meet the requirement of extremely low concentration of HCHO (or low temperature) (Yuan et al., 2019).
Recently, graphene (Gr)-based sensor, due to its large specific surface area, good mechanical strength, and high sensitivity to electrical perturbation from gas molecules, has been widely used as promising material in high-performance room-temperature gas sensors (Varghese et al., 2015; Kumar et al., 2019). Gr is a p-type semiconductor in nature (Punginsang et al., 2017), when Gr is exposed to HCHO, the conductivity of Gr is affected by weak Van der Walls interaction with HCHO at room temperature. Weak van der Walls indistinctive gas adsorption on graphene results in poor selectivity and reversibility. Typically, graphene-based sensors are studied in the form of graphene composites, by functionalizing with MOX/metals to achieve improved selectivity and reversibility. For example, vertical graphene with tin oxide nanoparticles for highly sensitive room-temperature HCHO sensing (Bo et al., 2018), WO3-rGO porous nanocomposite for NH3 detection (Jeevitha et al., 2019), GO decorated by a hollow SnO2 nanofiber for HCHO detection (Wang et al., 2017), and GO/Ag nanoparticle composite film for sensitive detection toward traces of formaldehyde (Zhang T. et al., 2017). Synergic interaction between Gr sheets and WO3 has been credited to enhance the sensing response of hybrid nanocomposites. Similarly, various reports have been published regarding metal functionalization on WO3 for tuning selectivity, improving sensitivity, and low-operating temperature gas-sensing measurements (Jeevitha et al., 2019; Bouchikhi et al., 2020). Although the functionalization of Gr could enhance the feature of low-temperature sensing, the degree of improving sensing response by Gr is still finite. Therefore, to enhance the sensing performance, a novel functional material composite consisting of Gr, noble metal (Ni), and metal oxide (WO3) is synthesized in this work. A ternary composite of WO3-Ni-Gr thus formed can utilize the Gr-sensing characteristic of low temperature operation, Ni as better oxygen dissociation catalysts, and WO3 properties of good response and improved selectivity as a synergistic effect with a better sensing performance material for practical application. However, to date, the HCHO sensor based on a WO3, Ni, and Gr ternary composite material (WO3-Ni-Gr) has not been reported yet.
In view of the aforementioned survey, the sensing characteristics of WO3-Ni-Gr and Ni-Gr composites toward HCHO at room temperature are reported and compared. The Ni-Gr composite is synthesized by a simple and facile hydrothermal method and then WO3 nanostructures are decorated on the surface of Ni-Gr using the hydrothermal method. The structural and chemical features of WO3-Ni-Gr and Ni-Gr composites are characterized by scanning electron microscopy (SEM), transmission electron microscopy (TEM), high resolution transmission electron microscopy (HRTEM), X-ray diffraction (XRD), Raman spectroscopy, and X-ray photoelectron spectroscopy (XPS). WO3-Ni-Gr and Ni-Gr composite-based sensors are then fabricated and their sensing behaviors toward various VOCs are tested by a customized gas-sensing analysis system. Data results displayed that WO3-Ni-Gr composites have shown an excellent sensing response toward HCHO (1–500 ppm) at room temperature. Compared to Ni-Gr composites, the sensitivity, selectivity, and sensing speed are improved for WO3-Ni-Gr sensors. The influence of WO3 decoration on Ni-Gr toward HCHO detection for an enhanced sensing performance is investigated. The spill-over effect of Ni decoration, walnut-like morphology of WO3, heterojunction formation between WO3 and Ni-Gr and the absorbed oxygen species are the factors attributed for improved sensing performance.
Materials and methods
Materials
All chemicals are of analytical reagent grade and used without further treatment. Gr, IPA, DMF, and ethanol were obtained from Shanghai Aladddin Biochemical Technology Co. Ltd., while nickel nitrate (NiNO3) and tungsten hexachloride (WCl6) were purchased from Sigma Aldrich.
Preparation of Ni-Gr and WO3-Ni-Gr composite
500 mg of Gr nanoplatelets and 125 mg of polyvinylpyrrolidone (PVP) are mixed in 75 ml IPA and the solution is stirred for 1 h. NiNO3 (100 mg) is then added into the aforementioned solution and the mixture is stirred vigorously for 1 h. The 100 ml stirred solution is then transferred into Teflon-lined stainless autoclave, heated at 180°C for 8 h in an oven and then cooled at room temperature naturally. Finally, the black precipitates of the Ni-Gr composites are collected by the centrifugation, washed using deionized water several times, and dried at 90°C for 24 h. Steps 1, 2, and 3 in Figure 1 summarize the synthesis procedure of the Ni-Gr composites.
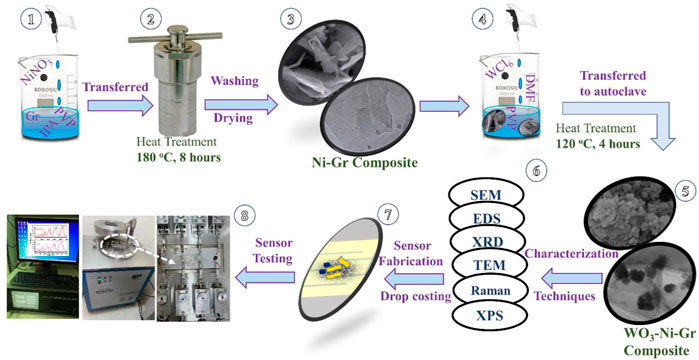
FIGURE 1. Schematic of the syntheses of Ni-Gr and WO3-Ni-Gr composites, sensor fabrication, and testing.
WO3-Ni-Gr composites are synthesized by the following procedure: Ni-Gr composites obtained from the first step are separately dissolved in distilled water to form the suspension. 300 mg of WCl6 and PVP are dissolved in 30 ml of DMF and then the solution is added slowly in suspension of the Ni-Gr composite. The mixture is stirred continuously for 20 min at room temperature and then transferred into a 50 ml Teflon-lined stainless autoclave and maintained at 120°C for 4 h in an oven and then cooled at room temperature, naturally. The WO3-Ni-Gr product is filtered, washed with distilled water and ethanol several times, and dried at 90°C in vacuum over for 24 h. Steps 4 and 5 of Figure 1 illustrate the aforementioned procedure for WO3-Ni-Gr composite syntheses.
Sensor fabrication and testing
10 mg of the Ni-Gr and WO3-Ni-Gr composites are separately added into 5 ml deionized water and then ultrasonicated for 20 min to form the homogenous dispersion. Dispersion is then drop-casted (Step 7 of Figure 1) on the electrode to obtain the resistance-type sensor. The sensor is then dried at 180°C for 24 h in the vacuum for better stability. The room-temperature sensing measurement of VOCs (Step 8 of Figure 1) is carried out in an intelligent gas sensing analysis system CGS-4TPs (Beijing Ellite Tech. Co. Ltd.). The main parts of the gas-sensing system include the gas chamber, small probes for the sensor connection, data acquisition board and display, and data storage system (Figure 1 Step 8). Fabricated electrodes are loaded on the sensor platform highlighted by a white circle in Step 8 of Figure 1. Real-time resistance is extracted by the data acquisition board and recorded in the system as resistance. To evaluate the gas-sensing performance, one critical figure of merit is the %response which is defined as:
where Rg is the resistance upon exposure of the target gas and Ra is the stable resistance of the sensor in air. Furthermore, response time (τres) is the time required to attain 90 % of the saturation resistance as compared to the initial value while recovery time (τrec) is the time required to gain 90 % of the baseline value from the final value. τres and τrec are other crucial parameters for gas sensing.
Characterization detail
Field emission scanning electron microscopy (FESEM) and energy dispersive X-ray spectroscopy (EDS) analyses are carried out using an FEI double-beam scanning electron microscope equipped with an EDS spectrometer for the morphological analysis of Ni-Gr and WO3-Ni-Gr composites. XRD analysis is carried out by using the Rigaku-Miniflex-600 Xray diffractometer for structural analysis of both composites. Raman spectroscopy (Thermo DXR2xi) and X-ray photoelectron spectroscopy (XPS) (Thermo Scientific ESCALAB™ XI+) are employed to study the vibrational modes and elemental analysis of C, Ni, W, and O, respectively. The room-temperature sensing measurement of VOCs is carried out in an Intelligent Gas Sensing Analysis System CGS-4TPs (Beijing Ellite Tech. Co. Ltd.).
Result and discussion
The morphology of the Ni-Gr composites is analyzed using scanning electron microscopy (SEM). Figures 2A,B show the SEM of the Ni-Gr composite at different resolution. The SEM images of the Ni-Gr composites demonstrate that the wrinkled aggregated graphene sheets are present. Figures 2C,D are SEM images of the WO3-Ni-Gr composite at different magnifications. It shows that nanostructures have a bumpy surface resembling a walnut-like surface. Figures 2C,D show that the morphology of the WO3-Ni-Gr composite exhibit a substantial change in comparison to Figures 2A,B, and the WO3 sheets are intensively decorated on the surface of the graphene, indicating the successful attachment of WO3 nanostructures on the surface of Ni-Gr (yellow circles in Figure 2C reveal the crumple graphene structures, while light blue circles represent the WO3 structures). This is further proved by EDS and the corresponding elemental mapping of C, O, Ni, and W in Figures 2E–J. The EDS spectrum has shown the presence of C (18 wt %), O (25 wt %), Ni (17 wt %), and W (40 wt %) and this confirms the high purity and stoichiometric nature of the WO3-Ni-Gr composite.
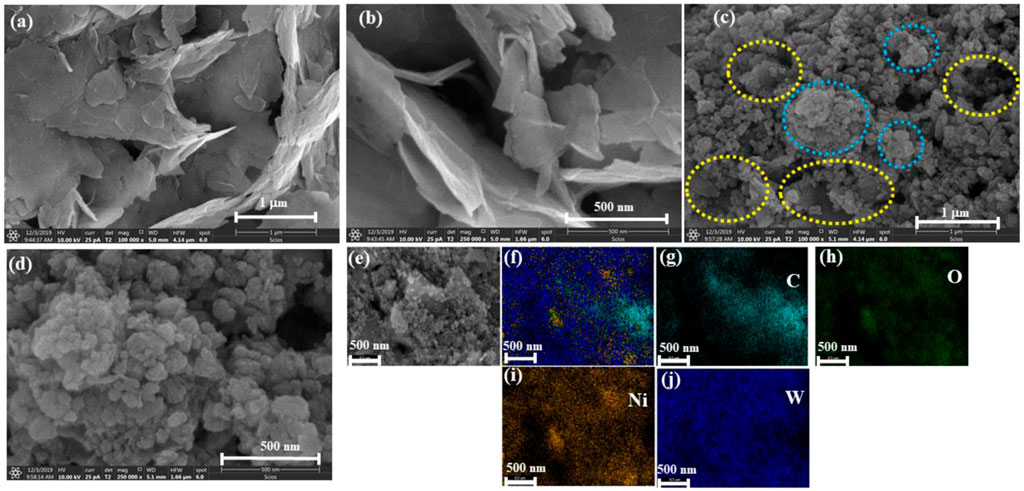
FIGURE 2. (A,B) SEM images of Ni-Gr composites. Wrinkled, aggregated graphene sheets are present (C,D) SEM images of WO3-Ni-Gr composites. A bumpy surface approximating the walnut-like surface confirms the attachment of WO3 nanostructures. (E–J) EDS-mapping represents the presence of C, O, Ni, and W.
The crystal structure of the synthesized composites is studied by X-ray diffraction (XRD), Figure 3A shows the XRD patterns of Ni-Gr and the WO3-Ni-Gr composite. The XRD pattern of the Ni-Gr composite (bottom pattern) has presented a strong peak at 26.4° with minute diffraction peaks at 10.7°, 19.4°, 21.8°, 32.8°, 35.8°, 39.1°, and 41.5°. The strong peak at 26.4° corresponds to the (002) diffraction peak of C (Gr), which represents the graphitic nature with a uniform structure of different layer spacing (0.33 nm) (Ansari et al., 2019). The diffraction peak at 10.7° is the characteristic graphene oxide (GO) peak which indicates that the surface of the graphene is functionalized with oxygen or carboxylic (-COOH) species (Tang et al., 2014). The peaks at 19.4°, 21.8°, 32.8°, and 35.8° are attributed to (015), (202), (511), and (440) phase of the C. The diffraction peaks at 39.1° and 41.5° are related to (010) and (002) planes of Ni. The XRD patterns of Ni-Gr have shown the characteristic diffraction peaks of both Gr and Ni which confirm the Ni-Gr composite formation. The XRD pattern of the WO3-Ni-Gr composite (red-marked top pattern) demonstrates that new peaks have emerged at 2θ angles of 23.0°, 23.5°, 24.3°, 34.5°, 42.0°, and 47.2°. Peaks at the 2θ angle such as 23.0°, 23.5°, and 24.3° which correspond to (002), (020), and (200) reflections of WO3, respectively (Ansari et al., 2019), have been highlighted by the inset in Figure 3A. Other diffraction peaks at the 2θ angle such as 34.5°, 42.0°, and 47.2° are due to (022), (222), and (004) planes of WO3, respectively (Ansari et al., 2019). The diffraction peaks of the WO3 nanostructures are well matched with JCPDS#20–1324 showing that the orthorhombic phase of WO3 is synthesized. The emergence of new peaks for WO3 in comparison to the Ni-Gr composites prove the existence of WO3 nanostructures on the surface of Ni-Gr composites and thus the successful formation of the WO3-Ni-Gr composite.
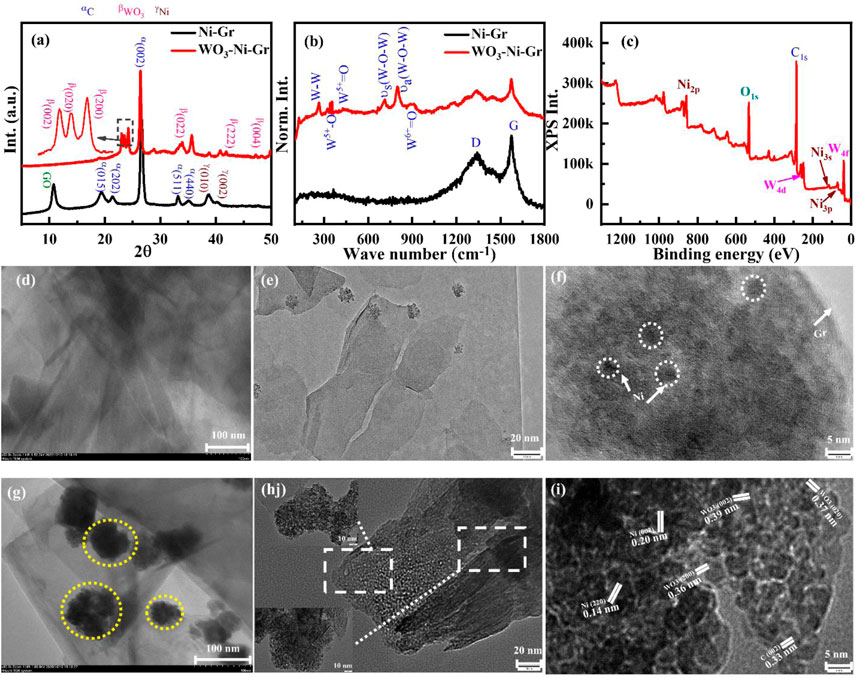
FIGURE 3. (A) XRD patterns of Ni-Gr (bottom) and WO3-Ni-Gr (top) composites. Characteristic diffraction peak C (002) at 26.4° represent the graphitic nature of Gr. Minute diffraction peaks of Ni (010) and Ni (002) show that the Ni-Gr composites are formed. 23.0°, 23.5°, and 24.3° which correspond to (002), (020), and (200) reflection of WO3 highlighted by the inset confirmed that WO3 nanostructures were successfully modified on the Ni-Gr composite. (B) The Raman spectra of Ni-Gr (bottom) and WO3-Ni-Gr (top) composites. G and D bands were present for Ni-Gr composites. WO3 functionalization in the WO3-Ni-Gr composite was confirmed by the emergence of new Raman modes of WO3 at 240 cm−1, 335 cm−1, 431 cm−1, 805 cm−1, and 950 cm−1. (C) XPS survey scan of the WO3-Ni-Gr composite discloses that only W (4f, 4d state), O (1s), C (1s), and Ni (2p, 3s, and 3p) were present. (D) TEM images, (E,F) HRTEM image of Ni-Gr composites. Layered structures of Gr with dark spots of Ni show the Ni-Gr composite formation. (G) TEM images of the WO3-Ni-Gr composite. The irregular dark portion highlighted by yellow circles is due to WO3 nanostructures with an average size of 53 ± 23 nm. (H) HRTEM images of WO3-Ni-Gr composites at 20 nm resolution. The inset shows the HRTEM image at 10 nm resolution. (I) HRTEM images of WO3-Ni-Gr composites at 5 nm resolution. HRTEM images show that crystallographic planes of (002) Gr, (220) and (002) of Ni, and (002), (020), and (200) of WO3 are present for the WO3-Ni-Gr composite.
Raman spectroscopy is conducted to have deeper insight into the structural and electronic characteristics of composites. Figure 3B displays the Raman spectra of both Ni-Gr and WO3-Ni-Gr composites. The Raman spectra of the Ni-Gr composite (bottom one) have shown the Raman mode at 1,345 cm−1 (D-band) and 1,578 cm−1 (G-band) (Basta et al., 2022). G-band is the characteristics of graphitic nature and it is due to C-C vibrations of sp2 hybridized carbons while D band is a disorder band which arises from disorder-induced vibration in sp3 hybridized carbon (Yang et al., 2021). The presence of D-band can be associated to defect states in Ni-Gr composites due to Ni and COOH functionalizations which are already confirmed in the XRD and TEM spectra. The Raman spectra of the WO3-Ni-Gr composite (top spectra in Figure 3B) show that new bands have emerged at wave numbers such as 950 cm−1, 801 cm−1, and 718 cm−1 while in the lower wave number range, 240 cm−1, 335 cm−1, and 431 cm−1; however, G and D bands are at 1,578 cm−1 and 1,345 cm−1, respectively. New bands at 950 cm−1, 801 cm−1, and 718 cm−1 are due to W6+=O, antisymmetric W-O-W and symmetric W-O-W vibrations, respectively (Ozceri et al., 2021) while 240 cm−1 (W-W vibration), 335 cm−1(W5+-O vibration), and 431 cm−1 (W5+=O vibration) modes are related to deformation lattice O-W-O modes due to oxygen vacancies (Ansari et al., 2019; Fan et al., 2020; Tran et al., 2021). In addition, the G band in the WO3-Ni-Gr composite is broadened in comparison to Ni-Gr composites. Occurrence of new bands at 801 cm−1 and 718 cm−1 and 132–326 cm−1 ranges along with the broadening of the G-band can be used as a confirmation that WO3 nanostructures are bounded on the surface of Ni-Gr. X-ray photoelectron spectroscopy (XPS) which is an effective technique to verify the surface state of nanomaterials by looking into elemental composition and chemical states is further used. Figure 3C demonstrates the XPS survey scan of WO3-Ni-Gr composites, from Figure 3C it is revealed that only W (4f, 4d state), O (1s), C (1s), and Ni (2p, 3s and 3p) are present. The co-existence of the valance states of W, O, C, and Ni without any other impurities can be used as a signature that WO3-Ni-Gr composites are successfully synthesized. This is in accordance with the EDS spectrum (Figures 2E–J) where a similar observation of co-existence of W, O, C and Ni is found for WO3-Ni-Gr composites.
Transmission electron microscopy (TEM) is also utilized to comprehend the detailed structural and morphological analysis of Ni-Gr and WO3-Ni-Gr composites. Figure 3D shows the TEM images of the Ni-Gr composite, where layered structures with dark spots are observed. The layered structures are of graphene while the dark spots are due to presence of Ni. High resolution transmission electron microscopy (HRTEM) of Ni-Gr composites is displayed in Figures 3E,F at the 20 and 5 nm scales, respectively. HRTEM images of Figure 3F demonstrate that the layered structures of Gr are present and the dark spots are due to Ni. Figure 3F shows that the Ni content is dispersed on the surface of Gr. Figure 3G shows the TEM images of WO3-Ni-Gr composites, the irregular dark portion signifies that the walnut-like WO3 nanostructures are dispersed on the surface of layered Ni-Gr (lighter part). The average size of the WO3 nanostructures measured from Figure 3G is 53 ± 23 nm. HRTEM images of WO3-Ni-Gr composites at 20 and 5 nm scales are shown in Figures 3H,I. The morphology of Figure 3G is totally different from Figure 3E, which confirmed that WO3 nanostructures are decorated on the surface of Ni-Gr. Figure 3I shows the HRTEM image of the WO3-Ni-Gr composite indicating that lattice fringes with d-spacings of 0.33, 0.37, 0.36, 0.39, 0.14, and 0.20 nm are present. Lattice fringes with a d-spacing of 0.33 nm are for the (002) plane of Gr (Ansari et al., 2019), while 0.14 and 0.20 nm are for the (220) and (002) planes of Ni, respectively (Jia et al., 2021). 0.39, 0.37, and 0.36 nm correspond to (002), (020), and (200) planes of WO3, respectively (Ansari et al., 2019). The crystallographic planes of (002) Gr, (220) and (002) of Ni, and (002), (020), and (200) of WO3 confirmed that the WO3-Ni-Gr composite is formed.
UV–Vis diffuse reflectance measurements are employed for the optical property determination of the as-synthesized WO3, Ni-Gr composite, and WO3-Ni-Gr composite. Figure 4A shows the percentage (%) reflectance as a function of the wavelength (250–750 nm) for WO3, Ni-Gr, and WO3-Ni-Gr. The absorption edge is founded at about 450 nm for as-synthesized WO3 nanometers which agrees well with the reported value (Ng et al., 2018). In case of the Ni-Gr composite, no absorption edge is observed. However, for WO3-Ni-Gr, an absorption edge is spotted close to 450 nm, as shown in the inset of Figure 4A. The emergence of the absorption edge at about 450 nm in the WO3-Ni-Gr composite in comparison to the Ni-Gr composite verified that the WO3 nanostructures are successfully modified on Ni-Gr. Kubelka–Munk transformation is then used to obtain the Tauc diagram for the band gap analysis of WO3 and the WO3-Ni-Gr composite and is shown in Figures 4B,C. From the Kubelka–Munk plots (Figure 4B), the band gap of as-synthesized WO3 nanostructures is estimated to be 2.66 eV, consistent with the reported value (Hao et al., 2017). Interestingly, the WO3-Ni-Gr composite exhibited two absorption edges at 1.38 and 2.10°eV, respectively (Figure 4C), which can be assigned to GO and WO3, respectively (Mohamed, 2019). The speculated value of the band gap of WO3 in the WO3-Ni-Gr composite is less than the value of pure WO3 material. This signifies the enhanced interaction among the ternary composites of WO3, Ni, and Gr which can lead to an efficient carrier separation and transformation, and consequently, a junction formation between WO3 and Ni-Gr. High-carrier density is observed for the WO3-Ni-Gr composite supporting information (Supplementary Figures S1A–D and Supplementary Table S1). The enhanced carrier density for the ternary composite of WO3-Ni-Gr is probably due to enhanced charge generation and efficient charge transfer and thus, the junction formation between WO3 and Ni-Gr.
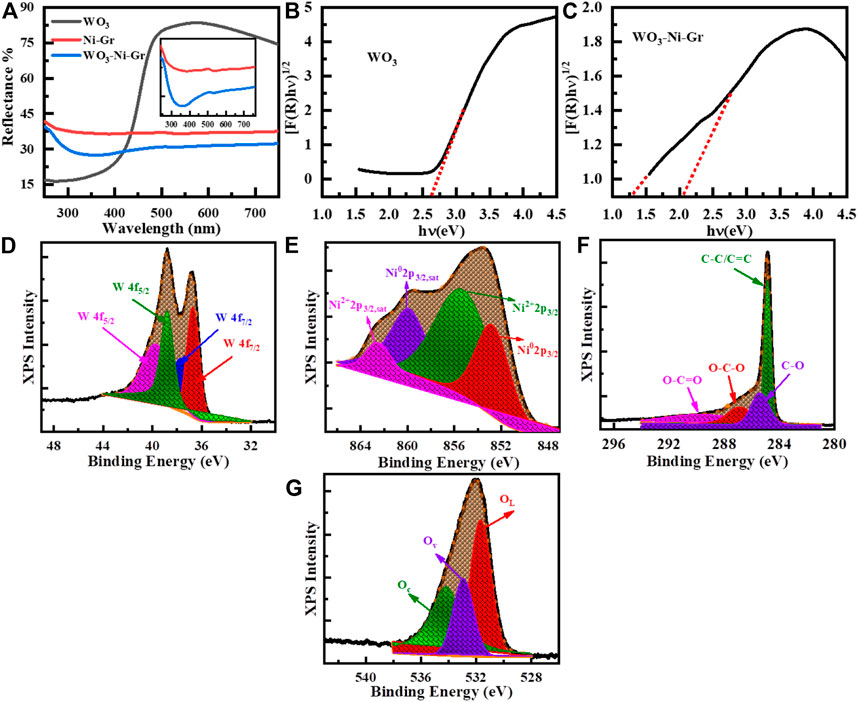
FIGURE 4. (A) UV-Vis diffuse reflectance spectra of WO3, Ni-Gr, and WO3-Ni-Gr composites. (B) Corresponding Kubelka–Munk plot of WO3 (C) the WO3-Ni-Gr composite for band gap estimation. (D–G) High-resolution XPS spectra of (D) W (4f), (E) Ni (3p3/2), (F) C (1s), and (G) O (1s).
Surface states analyses of W, O, C, and Ni are further performed by high-resolution XPS and is given in Figures 4D–G. XPS peak fit 4.1 software is used to find the exact contribution of each valence state and all the fittings of high-resolution XPS are shown in Figures 4D–G. Specifically, the high-resolution XPS spectrum of W 4f doublet is shown in Figure 4D; three peaks are observed at the binding energy of 41, 36.8, and 35.6 eV corresponding to 5p3/2, 4f5/2, and 4f7/2 states of W in WO3. The peaks at 36.8 and 35.6 eV in deconvolution peaks of the doublet displays the W6+ and W5+ oxidation states of W (Fan et al., 2020; Tran et al., 2021). These findings are consistent with the RAMAN results (described in previous section) where the Raman modes of W5+=O and W6+=O appeared due to the presence of oxygen vacancies. The presence of the 6+ oxidation state of W confirms that WO3 nanostructures have a covered surface of Ni-Gr composite and the 5+ oxidation states reveal that oxygen vacancies are also present. Decomposition of high-resolution spectra of Ni 2p3/2, shown in Figure 4E, reveals that four distinct peaks are at a binding energy of 863.0, 859.4, 855.4, and 862.5 eV. The peak at 852.8 eV corresponds to the metallic form of Ni (3p3/2) with its satellite peak Ni (3p3/2, sat) at 859.4 eV (Darvishi et al., 2017; Ren et al., 2020). Similarly, the peak at 855.4 eV shows nickel hydroxide (Ni2+ oxidation state, 3p3/2) with its satellite peak (3p3/2, sat) at 862.5 eV (Darvishi et al., 2017; Ren et al., 2020). This indicates that Ni0 and Ni2+ states are present on the surface of the WO3-Ni-Gr composite which can act as better oxygen dissociation catalysts. This dissociation results in the rapid diffusion of the gas molecules to the surface vacancies for enhanced sensitivity. The high-resolution spectra of C (1s) peak for the WO3-Ni-Gr composite is shown in Figure 4F; the four peaks are at 288.7, 287.1, 285.6, and 284.5 eV. The main peak at 284.5 eV arises due to C-C/C=C bonding while peaks at 288.7, 287.1, and 285.6 eV are attributed to O-C=O, O-C-O, and C-O bonds containing oxygen, respectively (Fan et al., 2020; Wei et al., 2021). The presence of O-C=O, O-C-O, and C-O bonds can be related to the presence of abundant oxygen species on the surface of WO3-Ni-Gr composites. The deconvoluted three peak spectra of O of the composite are shown in Figure 4G; the peaks are observed at 534.2, 532.9, and 531.6 eV. The peak at 534.2 eV is due to surface-chemisorbed oxygen species (Oc), the second peak at 532.9 eV could be attributed to oxygen vacancies (Ov), and the third peak at 531.8 eV has been ascribed to lattice oxygen species (OL) (Fan et al., 2020; Wei et al., 2021). The Ov peak represents the bonding of WO3 nanostructures at the surface of Ni-Gr, while Ov and Oc signify that oxygen vacancies and adsorbed oxygen species are on the WO3-Ni-Gr composite. It is reported by various groups that the presence of Ov and Oc on the material surface is related to active adsorption sites, which can enhance the sensitivity of the material toward gas sensing.
Sensing properties of sensors
To evaluate the sensing properties of the WO3-Ni-Gr and Ni-Gr sensors toward a range of HCHO concentrations, dynamic response measurements are performed. Thus, Figure 5A shows the dynamic response/recovery transient curves of the WO3-Ni-Gr- and Ni-Gr-based sensors against various concentrations of HCHO (10–500 ppm) at room temperature. As expected, the gradual increase in resistance of each sensor is observed when increasing the HCHO concentration, with a drop of resistance to the baseline when HCHO is removed from the system. Apparently, the WO3-Ni-Gr-based sensor possesses a higher response in comparison to the Ni-Gr sensor, and the response value to 500 ppm of HCHO is 86.8 for the WO3-Ni-Gr sensor while the response is only 22.7 for the Ni-Gr sensor. More importantly, for the Ni-Gr sensor, no sensing response is observed for 1 ppm and the detection limit of the WO3-Ni-Gr sensor is 1 ppm while for Ni-Gr, it is 10 ppm. Furthermore, the sensing performance of both sensors is evaluated by plotting the sensing response as a function of concentration (ppm) and is displayed in Figure 5B. The response for the WO3-Ni-Gr sensor is 3.24, 6.76, 17.1, 34.5, 62.8, 74.1, and 86.8 against 1, 10, 25, 50, 100, 200, and 500 ppm, respectively. Similarly, the responses for the Ni-Gr sensor are 1.11, 2.38, 6.77, 11.04, 14.83, and 22.7 against 10, 25, 50, 100, 200, and 500 ppm, respectively. With the increase in HCHO concentration, the response is increased linearly for both sensors in the range of 1–100 ppm. When the concentration is 100 ppm or above, the response for both sensors increases slowly, which demonstrated the saturation for a higher concentration of HCHO. In the range of 1–100 ppm for both sensors, more active sites are available on the material surface for gas adsorption which results in a rapid increase in the response and larger slope. However, for concentrations >100 ppm, active surface sites available for gas adsorption on the material surface are less, gas adsorption will be saturated, increase in response will gradually reduce, and the slope will be diminishing. It is worth noting that, for all HCHO concentration ranges (1–500 ppm), the response of WO3-Ni-Gr is always greater than the Ni- Gr sensors. Inset of Figure 5B reveals that the response curve vs. HCHO concentration shows an almost linear trend for the WO3-Ni-Gr and Ni-Gr sensors. The approximation formula used for the linear regression analysis: S = 0.061 C + 1.98 (1 ≤ C ≤ 100) for WO3-Ni-Gr and S = 0.113 C + 0.09 (1 ≤ C ≤ 100) for Ni-Gr, where S and C are the % responses of the sensor and the concentration of HCHO, respectively. The coefficient of determination R2 for WO3-Ni-Gr and Ni-Gr is 0.99 and 0.96, respectively. The gas detection limit of HCHO for the WO3-Ni-Gr sensor is 1 ppm with a sensing response of 3.24 while that of Ni-Gr sensors is 10 ppm with a response of 1.11. Thus, the improved sensing response characteristics (86.8) and the 1 ppm detection limit in this present study indicate the promising future application of the WO3-Ni-Gr sensor for HCHO detection.
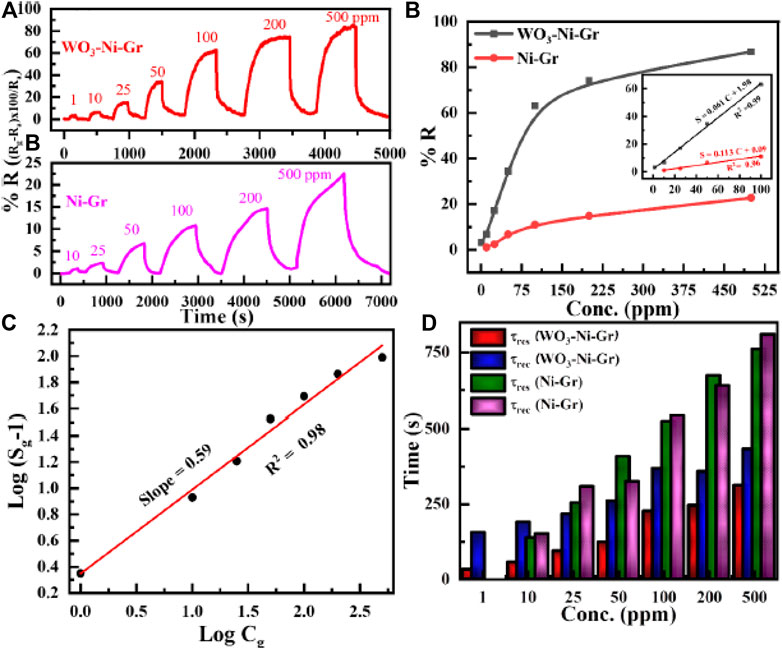
FIGURE 5. (A) Transient responses toward varying concentrations of formaldehyde (HCHO), 10–500 ppm for Ni-Gr (bottom), and 1–500 ppm for the WO3-Ni-Gr composite (top) at room temperature. (B) The relationship between the response and the concentration (up to 500 ppm) for both sensors against HCHO. Inset of Figure (B) shows the linear trend for both composites for 1 ≤ C ≤ 100), where C is the concentration in ppm. (C) Logarithm of % response
WO3-Ni-Gr sensors demonstrated good sensing abilities toward HCHO over the concentration range 1–100 ppm. The gas (HCHO) adsorption on the surface of semiconducting oxides such as WO3 can be expressed empirically by [39]:
where in Eq. 1, Sg (% response) is sensitivity, Cg is the HCHO concentration, and b, a are constants depending upon the sensor material and gas sensor type. The value of constant b can be either 1 or 0.5, and it is related to type of the surface interaction between the HCHO molecule and the chemisorbed oxygen species. The value of b is 1 for
According to Eq. 2, the relation between
The sensing speed of WO3-Ni-Gr and Ni-Gr sensors toward HCHO is estimated by the common practice of response time (τres) and recovery time (τres). τres is defined as the time required by the sensor to reach 90 % of maximum resistance from baseline resistance when exposed to HCHO gas, while τrec is the time elapsed by the sensor to recover 90 % of baseline resistance when restored to air. τres and τrec, for both WO3-Ni-Gr and Ni-Gr sensors as a function increasing HCHO concentration (ppm), are displayed in Figure 5D. τres/τrec for WO3-Ni-Gr are 32s/156s, 56s/190s, 94s/217s, 123/200, 226/369, 245/358, and 312/433 s when exposed to HCHO at 1, 10, 25, 50, 100, 200, and 500 ppm, respectively. In addition, τres/τrec for Ni-Gr are 138s/151 s, 254s/308 s, 408s/325 s, 524s/541 s, 673s/640 s, and 761s/840 s at 1, 10, 25, 50, 100, 200, and 500 ppm, respectively. Apparently, the sensing speed of the WO3-Ni-Gr based sensor is fast for all concentrations in comparison to the Ni-Gr sensor. τres is 2.4, 2.7, 3.31, 2.31, 2.74, and 2.29 factor low for 10, 25, 50, 100, 200, and 500 ppm, respectively of HCHO. Similarly, τrec is 0.79, 1.41, 1.62, 1.46, 1.78, and 1.93 factor low for 10, 25, 50, 100, 200, and 500 ppm, respectively of HCHO. Smaller values of τres/τrec for the WO3-Ni-Gr sensor demonstrate that WO3 loading at the Ni-Gr sensor has promoted the catalytic activity by rapid dissociation of oxygen molecules. The rapid dissociation of oxygen molecules by both Ni and WO3 has resulted in a fast diffusion and adsorption of ions-absorbed oxygen on the surface of WO3-Ni-Gr. τres/τrec of both the sensors tends to increase gradually with HCHO concentration. This is because, adsorption has been slowed for higher density of HCHO and takes a longer time for adsorption of HCHO gas; on the other hand, higher density of HCHO adsorbed on the surface of both sensors has prolonged the desorption (He et al., 2019).
The sensing performance of the WO3-Ni- Gr composite is evaluated for different temperatures toward 50 ppm of HCHO and transient response measurements at 25°C, 75°C, and 150°C, as shown in Figure 6A. From Figure 6A, it is noted that the response of the sensor to HCHO gas increases as the temperature increases. The responses of the WO3-Ni- Gr sensor are 32.4, 34.9, and 38.6 at 25°C, 75°C, and 150°C temperature values, respectively. The sensor response is increased to 1.19 times as the temperature is increased to 150°C. Moreover, the response time and recovery time decreases as the temperature is increased. It can be observed that the sensor has the capability to detect HCHO over a wide temperature range, indicating that the WO3-Ni-Gr sensor can be used at low and high temperatures for different applications.
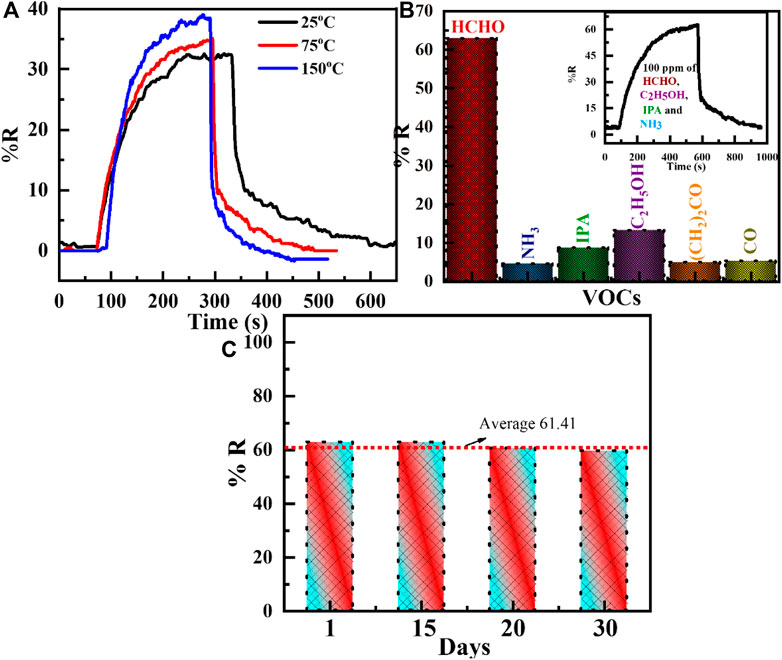
FIGURE 6. (A) Transient responses of the WO3-Ni-Gr composite toward 50 ppm of formaldehyde (HCHO) for different temperatures such as 25°C, 75°C, and 150°C. The response of the sensor to HCHO gas increases as the temperature increases. (B) Histogram of the sensing response of WO3-Ni-Gr composites against various VOCs such formaldehyde, NH3, IPA, ethanol, acetone, and CO. Inset of Figure (B) shows the selectivity of theWO3-Ni-Gr composite toward 100 ppm HCHO in the presence 100 ppm of other interfering gases such as C2H5OH, IPA, and NH3. Negligible change in the response value in the presence of other interfering gases was observed. (C) The histogram of the sensing response for 100 ppm HCHO at 1st, 15th, 20th, and 30th days. It is obvious that the sensor was stable for a long time.
The selectivity of the sensor toward specific gases in the presence of other gases is an essential factor for effective practical/commercial use, so, the WO3-Ni-Gr sensor is subjected to 100 ppm of similar gases including ammonia (NH3), isopropyl alcohol (IPA), ethanol, acetone, and carbon monoxide (CO) at room temperature. The results of the responses for each gas are represented in the histogram in Figure 6B, respectively. The responses of the WO3-Ni-Gr sensor are 62.8, 4.5, 8.6, 13.2, 4.9, and 5.2 against 100 ppm of HCHO, NH3, IPA, ethanol, acetone, and CO, respectively. The experimental results clearly confirm the higher response of HCHO in comparison to other gases. The inset of Figure 6B shows the dynamic sensing response of 100 ppm HCHO in the presence of 100 ppm of other interfering gases such as C2H5OH, IPA, and NH3. It can be clearly found that the response is 62.1 which is very close to 62.8 of the initial response value of HCHO alone. Negligible change in the response value in the presence of other interfering gases suggested that the specificity of the WO3-Ni-Gr sensor toward HCHO is not affected by other gases. This suggested that WO3-loaded Ni-Gr sensor can be used as a sensing layer for HCHO detection in real environments.
Furthermore, the validity of the sensor is also established by long term stability, which is a key point for the use of the sensor in commercial applications. The long-term stability is inspected against 100 ppm of HCHO for 30 days at room temperature and is shown in Figure 6C. The responses of the WO3-Ni-Gr sensor are 62.81, 62.79, 60.52, and 59.5 for 1, 15, 20, and 30 days, respectively. It is validated from Figure 6C that the sensing responses are highly consistent for 30 days (average ± standard deviation of the response: 61.41 ± 1.66) or 2.74 % change in the response value. These results demonstrated that the WO3-Ni-Gr sensor has excellent long-term stability and promising potential when used to detect HCHO vapors. Table 1 presents the comparison between the proposed sensor with other sensors reported in the literature. The comparison results prove that the WO3-Ni-Gr sensor reported here features the highest response at room temperature. This indicates that the obtained sensor is the best candidate for HCHO detection.
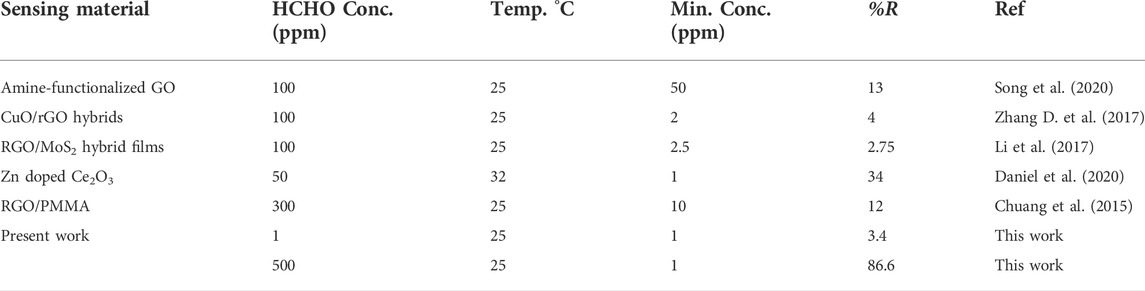
TABLE 1. Responses of various reported HCHO gas sensors.
To further evaluate the sensing performance of the WO3-Ni-Gr sample against humidity, the dynamic response curves to 500 ppm of HCHO are shown separately at 70 % RH and 90 % RH in Figure 7A and their base line resistances and response (% R) as a function of RH are plotted in Figure 7B. The base line resistances (Ra) are 3.33, 3.33, 3.48, and 3.68 kΩ at 30, 50, 70 and 90 % RH, respectively. The Response ((%R) against 500 ppm ethanol at 30, 50, 70, and 90 % RH are 85.1, 86.8, 76.1, and 68.7, respectively from Figure 7B. The response (sensitivity) of the sensor decreases slightly as the humidity increases and the maximum decrease in response was only 20.8%. A slight variation in the response as the humidity increases demonstrated that the humidity has a very slight effect on the performance of the WO3-Ni-Gr sensor. Increased resistance under a humid environment can be accounted for the reaction of water vapors with absorbed oxygen species (Hu Q. et al., 2021). However, inherent anti-humidity NiO characteristics (Cheng et al., 2021) are the main factors attributing to the anti-humidity performance of the WO3-Ni-Gr sample. NiO plays the role of a humidity absorber, and the residue-less water vapor would compete with the target gas.
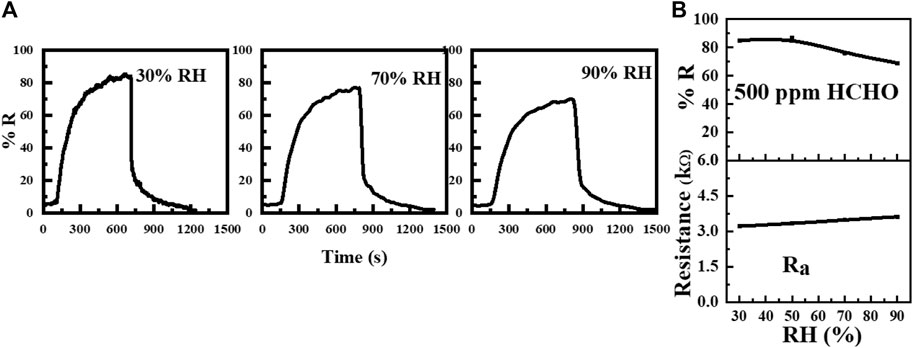
FIGURE 7. (A) Transient responses (% R) of the WO3-Ni-Gr sensor to 500 ppm of HCHO at 30 % RH, 70 %, and 90 % RH. (B) Plot of responses (% R) and base-line resistance as a function of RH.
Gas-sensing mechanism
The general operational sensing mechanism for resistance-type sensors is based on surface adsorption which results in a change in the carrier concentration and the resistance of the material. Oxygen molecules absorbed on the surface of the material forms ionized chemisorbed oxygen species (O2−, O− or
Ionized chemisorbed oxygen species due to electron capture from the material will make the hole concentration increase, the depletion region at the surface thinned, and the resistance decreased (shown in Figure 8A). When the reducing gas HCHO is introduced in the system, holes will be consumed as shown in Eq. 4. This will cause a decrease in hole concentration, widen the depletion region, and hence the high-resistance value (shown in Figure 8A). This is also confirmed in the gas-sensing response of Figure 5A where the resistance of the Ni-Gr sensor is increased on exposure of HCHO.
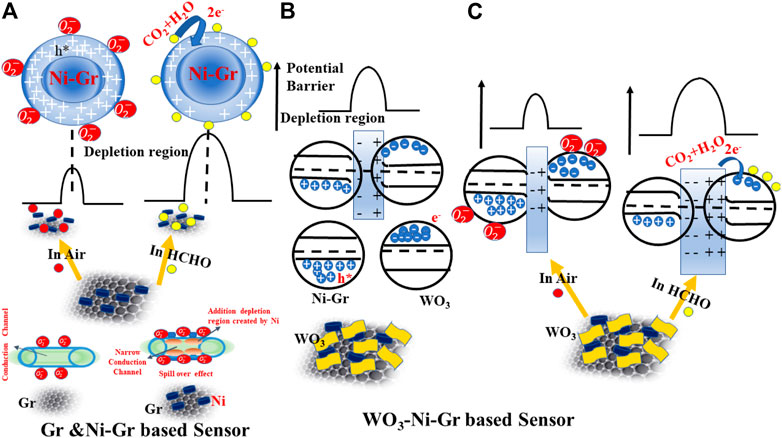
FIGURE 8. Schematic diagram for the passible sensing mechanism of (A) Ni-Gr based sensor. Ni-Gr composites exhibit the p-type behavior. In air-ionized chemisorbed oxygen species, due to the capture of electrons will increase the hole concentration (small resistance), while on HCHO exposure, the captured electrons are released back to the Ni-Gr composite and will decrease the hole concentrations (high resistance). (B) A possible mechanism of the WO3-Ni-Gr heterojunction formation between WO3 and Ni-Gr. Electrons from WO3 migrate to Ni-Gr to form the depletion region and heterojunction. (C) Schematic of a possible sensing mechanism of the WO3-Ni-Gr heterojunction on air and HCHO exposure.
The possible chemical reaction described in Eqs 3, 4 at room temperature is reversible and unstable [(Ye et al., 2016)]. When air is flowed again, the aforementioned chemical reaction will be conducted in opposite reactions and
Electrons will be captured by chemisorbed oxygen species and hence the depletion region will be widened, and resistance will be increased. However, when it is exposed to HCHO, the captured electrons from the oxygen species will be released back to WO3 by Eq. 6. Hence the depletion region will be narrowed, and resistance will be decreased.
From the aforementioned discussion, free electron dominates the conductivity in WO3, and hole dominates the conductivity in Gr. When these two are brought in contact, electrons from WO3 tend to migrate to graphene and holes flow from the graphene to WO3, due to the difference in their work function until the Fermi levels (EF) from the two sides are aligned, leading to the formation of the p-n heterojunction (shown in Figure 8B). A depletion layer is formed at the interface of both the materials (hole depletion on Gr and electron depletion on WO3). The p-type behavior of the WO3-Ni-Gr composite is also confirmed in the Mott–Schottky (MS) plot where the negative slope is observed supporting information (Supplementary Figure S1D). When the WO3-Ni-Gr sensor is exposed to HCHO, the chemisorbed oxygen species
For temperature <100°C, chemisorbed oxygen species formed on p-type Ni-Gr when exposed in air at room temperature is given by Eq. 3. However, as the temperature is > 100°C, more electric dipoles are induced as given by Eq. 7. More negative charges are accumulated around ionized oxygen and result in the depletion of negative charges in graphene which give rise to an induced electric dipole.
The induced electric dipole increases the probability of HCHO absorption by ionized oxygen molecules (atoms) and nickel at higher temperatures; consequently, the response and recovery times are reduced. An improved sensing response of 86.8 in the WO3-Ni-Gr sensor in comparison to the response of 22.7 in the Ni-Gr sensor is due to the formation of the p-n heterojunction at the interface of WO3 and Ni-Gr. Furthermore, an improved gas-sensing response after WO3 decoration on Ni-Gr is closely related to the walnut-like morphology (confirmed in SEM (Figures 2C,D) and TEM sections (Figure 3G) of WO3. The walnut-like (uneven surface) morphology of WO3 provides more active sites for HCHO molecule adsorption which provide more involvement to reactions with adsorbed oxygen species (
Conclusions
In this study, Ni-Gr and WO3-Ni-Gr composites were synthesized by using a simple hydrothermal method for room-temperature formaldehyde gas sensing. SEM, TEM, XRD, RAMAN, XPS, and UV-Vis diffuse reflectance measurements were used to study the morphological, structural, and optical characteristics of both Ni-Gr and WO3-Ni-Gr composites. The characteristic results showed that walnut-like WO3 nanostructures with an average size of 53 ± 23 nm were successfully decorated on the surface of Ni-Gr. More oxygen vacancies Ov and the adsorbed oxygen species Oc on the surface of the WO3-Ni-Gr composite were generated in the WO3-Ni-Gr composite which enables the improved selectivity, high sensitivity at lower operating temperatures toward HCHO. The WO3-Ni-Gr sensor has shown a higher response of 86.8 against 500 ppm of HCHO in comparison to Ni-Gr with a response value of 22.7. In addition, the detection limit of the WO3-Ni-Gr sensor was reduced to 1 ppm while it was 10 ppm for the Ni-Gr composite. The sensing speed of the WO3-Ni-Gr-based sensor was fast for all concentrations in comparison to the Ni-Gr sensor. The improved selectivity and sensitivity of WO3-Ni-Gr can be attributed to the p-n heterojunction formation, rapid dissociation of oxygen molecules by both Ni and WO3, and surface oxygen species which promotes the electron shuttling on HCHO interaction. The sensing performance of the WO3-Ni- Gr composite at different temperatures (25°C, 75°C, and 150°C) toward 50 ppm of HCHO has shown that sensors can be used at low and high temperatures for different applications. Excellent stability was also exhibited by the WO3-Ni-Gr based sensor toward 100 ppm of HCHO for 60 days making them promising candidates for designing an efficient device toward HCHO in practical applications.
Data availability statement
The original contributions presented in the study are included in the article/Supplementary Material; further inquiries can be directed to the corresponding author.
Author contributions
All authors have contributed in this manuscript. SM and XP did the concept, work and manuscript writing. FK, MS, WX, and GL helped in characterization and gas sensing, YY, JM, and XZ helped in resources, funding, and manuscript revision.
Funding
This work is supported in part by the National Natural Science Foundation of China under Grant 62174111, in part by the Guangdong Basis and Applied Basic Research Foundation under Grant 2021A1515011488, in part by Shenzhen-Hong Kong Joint Innovation Foundation under Grant SGDX20190919094401725, in part by Fundamental Research Foundation of Shenzhen under Grant JCYJ20190808151819049, JCYJ20210324095210030. Fundamental Research Foundation of Shenzhen (JCYJ20210324095210030, SGDX20210823103200004) and Open Foundation of the State Key Laboratory of Digital Manufacturing Equipment and Technology (DMETKF2021016).
Conflict of interest
The authors declare that the research was conducted in the absence of any commercial or financial relationships that could be construed as a potential conflict of interest.
Publisher’s note
All claims expressed in this article are solely those of the authors and do not necessarily represent those of their affiliated organizations, or those of the publisher, the editors, and the reviewers. Any product that may be evaluated in this article, or claim that may be made by its manufacturer, is not guaranteed or endorsed by the publisher.
Supplementary material
The Supplementary Material for this article can be found online at: https://www.frontiersin.org/articles/10.3389/fchem.2022.971859/full#supplementary-material
References
Ansari, S., Ansari, M. S., Satsangee, S. P., and Jain, R. (2019). WO3 decorated graphene nanocomposite based electrochemical sensor: A prospect for the detection of anti-anginal drug. Anal. Chim. Acta X. 1046, 99–109. doi:10.1016/j.aca.2018.09.028
Basta, L., Moscardini, A., Veronesi, S., and Bianco, F. (2022). Substrate surface effects on electron-irradiated graphene. Surfaces Interfaces 28, 101694. doi:10.1016/j.surfin.2021.101694
Bo, Z., Yuan, M., Mao, S., Chen, X., Yan, J., and Cen, K. (2018). Decoration of vertical graphene with tin dioxide nanoparticles for highly sensitive room temperature formaldehyde sensing. Sensors Actuators B Chem. 256, 1011–1020. doi:10.1016/j.snb.2017.10.043
Bouchikhi, B., Chludziński, T., Saidi, T., Smulko, J., Bari, N. E., Wen, H., et al. (2020). Formaldehyde detection with chemical gas sensors based on WO3 nanowires decorated with metal nanoparticles under dark conditions and UV light irradiation. Sensors Actuators B Chem. 320, 128331. doi:10.1016/j.snb.2020.128331
Chang, H. K., Ko, D. S., Cho, D. H., Kim, S., Lee, H. N., Lee, H. S., et al. (2021). Enhanced response of the photoactive gas sensor on formaldehyde using porous SnO2@TiO2 heterostructure driven by gas-flow thermal evaporation and atomic layer deposition. Ceram. Int. 47, 5985–5992. doi:10.1016/j.ceramint.2020.10.172
Chen, E. X., Yang, H., and Zhang, J. (2014). Zeolitic imidazolate framework as formaldehyde gas sensor. Inorg. Chem. 53, 5411–5413. doi:10.1021/ic500474j
Chen, M., Zou, L., Zhang, Z., Shen, J., Li, D., Zong, Q., et al. (2018). Tandem gasochromic-Pd-WO3/graphene/Si device for room-temperature high-performance optoelectronic hydrogen sensors. Carbon N. Y. 130, 281–287. doi:10.1016/j.carbon.2018.01.013
Cheng, P., Dang, F., Wang, Y., Gao, J., Xu, L., Wang, C., et al. (2021). Gas sensor towards n-butanol at low temperature detection: Hierarchical flower-like Ni-doped Co3O4 based on solvent-dependent synthesis. Sensors Actuators B Chem. 328, 129028. doi:10.1016/j.snb.2020.129028
Chuang, W. Y., Yang, S. Y., Wu, W. J., and Lin, C. T. (2015). A room-temperature operation formaldehyde sensing material printed using blends of reduced graphene oxide and poly(methyl methacrylate). Sensors Switz. 15, 28842–28853. doi:10.3390/s151128842
Chung, P. R., Tzeng, C. T., Ke, M. T., and Lee, C. Y. (2013). Formaldehyde gas sensors: A review. Sensors Switz. 13, 4468–4484. doi:10.3390/s130404468
Daniel, D. S., Ernest, S., and Fairose, S. (2020). Effect of Zinc doping on structural, optical and morphological properties of spray deposited cerium oxide thin film for low level formaldehyde detection. Mater. Today Proc. 38, 3332–3336. doi:10.1016/j.matpr.2020.10.232
Darvishi, S., Souissi, M., Karimzadeh, F., Kharaziha, M., Sahara, R., and Ahadian, S. (2017). Ni nanoparticle-decorated reduced graphene oxide for non-enzymatic glucose sensing: An experimental and modeling study. Electrochim. Acta 240, 388–398. doi:10.1016/j.electacta.2017.04.086
Dong, C., Zhao, R., Yao, L., Ran, Y., Zhang, X., and Wang, Y. (2020). A review on WO3 based gas sensors: Morphology control and enhanced sensing properties. J. Alloys Compd. 820, 153194. doi:10.1016/j.jallcom.2019.153194
El Sayed, S., Pascual, L., Licchelli, M., Martínez-Máñez, R., Gil, S., Costero, A. M., et al. (2016). Chromogenic detection of aqueous formaldehyde using functionalized silica nanoparticles. ACS Appl. Mat. Interfaces 8, 14318–14322. doi:10.1021/acsami.6b03224
Fan, G., Chen, D., Li, T., Yi, S., Ji, H., Wang, Y., et al. (2020). Enhanced room-temperature ammonia-sensing properties of polyaniline-modified WO3 nanoplates derived via ultrasonic spray process. Sensors Actuators B Chem. 312, 127892. doi:10.1016/j.snb.2020.127892
Garg, R., Dutta, N., and Choudhury, N. (2014). Work function engineering of graphene. Nanomaterials 4, 267–300. doi:10.3390/nano4020267
Guan, W., Tang, N., He, K., Hu, X., Li, M., and Li, K. (2020). Gas-sensing performances of metal oxide nanostructures for detecting dissolved gases: A mini review. Front. Chem. 8, 76. doi:10.3389/fchem.2020.00076
Han, Z., Tang, Y., Lu, G., Qi, Y., Wu, H., Yang, Z., et al. (2022). PtCu-SnO2 nanocomposites for ultrasensitive and rapid ultra-low formaldehyde sensing. ChemPhysMater 1, 227–236. doi:10.1016/j.chphma.2022.03.007
Hao, X., Li, M., Zhang, L., Wang, K., and Liu, C. (2017). Photocatalyst TiO2/WO3/GO nano-composite with high efficient photocatalytic performance for BPA degradation under visible light and solar light illumination. J. Ind. Eng. Chem. 55, 140–148. doi:10.1016/j.jiec.2017.06.038
He, K., Jin, Z., Chu, X., Bi, W., Wang, W., Wang, C., et al. (2019). Fast response-recovery time toward acetone by a sensor prepared with Pd doped WO3 nanosheets. RSC Adv. 9, 28439–28450. doi:10.1039/c9ra04429a
Hopkinson, R. J., and Schofield, C. J. (2018). Deciphering functions of intracellular formaldehyde: Linking cancer and aldehyde metabolism. Biochemistry 57, 904–906. doi:10.1021/acs.biochem.7b01304
Hu, J., Chen, X., and Zhang, Y. (2021). Batch fabrication of formaldehyde sensors based on LaFeO3 thin film with ppb-level detection limit. Sensors Actuators B Chem. 349, 130738. doi:10.1016/j.snb.2021.130738
Hu, Q., Zhang, W., Wang, X., Wang, Q., Huang, B., Li, Y., et al. (2021). Binder-free CuO nanoneedle arrays based tube-type sensor for H2S gas sensing. Sensors Actuators B Chem. 326, 128993. doi:10.1016/j.snb.2020.128993
Jeevitha, G., Abhinayaa, R., Mangalaraj, D., Ponpandian, N., Meena, P., Mounasamy, V., et al. (2019). Porous reduced graphene oxide (rGO)/WO3 nanocomposites for the enhanced detection of NH3 at room temperature. Nanoscale Adv. 1, 1799–1811. doi:10.1039/c9na00048h
Jia, H., Shang, N., Feng, Y., Ye, H., Zhao, J., Wang, H., et al. (2021). Facile preparation of Ni nanoparticle embedded on mesoporous carbon nanorods for non-enzymatic glucose detection. J. Colloid Interface Sci. 583, 310–320. doi:10.1016/j.jcis.2020.09.051
Kaneti, Y. V., Yue, J., Jiang, X., and Yu, A. (2013). Controllable synthesis of ZnO nanoflakes with exposed (1010) for enhanced gas sensing performance. J. Phys. Chem. C 117, 13153–13162. doi:10.1021/jp404329q
Khan, F. U., Mehmood, S., Liu, S., Xu, W., Shah, M. N., Zhao, X., et al. (2021). A p-n heterojunction based Pd/PdO@ZnO organic frameworks for high-sensitivity room-temperature formaldehyde gas sensor. Front. Chem. 9, 742488. doi:10.3389/fchem.2021.742488
Kumar, V., Vikrant, K., and Kim, K. H. (2019). Use of graphene-based structures as platforms for the trace-level detection of gaseous formaldehyde and insights into their superior sensing potentials. TrAC Trends Anal. Chem. 121, 115694. doi:10.1016/j.trac.2019.115694
Li, X., Wang, J., Xie, D., Xu, J., Xia, Y., Xiang, L., et al. (2017). Reduced graphene oxide/MoS2 hybrid films for room-temperature formaldehyde detection. Mat. Lett. 189, 42–45. doi:10.1016/j.matlet.2016.11.046
Liu, C., Hu, J., Wu, G., Cao, J., Zhang, Z., and Zhang, Y. (2021). Carbon nanotube-based field-effect transistor-type sensor with a sensing gate for ppb-level formaldehyde detection. ACS Appl. Mat. Interfaces 13, 56309–56319. doi:10.1021/acsami.1c17044
Liu, C., Zhao, L., Wang, B., Sun, P., Wang, Q., Gao, Y., et al. (2017). Acetone gas sensor based on NiO/ZnO hollow spheres: Fast response and recovery, and low (ppb) detection limit. J. Colloid Interface Sci. 495, 207–215. doi:10.1016/j.jcis.2017.01.106
Lorrain, J. M., Fortune, C. R., and Dellinger, B. (1981). Sampling and ion chromatographic determination of formaldehyde and acetaldehyde. Anal. Chem. 53, 1302–1305. doi:10.1021/ac00231a038
Mohamed, H. H. (2019). Rationally designed Fe2O3/GO/WO3 Z-Scheme photocatalyst for enhanced solar light photocatalytic water remediation. J. Photochem. Photobiol. A Chem. 378, 74–84. doi:10.1016/j.jphotochem.2019.04.023
Mohlmann, G. R. (1985). Formaldehyde detection in air by laser-induced fluorescence. Appl. Spectrosc. 39, 98–101. doi:10.1366/0003702854249088
Möhner, M., Liu, Y., and Marsh, G. M. (2019). New insights into the mortality risk from nasopharyngeal cancer in the national cancer institute formaldehyde worker cohort study. J. Occup. Med. Toxicol. 14, 4–5. doi:10.1186/s12995-019-0224-2
Mu, H., Wang, K., Zhang, Z., and Xie, H. (2015). Formaldehyde graphene gas sensors modified by thermally evaporated tin oxides and tin compound films. J. Phys. Chem. C 119, 10102–10108. doi:10.1021/acs.jpcc.5b00967
Ng, K. H., Minggu, L. J., Mark-Lee, W. F., Arifin, K., Jumali, M. H. H., and Kassim, M. B. (2018). A new method for the fabrication of a bilayer WO3/Fe2O3 photoelectrode for enhanced photoelectrochemical performance. Mat. Res. Bull. 98, 47–52. doi:10.1016/j.materresbull.2017.04.019
Ozceri, E., Polat, N., Balci, S., and Tarhan, E. (2021). Room temperature emission from single defects in WO3 enhanced by plasmonic nanocrystals. Appl. Phys. Lett. 118, 231105. doi:10.1063/5.0048228
Park, H. J., Choi, N. J., Kang, H., Jung, M. Y., Park, J. W., Park, K. H., et al. (2014). A ppb-level formaldehyde gas sensor based on CuO nanocubes prepared using a polyol process. Sensors Actuators B Chem. 203, 282–288. doi:10.1016/j.snb.2014.06.118
Peng, X., Liu, J., Tan, Y., Mo, R., and Zhang, Y. (2022). A CuO thin film type sensor via inkjet printing technology with high reproducibility for ppb-level formaldehyde detection. Sensors Actuators B Chem. 362, 131775. doi:10.1016/j.snb.2022.131775
Punginsang, M., Wisitsoraat, A., Sriprachuabwong, C., Phokharatkul, D., Tuantranont, A., Phanichphant, S., et al. (2017). Roles of cobalt doping on ethanol-sensing mechanisms of flame-spray-made SnO 2 nanoparticles−electrolytically exfoliated graphene interfaces. Appl. Surf. Sci. 425, 351–366. doi:10.1016/j.apsusc.2017.06.265
Raaen, S., and Hunvik, K. W. B. (2020). Non-activated adsorption of methane on nickel surfaces induced by reduced work function. Appl. Surf. Sci. 528, 146955. doi:10.1016/j.apsusc.2020.146955
Ren, Z., Luo, H., Mao, H., Li, A., Dong, R., Liu, S., et al. (2020). Hybrid supercapacitor based on graphene and Ni/Ni(OH)2 nanoparticles formed by a modified electrochemical exfoliation method. Chem. Phys. Lett. 760, 138019. doi:10.1016/j.cplett.2020.138019
Song, M. G., Choi, J., Jeong, H. E., Song, K. H., Jeon, S., Cha, J. H., et al. (2020). A comprehensive study of various amine-functionalized graphene oxides for room temperature formaldehyde gas detection: Experimental and theoretical approaches. Appl. Surf. Sci. 529, 147189. doi:10.1016/j.apsusc.2020.147189
Sun, G. J., Choi, S. W., Jung, S. H., Katoch, A., and Kim, S. S. (2013). V-groove SnO2 nanowire sensors: Fabrication and Pt-nanoparticle decoration. Nanotechnology 24, 025504. doi:10.1088/0957-4484/24/2/025504
Sun, J., Sun, L., Bai, S., Fu, H., Guo, J., Feng, Y., et al. (2019). Pyrolyzing Co/Zn bimetallic organic framework to form p-n heterojunction of Co3O4/ZnO for detection of formaldehyde. Sensors Actuators B Chem. 285, 291–301. doi:10.1016/j.snb.2018.12.080
Sun, Y., Hu, J., and Zhang, Y. (2022). Visible light assisted trace gaseous NO2 sensor with anti-humidity ability via LSPR enhancement effect. Sensors Actuators B Chem. 367, 132032. doi:10.1016/j.snb.2022.132032
Tang, M., Wang, X., Wu, F., Liu, Y., Zhang, S., Pang, X., et al. (2014). Au nanoparticle/graphene oxide hybrids as stabilizers for Pickering emulsions and Au nanoparticle/graphene oxide@polystyrene microspheres. Carbon N. Y. 71, 238–248. doi:10.1016/j.carbon.2014.01.034
Tang, Y., Han, Z., Qi, Y., Yang, Z., Han, H., Jiang, Y., et al. (2022). Enhanced ppb-level formaldehyde sensing performance over Pt deposited SnO2 nanospheres. J. Alloys Compd. 899, 163230. doi:10.1016/j.jallcom.2021.163230
Tran, V. A., Nguyen, T. P., Le, V. T., Kim, I. T., Lee, S. W., and Nguyen, C. T. (2021). Excellent photocatalytic activity of ternary Ag@WO3@rGO nanocomposites under solar simulation irradiation. J. Sci. Adv. Mater. Devices 1, 108–117. doi:10.1016/j.jsamd.2020.12.001
Varghese, S. S., Lonkar, S., Singh, K. K., Swaminathan, S., and Abdala, A. (2015). Recent advances in graphene based gas sensors. Sensors Actuators B Chem. 218, 160–183. doi:10.1016/j.snb.2015.04.062
Wang, D., Zhang, M., Chen, Z., Li, H., Chen, A., Wang, X., et al. (2017). Enhanced formaldehyde sensing properties of hollow SnO2 nanofibers by graphene oxide. Sensors Actuators B Chem. 250, 533–542. doi:10.1016/j.snb.2017.04.164
Wang, S., Xiao, B., Yang, T., Wang, P., Xiao, C., Li, Z., et al. (2014). Enhanced HCHO gas sensing properties by Ag-loaded sunflower-like in 2O3 hierarchical nanostructures. J. Mat. Chem. A 2, 6598–6604. doi:10.1039/c3ta15110g
Wang, Z., Hou, C., De, Q., Gu, F., and Han, D. (2018). One-step synthesis of Co-doped In2O3 nanorods for high response of formaldehyde sensor at low temperature. ACS Sens. 3, 468–475. doi:10.1021/acssensors.7b00896
Wei, S., Li, S., Wei, R., Liu, S., and Du, W. (2021). Different morphologies of WO3 and their exposed facets-dependent acetone sensing properties. Sensors Actuators B Chem. 329, 129188. doi:10.1016/j.snb.2020.129188
Yang, Y., Li, M., and Zhu, Z. (2021). A disposable dual-signal enantioselective electrochemical sensor based on stereogenic porous chiral carbon nanotubes hydrogel. Talanta 232, 122445. doi:10.1016/j.talanta.2021.122445
Ye, Z., Tai, H., Xie, T., Yuan, Z., Liu, C., and Jiang, Y. (2016). Room temperature formaldehyde sensor with enhanced performance based on reduced graphene oxide/titanium dioxide. Sensors Actuators B Chem. 223, 149–156. doi:10.1016/j.snb.2015.09.102
Yoo, M. J., Lee, M. H., Szulejko, J. E., Vikrant, K., and Kim, K. H. (2021). A quantitation method for gaseous formaldehyde based on gas chromatography with metal–organic framework cold-trap sorbent as an effective alternative for HPLC-based standard protocol. Microchem. J. 160, 105624. doi:10.1016/j.microc.2020.105624
Yuan, Z., Li, R., Meng, F., Zhang, J., Zuo, K., and Han, E. (2019). Approaches to enhancing gas sensing properties: A review. Sensors Switz. 19, 1495. doi:10.3390/s19071495
Zhang, D., Liu, J., Jiang, C., Liu, A., and Xia, B. (2017). Quantitative detection of formaldehyde and ammonia gas via metal oxide-modified graphene-based sensor array combining with neural network model. Sensors Actuators B Chem. 240, 55–65. doi:10.1016/j.snb.2016.08.085
Zhang, K., Liu, C., Li, S., and Fan, J. (2019). A hydrophobic deep eutectic solvent based vortex-assisted liquid-liquid microextraction for the determination of formaldehyde from biological and indoor air samples by high performance liquid chromatography. J. Chromatogr. A 1589, 39–46. doi:10.1016/j.chroma.2018.12.063
Keywords: WO3-Ni-Gr composite, pn heterojunction-based gas sensors, room-temperature formaldehyde sensor, spill-over effect, long-term stability
Citation: Mehmood S, Khan FU, Shah MN, Ma J, Yang Y, Li G, Xu W, Zhao X, He W and Pan X (2022) A novel room-temperature formaldehyde gas sensor based on walnut-like WO3 modification on Ni–graphene composites. Front. Chem. 10:971859. doi: 10.3389/fchem.2022.971859
Received: 17 June 2022; Accepted: 12 August 2022;
Published: 09 September 2022.
Edited by:
Wen Zeng, Chongqing University, ChinaReviewed by:
Sunil Lonkar, Technology Innovation Institute (TII), United Arab EmiratesYong Zhang, Xiangtan University, China
Copyright © 2022 Mehmood, Khan, Shah, Ma, Yang, Li, Xu, Zhao, He and Pan. This is an open-access article distributed under the terms of the Creative Commons Attribution License (CC BY). The use, distribution or reproduction in other forums is permitted, provided the original author(s) and the copyright owner(s) are credited and that the original publication in this journal is cited, in accordance with accepted academic practice. No use, distribution or reproduction is permitted which does not comply with these terms.
*Correspondence: Xiaofang Pan, ZWV4cGFuQHN6dS5lZHUuY24=