 Huan Qu
 Zhen Guo1
 Haijun Ma
 Yang Chen
- 1College of Biological Science and Engineering, North Minzu University, Yinchuan, Ningxia, China
- 2Ningxia Key Laboratory of Microbial Resources Development and Applications in Special Environment, Yinchuan, Ningxia, China
- 3Ningxia Grape and Wine Innovation Center, Yinchuan, Ningxia, China
- 4State Key Laboratory Breeding Base of Green Pesticide and Agricultural Bioengineering, Key Laboratory of Green Pesticide and Agricultural Bioengineering, Ministry of Education, Research and Development Center for Fine Chemicals, Guizhou University, Guiyang, China
Taking plant metabolites as material to develop new biological fungicides is still an important mission for pesticide development, and the preliminary study confirmed that Allium mongolicum showed a certain inhibitory effect on plant pathogens. In this study, the antifungal activity of extracts of A. mongolicum was studied and the compounds were isolated, purified, and identified by HPLC, NMR, and ESI-MS. The methanol extract of A. mongolicum exhibited certain inhibitory activity against almost all nine tested pathogens at concentration of 0.5 mg/ml. Sixteen compounds were isolated and purified from the extract, which were identified as nine flavonoids, six phenolic acids, and an amino acid. Among them, cinnamic acid derivatives 1, 2, and 3 and flavonoids 7, 8, 9, and 13 were separated in A. mongolicum for the first time.
1 Introduction
Food and Agriculture Organization of the United Nations (FAO) estimates that about 25% of the world’s crops are affected by plant diseases every year (Xing, 2018), which lead to the yield losses as well as reduced quality of crop production (Gao et al., 2016; Liu and Wang, 2016) and secrete a variety of toxins and harmful metabolites (Guo et al., 2021). As is reported, 70%–80% of the plant diseases are caused by plant phytopathogenic fungi, such as Magnaporthe oryzae, Fusarium graminearum, Valsa mali, and Botrytis cinerea, which are hard to control (Qin et al., 2013). For a long time, chemical antimicrobial agents play an important role in inhibiting plant-pathogenic fungi and promoting agricultural production. However, the long-term use of chemical agents has gradually been limited by the problems of food safety, environmental pollution, and the tendency of pathogenic microorganisms to develop resistance to them (Kim and Hwang, 2007; Akhter et al., 2015; Zhang et al., 2018). Therefore, development of new compounds with effectively inhibiting activity is still an important mission (Kang, 2010). Alliaceae has become an important source for finding useful compounds due to its significant and extensive antifungal activity, some of which have been used for agricultural diseases (Ma et al., 2014). As representative plants of Alliaceae, Allium sativum and Allium cepa gained more attention and significantly inhibited many kinds of microorganisms (Nicastro et al., 2015; Martins et al., 2016; Chen et al., 2017). Especially, the fungicides with garlic oil and ethylicin as the main effective components were successfully used for control of agricultural fungal and bacterial diseases.
As a kind of characteristic xerophytic plant of Allium, A. mongolicum is widely distributed in the desert regions of northwest China and its leaves are used as a high-quality forage plant as well as a natural green uncontaminated food (Zhang et al., 2017). However, for a long time, studies of A. mongolicum have focused only on its morphology and geographic distribution, artificial cultivation and nutritional value, seed germination characteristics, and genetic diversity (Yang et al., 2008; Zhang, et al., 2014; Hu et al., 2017). Recent studies have found that A. mongolicum has broad-spectrum antimicrobial activity. The aqueous and ethanol extracts of A. mongolicum exhibited certain inhibitory effects on Staphylococcus aureus and Escherichia coli and showed greater tolerance to ultraviolet light and temperature. In the course of studying the effect of A. mongolicum on mutton quality, it found that volatile oil, polysaccharide, and flavonoids showed an inhibitory effect on animal-related foodborne pathogens (Sa et al., 2014; Muqier et al., 2017). As an important material for finding antimicrobial compounds, some monomeric compounds of flavonoid and ethyl cinnamate, dibutyl oxalate, and 2-hexenal from the essential oil of A. mongolicum were gained in recent years (Wang et al., 2012; Dong et al., 2015; Dong et al., 2020). However, the antimicrobial activity compounds of A. mongolicum have not been systematically explored at present. Therefore, comparatively systematic research about the inhibitory effect of extracts of A. mongolicum on common plant-pathogenic fungi was made based on the above in this article, and monomeric compound of extracts of A. mongolicum were isolated, purified, and identified, which would lay a foundation for the research and development of new botanical pesticides.
2 Materials and methods
2.1 Materials
A. mongolicum were collected from Luanjingtan in Alxa Zuoqi, Inner Mongolia in July (E 105°23′46.12″, N 37°51′36.42″, altitude 1,430 m). Healthy plants were selected, and aboveground parts were collected to be taken back to the laboratory. Tested plant pathogenic fungi: Fusarium oxysporum, Exserohilum turcicum, Valsa mali, Fusarium graminearum, Botrytis cinerea, Alternaria solani, and Fusarium sulphureum were provided by Northwest A&F University; Fusarium solani and Corynespora cassiicola were preserved and provided by Ningxia Key Laboratory of Microbial Resources Development and Applications in Special Environment.
2.2 Preparation of extracts of A. mongolicum
Plant extracts were prepared by solvent extraction with some modification (Prashith et al., 2015). The leaves of A. mongolicum were cut into small pieces and dried under shade for 7 days at 32–35°C, then powdered in a blender and stored in a sealed fresh-storage bottle away from light. Dry powder was separately extracted by soaking in 10times the volume of petroleum ether, dichloromethane, ethyl acetate, and methanol for 48 h. The extract was filtered out, and the same process is repeated three times. The filtrates were combined and concentrated to paste at 45–50°C by a rotary evaporator and stored in a refrigerator at 4°C for later used.
2.3 Antifungal activity assays of extracts of A. mongolicum
Antifungal activity of petroleum ether, dichloromethane, ethyl acetate, and methanol extracts was evaluated by the poisoned food technique (Liu et al., 2017). The extracts were prepared using acetone as the initial solvent carrier followed by dilution with PDA (at about 60°C) to produce the desired concentrations of 0.5 mg/ml, then poured into a sterile petri dish (9 cm in diameter) to make a medium-filled plate. After the medium was solidified, a mycelial disk (with a diameter of 4 mm) containing tested pathogenic fungi was placed in each medium plane. The PDA plates were incubated in the light-dark cycle at 28 ± 1°C for 5 days. PDA plates treated with an equal quantity of acetone were used as control. Each treatment was treated using three biological replicates. The mycelial growth inhibition was calculated by the formula.
where C is the mycelial diameter (mm) of the control and T is the mycelial diameter (mm) under extract solution treatment.
2.4 Isolation, purification, and structure identification of compounds from A. mongolicum
A. mongolicum powder (6.4 kg) was extracted with methanol-water (4:1, v/v) for 1 h three times by using ultrasonic treatment. The extracts were combined and centrifuged, then discard precipitation; the filtrate was concentrated to paste at 45°C, dispersed in appropriate amount of water. The aqueous phase was extracted with petroleum ether and ethyl acetate in turn three times. The petroleum ether phase was discarded, and the ethyl acetate and water phase were retained.
The ethyl acetate phase was concentrated under reduced pressure at 45°C to obtain crude extract. The extract was isolated by normal-phase silica gel chromatography and then eluted with petroleum ether-ethyl acetate-methanol, ethyl acetate, and methanol-ethyl acetate fractions were collected. Ethyl acetate fraction was concentrated and dissolved in methanol, and separated based on high-performance liquid chromatography to gain the compounds of 1 (100 mg), 2 (90 mg), and 3 (125 mg). Methanol-ethyl acetate (5:1, v/v) fraction was concentrated and dissolved in methanol, separated using high-performance liquid chromatography (HPLC) to gain the compounds of 4 (240 mg) and 5 (40 mg). Methanol-ethyl acetate (1:1, v/v) fraction was concentrated and dissolved in methanol and separated using HPLC to gain the compounds of 6 (210 mg).
The aqueous phase was separated by AB-8 macroporous resin column chromatography with methanol-water as a mobile phase for gradient elution. Methanol-water (7:3, v/v) phase was collected, evaporated by rotary evaporator and dissolved in methanol for HPLC separation to gain 1, 2, 3, 4, and 5 fractions, fractions (1, 2, 3, 4, and 5) were further isolated through HPLC. Fraction 1 was eluted with methanol-water and acetonitrile-water to obtain compounds numbered 7 (60 mg), 8 (40 mg), 9 (30 mg), 10 (200 mg). Fraction 2 was eluted with methanol-water and acetonitrile-water to obtain compounds numbered 11 (10 mg), 12 (20 mg), 13 (40 mg). Fraction 3 was concentrated to remove some solvents and the compound 14 (1,500 mg) separated out with standing for 24 h. Fraction 5 was eluted with methanol-water and acetonitrile-water to obtain compounds numbered 15 (60 mg), 6 (905 mg), and 16(70 mg).
2.5 Compound structure identification
The mass spectrum, 1H-NMR (400 MHz), and 13C-NMR (100 MHz) spectra of the compounds were determined. The chemical structure of the compounds was identified according to spectroscopic data.
3 Results and discussion
3.1 Results
3.1.1 Toxicity determination of extracts of A. mongolicum
The extract of A. mongolicum showed different degrees of inhibition on the mycelial growth of nine different plant-pathogenic fungi (Table 1). Among them, the inhibitory effects of all tested extracts on Fusarium solani and Fusarium graminearum were better, and the inhibition rate was about over 30%. Generally, the inhibitory effects of petroleum ether extract and methanol extract were higher than that of dichloromethane extract and ethyl acetate extract, and petroleum ether extract and methanol extract almost showed inhibitory activity on all tested pathogens. Based on the former results, the methanol extract with the yield of 23.31% was much higher than that of petroleum ether extract (4.27%), as well as, petroleum ether extract contained more pigment. Considering the polarity of the solvent, the methanol extract is richer in types of compounds compared with petroleum ether extract. Therefore, methanol was selected as the solvent in the subsequent extract experiment.
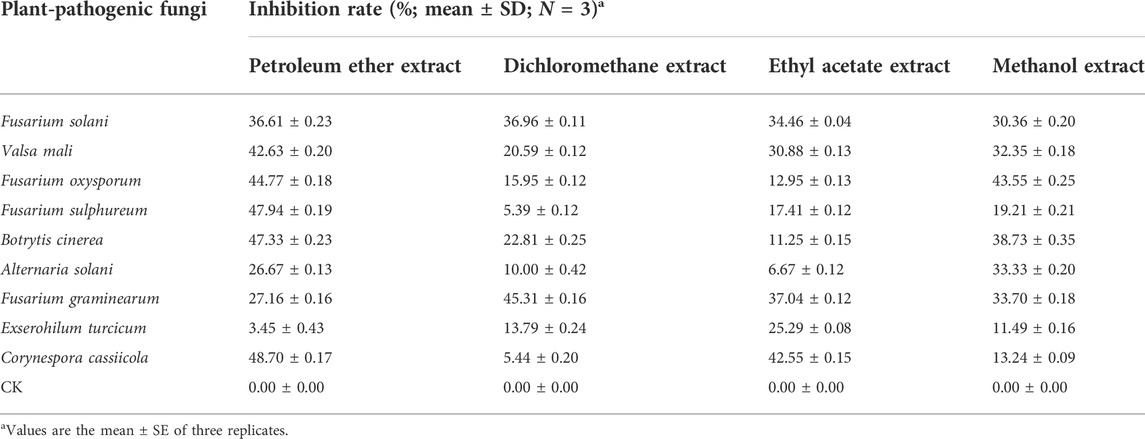
TABLE 1. Toxicity test results of extracts of A. mongolicum against nine plant-pathogenic fungi at a concentration of 0.5 mg/ml (96 h of incubation).
3.1.2 Chemical structure identification of compounds from A. mongolicum
Data for compound 1: gray powder, m. p. 212–213°C; ESI-MS: Calcd for C17H17NO3 ([M + H]+), 284.16; 1H NMR (400 MHz, Methanol-d4) δ: 7.44 (d, J = 15.7 Hz, 1H, H-7), 7.39 (d, J = 8.6 Hz, 2H, H-2, 6), 7.09–7.02 (m, 2H, H-2′, 6′), 6.82–6.76 (m, 2H, H-3, 5), 6.75–6.66 (m, 2H, H-3′, 5′), 6.38 (d, J = 15.7 Hz, 1H,H-8), 3.46 (t, J = 7.4 Hz, 2H, H-8′), 2.75 (t, J = 7.4 Hz, 2H, H-7′); 13C NMR (100 MHz, Methanol-d4) δ: 169.25 (C-9), 160.49 (C-4), 156.91 (C-4′), 141.77 (C-7), 131.33 (C-1′), 130.72 (C-2′, 6′), 130.54 (C-2, 6), 127.75 (C-1), 118.47 (C-8), 116.72 (C-3′, 5′), 116.27 (C-3, 5), 42.53 (C-8′), and 35.80 (C-7′). According to the abovementioned data and literature (Kim and Lee, 2003), compound 1 was identified as trans-N-p-coumaroyl tyramine and its molecular formula is shown in Figure 1. MS diagrams and 1H-NMR and 13C-NMR spectra were shown in Supplementary Figures S1–S3, respectively.

FIGURE 1. Chemical structure of compounds 1, 2, and 3
Data for compound 2: white powder, m. p. 123–125°C; ESI-MS: Calcd for C18H19NO4([M + H]+), 314.16; 1H NMR (400 MHz, Methanol-d4) δ: 7.47–7.40 (m, 1H, H-7), 7.11 (d, J = 1.9 Hz, 1H, H-2), 7.07–7.04 (m, 2H, H-2′, 6′), 7.02 (dd, J = 8.2, 2.0 Hz, 1H, H-6), 6.81 (s, 1H, H-5), 6.74–6.70 (m, 2H, H-3′, 5′), 6.40 (d, J = 15.7 Hz, 1H, H-8), 3.88 (s, 3H, H-3), 3.47 (dd, J = 8.0, 6.7 Hz, 2H, H-8′), 2.75 (t, J = 7.3 Hz, 2H, H-7′); 13C NMR (100 MHz, Methanol-d4) δ: 169.18 (C-9), 156.92 (C-4′), 149.82 (C-3), 149.29 (C-4), 142.01 (C-7), 131.32 (C-1′), 130.72 (C-2′, 6′), 128.31 (C-1), 123.22 (C-6), 118.80 (C-8), 116.47 (C-3′, 5′), 116.28 (C-5), 111.59 (C-2), 56.41 (OCH3-3), 42.52 (C-8′), and 35.79 (C-7′). According to the abovementioned data and literature (Jiang and Ying, 2017), compound 2 was identified as N-trans-feruloyl tyramine and its molecular formula is shown in Figure 1. MS diagrams and 1H-NMR and 13C-NMR spectra were shown in Supplementary Figures S4–S6, respectively.
Data for compound 3: steel gray solid, m. p. 132–134°C; ESI-MS: Calcd for C19H21NO5([M + H]+), 344.19; 1H NMR (400 MHz, Methanol-d4) δ: 7.44 (d, J = 15.7 Hz, 1H, H-7), 7.11 (d, J = 1.9 Hz, 1H, H-6), 7.02 (dd, J = 8.2, 2.0 Hz, 1H, H-2), 6.84–6.74 (m, 2H,H-2′, 6′), 6.72 (d, J = 8.0 Hz, 1H, H-3), 6.66 (dd, J = 8.0, 1.9 Hz, 1H), 6.41 (d, J = 15.7 Hz, 1H, H-8), 3.87 (s, 3H, H-5), 3.82 (s, 3H, H-3′), 3.49 (dd, J = 8.0, 6.7 Hz, 2H, H-8′), 2.77 (t, J = 7.3 Hz, 2H, H-7′); 13C NMR (100 MHz, Methanol-d4) δ: 169.19 (C-9), 149.84 (C-4), 149.29 (C-3), 148.95 (C-3′), 146.05 (C-4′), 142.02 (C-7), 132.05 (C-1′), 128.29 (C-1), 123.19 (C-6), 122.26 (C-6′), 118.80 (C-8), 116.48 (C-5), 116.21 (C-5′), 113.49 (C-2′), 111.59 (C-2), 56.40 (OCH3-3), 56.37 (OCH3-3′), 42.46 (C-8′), and 36.20 (C-7′). According to the abovementioned data and literature (Jiang and Ying, 2017), compound 3 was identified as N-trans-feruloyl-3-methoxy tyramine and its molecular formula is shown in Figure 1. MS diagrams and 1H-NMR and 13C-NMR spectra were shown in Supplementary Figures S7–S9, respectively.
Data for compound 4: pale yellow powder, m. p. 179–182°C; ESI-MS: Calcd for C21H20O12 ([M + H]+), 465.12; 1H NMR (400 MHz, DMSO-d6) δ: 12.63 (s, 1H, H-5), 10.91 (s, 1H,H-4′), 9.72 (s, 1H, H-7), 9.21 (s, 1H, H-3′), 7.62–7.52 (m, 2H, H-2′, 6′), 6.89–6.76 (m, 1H, H-5′), 6.42 (d, J = 2.1 Hz, 1H, H-8), 6.21 (d, J = 2.0 Hz, 1H, H-6), 5.46 (d, J = 7.4 Hz, 1H, H-1″), 5.27 (d, J = 3.8 Hz, 1H), 5.07–5.02 (m, 1H), 4.94 (d, J = 3.6 Hz, 1H), 4.24 (t, J = 5.7 Hz, 1H), 3.59 (dd, J = 11.5, 4.4 Hz, 1H), 3.30–3.20 (m, 3H), 3.20–3.05 (m, 2H, H-6″); 13C NMR (100 MHz, DMSO-d6) δ: 177.45 (C-4), 164.15 (C-7), 161.24 (C-5), 156.32 (C-9), 156.20 (C-2), 148.47 (C-4′), 144.82 (C-3′), 133.35 (C-3), 121.60 (C-6′), 121.16 (C-1′), 116.21 (C-2′), 115.22 (C-5′), 103.98 (C-10), 100.91 (C-1″), 98.67 (C-6), 93.51 (C-8), 77.55 (C-3″), 76.52 (C-5″), 74.10 (C-2″), 69.95 (C-4″), and 60.98 (C-6″). According to the abovementioned data and literature (Dong et al., 2016), compound 4 was identified as Isoquercitrin and its molecular formula is shown in Figure 2. MS diagrams and 1H-NMR and 13C-NMR spectra were shown in Supplementary Figures S10–S12, respectively.
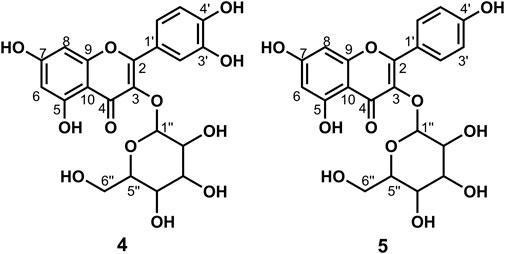
FIGURE 2. Chemical structure of compounds 4 and 5
Data for compound 5: pale yellow powder, m. p. 196–198°C; ESI-MS: Calcd for C21H20O11([M + H]+), 449.14; 1H NMR (400 MHz, DMSO-d6) δ: 12.61 (s, 1H, H-5), 10.89 (s, 1H, H-4′), 10.18 (s, 1H, H-7), 8.08–8.00 (m, 2H, H-2′, 6′), 6.97–6.85 (m, 2H, H-3′, 5′), 6.44 (d, J = 2.1 Hz, 1H, H-8), 6.22 (d, J = 2.1 Hz, 1H, H-6), 5.45 (d, J = 7.3 Hz, 1H, H-1″), 5.31 (d, J = 4.3 Hz, 1H), 5.02 (d, J = 4.4 Hz, 1H), 4.92 (d, J = 3.7 Hz, 1H), 4.23 (t, J = 5.6 Hz, 1H), 3.57 (dd, J = 11.6, 5.0 Hz, 1H), 3.28–3.15 (m, 3H), 3.14–3.04 (m, 2H, H-6″); 13C NMR (100 MHz, DMSO-d6) δ: 177.47 (C-4), 164.15 (C-7), 161.21 (C-5), 159.96 (C-4′), 156.38 (C-2), 156.26 (C-9), 133.21 (C-3), 130.86 (C-2′, C-6′), 120.88 (C-1′), 115.10 (C-3′, 5′), 104.00 (C-10), 100.91 (C-1″), 98.69 (C-6), 93.64 (C-8), 77.47 (C-3″), 76.44 (C-5″), 74.21 (C-2″), 69.91 (C-4″), and 60.85 (C-6″). According to the abovementioned data and combined with the literature (Dong et al., 2015), compound 5 was identified as Kaempferol-3-O-glucoside and its molecular formula is shown in Figure 2. MS diagrams and 1H-NMR and 13C-NMR spectra were shown in Supplementary Figures S13–S15, respectively.
Data for compound 6: pale yellow powder, m. p. 175–177°C; ESI-MS: Calcd for C27H30O16 ([M + H]+), 611.19; 1H NMR (400 MHz, DMSO-d6) δ: 12.59 (s, 1H, H-5), 10.81 (s, 1H,H-4′), 9.61 (s, 1H, H-7), 9.16 (s, 1H, H-3′), 7.54 (d, J = 7.5 Hz, 2H, H-2′, 6′), 6.85–6.84 (m, 1H, H-5′), 6.39 (d, J = 2.1 Hz, 1H, H-8), 6.20 (d, J = 2.1 Hz, 1H,H-6), 5.39–5.30 (m, 1H, 1″), 5.2 (s, 1H), 5.05 (s, 1H), 4.39 (d, J = 1.6 Hz, 2H), 4.34 (s, 1H), 3.71 (d, J = 10.6 Hz, 1H), 3.40 (dd, J = 3.5, 1.6 Hz, 1H), 3.31–3.20 (m, 7H), 3.08 (t, J = 9.2 Hz, 3H), 1.00 (d, J = 6.2 Hz, 3H, H-6‴); 13C NMR (100 MHz, DMSO-d6) δ: 177.35 (C-4), 164.07 (C-7), 161.20 (C-5), 156.57 (C-9), 156.40 (C-2), 148.39 (C-4′), 144.73 (C-3′), 133.30 (C-3), 121.56 (C-6′), 121.16 (C-1′), 116.25 (C-2′), 115.21 (C-5′), 103.94 (C-10), 101.18 (C-1″), 100.72 (C-1‴), 98.65 (C-6), 93.55 (C-8), 76.45 (C-3″), 75.90 (C-5″), 74.06 (C-2″), 71.84 (C-4‴), 70.55 (C-3‴), 70.35 (C-2‴), 69.99 (C-4″), 68.21 (C-5‴), 66.97 (C-6″), and 17.70 (C-6‴). According to the abovementioned data and literature (Dong et al., 2016), compound 6 was identified as Rutin and its molecular formula is shown in Figure 3. MS diagrams and 1H-NMR and 13C-NMR spectra were shown in Supplementary Figures S16–S18, respectively.

FIGURE 3. Chemical structure of compounds 6 and 16.
Data for compound 7: pale yellow powder, m. p. 187–189°C; ESI-MS: Calcd for C33H38O23([M + H]+), 803.05; 1H NMR (400 MHz, DMSO-d6) δ: 12.56 (s, 1H, H-5), 8.93 (s, 1H, H-3′), 7.68 (d, J = 2.2 Hz, 1H, H-2′), 7.64 (dd, J = 8.6, 2.3 Hz, 1H, H-6′), 7.23 (d, J = 8.7 Hz, 1H, H-5′), 6.85 (d, J = 2.1 Hz, 1H, H-8), 6.46 (d, J = 2.1 Hz, 1H, H-6), 5.56–5.44 (m, 4H), 5.30 (t, J = 2.4 Hz, 1H), 5.23 (d, J = 7.3 Hz, 2H), 5.09 (s, 3H), 4.97 (s, 1H), 4.87 (d, J = 7.1 Hz, 1H, H-1‴), 4.63 (t, J = 5.7 Hz, 1H), 4.31 (t, J = 5.8 Hz, 1H), 3.92 (d, J = 7.9 Hz, 1H), 3.77–3.70 (m, 2H), 3.59 (dd, J = 11.3, 5.0 Hz, 2H), 3.49 (d, J = 6.1 Hz, 2H), 3.26–3.15 (m, 7H), 3.10 (d, J = 4.1 Hz, 3H); 13C NMR (100 MHz, DMSO-d6) δ: 177.75 (C-4), 172.00 (C-6‴'), 162.68 (C-7), 160.85 (C-5), 156.07 (C-2), 156.07 (C-9), 147.67 (C-4′), 146.19 (C-3′), 134.16 (C-3), 124.33 (C-1′), 121.06 (C-6′), 116.64 (C-2′), 115.45 (C-5′), 105.81 (C-10), 101.48 (C-1‴), 100.65 (C-1″), 99.35 (C-1‴'), 99.20 (C-6), 94.33 (C-8),77.69 (C-5″), 77.26 (C-5‴), 76.50 (C-3″), 75.94 (C-3‴'), 75.83 (C-3‴), 74.85 (C-5‴'), 74.12 (C-2″), 73.26 (C-2‴), 72.80 (C-2‴'), 71.49 (C-4‴'), 70.00 (C-4″), 69.78 (C-4‴), 60.97 (C-6″), and 60.72 (C-6‴). According to the abovementioned data and literature (Fossen et al., 2006; Dong et al., 2020), compound 7 was identified as Quercetin-3,7-O-diglucoside-4′-O-glucuronide and its molecular formula is shown in Figure 4. MS diagrams and 1H-NMR and 13C-NMR spectra were shown in Supplementary Figures S19–S21, respectively.
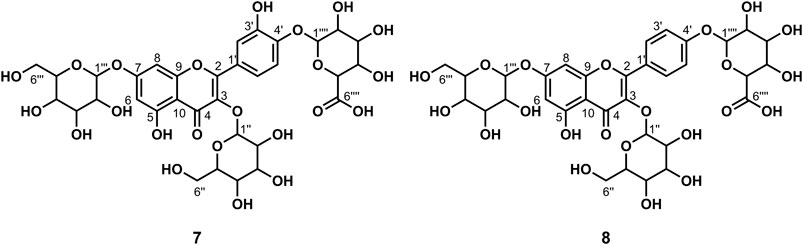
FIGURE 4. Chemical structure of compounds 7 and 8
Data for compound 8: pale yellow powder, m. p. 185–187°C; ESI-MS: Calcd for C33H38O22 ([M + H]+), 787.29; 1H NMR (400 MHz, DMSO-d6) δ:12.56 (s, 1H, H-5), 8.15 (d, J = 8.9 Hz, 2H, H-2′, 6′), 7.18 (d, J = 8.9 Hz, 2H, H-3′, 5′), 6.87 (d, J = 2.2 Hz, 1H, H-8), 6.47 (d, J = 2.2 Hz, 1H, H-6), 5.52 (d, J = 4.7 Hz, 1H), 5.48 (d, J = 7.3 Hz, 1H, H-1″), 5.35 (dd, J = 11.6, 4.5 Hz, 2H), 5.28 (d, J = 6.7 Hz, 2H), 5.12 (s, 1H), 5.09–5.01 (m, 3H), 4.97 (d, J = 4.2 Hz, 1H), 4.65–4.52 (m, 1H), 4.31 (t, J = 5.8 Hz, 1H), 4.02 (d, J = 9.3 Hz, 1H), 3.71 (dd, J = 11.5, 4.7 Hz, 1H), 3.57 (dd, J = 11.7, 5.7 Hz, 2H), 3.52–3.47 (m, 3H), 3.30–3.05 (m, 11H);13C NMR (100 MHz, DMSO-d6) δ: 177.77 (C-4), 170.23 (C-6‴'), 162.54 (C-7), 160.91 (C-5), 159.38 (C-4′), 156.24 (C-9), 156.13 (C-2), 134.07 (C-3), 130.66 (C-2′, 6′), 123.58 (C-1′), 115.85 (C-3′, 5′), 105.91 (C-10), 100.76 (C-1″), 99.97 (C-1‴), 99.33 (C-6), 99.11 (C-1‴'), 94.39 (C-8), 77.62 (C-5″), 77.11 (C-5‴), 76.55 (C-3‴), 76.45 (C-3″), 75.73 (C-3‴'), 75.27 (C-5‴'), 74.20 (C-2″), 73.23 (C-2‴), 72.77 (C-2‴'), 71.28 (C-4‴'), 69.94 (C-4″), 69.66 (C-4‴), 60.88 (C-6″), and 60.66 (C-6‴). According to the abovementioned data and literature (Dong et al., 2020), compound 8 was identified as Kaempferol-3,7-O-diglucoside-4′-O-glucuronide and its molecular formula is shown in Figure 4. MS diagrams and 1H-NMR and 13C-NMR spectra were shown in Supplementary Figures S22–S24, respectively.
Data for compound 9: pale yellow powder, m. p. 181–182°C; ESI-MS: Calcd for C39H48O27([M + H]+), 949.52; 1H NMR (400 MHz, DMSO-d6) δ: 12.54 (s, 1H, H-5), 8.18–8.06 (m, 2H, H-2′, 6′), 7.22–7.12 (m, 2H, H-3′, 5′), 6.86 (d, J = 2.1 Hz, 1H, H-8), 6.47 (d, J = 2.1 Hz, 1H, H-6), 5.57–5.42 (m, 4H), 5.36 (d, J = 4.6 Hz, 1H), 5.22 (dd, J = 12.1, 6.0 Hz, 4H), 5.12 (s, 1H, H-1‴''), 5.08–4.96 (m, 5H), 4.76 (d, J = 1.9 Hz, 1H), 4.64–4.55 (m, 2H), 4.40 (t, J = 5.8 Hz, 1H), 4.27 (d, J = 7.8 Hz, 1H, H-1‴), 3.93 (d, J = 8.6 Hz, 1H), 3.76–3.68 (m, 3H), 3.67–3.59 (m, 2H), 3.58–3.43 (m, 5H), 3.26–3.11 (m, 7H), 3.07 (d, J = 9.5 Hz, 1H), 3.06–2.99 (m, 2H); 13C NMR (100 MHz, DMSO-d6) δ: 177.67 (C-4), 170.87 (C-6‴''), 162.69 (C-7), 160.86 (C-5), 159.39 (C-4′), 156.29 (C-2), 156.11 (C-9), 134.00 (C-3), 130.64 (C-2′, 6′), 123.50 (C-1′), 115.87 (C-3′, 5′), 105.84 (C-10), 103.09 (C-1‴), 100.51 (C-1″), 99.95 (C-1‴''), 99.40 (6), 99.21 (C-1‴'), 94.45 (C-8), 80.05 (C-4″), 77.09 (C-5‴'), 76.78 (C-5‴), 76.53 (C-3‴'), 76.44 (C-3‴),75.89 (C-3‴''), 75.50 (C-5″),74.74 (C-3″), 73.93 (C-5‴''), 73.26 (C-2‴, C-2‴'), 73.22 (C-2″), 72.80 (C-2‴''), 71.43 (C-4‴''), 70.03 (C-4‴), 69.64 (C-4‴'), 61.01 (C-6‴), 60.66 (C-6‴'), and 60.16 (C-6″). According to the abovementioned data and literature (Dong et al., 2020), compound 9 was identified as Kaempferol-3-O-gentiobiose-7-O-glucose-4′-O-glucuronide and its molecular formula is shown in Figure 5. MS diagrams and 1H-NMR and 13C-NMR spectra were shown in Supplementary Figures S25–S27, respectively.
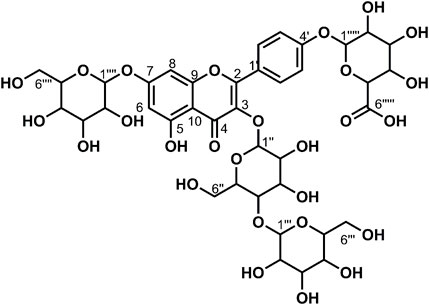
FIGURE 5. Chemical structure of compound 9.
Data for compound 10: pale yellow crystal solid, m. p. 140–145°C; ESI-MS: Calcd forC21H28O14 ([M-H]-), 503.20; 1H NMR (400 MHz, DMSO-d6) δ: 7.55 (d, J = 15.9 Hz, 1H, H-7), 7.40 (d, J = 15.9 Hz, 1H, H-7), 7.06 (d, J = 2.1 Hz, 1H, H-2), 7.07–7.00 (m, 1H, H-2), 7.04–6.98 (m, 1H, H-6), 6.95 (dd, J = 8.2, 2.1 Hz, 1H, H-6), 6.76 (dd, J = 8.2, 6.0 Hz, 2H, H-5), 6.27 (d, J = 15.9 Hz, 1H, H-8), 6.16 (d, J = 15.9 Hz, 1H, H-8), 5.60–5.52 (m, 1H, H-3′), 5.15 (d, J = 3.4 Hz, 1H), 5.16–4.35 (m, 16H), 3.70–3.32 (m, 15H), 3.25–2.85 (m, 13H), 2.06 (s, 1H); 13C NMR (100 MHz, DMSO-d6) δ: 167.83 (C-9), 164.95 (C-9), 148.58 (C-4), 148.11 (C-4), 146.17 (C-7), 145.54 (C-3), 144.54 (C-3), 125.68 (C-1), 125.56 (C-1), 121.58 (C-6), 121.09 (C-6), 115.73 (C-5), 115.09 (C-5), 114.88 (C-2), 114.61 (C-2), 113.53 (C-8), 105.09 (C-1″), 104.56 (C-1″), 92.46 (C-1′), 91.44 (C-1′), 82.22 (C-2′), 81.66 (C-2′), 77.63 (C-5″), 76.83 (C-3″), 76.72 (C-3″), 76.38 (C-5′), 76.18 (C-5′), 75.75 (C-4′), 74.56 (C-3′), 73.87 (C-3′), 71.83 (C-2″), 71.68 (C-2″), 70.18 (C-2′), 70.08 (C-2′), 69.46 (C-4″), 69.17 (C-4″), 61.20 (C-6′), 61.11 (C-6″), 60.46 (C-6′), and 60.41 (C-6″). According to the abovementioned data and literature (Duan, et al., 2012; Dong et al., 2020), compound 10 was identified as 1-Caffeoyl gentiobioside (two kinds of sugar configurations: α and β) and its molecular formula is shown in Figure 6. MS diagrams and 1H-NMR and 13C-NMR spectra were shown in Supplementary Figures S27–S30, respectively.
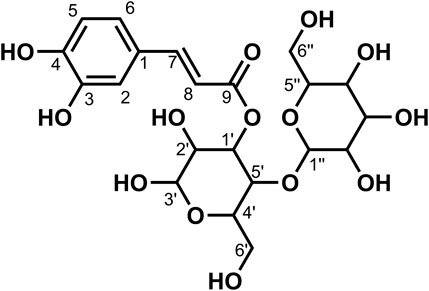
FIGURE 6. Chemical structure of compound 10.
Data for compound 11: white powder, m. p. 142–144°C; ESI-MS: Calcd for C15H18O9([M-H]-), 341.17; 1H NMR (400 MHz, DMSO-d6) δ: 7.55 (d, J = 15.8 Hz, 1H, H-7), 7.08 (d, J = 2.1 Hz, 1H, H-2), 7.01 (dd, J = 8.2, 2.0 Hz, 1H, H-6), 6.78 (d, J = 8.2 Hz, 1H, H-5), 6.26 (d, J = 15.9 Hz, 1H,H-8), 5.45 (d, J = 7.9 Hz, 1H), 5.28 (s, 1H), 5.06 (s, 2H,H-6′), 4.58 (s, 1H), 3.69–3.62 (m, 2H), 3.31–3.10 (m, 6H); 13C NMR (100 MHz, DMSO-d6) δ: 165.39 (C-9), 148.81 (C-4), 146.47 (C-7), 145.70 (C-3), 125.42 (C-1), 121.74 (C-6), 115.86 (C-5), 114.91 (C-8), 113.41 (C-2), 94.31 (C-1′), 77.86 (C-5′), 76.52 (C-3′), 72.56 (C-2′), 69.60 (C-4′), and 60.67 (C-6′). According to the abovementioned data and literature (Dong et al., 2020), compound 11 was identified as 1-Caffeoyl glucoside and its molecular formula is shown in Figure 7. MS diagrams and 1H-NMR and 13C-NMR spectra were shown in Supplementary Figures S31–S33, respectively.
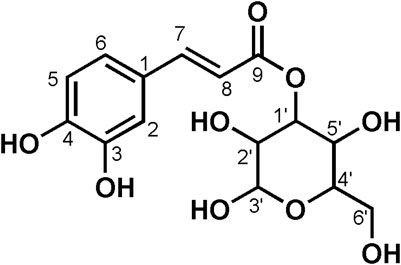
FIGURE 7. Chemical structure of compound 11.
Data for compound 12: pale yellow crystal solid, m. p. 118–119°C; ESI-MS: Calcd for C21H28O13 ([M-H]-), 487.21; 1H NMR (400 MHz, DMSO-d6) δ: 10.06 (s, 1H, H-4), 7.63 (d, J = 15.9 Hz, 1H, H-7), 7.59–7.54 (m, 2H,H-2, 6), 6.84–6.74 (m, 2H, H-3, 5), 6.40 (d, J = 16.0 Hz, 1H, H-8), 5.61–5.51 (m, 1H), 5.42 (s, 1H), 5.14 (s, 2H), 4.84 (s, 2H), 4.59 (s, 1H), 4.43 (d, J = 7.8 Hz, 1H), 3.67 (dd, J = 12.1, 2.0 Hz, 1H), 3.59–3.43 (m, 5H), 3.25–3.13 (m, 3H), 3.13–3.06 (m, 3H), 2.95 (dd, J = 8.9, 7.8 Hz, 1H); 13C NMR (100 MHz, DMSO-d6) δ: 165.01 (C-9), 160.00 (C-4), 145.74 (C-7), 130.40 (C-2), 130.04 (C-6), 125.13 (C-1), 115.78 (C-3), 11 5.31 (C-5), 113.76 (C-8), 104.57 (C-1″), 92.46 (C-1′), 81.67 (C-2′), 77.65 (C-5′), 76.76 (C-5″), 76.19 (C-3″), 75.77 (C-3′), 74.55 (C-2″), 69.52 (C-4″), 69.18 (C-4′), 60.50 (C-6″), and 60.41 (C-6′). According to the abovementioned data and literature (Dong et al., 2020), compound 12 was identified as 1-p-Coumaroyl gentiobioside and its molecular formula is shown in Figure 8. MS diagrams and 1H-NMR and 13C-NMR spectra were shown in Supplementary Figures S34–S36, respectively.
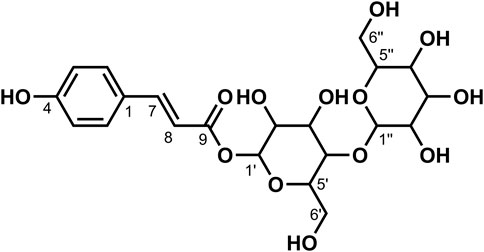
FIGURE 8. Chemical structure of compound 12.
Data for compound 13: pale yellow powder, m. p. 207–210°C; ESI-MS: Calcd for C33H38O22 ([M + H]+), 787.26; 1H NMR (400 MHz, DMSO-d6) δ: 12.62 (s, 1H, H-5), 9.74 (s, 1H, H-4′), 9.19 (s, 1H, H-3′),7.60–7.52 (m, 2H, H-2′, 6′), 6.86 (d, J = 8.2 Hz, 1H, H-5′), 6.74 (d, J = 2.1 Hz, 1H, H-8), 6.45 (d, J = 2.1 Hz, 1H, H-6), 5.48 (s, 1H, H-1′), 5.35 (d, J = 7.1 Hz, 1H), 5.25 (dd, J = 10.5, 5.6 Hz, 2H), 5.12–5.03 (m, 2H), 4.39 (d, J = 1.6 Hz, 1H), 3.94 (d, J = 8.8 Hz, 1H), 3.71 (d, J = 10.1 Hz, 1H), 3.36–3.21 (m, 15H), 3.17 (s, 1H), 3.12–3.03 (m, 2H, H-6‴), 0.98 (d, J = 6.2 Hz, 3H, H-6″); 13C NMR (100 MHz, DMSO-d6) δ: 177.51 (C-4), 170.68 (C-6‴'), 162.45 (C-7), 160.84 (C-5), 157.31 (C-2), 156.06 (C-9), 148.61 (C-4′), 144.77 (C-3′), 133.55 (C-3), 121.65 (C-1′), 121.03 (C-6′), 116.47 (C-2′), 115.21 (C-5′), 105.71 (C-10), 101.05 (C-1‴'), 100.83 (C-1″), 99.23 (C-6, 1‴), 94.45 (C-8), 76.44 (C-3‴), 75.94 (C-5‴), 75.81 (C-5‴'), 74.93 (C-3‴'), 74.02 (C-2‴), 72.85 (C-2‴'), 71.82 (C-4‴'), 71.41 (C-4″), 70.66 (C-2″), 70.35 (C-3″), 70.14 (C-4‴), 68.19 (C-5″), 67.23 (C-6‴), and 17.70 (C-6″). According to the abovementioned data and literature (Dong et al., 2020), compound 13 was identified as Quercetin-3-O-glucose-7-O-glucose (1→6)-O-glucuronide and its molecular formula is shown in Figure 9. MS diagrams and 1H-NMR and 13C-NMR spectra were shown in Supplementary Figures S37–S39, respectively.
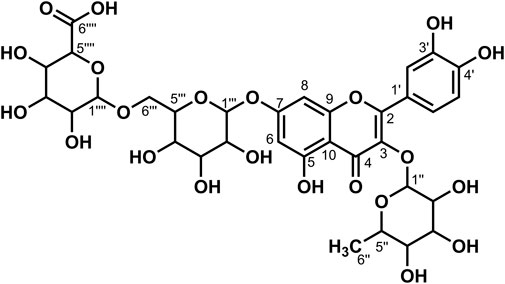
FIGURE 9. Chemical structure of compound 13.
Data for compound 14: white powder, m. p. 211–213°C; ESI-MS: Calcd for C11H12N2O2 ([M + H]+), 205.15; 1H NMR (400 MHz, DMSO-d6) δ: 11.04 (d, J = 2.5 Hz, 1H, H-3), 7.57 (d, J = 7.9 Hz, 1H, H-8′), 7.35 (d, J = 8.1 Hz, 1H, H-5′), 7.25 (d, J = 2.5 Hz, 1H, H-6′), 7.10–7.01 (m, 1H, H-1′), 7.01–6.92 (m, 1H, H-7′), 3.51–3.47 (m, 1H), 3.32 (dd, J = 15.1, 4.2 Hz, 1H), 3.02 (dd, J = 15.1, 8.6 Hz, 1H); 13C NMR (100 MHz, DMSO-d6) δ: 170.48 (C-3), 136.34 (C-4′), 127.30 (C-3′), 124.12 (C-1′), 120.79 (C-7′), 118.34 (C-6′), 118.20 (C-8′), 111.32 (C-5′), 109.56 (C-2′), 54.74 (C-2), and 27.11 (C-1). According to the abovementioned data, compound 14 was identified as tryptophan and its molecular formula is shown in Figure 10. MS diagrams and 1H-NMR and 13C-NMR spectra were shown in Supplementary Figures S40–S42, respectively.
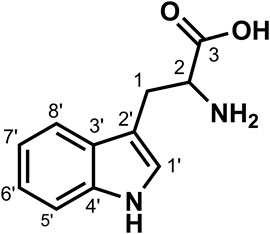
FIGURE 10. Chemical structure of compound 14.
Data for compound 15: pale yellow powder, m. p. 179–181°C; ESI-MS: Calcd for C27H30O16 ([M + H]+), 611.19; 1H NMR (400 MHz, DMSO-d6) δ: 12.56 (s, 1H, H-5), 10.93 (s, 1H,H-4′), 8.16–8.08 (m, 2H, H-2′, 6′), 7.20–7.12 (m, 2H, H-3′, 5′), 6.47 (d, J = 2.1 Hz, 1H, H-8), 6.23 (d, J = 2.1 Hz, 1H, H-6), 5.47 (d, J = 7.4 Hz, 1H, 1″), 5.33 (dd, J = 14.0, 4.7 Hz, 2H), 5.12–5.00 (m, 4H), 4.93 (d, J = 4.2 Hz, 1H), 4.57 (t, J = 5.7 Hz, 1H), 4.29 (t, J = 5.6 Hz, 1H), 3.71–3.62 (m, 1H), 3.58 (dd, J = 11.3, 5.4 Hz, 1H), 3.49–3.39 (m, 1H), 3.40–3.37 (m, 1H), 3.32–3.15 (m, 6H), 3.09–3.01 (m, 2H, H-6″); 13C NMR (100 MHz, DMSO-d6) δ: 177.54 (C-4), 164.27 (C-7), 161.22 (C-5), 159.23 (C-4′), 156.45 (C-9), 155.60 (C-2), 133.73 (C-3), 130.57 (C-2′, 6′), 123.70 (C-1′), 115.81 (C-3′, 5′), 104.11 (C-10), 100.85 (C-1″), 100.00 (C-1‴), 98.76 (C-6), 93.73 (C-8), 77.56 (C-5″), 77.08 (C-5‴), 76.52 (C-3″), 76.43 (C-3‴), 74.18 (C-2″), 73.21 (C-2‴), 69.92 (C-4″), 69.61 (C-4‴), 60.87 (C-6″), and 60.63 (C-6‴). According to the abovementioned data and literature (Shan et al., 2020), compound 15 was identified as Kaempferol-3,7-O-diglucoside and its molecular formula is shown in Figure 11. MS diagrams and 1H-NMR and 13C-NMR spectra were shown in Supplementary Figures S43–S45, respectively.
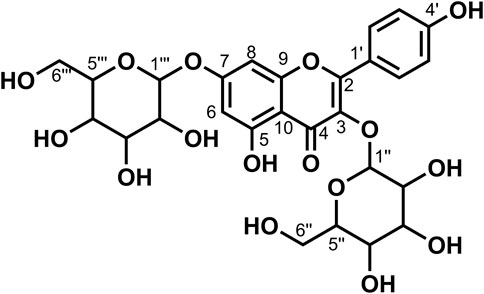
FIGURE 11. Chemical structure of compound 15.
Data for compound 16: pale yellow powder, m. p. 166–168°C; ESI-MS: Calcd for C27H30O15([M + H]+), 595.15; 1H NMR (400 MHz, DMSO-d6) δ:12.56 (s, 1H, H-5), 10.86 (s, 1H, H-4′), 10.12 (s, 1H, H-7), 8.03–7.93 (m, 2H, H-2′, 6′), 6.92–6.84 (m, 2H, H-3′, 5′), 6.42 (d, J = 2.1 Hz, 1H, H-8), 6.21 (d, J = 2.1 Hz, 1H, H-6), 5.32 (d, J = 7.4 Hz, 1H, 1″), 4.38 (d, J = 1.6 Hz, 1H, H-1‴), 4.03 (s, 2H), 3.75–3.64 (m, 1H), 3.42 (dd, J = 3.4, 1.6 Hz, 1H), 3.32–3.25 (m, 4H), 3.69 (d, J = 9.8 Hz, 1H), 3.16–3.01 (m, 2H, H-6″), 0.99 (d, J = 6.2 Hz, 3H, H-6‴); 13C NMR (100 MHz, DMSO-d6) δ: 177.38 (C-4), 164.11 (C-7), 161.18 (C-5), 159.88 (C-4′), 156.82 (C-2), 156.48 (C-9), 133.22 (C-3), 130.84 (C-2′, 6′), 120.87 (C-1′), 115.08 (C-3′, 5′), 103.98 (C-10), 101.33 (C-1″), 100.74 (C-1‴), 98.70 (C-6), 93.72 (C-8), 76.37 (C-3″),75.75 (C-5″), 74.16 (C-2″), 71.82 (C-4‴), 70.60 (C-3‴), 70.33 (C-2‴), 69.93 (C-4″), 68.22 (C-5‴), 66.88 (C-6″), and 17.69 (C-6‴). According to the abovementioned data and literature (Dong et al., 2015), compound 16 was identified as Kaempferol-3-O-rutinoside and its molecular formula is shown in Figure 3. MS diagrams and 1H-NMR and 13C-NMR spectra were shown in Supplementary Figures S46–S48, respectively.
3.2 Disscusion
As a plant found in the desert of the Inner Mongolia, Ningxia, Gansu Region, A. mongolicum belongs to the genus Allium of the Liliaceae family (Wang et al., 2013; Wang et al., 2019). A. mongolicum was taken as a vegetable with local characteristics for cuisine and seasoning due to its unique flavor and high nutritional value, which can improve the cooking quality of mutton (Dong et al., 2020). There are a few reports about the extract of A. mongolicum to control some foodborne microorganism pathogens. The ethanol extract and aqueous extract of A. mongolicum showed antimicrobial activity against Staphylococcus aureus, Escherichia coli, Saccharomyces cerevisiae, and so on (Li and Luo, 2008; Liang et al., 2014). There have been some reports that essential oil, polysaccharides, and flavonoids of A. mongolicum exhibited good inhibitory activity against foodborne microorganism pathogens such as Staphylococcus aureus, Escherichia coli, and Salmonella enteritidi (Wu, et al., 2011; Sa, et al., 2014; Muqier et al., 2017). In this study, the effects of different extracts of A. mongolicum on agricultural pathogenic fungi were studied. It was found that methanol extract and petroleum ether extract of A. mongolicum showed a certain inhibitory effect on tested pathogenic fungi such as Fusarium oxysporum and Botrytis cinerea. Therefore, the extract of A. mongolicum has potential value as a botanical fungicide for the further study.
The chemical composition of A. mongolicum is diverse. So far, different chemical compositions of extracts of A. mongolicum have been discovered based on the reference and the related reports. Thirty-one flavonoids and phenolic acids were obtained and identified in the study of the effect of A. mongolicum to improve gastrointestinal function (Dong et al., 2020). The essential oils of A. mongolicum were analyzed and identified by gas chromatography-mass spectrometry and NIST Ms Search 2.0 database to identify 37 compounds, most of which were sulfur compounds such as three dimethyl sulfide, diallyl disulphide, and so on (Wu, et al., 2011). In this study, the chemical composition of methanol extract of A. mongolicum were separated and identified by the mass spectrum, HPLC, 1H NMR, and 13C NMR spectra to gain sixteen compounds, which include nine flavonoids and six phenolic acids (cinnamic acid derivatives 1, 2, 3, and 12; caffeic acid derivatives 10 and 11) and tryptophan. Some of the flavonoids here have been reported in A. mongolicum (compounds 4, 5, 6, 15, and 16), and those compounds are secondary metabolites, which are found in most Allium plants such as Allium cepa L., Allium fistulosum L., and Allium sativum L. and exert multiple biological activities such as antioxidant and gastrointestinal motility effect improvement. Three phenolic acids (cinnamic acid derivatives 1, 2, and 3) were separated in A. mongolicum for the first time. Cinnamic acid is organic acid occurring naturally in plants (Sova, 2012; Merlani et al., 2019). They have been reported to have antibacterial and antifungal activities and are considered promising lead compounds for structural modification to discover bioactive compounds with significant activity (Guzman, 2014; Khan et al., 2021). Based on the existing reports about the antimicrobial activity of cinnamic acid and its derivatives, therefor it is presumed that the antifungal activity of crude extract of A. mongolicum may be partly due to the three phenolic acids (1, 2, and 3), which antimicrobial activity is worth further studying. In subsequent experiments, we can take cinnamic acid as a lead compound to synthesize a series of cinnamic acid derivatives with similar structures reported in this article and make a systematic study on their antimicrobial activity. Among the nine isolated flavonoids, there are four new compounds (flavonoids 7, 8, 9, and 13) found in A. mongolicum. As is known, natural flavonoids exist in the form of its glycosides. Compared with flavonoids that have been reported, the four new compounds here are different mainly on the position and number of glucosyl of flavanone glycosides. This study laid a foundation for the further development and utilization of extracts of A. mongolicum as botanical fungicides.
4 Conclusion
In this article, based on the certain inhibitory activity against nine tested pathogens of extracts of A. mongolicum, 16compounds were isolated and identified by HPLC, NMR, and ESI-MS, and seven compounds including cinnamic acid derivatives and flavonoids were gained from A. mongolicum for the first time. According to our knowledge, the antimicrobial research of A. mongolicum almost focused on controlling some foodborne microorganism pathogens. Therefore, this study laid a foundation for the systematic research on the inhibitory effect of compounds of A. mongolicum on common plant-pathogenic fungi also provides good guidance for further study to discover potential antifungal agents. The follow-up study is in process, and more interesting results deserve attention.
Data availability statement
The original contributions presented in the study are included in the article/Supplementary Material, and further inquiries can be directed to the corresponding authors.
Author contributions
HQ: experimental design and the draft writing; ZG: experimental implementation and structural identification; LM, XZ, and HM: participating in part experimental processes; YC: improving manuscript quality and language polishing.
Funding
This work was supported by the National Natural Science Foundation of China (No. 31960551), The Fourth Batch of Ningxia Youth Talents Supporting Program, China (No. TJGC2019070), Postgraduate Innovation Project of North Minzu University, China (No. YCX22174), and the Science and Technology Foundation of Guizhou Province (2020) (1Y108).
Conflict of interest
The authors declare that the research was conducted in the absence of any commercial or financial relationships that could be construed as a potential conflict of interest.
Publisher’s note
All claims expressed in this article are solely those of the authors and do not necessarily represent those of their affiliated organizations, or those of the publisher, the editors, and the reviewers. Any product that may be evaluated in this article, or claim that may be made by its manufacturer, is not guaranteed or endorsed by the publisher.
Supplementary material
The Supplementary Material for this article can be found online at: https://www.frontiersin.org/articles/10.3389/fchem.2022.993893/full#supplementary-material
References
Akhter, W., Bhuiyan, M. K. A., Sultana, F., and Hossain, M. M. (2015). Integrated effect of microbial antagonist, organic amendment and fungicide in controlling seedling mortality (rhizoctonia solani) and improving yield in pea (pisum sativum L.). Comptes Rendus Biol. 338, 21–28. doi:10.1016/j.crvi.2014.10.003
Chen, C., Liu, C. H., Cai, J., Zhang, W., Qi, W.-L., Wang, Z., et al. (2018). Broad-spectrum antimicrobial activity, chemical composition and mechanism of action of garlic (Allium sativum) extracts. Food control. 86, 117–125. doi:10.1016/j.foodcont.2017.11.015
Dong, Y. J., Qu, L., Li, X. X., Han, L. F., Wang, T., and Zhang, W. (2015). Isolation and structure identification of chemical constituents from Allium mongolicum Regel I. Chin. J. Med. Chem. 25 (4), 298–302. doi:10.14142/j.cnki.cn21-1313/r.2015.04.011
Dong, Y., Ruan, J., Ding, Z., Zhao, W., Hao, T., Zhang, Y., et al. (2020). Phytochemistry and comprehensive chemical profiling study of flavonoids and phenolic acids in the aerial parts of Allium mongolicum Regel and their intestinal motility evaluation. Molecules 25 (3), 577. doi:10.3390/molecules25030577
Dong, Y. Z., Shi, W. Z., Yang, S. C., Li, X. X., Zhang, W., and Wang, T. (2016). Isolation and structure identification of chemical constituents from Allium mongolicum Regel Ⅱ. J. Tianjin Univ. Tradit. Chin. Med. 35 (6), 404–408. doi:10.11656/j.issn.1673-9043.2016.06.11
Duan, Y., Dai, Y., He, R., Kurihara, H., Li, Y., and Yao, X. (2012). A new phenylpropanoid glucoside from the aerial parts ofLygodium japonicum. J. Asian Nat. Prod. Res. 14 (3), 286–292. doi:10.10.80/10286020.2011.65069010.1080/10286020.2011.650690
Fossen, T., Andersen, Ø. M., and Markham, K. R. (2005). Flavonoids: Chemistry, biochemistry and Applications chapter: Spectroscopic techniques applied to flavonoids. Boca Raton: Taylor and Francis CRC Press, 37–142. doi:10.1201/9781420039443.ch2 S3pectroscopic techniques applied to flavonoids
Gao, T., Zhou, H., Zhou, W., Hu, L., Chen, J., and Shi, Z. Q. (2016). The fungicidal activity of thymol against Fusarium graminearum via inducing lipid peroxidation and disrupting ergosterol biosynthesis. Molecules 21 (6), 770. doi:10.3390/molecules21060770
Guo, Y. Y., Chen, J. B., Ren, D., Du, B., Wu, L., Zhang, Y. Y., et al. (2021). Synthesis of osthol-based botanical fungicides and their antifungal application in crop protection. Bioorg. Med. Chem. 40, 116184. doi:10.1016/j.bmc.2021.116184
Guzman, D. J. (2014). Natural cinnamic acids, synthetic derivatives and hybrids with antimicrobial activity. Molecules 19 (12), 19292–19349. doi:10.3390/molecules191219292
Hu, J., Hu, X., Zhang, Q., Zhang, J., Fan, B., and Yu, Q. (2017). Development of SSR molecular markers for Allium mongolicum. Genes. Genom. 39, 1387–1394. doi:10.1007/s13258-017-0601-0
Jiang, M., and Ying, X. (2017). Isolation and identification of two tyramine alkaloids from portulaca oleracea L. J. Liaoning Univ. Tcm. 19 (9), 48–51. doi:10.13194/j.issn.1673-842x.2017.09.013
Kang, Z. S. (2010). Current status and development strategy for research on plant fungal diseases in China. Plant Prot. Sci. 36 (3), 9–12. doi:10.3969/j.issn.0529-1542.2010.03.003
Khan, F., Bamunuarachchi, N. I., Tabassum, N., and Kim, Y. M. (2021). Caffeic acid and its derivatives: antimicrobial drugs toward microbial pathogens. J. Agr. Food Chem. 69 10, 2979–3004. doi:10.1021/acs.jafc.0c07579
Kim, B. S., and Hwang, B. K. (2007). Microbial fungicides in the control of plant diseases. J. Phytopathol. 155, 641–653. doi:10.1111/j.1439-0434.2007.01314.x
Kim, D. K., and Lee, K. (2003). Inhibitory effect of Trans-N-p-coumaroyl tryamine from the twigs of Celtis chinensis on the acetylcholinesterase. Arch. Pharm. Res. 26 (9), 735–738. doi:10.1007/BF02976684
Li, Y. L., and Luo, M. R. (2008). Study on antibacterial effect of extracts from Allium mongolicum Regel. J. Anhui Agri. Sci. 36 (33), 14596–14597. 14618. doi:10.13989/j.cnki.0517-6611.2008.33.151
Liang, F., Li, Y. L., Zhao, J., Chai, C. F., and Wu, T. Y. (2014). Study on the extraction Technology of Alium mongolicum Regel bacteriostatic components and optimization. Food Res. Dev. 35 (20), 32–35. doi:10.3969/j.issn1005-6521.2014.20.008
Liu, W. D., and Wang, G. L. (2016). Plant innate immunity in rice: A defense against pathogen infection. Natl. Sci. Rev. 3 (3), 295–308. doi:10.1093/nsr/nww015
Liu, X., Yan, D., Ouyang, Y. C., Yang, D., Wang, Q., Li, L., et al. (2017). Oils extracted from eupatorium adenophorum leaves show potential to control phythium myriotylum in commercially-grown ginger. Plos One 12 (5), e0176126. doi:10.1371/journal.pone.0176126
Ma, C. J., Zhao, L. H., Yang, F., Li, J. Y., and Bao, B. (2014). A contrast research of bacteriostatic effect by three common liliaceous plants. Sci. Technol. Food. Ind. 35 (11), 52–56. doi:10.13386/j.issn1002-0306.2014.11.002
Martins, N., Petropoulos, S., and Ferreira, I. C. (2016). Chemical composition and bioactive compounds of garlic (Allium sativum L.) as affected by pre- and post-harvest conditions: A review. Food Chem. 211, 41–50. doi:10.1016/j.foodchem.2016.05.029
Merlani, M., Barbakadze, V., Amiranashvili, L., Gogilashvili, L., Poroikov, V., Petrou, A., et al. (2019). New caffeic acid derivatives as antimicrobial agents: design, synthesis, evaluation and docking. Curr. Top. Med. Chem. 19 4, 292–304. doi:10.2174/1568026619666190122152957
Muqier, Q. S., Qi, T., Wang, R. W., Chen, C. F., Wang, C. J., and Ao, C. (2017). Effects of flavonoids from Allium mongolicum Regel on growth performance and growth-related hormones in meat sheep. Anim. Nutr. 3 (1), 33–38. doi:10.1016/j.aninu.2017.01.003
Nicastro, H. L., Ross, S. A., and Milner, J. A. (2015). Garlic and onions: Their cancer prevention properties. Cancer Prev. Res. 8 (3), 181–189. doi:10.1158/1940-6207.CAPR-14-0172
Prashith Kekuda, K., Akarsh, S., Darshini, S. M., Prafulla, D., and Raghavendra, H. L. (2015). Antiradical and antimicrobial activity of atylosia lineata wt. and arn. Sci. Technol. Arts Res. J. 4 (3), 180–183. doi:10.4314/star.v4i3.27
Qin, J. H., He, H. Z., Luo, S. M., and Li, H. S. (2013). Effects of rice-water chestnut intercropping on rice sheath blight and rice blast diseases. Crop Prot. 43, 89–93. doi:10.1016/j.cropro.2012.09.009
Sa, R. L., Mu, Q. E., Wang, C. F., Bao, L. L., Ao, C. J., and Wang, S. Z. (2014). Total F1avonoids from Alium mongolicum Regel: Optimization of extnacton process and antioxidant and antibacterial effects in viro. Food Sci. 35 (24), 1–8. doi:10.7506/spkx1002-6630-201424001
Shan, X. M., Li, Z. X., Gao, Y., and Yu, X. P. (2020). Recent advances in chemical compositions and biological activity of Allium mongolicum Regel. Spec. Wild Econ. Anim. Plant Res. 42 (04), 89–94. doi:10.16720/j.cnki.tcyj.2020.04.015
Sova, M. (2012). Antioxidant and antimicrobial activities of cinnamic acid derivatives. Mrmc 12 (8), 749–767. doi:10.2174/138955712801264792
Wang, G. Z., Gao, S., Li, H. Q., and Wang, X. J. (2013). Physiological characteristics, functional components, development and utilization of Allium mongolicum Regel. Hubei Agric. Sci. 52 (15), 3. doi:10.3969/j.issn.0439-8114.2013.15.003
Wang, J. K., Yang, F., and Bao, B. (2012). Identification of volatile compounds in Allium mongolicum Regel by head space solid phase micro-extraction coupled to gas chromatography-mass spectrometry (HS-SPME-GC-MS). Food Sci. Technol. 33 (24), 171–173. doi:10.13386/j.issn1002-0306.2012.24.002
Wang, W., Li, L., Zhang, H., Wang, X., Fan, X., and Zhang, X. (2019). Phenolic compounds and bioactivity evaluation of aqueous and methanol extracts of Allium mongolicum Regel. Food Sci. Nutr. 7, 779–787. doi:10.1002/fsn3.926
Wu, R. Z. G., Zhang, X. F., and Ao, C. J. (2011). Studies on extracting technics of essential oils from Allium mngolicum Regel. Feed Ind. 32 (7), 37–40. doi:10.3969/j.issn.1001-991X.2011.07.011
Xing, X. K. (2018). Endophytic fungal resource of medicinal plants-A treasure need to Be developed urgently. Mycosystema 37 (1), 14–21. doi:10.13346/j.mycosystema.170250
Zhang, S. W., Xu, B. L., Zhang, J. H., and Gan, Y. T. (2018). Identification of the antifungal activity of trichoderma longibrachiatum T6 and assessment of bioactive substances in controlling phytopathgens. Pesticide Biochem. Physiology 147, 59–66. doi:10.1016/j.pestbp.2018.02.006
Zhang, T. Y., Chen, H. K., and Zhang, C. R. (2014). Polymorphic microsatellite markers for Allium mongolicum Regel (amaryllidaceae). Genes. Genet. Syst. 89 (3), 133–136. doi:10.1266/ggs.89.133
Zhang, Y., Yu, Q., Zhang, Q., Hu, X., Hu, J., and Fan, B. L. (2017). Regional-scale differentiation and phylogeography of a desert plant Allium mongolicum (Liliaceae) inferred from chloroplast DNA sequence variation. Plant Syst. Evol. 303 (4), 451–466. doi:10.1007/s00606-016-1383-6
Keywords: Allium mongolicum, antifungal activity, flavonoids, phenolic acids, tryptophan
Citation: Qu H, Guo Z, Ma L, Zhang X, Ma H and Chen Y (2022) Antifungal effects and active compounds of the leaf of Allium mongolicum Regel. Front. Chem. 10:993893. doi: 10.3389/fchem.2022.993893
Received: 14 July 2022; Accepted: 21 July 2022;
Published: 24 August 2022.
Edited by:
Yaqiong Su, Xi’an Jiaotong University, ChinaReviewed by:
Baobing Zhao, Shandong University, ChinaJian Zhang, Gansu University of Chinese Medicine, China
Xiaobo Xu, Huanghuai University, China
Copyright © 2022 Qu, Guo, Ma, Zhang, Ma and Chen. This is an open-access article distributed under the terms of the Creative Commons Attribution License (CC BY). The use, distribution or reproduction in other forums is permitted, provided the original author(s) and the copyright owner(s) are credited and that the original publication in this journal is cited, in accordance with accepted academic practice. No use, distribution or reproduction is permitted which does not comply with these terms.
*Correspondence: Huan Qu, cm9zYWxpZTQyQDE2My5jb20=; Yang Chen, eWNoZW4xQGd6dS5lZHUuY24=