 W. Tamilarasi
 B. J. Balamurugan
- Department of Mathematics, School of Advanced Sciences, Vellore Institute of Technology, Chennai, Tamil Nadu, India
Ebola and Marburg viruses, biosafety level 4 pathogens, cause severe hemorrhaging and organ failure with high mortality. Although some FDA-approved vaccines or therapeutics like Ervebo for Zaire Ebola virus exist, still there is a lack of effective therapeutics that cover all filoviruses, including both Ebola and Marburg viruses. Therefore, some anti-filovirus drugs such as Pinocembrin, Favipiravir, Remdesivir and others are used to manage infections. In theoretical chemistry, a chemical molecule is converted into an isomorphic molecular graph,
1 Introduction
Marburg and Ebola virus infections are haemorrhagic fevers and highly contagious characterized by bleeding. They are caused by viruses called filoviruses. Ebola virus (EBOV) and Marburg virus (MARV) are lethal zoonotic virus which has been classified by the WHO as a pathogen in risk group 4 (WHO 2022) (Islam et al., 2023). The fatality rate for Marburg and Ebola viruses in Africa is typically 30%–60%, and can reach 90% where medical care is poor. The Marburg virus was first identified in 1967 in Germany. Since then, it has spread to other countries, including Guinea, Ghana, and Tanzania, creating public health concerns and attracting media attention to the disease (Marzi and Feldmann, 2023). As of 24 March 2023, Tanzania has reported five deaths among eight confirmed cases of Marburg virus disease. Common symptoms of both EBOV and MARV include high fever, headache, malaise, muscle aches, diarrhoea, abdominal discomfort, and cramping (Ahmed et al., 2023). Several vaccines to protect against EBOV and MARV are in the midst of clinical trials and antiviral treatments for Marburg virus are currently under development. The FDA-approved vaccine ‘Ervebo’ only protects against the Zaire Ebola virus and does not provide protection against other strains or filoviruses like the Marburg virus. Additionally, while monoclonal antibodies have been developed for treating Ebola, including some that target multiple strains, there is still no comprehensive vaccine or therapeutic option that effectively addresses all known filoviruses. However, some antifilovirus, such as Pinocembrin, Favipiravir, Tilorone, Quinacrine, Pyronaridine, Remdesivir, Galidesvir, Chloroquine, Clomiphene, Toremifene, Imatinib, Nilotinib, Amiloride, Paliperidone, Obeldesivir, Estradiol benzoate, Artemisinin, Ribavirin, Esomeprazole, Omeprazole, Tamoxifen, and 4-Aminomethyl benzamide show therapeutic efficacy against Marburg and Ebola virus.
Pinocembrin, also known as 5, 7-dihydroxy flavanone, is the flavonoid group of molecules available in natural sources and has numerous biological benefits such as antioxidant, antibacterial, antiviral, and anti-inflammatory functionalities (Hanieh et al., 2017; Shen et al., 2019). The pinocembrin derivatives demonstrated notable structural and pharmacological characteristics, making them potential candidates for antiviral treatments against Monkeypox and Marburg viruses (Akash et al., 2023). The repurposed drugs Tilorone, Quinacrine, and Pyronaridine, which inhibit the Marburg virus, also exhibit in vitro activity against SARS-CoV-2 and suggest potential mechanisms of action (Puhl et al., 2021). Remdesivir, an antiviral medicine for a variety of viruses, such as the Marburgvirus, the Ebolavirus, and more recently, the SARS-CoV-2 virus (Porter et al., 2020). The study in Zhu et al. (2018) suggests that Favipiravir emerges as a promising therapeutic candidate for MARV infection, particularly due to its potential for rapid and safe oral administration, making it valuable in outbreak scenarios, even post-exposure. As observed with Marburgvirus, galidesivir demonstrated strong in vitro antiviral activity against various ebolavirus species (Julander et al., 2021). Chloroquine could be utilized for treating filoviral infections as well as other viral infections that require an acidic pH for their infectivity (Akpovwa, 2016). The qRT-PCR results verified that clomiphene and toremifene were effective against both the native Ebola virus species and MARV (Johansen et al., 2013). Imatinib, Nilotinib, and Amiloride are among the FDA-approved drugs that may be used to treat Ebola virus infection (Yuan, 2015). Estradiol benzoate and paliperidone show potential as inhibitors of the VP35 protein of the Marburg virus, as identified through a cheminformatics approach (Srivastava et al., 2024). The anti-inflammatory property of artemisinin exhibit a potential antidisease therapeutic for Ebola patients in addition to its antimalarial activity (Haque et al., 2015). In cell culture, ribavirin was effective at reducing production of infectious EBOV (Alfson et al., 2015). Esomeprazole and omeprazole were also shown to inhibit viral entry in in vitro studies, providing protection against EBOV infection (Long et al., 2015). The inhibitors of 4-(aminomethyl)benzamide are also effective against Marburg virus (Gaisina et al., 2020).
Chemical graph theory is a branch of mathematical chemistry that studies graphs to represent and analyze chemical structures. A molecular structure is transformed into a molecular graph
Topological indices play an important role in drug development as they provide quantitative representations of molecular structures, which are valuable for predicting activity, evaluating drug-likeness, and estimating pharmacokinetic (ADMET) properties. Topological indices are employed to estimate various chemical-physical properties of molecules, such as boiling point, melting point, solubility, molecular weight, and lipophilicity. By correlating the structural features captured by the indices with experimental data, it is possible to develop models to explore these properties for new molecules. Absorption, distribution, metabolism, excretion, and toxicity (Admet) are crucial factors to consider in drug discovery. Topological indices can be utilized to explore various ADMET properties, such as Intestinal absorption, Skin permeability, BBB permeability, Water solubility, and metabolic stability. Caco-2 permeability is an important indicator of intestinal absorption and oral bioavailability, crucial for orally administered drugs. Higher permeability implies better absorption, enhancing systemic circulation and therapeutic effectiveness. For anti-filovirus drugs, compounds with high Caco-2 permeability could improve oral dosing and patient compliance. While blood-brain barrier (BBB) permeability is generally less critical for Ebola or Marburg viruses, it remains relevant for antiviral drugs in cases involving potential CNS complications. By estimating these properties early in the drug discovery process, researchers can prioritize molecules with favorable ADMET profiles and reduce the likelihood of failures in later stages of development. Overall, topological indices are crucial in chemical graph theory as they provide quantitative measures of molecular structures, which can be utilized for understanding, predicting, and designing chemical compounds.
Currently, researchers have introduced a wide range of indices which fall into the categories viz., degree-based, distance-based, eccentricity-based and temperature-based topological indices (Deutsch and Klavˇzar, 2014; Hu et al., 2021; Gao et al., 2018; Kansal et al., 2023). Out of all different types of topological indices, the degree based topological indices are frequently used indices in the QSPR/QSAR analysis to characterize the physicochemical and pharmokinetic properties of molecules. Recently in several articles (Mondal et al., 2022; Shanmukha et al., 2020; Kirmani et al., 2021; Zhong et al., 2021; Havare, 2021; Parveen et al., 2022; Tamilarasi and Balamurugan, 2022a; Tamilarasi and Balamurugan, 2022b; Tamilarasi and Balamurugan, 2023; Nasir et al., 2022; Zhang et al., 2022; Adnan et al., 2022; Kalaimathi and Balamurugan, 2023; Thilsath Parveen and Balamurugan, 2023; Balasubramaniyan and Chidambaram, 2023; Liu et al., 2021; Paul et al., 2023) QSPR analysis for various disease like COVID-19, cancer, malaria, monkeypox, rheumatoid arthritis, tuberculosis, asthma, Zika virus and fungal diseases are investigated using degree-based topological indices. This article introduces a new concept called the isomorphic molecular graph and a new index, namely, reverse sum Revan index are computed for anti-filovirus drugs. QSPR analysis are also performed using a multilinear regression equation to examine the physicochemical and pharmacokinetic properties of these drugs. Further, a comparison study were made to demonstrate how the reverse sum Revan indices differ significantly and improve upon the reverse and Revan degree-based indices. Additionally, we also compared multilinear regression with Artificial neural network model and exhibited that the multilinear regression model provide best prediction of physicochemical and pharmacokinetic properties of anti-filovirus drugs through reverse sum Revan indices when compared to ANN model.
The choice of drug compounds reflects their accessibility, use in current experimental therapies, and demonstrated antiviral potential. Many of these drugs have shown promise in earlier studies for inhibiting viral replication or exhibit pharmacokinetic properties favorable for therapeutic application. By analyzing this set, we aimed to investigate the structure-property relationships of drugs that are actively explored or potentially viable for filovirus treatment. To further enhance the impact of the drugs, Table 1 is included to summarize key pharmacokinetic and physicochemical properties of selected potential anti-filovirus drugs, supported by references to relevant studies for additional context. The methodology for computation of indices, QSPR analysis with comparative result between existing and proposed indices and comparison of MLR and ANN modelling technique are visualized in Figure 1.

Table 1. Key pharmacokinetic and physicochemical properties of anti-filovirus drugs.
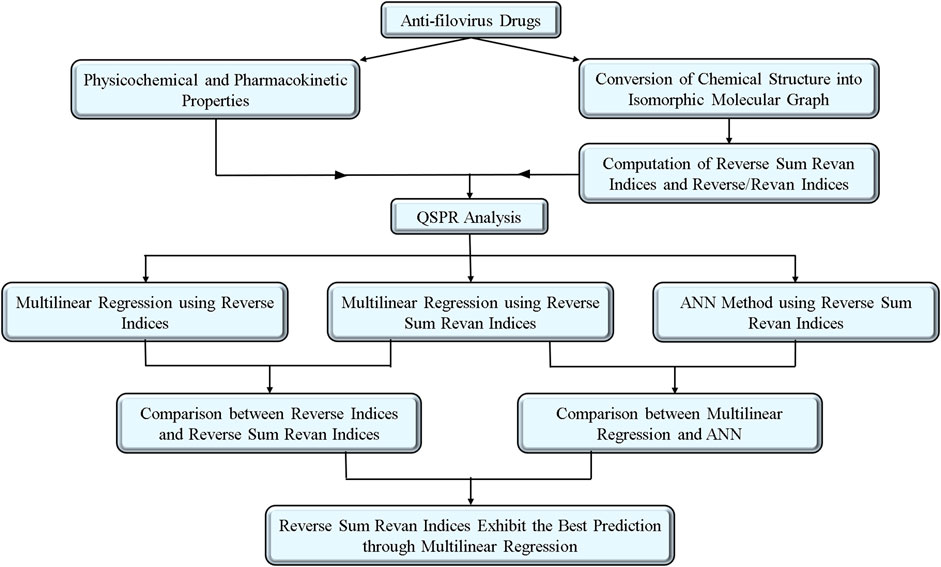
Figure 1. Workflow of the article.
2 Isomorphic molecular graphs and reverse sum revan degree-based indices
This section introduces a new concept called the isomorphic chemical graphs, which is used to explore the structural properties of anti-filovirus drugs. Additionally, a new topological descriptor, the reverse sum Revan topological index, has been introduced, based on a novel vertex degree for the isomorphic molecular graph
2.1 Motivation
Wiener (Wiener, 1947) introduced two topological descriptors called Wiener index and Polarity index. Using these indices, Wiener predicted the boiling point of alkanes, where the chemical structure of alkanes contains only the single bond. Computing the Wiener index for the molecular graph of a chemical compound formed by considering double and triple bonds as a single edge does not affect the index value, as the Wiener index is a distance-based topological descriptor. Moreover, Wiener, excluded hydrogen atoms to simplify molecular graphs by focusing on atom connectivity. His index captures key structural features by measuring distances between atom pairs, avoiding the added complexity of hydrogen atoms. Later, many studies have been carried out by researchers on various topological indices for the prediction of properties of the chemical compounds by considering hydrogen depleted molecular graph and the double bond and triple bond as a single edge. In Gutman and Polansky (2012) Ivan Gutman and Oskar E. Polansky introduced a concept known as complete molecular graph, including all hydrogen atoms in the molecular framework but still considering double and triple bonds as a single edge.
Many researchers construct molecular graphs by converting double and triple bonds into a single edge instead of multiple edges. However, this approach is not acceptable from a chemist’s perspective and goes against graph theory principles. In our research, we compute the degree-based topological indices of molecular graphs and these indices are mainly computed by the degree of atoms. Hence, in this article, the chemical structures are converted into isomorphic chemical graphs by incorporating, double bonds as two parallel edges, triple bonds as three parallel edges and hydrogen and other atoms are preserved in their adjacency. These isomorphic chemical graphs will stimulate accurate representation of chemical structure of a molecule. This approach preserves the unique structural characteristics of the molecule, allowing for accurate comparison and analysis.
The choice of using the reverse sum Revan index instead of reverse degree-based index and Revan index is that this index has ability to provide a more comprehensive, sensitive, and refined measure of isomorphic molecular graph of chemical molecule. By combining the strengths of both the reverse degree approach and the Revan index methodology, the reverse sum Revan index offers enhanced correlation with molecular properties, better applicability to complex networks, and a robust, interpretable framework for advanced research applications. This makes it a valuable tool for researchers seeking detailed insights into the structure and properties of complex systems.
The reverse sum Revan degree based indices were developed to address specific limitations of traditional indices, namely, lower predictive accuracy and reduced interpretability for anti-filovirus drugs. Existing indices often lack sensitivity to subtle structural variations that impact drug efficacy, limiting their ability to model complex structure-property relationships. The new indices enhance predictive power by capturing finer details in molecular topology, making them more effective and interpretable for drug development against Ebola and Marburg viruses.
Definition 1:. Let
The following Figure 2 depicts the chemical structure and isomorphic molecular graph of Phenylacetylene.
V.R.Kulli in (Kulli, 2018) defined the concept of reverse vertex degree
In Kulli (2017) V.R.Kulli, introduced another vertex degree, namely, Revan vetex degree
where
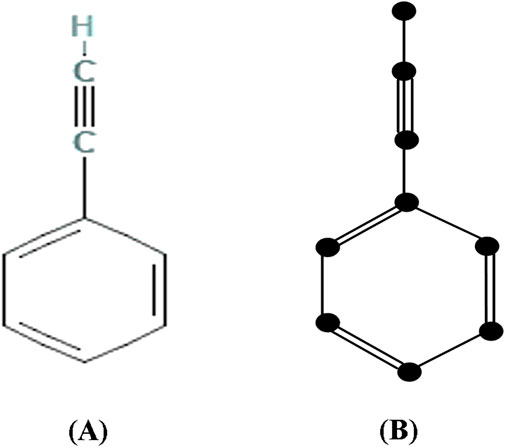
Figure 2. (A) Chemical structure and (B) Isomorphic chemical graph of Phenylacetylene.
Definition 2:. Let
where
Example 1:. The reverse sum Revan vertex degrees of all the atoms for the isomorphic molecular graph of acetaminophen with maximum degree eight and minimum degree 2 with their molecular structure are provided in Supplementary Material. The number of atoms and bonds in acetaminophen are
The reverse sum Revan vertex degree are defined for the following indices: the first and second Zagreb index (Gutman et al., 1975; Austel et al., 1983), first and second Hyper Zagreb index (Došlić et al., 2011a; Došlić et al., 2011b), Forgotten index (Furtula and Gutman, 2015), Atom Bond Connectivity index (Estrada et al., 1998), Geometric Arithmetic index (Vukičević and Furtula, 2009), redefined first, second and third Zagreb index (Ranjini et al., 2013). Accordingly, the reverse sum Revan indices with their mathematical formulae are represented in Table 2.
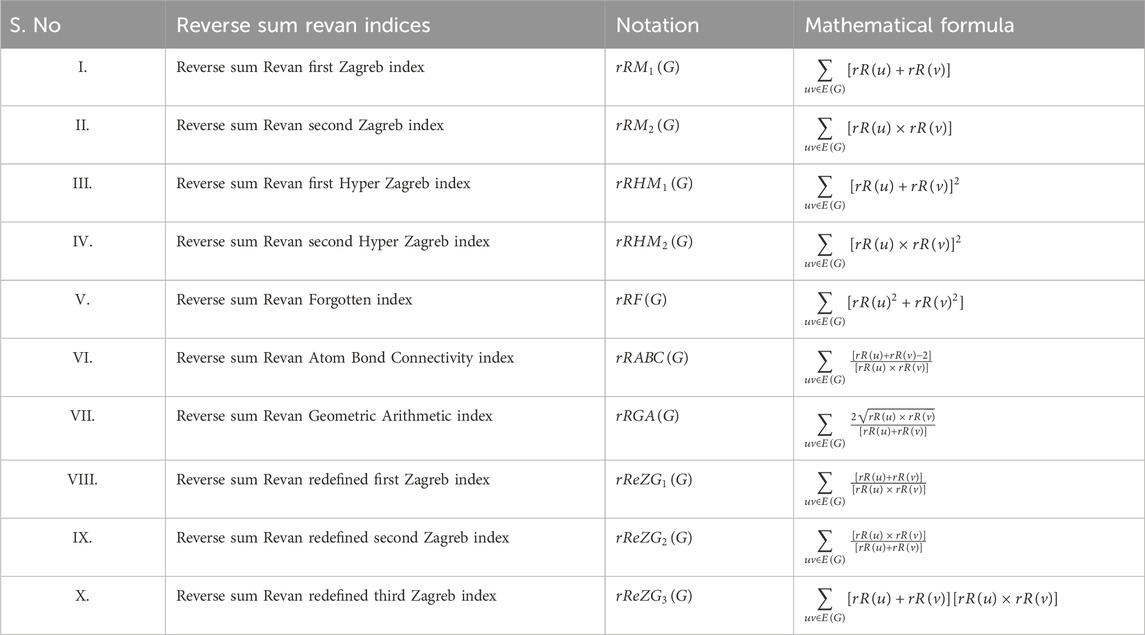
Table 2. Reverse sum Revan indices and their mathematical formulas.
3 Computation of reverse sum revan indices of anti-filovirus drugs
The molecular structures of Pinocembrin, Favipiravir, Tilorone, Quinacrine, Pyronaridine, Remdesivir, Galidesvir, Chloroquine, Clomiphene, Toremifene, Imatinib, Nilotinib, Amiloride, Paliperidone, Obeldesivir, Estradiol benzoate, Artemisinin, Ribavirin, Esomeprazole, Omeprazole, Tamoxifen and 4-Aminomethyl benzamide are provided in the Supplementary Material. Using the reverse sum Revan degree-based edge partition, the indices provided in Table 2 are computed for the isomorphic chemical graphs of these drugs.
Theorem 1. The reverse sum Revan indices for the isomorphic chemical graph
(i).
(ii).
(iii).
(iv).
(v).
Proof: The molecular structure and isomorphic chemical graph of Pinocembrin are depicted in Figures 3A, B respectively. The number of atoms and bonds of the isomorphic chemical graph
By analyzing the graph structure and using the edge partition in Table 3 the indices values are computed as follows:
(i).
(ii).
(iii).
(iv).
(v).
(vi).
(vii).
(viii).
(ix).
(x).
Similarly, the reverse sum Revan indices are computed for other drugs considered in this research in same manner as in Theorem 1. The computed indices values are provided in Tables 4, 5.
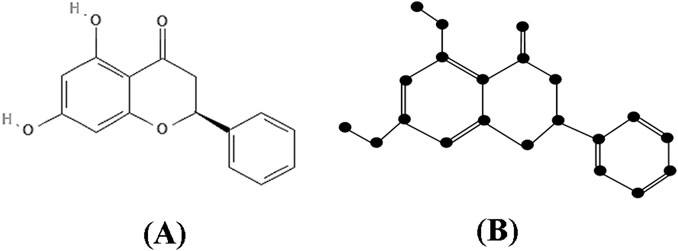
Figure 3. (A) Chemical structure and (B) Isomorphic chemical graph of Pinocembrin.

Table 3. Reverse sum Revan degree-based edge partition of Pinocembrin.
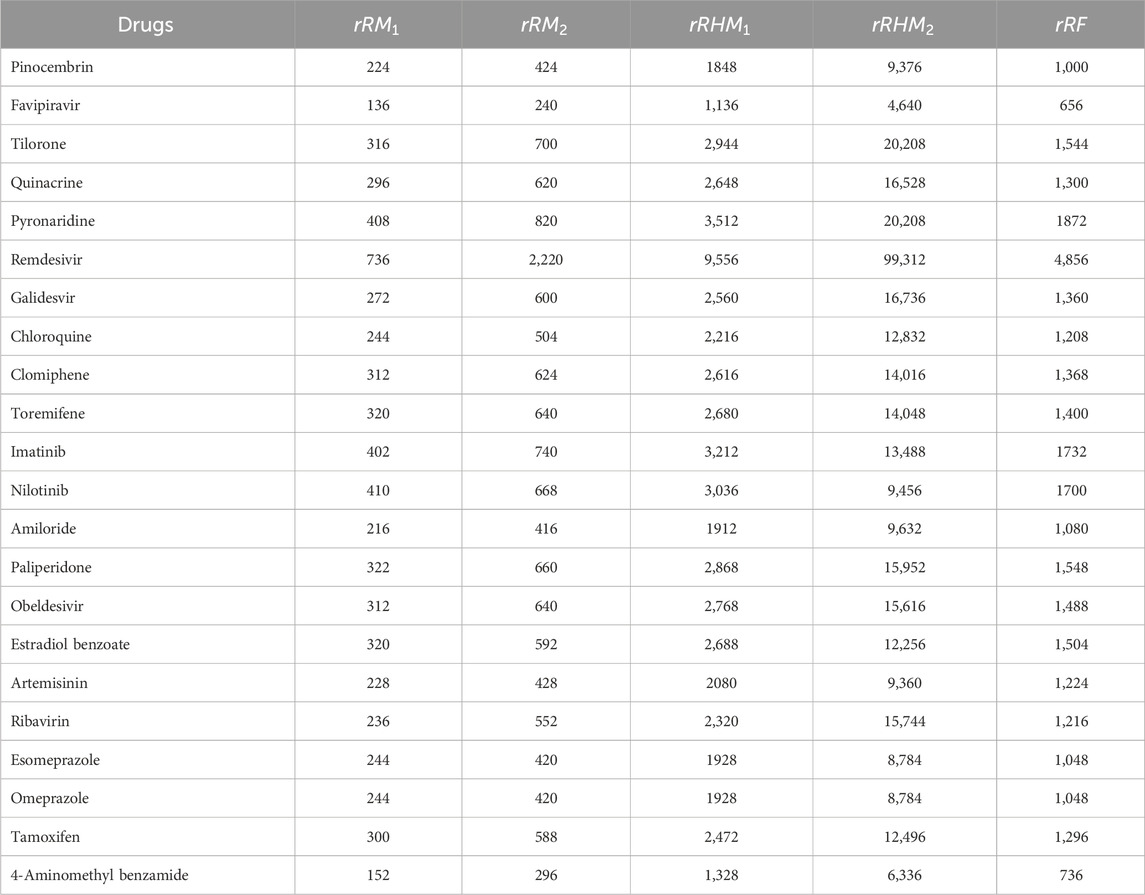
Table 4. Reverse sum Revan degree based indices(
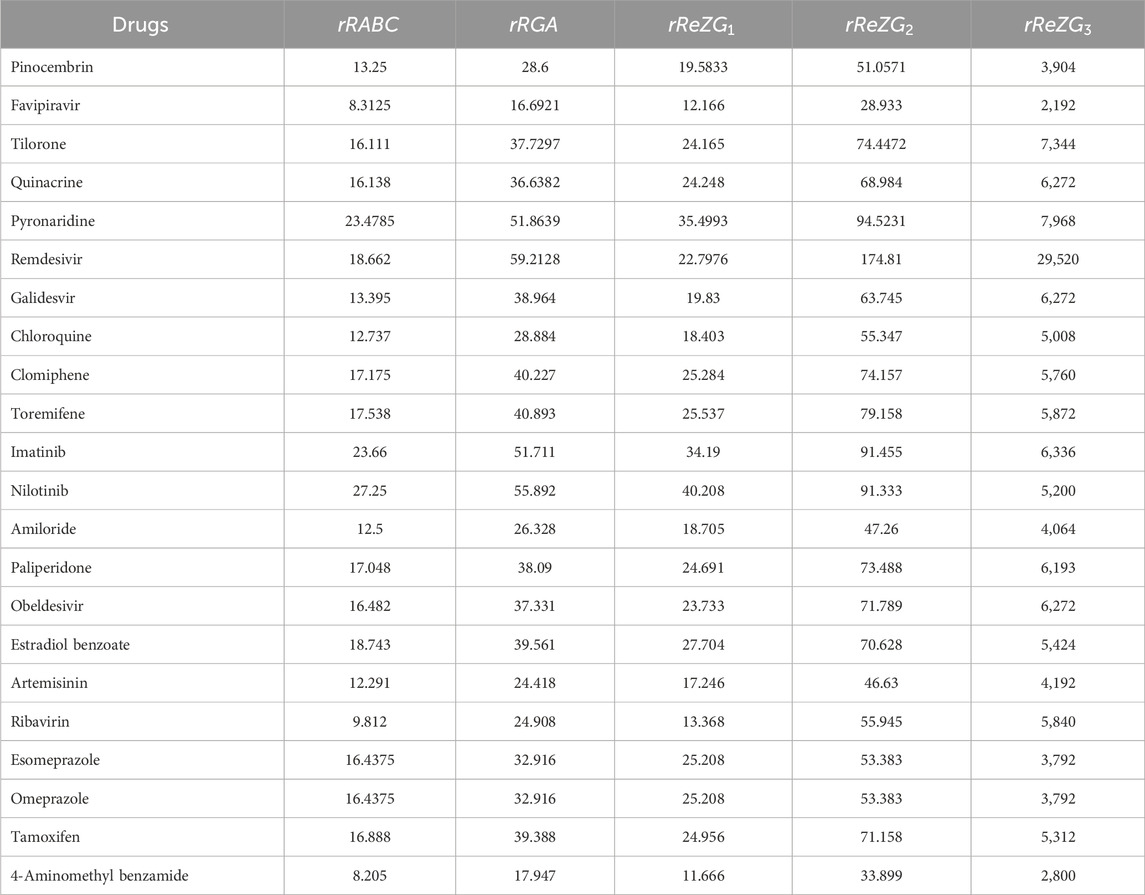
Table 5. Reverse sum Revan degree based indices (
4 Computation of reverse and revan degree based topological indices for anti-filovirus drugs
In this section we compute the reverse and Revan degree based topological indices for the anti-filovirus drugs mentioned in section 3, in order to compare newly introduced reverse sum Revan indices with existing indices. All isomorphic molecular graphs of filovirus drugs considered in this article have minimum degree
Theorem 2. The reverse degree based indices for the isomorphic chemical graph
(i).
(ii).
(iii).
(iv).
(v).
Proof: The molecular structure and isomorphic chemical graph
By analyzing the graph structure and using the edge partition in Table 6 the indices values are computed as follows:
(i).
(ii).
(iii).
(iv).
(v).
(vi).
(vii).
(viii).
(ix).
(x).
Similarly, the reverse degree based indices are computed for other drugs considered in this research in same manner as in Theorem 2. The computed indices values are provided in Tables 7, 8.
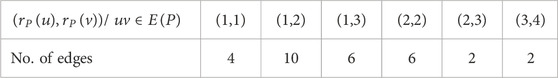
Table 6. Reverse degree-based edge partition of Pinocembrin.
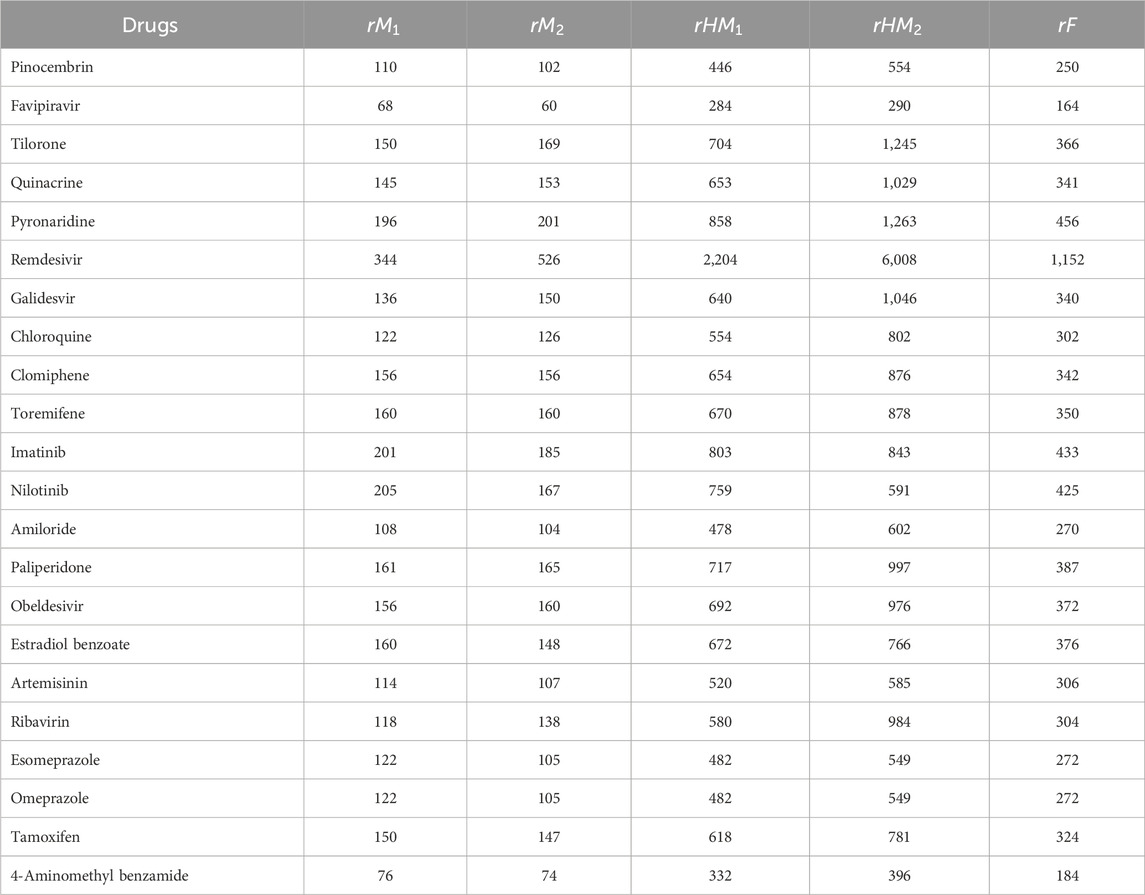
Table 7. Reverse degree based indices(
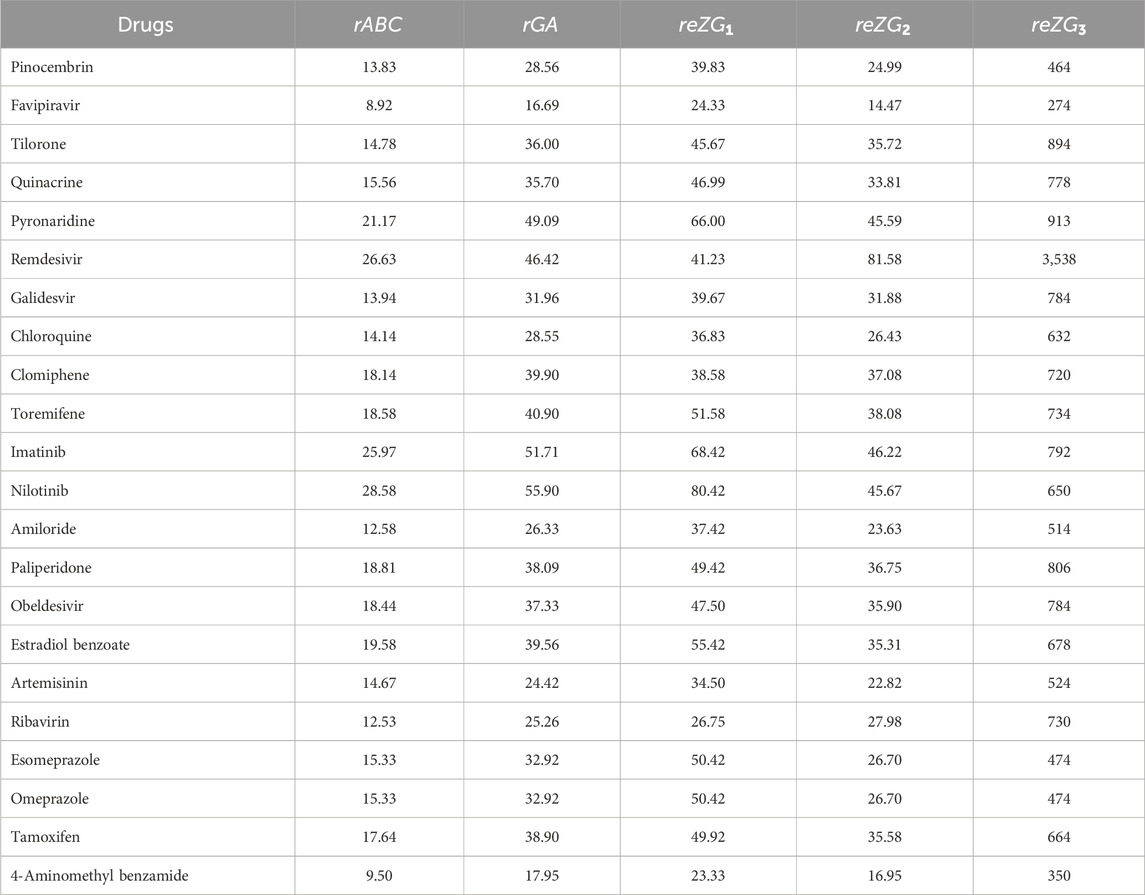
Table 8. Reverse degree based indices(
5 QSPR analysis for properties of anti-filovirus drugs through multilinear regression and reverse sum revan indices
In this section QSPR analysis is carried out for the physicochemical and pharmacokinetic properties of anti-filovirus through multilinear regression and reverse sum Revan degree based indices.
5.1 Methodology
The quantitative structure-property relationship (QSPR) analysis is conducted between the computed reverse sum Revan topological indices and the physicochemical and pharmacokinetic properties of anti-filovirus drugs. The physicochemical and pharmacokinetic properties of Pinocembrin, Favipiravir, Tilorone, Quinacrine, Pyronaridine, Remdesivir, Galidesvir, Chloroquine, Clomiphene, Toremifene, Imatinib, Nilotinib, Amiloride, Paliperidone, Obeldesivir, Estradiol benzoate, Artemisinin, Ribavirin, Esomeprazole, Omeprazole, Tamoxifen and 4-Aminomethyl benzamide are provided in Tables 9, 10. The physicochemical properties considered for this analysis are Molar Refractivity (MR), Polarizability (P), Molar Volume (MV), Molecular weight (MW), Heavy Atom Count (HAC), Complexity (C), Monoisotopic Mass (MM) and lipophilicity (LogP). The physicochemical properties of the drugs are sourced from the chemical structure database ChemSpider (https://www.chemspider.com). The pharmacokinetic properties considered for study are Caco2 permeability, BBB permeability, CNS permeability, Maximum tolerated dose and Minnow Toxicity. The pharmacokinetic properties of the drugs are obtained using the platform pkCSM/ADMET.
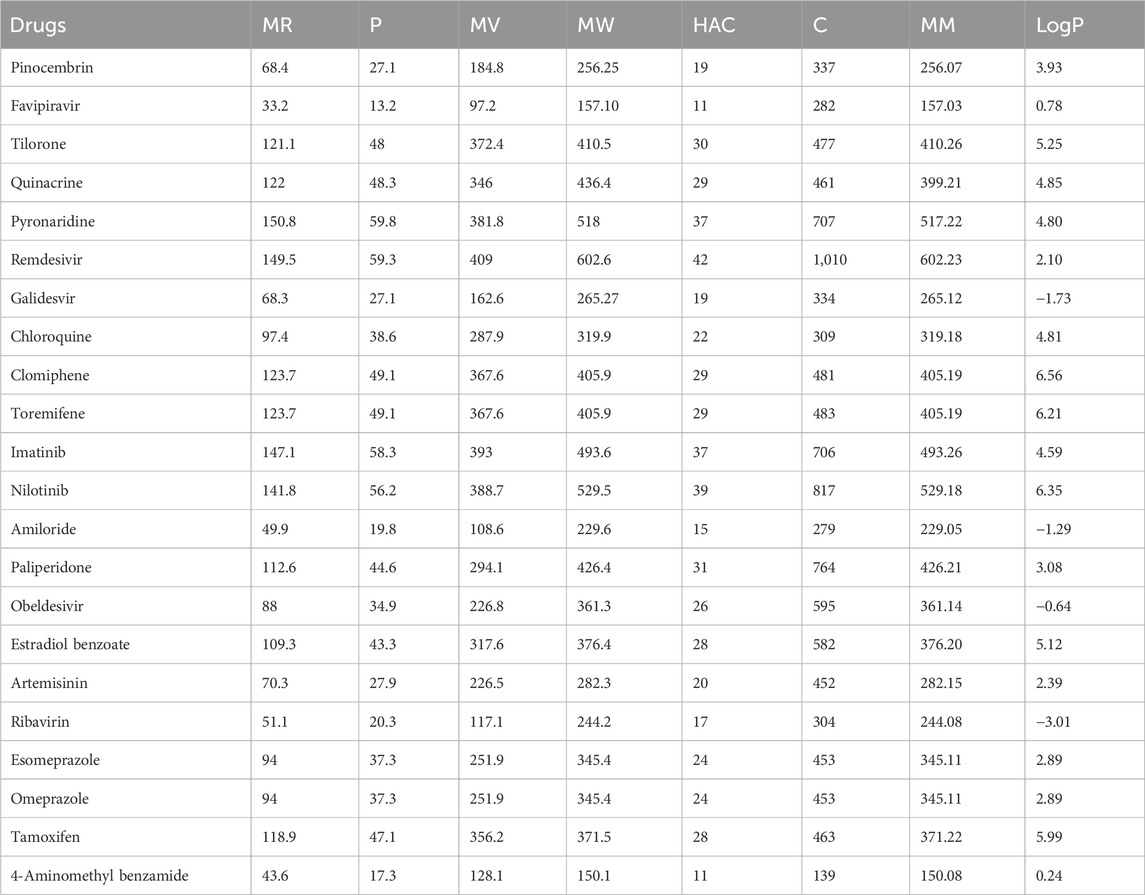
Table 9. Physicochemical properties of anti-filovirus drugs.
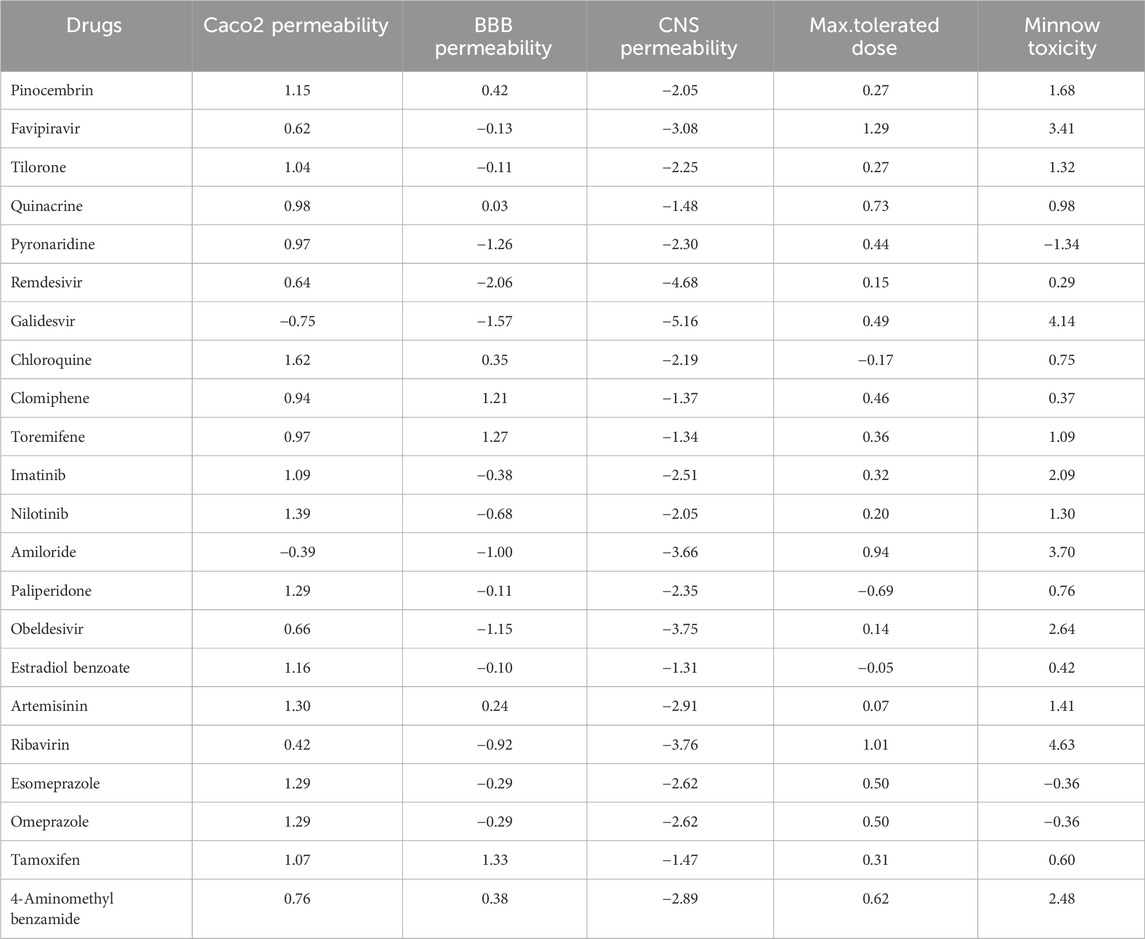
Table 10. Pharmacokinetic properties of anti-filovirus drugs.
The physicochemical and pharmacokinetic properties are often influenced by multiple factors, such as molecular weight, solubility, polarity, and many other molecular descriptors. A multiple linear regression model allows us to include several independent variables, capturing the combined effect of these factors on the dependent variable. In contrast, linear, quadratic, and cubic regressions typically involve a single independent variable, which may not fully capture the complexity of the relationships in this context. Notably, the multiple linear regression analysis yielded significant results with a lower standard error and high coefficient value compared to the linear, quadratic, and cubic regression models for these indices. A general multiple linear regression equaion is
where
•
•
•
•
is employed in QSPR to analyze the relationship between one dependent variable (response variable) and several independent variables (predictor variables).
The main statistical parameters required in QSPR analysis are the Root Mean Square Error (RMSE) and the
where
5.2 Multilinear regressions for physicochemical properties of filovirus drugs through reverse sum revan indices
The best fit multilinear regression Equations 3–10 for the physicochemical properties of filovirus drugs, which are obtained through QSPR analysis are presented in this section. The statistical parameters corresponding to the regression lines are summarized in Table 11.
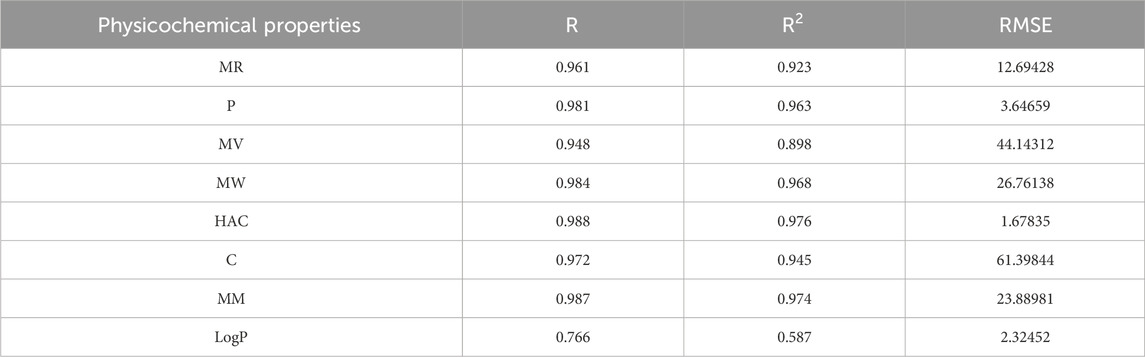
Table 11. Highly correlated statistical parameters for physicochemical properties through MLR and reverse sum Revan index.
From Table 11, it is observed that except for lipophilicity (LogP), all other properties are well predicted using the multilinear regression equations since they exhibit high
5.3 Multilinear regressions for pharmacokinetic properties of filovirus drugs through reverse sum revan indices
The best fit multilinear regression Equations 11–15 for the pharmacokinetic properties of filovirus drugs, which are obtained through QSPR analysis are presented in this section. The statistical parameters corresponding to the regression lines are summarized in Table 12.

Table 12. Highly correlated statistical parameters for pharmacokinetic properties through MLR and reverse sum Revan index.
From Table 12, it is observed that except maximum tolerated dose all other properties are well predicted using the multilinear regression equations since they exhibit high
6 Multilinear regression analysis of filovirus drugs using reverse degree based topological indices
6.1 Multilinear regressions for physicochemical properties of filovirus drugs
The best fit multilinear regression Equations 16–23 for the physicochemical properties of filovirus drugs, which are obtained through QSPR analysis of reverse indices are presented in this section. The statistical parameters corresponding to the regression lines are summarized in Table 13.
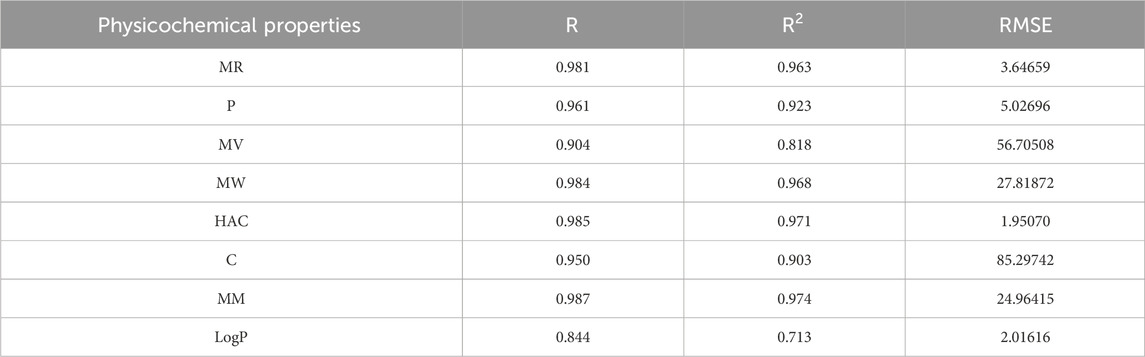
Table 13. Highly correlated statistical parameters for physicochemical properties through MLR and reverse index.
6.2 Multilinear regressions for pharmacokinetic properties of filovirus drugs
The best fit multilinear regression Equations 24–28 for the pharmacokinetic properties of filovirus drugs, which are obtained through QSPR analysis of reverse indices are presented in this section. The statistical parameters corresponding to the regression lines are summarized in Table 14.
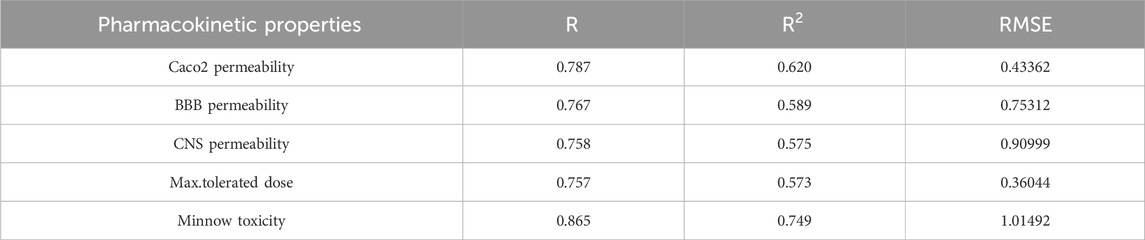
Table 14. Highly correlated statistical parameters for pharmacokinetic properties through MLR and reverse index.
7 Comparison analysis between new reverse sum revan index against existing reverse degree based index
In this section we compare the predictive capability of newly introduced reverse sum Revan index against the existing reverse degree based index. Tables 15, 16 shows the comparison of best predictive multilinear regressions for physicochemical and pharmacokinetic properties of filovirus drugs. The comparison graph between existing reverse index and new reverse sum Revan index are shown in Figures 4, 5.
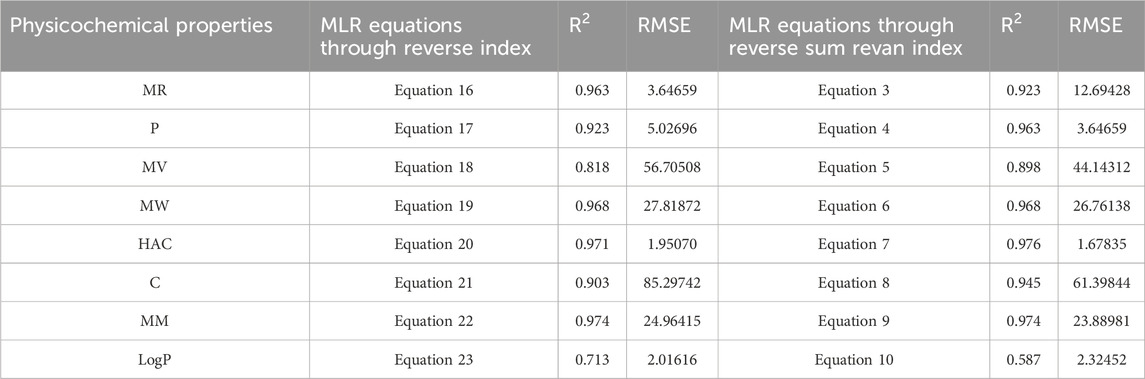
Table 15. Comparison of best predictive fits for physicochemical properties between reverse sum Revan index and reverse index.
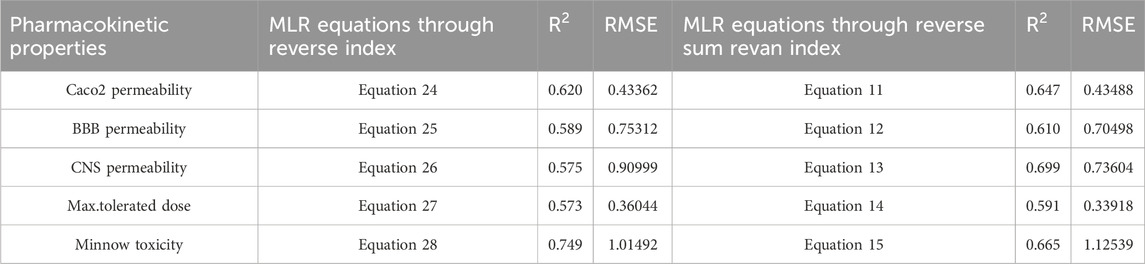
Table 16. Comparison of best predictive fits for pharmacokinetic properties between reverse sum Revan index and reverse index.
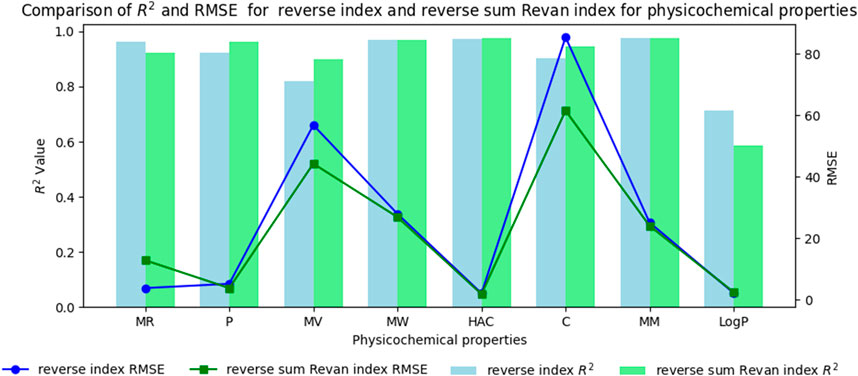
Figure 4. Comparison graph between existing reverse index and new reverse sum Revan index for physicochemical properties of filovirus drugs.
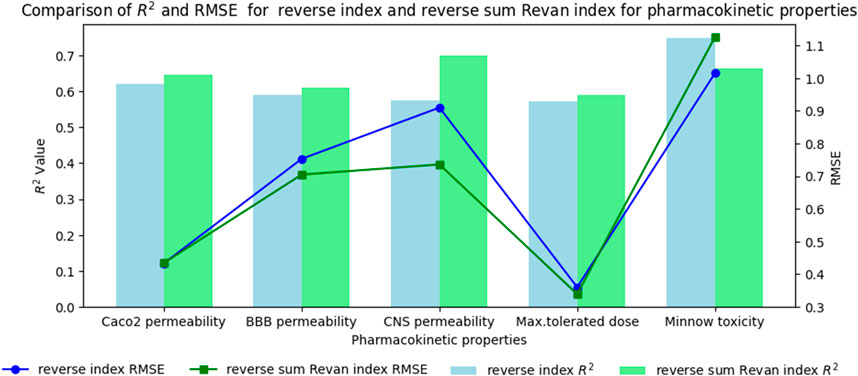
Figure 5. Comparison graph between existing reverse index and new reverse sum Revan index for pharmacokinetic properties of filovirus drugs.
7.1 Results and discussion
Based on the comparison in Tables 15, 16 between newly introduced reverse sum Revan index and existing reverse degree based index for physicochemical and pharmacokinetic properties the following results are obtained through QSPR analysis.
(i). Molar Refractivity (MR): The existing reverse index outperformed the new reverse sum Revan index with a higher
(ii). Polarizability (P): The reverse sum Revan index showed superior performance with an
(iii). Molar Volume (MV): The reverse sum Revan index had a better
(iv). Molecular Weight (MW) and Monoisotopic Mass (MM): Both indices showed comparable performance, with lower RMSEs, suggesting better precision.
(v). Heavy Atom Count (HAC) and Complexity (C): The new reverse sum Revan index outperformed the existing index in both
(vi). LogP: The existing reverse index was more effective, with an
(vii). Caco2 Permeability: The reverse sum Revan index showed a slightly higher
(viii). BBB Permeability: The new reverse sum Revan index demonstrated improved performance with an
(ix). CNS Permeability: The new index outperformed the existing one, achieving an
(x). Maximum Tolerated Dose: The reverse sum Revan index had a higher
(xi). Minnow Toxicity: The existing index performed better, achieving an
It is observed that the multilinear regressions based on new reverse sum Revan indices provide the best predictive fits for most of the physicochemical and pharmacokinetic properties except Molar Refractivity, LogP and Minnow toxicity. Therefore, our new reverse sum Revan indices differ significantly and improve upon the existing reverse and Revan degree based indices.
8 Comparison of multilinear regression (MLR) with artificial neural network (ANN) modelling technique for physicochemical and pharmacokinetic properties of filovirus drugs through reverse sum revan indices
8.1 Artificial neural network (ANN)
An artificial neural network (ANN) is a computational system inspired by the human brain, consisting of interconnected artificial neurons. Recognized for its ability to uncover complex nonlinear relationships, the ANN is widely used for predictive purposes across various fields, often outperforming traditional models. In this section a comparison is carried out between multilinear regression and ANN model for physicochemical and pharmacokinetic properties of filovirus drugs using reverse sum Revan indices. From Tables 17, 18 it can be noted that the MLR provide high
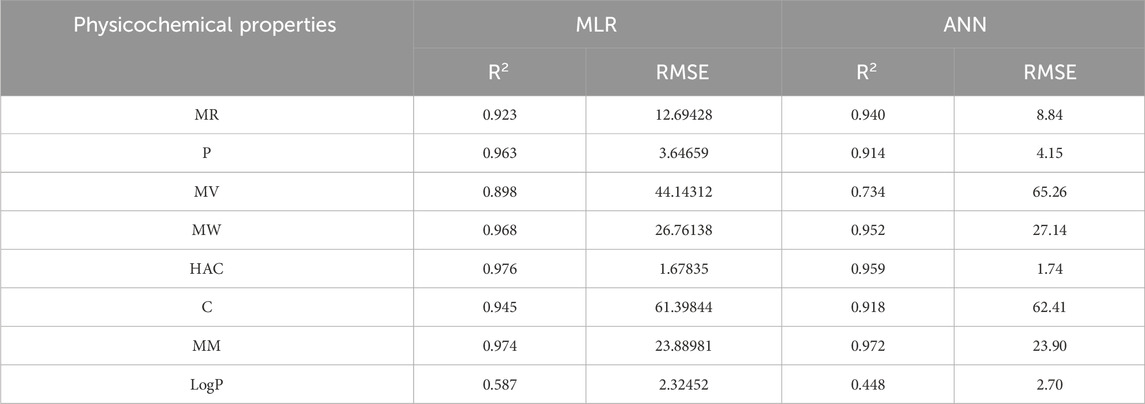
Table 17. Comparison of MLR and ANN modelling technique for physicochemical properties.
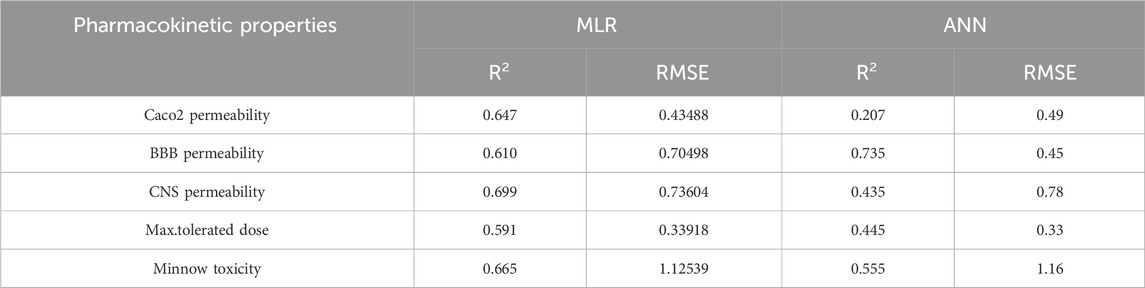
Table 18. Comparison of MLR and ANN modelling technique for physicochemical properties.
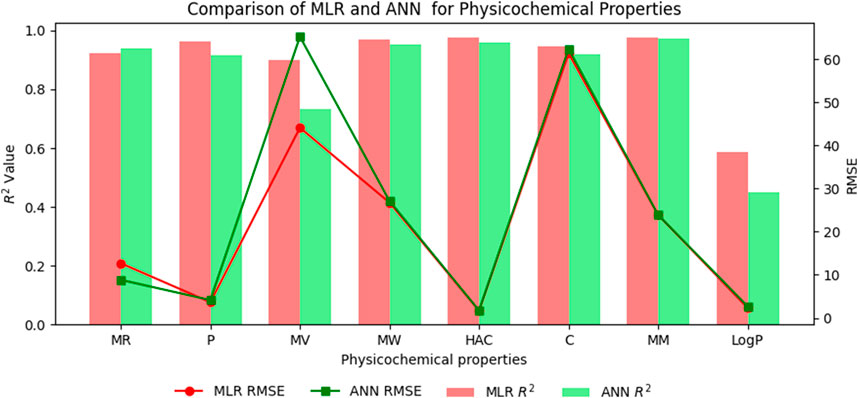
Figure 6. Comparison graph between MLR and ANN for physicochmeical properties.

Figure 7. Comparison graph between MLR and ANN for pharmacokinetic properties.
8.2 Results and discussion
The comparison of the performance of multilinear regressions (MLR) and artificial neural network (ANN) modelling technique for predicting physicochemical and pharmacokinetic properties of anti-filovirus drugs is highlighted through Tables 17, 18. The analysis is based on the
(i). Molar Refractivity (MR): The ANN outperformed MLR with a higher
(ii). Polarizability (P): MLR provided a better fit with a higher
(iii). Molar Volume (MV): MLR performed better, showing a higher
(iv). Molecular Weight (MW): The
(v). Heavy Atom Count (HAC): MLR slightly outperformed ANN with a higher
(vi). Complexity (C): MLR demonstrated better performance with
(vii). Monoisotopic Mass (MM): Both models performed comparably, with MLR showing a marginally better RMSE (23.89) than ANN (23.90).
(viii). LogP: MLR outperformed ANN with a higher
(ix). Caco2 Permeability: MLR had a higher
(x). BBB Permeability: ANN showed superior performance with a higher
(xi). CNS Permeability: MLR outperformed ANN with a higher
(xii). Maximum Tolerated Dose: The ANN model had a lower RMSE (0.33) but a lower
(xiii). Minnow Toxicity: MLR had a higher
The multilinear regressions generally showed stronger or comparable performance for both physicochemical and pharmacokinetic properties, with lower prediction errors and higher
9 Conclusion and future work
This article introduced a new degree based topological indices, known as reverse sum Revan indices, and computed them for the isomorphic molecular graphs of anti-filovirus drugs considered in this research. A Quantitative Structure-Property Relationship (QSPR) analysis using multilinear regression was performed to investigate the relationship between these indices and the physicochemical and pharmacokinetic properties of the drugs. When comparing the proposed reverse sum Revan indices to the existing reverse and Revan degree-based indices, we found that our new indices exhibit strong correlations with nearly all properties of anti-filovirus drugs. Additionally, the errors associated with our proposed indices are significantly reduced. This highlights the effectiveness of reverse sum Revan topological indices in predicting the physicochemical and pharmacokinetic properties of anti-filovirus drugs compared to traditional degree based indices. Additionally, the study suggests that theoretical analyses can help pharmaceutical industries to predict various properties of anti-filovirus drugs without relying on experimental testing. A comparative analysis of the Multilinear Regression (MLR) and Artificial Neural Network (ANN) models revealed that the multilinear regressions are more effective in predicting the properties of anti-filovirus drugs.
Despite significant progress occurring in the field of drug design, the primary methodology still relies on the utilization of topological descriptors. As a future work, these indices can provide valuable insights into the Quantitative Structure-Activity Relationship (QSAR) and Quantitative Structure-Toxicity Relationship (QSTR) analyses of different anti-filovirus drugs, anti-cancer drugs and other viral pathogens. Moreover, it would be interesting to explore the properties of various dendrimers, nanostructures, and chemical networks through reverse sum Revan indices. These indices can also be employed in Metal-Organic Frameworks (MOFs) to analyze and predict the properties of MOFs, aiding in their design, optimization, and application.
Beyond anti-filovirus drugs, these indices hold promise for a wide range of therapeutic areas. For instance, they could aid in analysis of chemical structures of cancer drugs and other viral pathogens, assisting in the rapid evaluation of candidate compounds based on their structural properties and pharmacokinetics, which is particularly valuable for emerging infectious diseases. Overall, the broader implications of the reverse sum Revan indices extend well beyond anti-filovirus drugs, providing valuable insights across multiple domains in drug discovery and material science. By incorporating these indices into future research, scientists can advance the development of more effective therapeutic strategies for a variety of diseases.
Data availability statement
The original contributions presented in the study are included in the article/Supplementary Material, further inquiries can be directed to the corresponding author.
Author contributions
WT: Writing–review and editing, Writing–original draft, Visualization, Validation, Software, Methodology, Formal Analysis, Data curation, Conceptualization. BB: Writing–review and editing, Writing–original draft, Visualization, Validation, Supervision, Methodology, Investigation, Funding acquisition, Formal Analysis, Data curation, Conceptualization.
Funding
The author(s) declare that financial support was received for the research, authorship, and/or publication of this article. The article processing fee for open access is funded by the Vellore Institute of Technology, Chennai, India.
Acknowledgments
The authors thank the Vellore Institute of Technology, Chennai, India-600127 for the financial support and encouragement to carry out this research work. Also the authors would like to thank the reviewers and editor for their valuable comments and suggestions for the improvement of this article.
Conflict of interest
The authors declare that the research was conducted in the absence of any commercial or financial relationships that could be construed as a potential conflict of interest.
Publisher’s note
All claims expressed in this article are solely those of the authors and do not necessarily represent those of their affiliated organizations, or those of the publisher, the editors and the reviewers. Any product that may be evaluated in this article, or claim that may be made by its manufacturer, is not guaranteed or endorsed by the publisher.
Supplementary material
The Supplementary Material for this article can be found online at: https://www.frontiersin.org/articles/10.3389/fchem.2024.1486933/full#supplementary-material
References
Adnan, Mr, Ahtsham, S., Bokhary, Ul H., Abbas, G., and Iqbal, T. (2022). Degree-based topological indices and qspr analysis of antituberculosis drugs. J. Chem. 2022, 1–17. doi:10.1155/2022/5748626
Ahmed, I., Salsabil, L., Hossain, Md J., Shahriar, M., Bhuiyan, M. A., and Islam, Md R. (2023). The recent outbreaks of marburg virus disease in african countries are indicating potential threat to the global public health: future prediction from historical data. Health Sci. Rep. 6 (7), e1395. doi:10.1002/hsr2.1395
Akash, S., Islam, Md R., Rahman, Md M., Hossain, Md S., Azad, Md A. K., and Sharma, R. (2023). Investigation of the new inhibitors by modified derivatives of pinocembrin for the treatment of monkeypox and marburg virus with different computational approaches. Biointerface. res.appl. Chem. 13 (6), 534. doi:10.33263/BRIAC136.534
Akpovwa, H. (2016). Chloroquine could be used for the treatment of filoviral infections and other viral infections that emerge or emerged from viruses requiring an acidic pH for infectivity. Cell Biochem. Funct. 34 (4), 191–196. doi:10.1002/cbf.3182
Alfson, K. J., Worwa, G., Carrion, R., and Griffiths, A. (2015). Determination and therapeutic exploitation of ebola virus spontaneous mutation frequency. J. Virol. 90 (5), 2345–2355. doi:10.1128/JVI.02701-15
Askarian, F., Firoozi, Z., Ebadollahi-Natanzi, A., Bahrami, S., and Rahimi, H. R. (2022). A review on the pharmacokinetic properties and toxicity considerations for chloroquine and hydroxychloroquine to potentially treat coronavirus patients. Toxicol. Res. 38, 137–148. doi:10.1007/s43188-021-00101-5
Austel, V., Balaban, A. T., Bonchev, D., Charton, M., Fujita, T., Iwamura, H., et al. (1983). “Topological indices for structure-activity correlations,” in Steric effects in drug design (Springer), 21–55.
Balasubramaniyan, D., and Chidambaram, N. (2023). On some neighbourhood degree-based topological indices with qspr analysis of asthma drugs. Eur. Phys. J. Plus 138 (9), 823. doi:10.1140/epjp/s13360-023-04439-7
chauhan, A. pratap singh, Kumar, A., and Srivastava, V. (2019). Silico analysis of Physicochemical, Pharmacokinetic and Toxicological properties of envelope protein inhibitors of yellow fever virus. Int. J. Res. Eng. Appl. and Manag. (IJREAM). 5 (4). doi:10.35291/2454-9150.2019.0311
Chu, W. Y., and Dorlo, T. P. C. (2023). Pyronaridine: a review of its clinical pharmacology in the treatment of malaria. J. Antimicrob. Chemother. 78 (10), 2406–2418. doi:10.1093/jac/dkad260
Deutsch, E., and Klavˇzar, S. (2014). M-polynomial and degree-based topological indices. arXiv Prepr. arXiv:1407.1592. doi:10.48550/arXiv.1407.1592
Došlić, T., Furtula, B., Graovac, A., Gutman, I., Moradi, S., and Yarahmadi, Z. (2011a). “On vertex-degree-based molecular structure descriptors,” in MATCH communications in mathematical and in computer chemistry.
Došlić, T., Réti, T., and Vukičević, D. (2011b). On the vertex degree indices of connected graphs. Chem. Phys. Lett. 512 (4-6), 283–286. doi:10.1016/j.cplett.2011.07.040
Ekins, S., Lingerfelt, M. A., Comer, J. E., Freiberg, A. N., Mirsalis, J. C., O'Loughlin, K., et al. (2018). Efficacy of tilorone dihydrochloride against ebola virus infection. Antimicrob. Agents Chemother. 62 (2), e01711. doi:10.1128/AAC.01711-17
Estrada, E., Torres, L., Rodriguez, L., and Gutman, I. (1998). An atom-bond connectivity index: modelling the enthalpy of formation of alkanes.
Furtula, B., and Gutman, I. (2015). A forgotten topological index. J. Math. Chem. 53 (4), 1184–1190. doi:10.1007/s10910-015-0480-z
Gaisina, I. N., Peet, N. P., Wong, L., Schafer, A. M., Cheng, H., Anantpadma, M., et al. (2020). Discovery and structural optimization of 4-(aminomethyl)benzamides as potent entry inhibitors of ebola and marburg virus infections. J. Med. Chem. 63 (13), 7211–7225. doi:10.1021/acs.jmedchem.0c00463
Gao, W., Iqbal, Z., Ishaq, M., Sarfraz, R., Aamir, M., and Aslam, A. (2018). On eccentricity-based topological indices study of a class of porphyrin-cored dendrimers. Biomolecules 8 (3), 71. doi:10.3390/biom8030071
Gutman, I., and Polansky, O. E. (2012). Mathematical concepts in organic chemistry. Springer Science and Business Media.
Gutman, I., Ru?? Ić, B., Trinajstić, N., and Wilcox, C. F. (1975). Graph theory and molecular orbitals. xii. acyclic polyenes. J. Chem. Phys. 62 (9), 3399–3405. doi:10.1063/1.430994
Hanieh, H., Islam, V. I. H., Subramanian, S., Chellappandian, M., Ragul, K., Durga, A., et al. (2017). Pinocembrin, a novel histidine decarboxylase inhibitor with anti-allergic potential in invitro. Eur. J. Pharmacol. 814, 178–186. doi:10.1016/j.ejphar.2017.08.012
Haque, A., Hober, D., and Blondiaux, J. (2015). Addressing therapeutic options for ebola virus infection in current and future outbreaks. Antimicrob. Agents Chemother. 59, 5892–5902. doi:10.1128/aac.01105-15
Havare, O. C. (2021). Topological indices and qspr modeling of some novel drugs used in the cancer treatment. Int. J. Quantum Chem. 121 (24), e26813. doi:10.1002/qua.26813
Hu, M., Ali, H., Ahsan Binyamin, M., Ali, B., Liu, J.-B., and Fan, C. (2021). On distance-based topological descriptors of chemical interconnection networks. J. Math. 2021, 1–10. doi:10.1155/2021/5520619
Humeniuk, R., Mathias, A., Kirby, B. J., Lutz, J. D., Cao, H., Osinusi, A., et al. (2021). Pharmacokinetic, pharmacodynamic, and drug-interaction profile of Remdesivir, a SARS-CoV-2 replication inhibitor. Clin. Pharmacokinet. 60 (5), 569–583. doi:10.1007/s40262-021-00984-5
Islam, Md A., Adeiza, S. S., Amin, M. R., Kaifa, F. H., Lorenzo, J. M., Bhattacharya, P., et al. (2023). A bibliometric study on marburg virus research with prevention and control strategies. Front. Trop. Dis. 3, 1068364. doi:10.3389/fitd.2022.1068364
Johansen, L. M., Brannan, J. M., Delos, S. E., Shoemaker, C. J., Stossel, A., Lear, C., et al. (2013). FDA-approved selective estrogen receptor modulators inhibit Ebola virus infection. Sci. Transl. Med. 5 (190), 190ra79. doi:10.1126/scitranslmed.3005471
Julander, J. G., Demarest, J. F., Taylor, R., Gowen, B. B., Walling, D. M., Mathis, A., et al. (2021). An update on the progress of galidesivir (BCX4430), a broad-spectrum antiviral. Antivir. Res. 195, 105180. doi:10.1016/j.antiviral.2021.105180
Kalaimathi, M., and Balamurugan, B. J. (2023). Topological indices of molecular graphs of monkeypox drugs for qspr analysis to predict physicochemical and admet properties. Int. J. Quantum Chem. 123 (22), e27210. doi:10.1002/qua.27210
Kansal, N., Garg, P., and Singh, O. (2023). Temperature-based topological indices and qspr analysis of covid-19 drugs. Polycycl. Aromat. Compd. 43 (5), 4148–4169. doi:10.1080/10406638.2022.2086271
Kim, H. C., Yang, E., Ban, M. S., Kim, Y. K., Hong, S. H., Jung, J., et al. (2023). Pharmacokinetics and pharmacodynamics of esomezol DR, a new dual delayed-release formulation of Esomeprazole 20 Mg or 40 Mg, in healthy subjects. Drug Des. Devel Ther. 17, 1115–1124. doi:10.2147/DDDT.S392533
Kirmani, S. A. K., Ali, P., and Azam, F. (2021). Topological indices and qspr/qsar analysis of some antiviral drugs being investigated for the treatment of covid-19 patients. Int. J. Quantum Chem. 121 (9), e26594. doi:10.1002/qua.26594
Kulli, V. R. (2018). Reverse Zagreb and reverse hyper-Zagreb indices and their polynomials of rhombus silicate networks. Ann. Pure Appl. Math. 16 (1), 47–51. doi:10.22457/apam.v16n1a6
Liu, J. B., Arockiaraj, M., Arulperumjothi, M., and Prabhu, S. (2021). Distance based and bond additive topological indices of certain repurposed antiviral drug compounds tested for treating COVID-19. Int. J. Quantum Chem. 121 (10), e26617. doi:10.1002/qua.26617
Long, J., Wright, E., Molesti, E., Temperton, N., and Barclay, W. (2015). Antiviral therapies against Ebola and other emerging viral diseases using existing medicines that block virus entry. F1000Res 4, 30. doi:10.12688/f1000research.6085.2
Marzi, A., and Feldmann, H. (2023). Marburg virus disease: global threat or isolated events? J. Infect. Dis. 228, 103–105. doi:10.1093/infdis/jiad161
Mentré, F., Taburet, A. M., Guedj, J., Anglaret, X., Keïta, S., de Lamballerie, X., et al. (2015). Dose regimen of favipiravir for Ebola virus disease. Lancet Infect. Dis. 15 (2), 150–151. doi:10.1016/S1473-3099(14)71047-3
Mondal, S., De, N., and Pal, A. (2022). Topological indices of some chemical structures applied for the treatment of covid-19 patients. Polycycl. Aromat. Compd. 42 (4), 1220–1234. doi:10.1080/10406638.2020.1770306
Nasir, S., Bashir Farooq, F., Parveen, S., and Parveen, S. (2022). Topological indices of novel drugs used in blood cancer treatment and its qspr modeling. AIMS Math. 7 (7), 11829–11850. doi:10.3934/math.2022660
Pagan, F. L., Hebron, M. L., Wilmarth, B., Torres-Yaghi, Y., Lawler, A., Mundel, E. E., et al. (2019). Pharmacokinetics and pharmacodynamics of a single dose Nilotinib in individuals with Parkinson's disease. Pharmacol. Res. Perspect. 7 (2), e00470. doi:10.1002/prp2.470
Parveen, S., Bashir Farooq, F., Awan, N.Ul H., Fanja, R., and Choudhary, M. F. (2022). Topological indices of drugs used in rheumatoid arthritis treatment and its qspr modeling. J. Math. 2022, 1–11. doi:10.1155/2022/1562125
Paul, D., Arockiaraj, M., Jacob, K., and Clement, J. (2023). Multiplicative versus scalar multiplicative degree-based descriptors in QSAR/QSPR studies and their comparative analysis in entropy measures. Eur. Phys. J. Plus 138 (4), 323. doi:10.1140/epjp/s13360-023-03920-7
Porter, D. P., Mweidner, J., Gomba, L., Bannister, R., Blair, C., Jordan, R., et al. (2020). Remdesivir (gs-5734) is efficacious in cynomolgus macaques infected with marburg virus. J. Infect. Dis. 222 (11), 1894–1901. doi:10.1093/infdis/jiaa290
Puhl, A. C., Fritch, E. J., Lane, T. R., Tse, L. V., Yount, B. L., Sacramento, C. Q., et al. (2021). Repurposing the ebola and marburg virus inhibitors tilorone, quinacrine, and pyronaridine: in vitro activity against sars-cov-2 and potential mechanisms. ACS omega 6 (11), 7454–7468. doi:10.1021/acsomega.0c05996
Ranjini, P. S., Lokesha, V., and Usha, A. (2013). Relation between phenylene and hexagonal squeeze using harmonic index. Int. J. Graph Theory 1 (4), 116–121.
Sarangi, N. K., Prabhakaran, A., and Keyes, T. E. (2022). Multimodal investigation into the interaction of quinacrine with microcavity-supported lipid bilayers. Langmuir 38 (20), 6411–6424. doi:10.1021/acs.langmuir.2c00524
Shanmukha, M. C., Basavarajappa, N. S., Shilpa, K. C., and Usha, A. (2020). Degree-based topological indices on anticancer drugs with qspr analysis. Heliyon 6 (6), e04235. doi:10.1016/j.heliyon.2020.e04235
Shen, X., Liu, Y., Luo, X., and Yang, Z. (2019a). Advances in biosynthesis, pharmacology, and pharmacokinetics of pinocembrin, a promising natural small-molecule drug. Molecules 24 (12), 2323. doi:10.3390/molecules24122323
Shen, X., Liu, Y., Luo, X., and Yang, Z. (2019b). Advances in biosynthesis, pharmacology, and pharmacokinetics of pinocembrin, a promising natural small-molecule drug. Molecules 24 (12), 2323. doi:10.3390/molecules24122323
Srivastava, S., Kumar, S., Ashique, S., Sridhar, S. B., Shareef, J., and Thomas, S. (2024). Novel antiviral approaches for Marburg: a promising therapeutics in the pipeline. Front. Microbiol. 15, 1387628. doi:10.3389/fmicb.2024.1387628
Tamilarasi, W., and Balamurugan, B. J. (2022a). “Non-neighbor topological indices on covid-19 drugs with qspr analysis,” in International conference on mathematics and computing (Springer), 263–277.
Tamilarasi, W., and Balamurugan, B. J. (2022b). ADMET and quantitative structure property relationship analysis of anti-Covid drugs against omicron variant with some degree-based topological indices. Int. J. Quantum Chem. 122 (20), e26967. doi:10.1002/qua.26967
Tamilarasi, W., and Balamurugan, B. J. (2023). Qspr model through revan indices to predict physicochemically and admet properties of anti-flaviviral drugs to treat zika virus. Biointerface Res. Chem. 13 (6), 556. doi:10.33263/BRIAC136.556
Thilsath Parveen, S., and Balamurugan, B. J. (2023). Qspr analysis through graph models for predicting admet properties of antifungal drugs to treat fungal diseases. Int. J. Quantum Chem. 123 (22), e27211. doi:10.1002/qua.27211
Vukičević, D., and Furtula, B. (2009). Topological index based on the ratios of geometrical and arithmetical means of end-vertex degrees of edges. J. Math. Chem. 46, 1369–1376. doi:10.1007/s10910-009-9520-x
Wiener, H. (1947). Structural determination of paraffin boiling points. J. Am. Chem. Soc. 69 (1), 17–20. doi:10.1021/ja01193a005
Yuan, S. (2015). Possible FDA-approved drugs to treat Ebola virus infection. Infect. Dis. Poverty 4, 23. doi:10.1186/s40249-015-0055-z
Zhang, X., Reddy, H. G., Usha, A., Shanmukha, M. C., Farahani, M. R., and Alaeiyan, M. (2022). A study on anti-malaria drugs using degree-based topological indices through qspr analysis. Math. Biosci. Eng. 20, 3594–3609. doi:10.3934/mbe.2023167
Zhong, J.-F., Rauf, A., Naeem, M., Rahman, J., and Aslam, A. (2021). Quantitative structure-property relationships (qspr) of valency based topological indices with covid-19 drugs and application. Arabian J. Chem. 14 (7), 103240. doi:10.1016/j.arabjc.2021.103240
Keywords: anti-filovirus drugs, Ebola virus, Marburg virus, reverse sum Revan index, QSPR, multilinear regression, artificial neural network
Citation: Tamilarasi W and Balamurugan BJ (2024) New reverse sum Revan indices for physicochemical and pharmacokinetic properties of anti-filovirus drugs. Front. Chem. 12:1486933. doi: 10.3389/fchem.2024.1486933
Received: 27 August 2024; Accepted: 21 November 2024;
Published: 19 December 2024.
Edited by:
Wu Xu, University of Louisiana at Lafayette, United StatesReviewed by:
Nitin Sharma, Washington University in St. Louis, United StatesSutanu Nandi, University of Colorado Anschutz Medical Campus, United States
Copyright © 2024 Tamilarasi and Balamurugan. This is an open-access article distributed under the terms of the Creative Commons Attribution License (CC BY). The use, distribution or reproduction in other forums is permitted, provided the original author(s) and the copyright owner(s) are credited and that the original publication in this journal is cited, in accordance with accepted academic practice. No use, distribution or reproduction is permitted which does not comply with these terms.
*Correspondence: B. J. Balamurugan, YmFsYW11cnVnYW4uYmpAdml0LmFjLmlu