Abstract
Paper and board represent 10%–39% of the total municipal solid waste generated. In order to address the European Commission (EC) recycling targets, this study aimed to develop flexible Surface-enhanced Raman Scattering (SERS) recycled-paper-based substrates tested by using a new eco-friendly and nontoxic molecule probe. This study reports for the first time the implementation of the microbial dye violacein, obtained by Janthinobacterium lividum batch cultivation, as SERS probe, as a suitable substitutive to the most employed toxic chemical dye Rhodamine 6G (R6G). The interaction of the proposed natural probe with the metal surface after the adsorption and the presence of local electromagnetic fields were evaluated by computational approach. The SERS devices developed were decorated by applying a single-step pulsed laser deposition (PLD) decoration method and characterized using UV–Vis absorption spectroscopy. The platform showed a remarkable sensitivity, achieving a detection limit of 10–7 M for violacein, allowing to point out the strong potential of this natural microbial dye as a sustainable probe molecule for low-concentration analytes detection on SERS-active substrates, making them suitable for several application fields, such as environmental monitoring, food safety, cultural heritage analysis and diagnostics. This study demonstrates the feasibility of implementing eco-friendly materials in the development of chemical sensors as a sustainable innovation in environmental science by minimizing the ecological impact.

1 Introduction
The population growth, expected to reach 4.8 billion inhabitants by 2030, and the consequent increase of urbanization and industrialization are constantly contributing to the generation of municipal solid waste (MSW), whose production is expected to reach 4,2 billion tonnes by 2050 (Serrano et al., 2025; Vinti et al. 2021). MSW are mainly represented by food, gardening wastes, metal, plastics, textiles, glass, electronics, paper, board and miscellaneous waste. Among these, paper and board have been reported to range from 10% to 39% of the total, highlighting that an important amount of paper waste is generated instead of being recycled into new products (Hietala et al., 2018).
The incorrect MSW disposal is generating significant concerns among the World Health Organization (WHO) due to its potential to cause environmental pollution, which is strictly linked to adverse health effects for the population (World Health Organization, 2015).
Moreover, the United Nations (UN) suggested 17 Sustainable Development Goals (SDGs) to guarantee global sustainable development by 2030, emphasizing environmental protection and public health through recycling strategies (United Nations, 2015; Szarka et al., 2021). Concerning MSW, the European Commission (EC) has established specific recycling targets mandating that by 2035, a minimum of 65% of MSW must be recycled. Furthermore, more stringent regulations are imposed on recycling packaging waste, stipulating that 85% of paper and cardboard packaging must be recycled by 2030 (European Commission, 2018).
From this point of view, paper recycling has been explosive in the last decades, both for paper and cardboard new products as well as for new industrial sectors such as the construction materials industry, electronics, agriculture, pharmaceutical, biomedical, food and feed industry and optical sensor (Nechita, 2020; Wang et al., 2021; Javanbakht and Namazi, 2018; Ma et al., 2015). The 3D porous structure, flexibility, lightweight, biodegradability, and affordability make the paper a suitable and interesting substrate for the development of optical sensors (Wang et al., 2021). The interest in this matter is significantly heightened when the substrate is constituted of recycled paper, as recycling represents a fundamental feature of product design from a circular bioeconomy view.
Recently, the cost-effective, environmentally friendly, and renewable properties of paper have garnered significant attention, leading to numerous studies on its implementation as a flexible substrate platform for Surface-enhanced Raman Scattering (SERS) (Liu et al., 2016; Liu et al., 2020; Giuffrida et al., 2025; Park et al., 2018; Ogundare and van Zyl, 2019; Suleimenova et al., 2024). Moreover, paper-based sensors exhibit excellent capillary action, allowing them to absorb sample solutions efficiently, enabling a rapid adhesion of the target molecules and the sensor surface enrichment (Singh et al., 2018; Vo et al., 2019).
SERS technology is a powerful analytical technique showing great applicability in biochemistry, materials research, and environmental monitoring. It provides excellent specificity and sensitivity for the detection and the characterization of molecular species at the nanoscale by utilizing the Raman scattering and plasmonics principles (Zangana et al., 2024). SERS can be described as a surface phenomenon that allow the Raman scattering signal amplification of molecules adsorbed on a plasmonic metal nanoparticle when it is excited with a proper laser wavelength. This amplification is responsible of the enhanced sensitivity and the improved signal-to-noise ratio (Bodelón et al., 2018).
In recent year, this technique is gaining increasing attraction in several research fields, such as trace molecular detection (Fierro-Mercado and Hernández-Rivera, 2012; Moram et al., 2018; Sijia et al., 2020; Zangana et al., 2024), clinical diagnostics and therapeutics (Khan et al., 2022; Usman et al., 2023; Gao et al., 2023; Benešová et al., 2023), bacteria identification (Wang and Luo, 2023; Bodelón et al., 2017), food safety sensing (Xiong et al., 2018; Xiong et al., 2017), because of its several advantages in comparison with other analytical methodologies, such as fingerprint recognition, real-time applications, minor or no sample preparation, no water interferences, high resolution, and non-destructiveness of the sample (Fierro-Mercado and Hernández-Rivera, 2012; Usman et al., 2023; Suleimenova et al., 2024).
The implementation of flexible SERS substrates is emerging as a new innovative sensing platform generation, especially if compared with conventional rigid SERS substrates, because of their interesting application for analytes monitoring from irregularly shaped surface and on 3D objects. Moreover, the flexible feature offers more “hot spots” determining stronger SERS enhancement (Sijia et al., 2020; Wang and Luo, 2023). In order to verify the sensitivity and reproducibility of new SERS substrates, the most employed Raman probe is represented by Rhodamine 6G (R6G) (Hwang and Yang, 2018; Zeng et al., 2019; Wu et al., 2015; Araújo et al., 2017; Kim et al., 2017; Wang and Luo, 2023; Zangana et al., 2024). R6G has been classified as a toxic chemical dye, able to cause serious damage both to the human health and to the ecosystem, even at concentrations lower than 1 mg/L (Gear, 1974; Nestmann et al., 1979; John, 1989; Phuong et al., 2022; Thaler et al., 2008), determining the need to address the research towards the implementation of new eco-friendly and non-toxic pigments as suitable probes.
With this aim, previous studies have been carried out by using synthetic food dyes, including sunset yellow (SY), and tartrazine (TZ), as standard probe molecules (Barveen et al., 2021; Xie et al. 2014). A significant drawback associated with the implementation of these molecules is the growing concern over the potential hazardous effects that synthetic molecules may pose to both the environment and human health (Rollini et al., 2022; Li et al., 2022).
Currently the 80%–90% of dyes are produced by chemical synthesis. The main drawback associated with the implementation of chemical synthesis procedures is the generation of toxic waste that can harmfully affect both the environment and the human health (Joshi et al., 2023). This aimed the scientific interest on researching for suitable alternatives such as the implementation of natural pigments obtained by vegetable biomasses extractions (Yadav et al., 2023; Yusuf et al., 2017). On the other hand, vegetable-derived dyes are costly because of the long cultivation times required, the plant dependence to climatic conditions, and the extensive land and water resources needed (Lopez et al., 2023).
Moreover, the large-scale production of vegetable biomass for pigments extraction is generating concerns for the ecosystem due to deforestation and infringement on the diversity of local species. Thus, the prevailing challenge for both scientists and industries is to meet the increasing consumer demands for safer and “natural” alternatives.
Microbial dyes can represent an excellent alternative, since they present notable advantages over plant-based dyes. These include the rapid growth of microorganisms, their independence from seasonal limitations, and the possibility of their cultivation under strictly controlled conditions in bioreactors. Additionally, microorganisms can produce a diverse range of pigments according to the species and cultivation conditions employed (Narsing Rao et al., 2017; Rajendran et al., 2023). Advances in biotechnology development further enhance the potential for eco-sustainable processes to be applied across various sectors.
To the best of our knowledge, the implementation of natural dyes, particularly microbial dyes, as SERS probes, has not been previously explored. In this study, we report the implementation of paper waste as a flexible substrate for SERS platform, evaluating the sensors performance with violacein ([3-(1,2-dihydro-5-(5-hydroxy-1H-indol-3-yl)-2-oxo-3H-pyrrol-3-ilydene)-1,3-dihydro-2H-indol-2-one]), an indole derivative compound with a deep purple hue, produced via batch cultivation of the bacterium Janthinobacterium lividum. Violacein has been largely studied for its antimicrobial, antileishmanial, antiviral, as well as antitumor properties, and it has also been used as a colorant for a variety of natural and synthetic fabrics instead of other chemical colorants for textile dyeing (Kanelli et al., 2018; Durán et al., 2007; Rettori and Durán, 1998. However, no studies have reported its application as a probe molecule.
Moreover, a single-step decoration method, previously described (Giuffrida et al., 2025), based on Pulsed Laser Deposition (PLD) (Fazio et al., 2013; Agarwal et al., 2014), was applied in order to further reduce the environmental negative impact due to chemicals or thermal treatment. Finally, Density Functional Theory (DFT) calculations were performed to obtain the vibrational properties of violacein and deoxyviolacein molecules to be compared to experimental spectra (Jehlička et al., 2015).
The research was addressed on an ecological platform development aligned with the cradle-to-cradle concept. The SERS platforms utilized in this study can be recycled and converted into new, functional substrates, eliminating the need for introducing synthetic and/or toxic molecules into the environment.
2 Materials and methods
2.1 Materials and chemicals used
Recycled cellulose substrates from wastepaper were produced by an artisanal and sustainable process to eliminate unwanted chemicals in the final product. Paper drying was performed without the use of artificial heat sources (Angolo del CARTigianato -Reggio Calabria Italy). The paper showed a rough textured surface, interlaced with a complex web of fibers, providing a distinctly organic feel. The colour was a homogenous light grey, punctuated by tiny flecks and specks of darker material as a result of the recycled origin of the paper. The edges were somewhat frayed due to the handcrafted quality.
Ag nanoparticles produced by PLD starting from silver target 99.99%, dia. 15 mm, thick 1 mm from Nanovision srl.
Peptone, glucose, sodium chloride (NaCl), Dipotassium phosphate (K2HPO4), and agar were provided by Merk (Merck Lifescience, Damstad, Germany).
Ethanol (hypergrade LC-MS) was used to dissolve the samples. Water, acetonitrile (both MS grade) and formic acid were used for HPLC-DAD-ESI-MS analyses. All the solvents were obtained from Merck (Merck Lifescience, Damstad, Germany).
2.2 Microorganism and inoculum conditions
The strain employed in this study was Janthinobacterium lividum CECT946. It was maintained in a cryoprotective medium consisting of skim milk-glycerol (10% skim milk, 10% glycerol) stored at −20°C. Initially, the strain was reactivated by streaking onto Petri dishes. The growth medium comprised the following (g/L): peptone (17), glucose (2.5), NaCl (5), K2HPO4 (2.5), and agar (20). The pH of the medium was adjusted to 7.2 and sterilized in an autoclave (Sterilmatic STME, United States) at 121°C and 15 psi for 15 min. Incubation of the strain was conducted at 21°C for 56 h. Subsequently, the strain was transferred to shake flasks (125 mL) containing the aforementioned medium (25 mL, without agar).
2.3 Violacein production and recovery
The production of violacein was executed at a shake flask level utilizing the previously described medium, but with molasses and sodium glutamate as carbon and nitrogen sources, respectively. The medium composition was as follows (g/L): molasses (2.5), sodium glutamate (23.0), NaCl (5.0), and K2HPO4 (2.5). Fermentation media was adjusted to pH of 7.2. The production process was carried out at 21°C and 150 rpm for 63 h, with an inoculum size of 10% (v/v) in an orbital incubator (Innova 94, New Brunswick Scientific, United States). To recover violacein, the fermented broth (20 mL) underwent centrifugation at 6,235 g and 4°C for 20 min, separating the supernatant from the cellular pellet. The pellet was washed with sterile distilled water and frozen until further extraction process (Wang et al., 2009). To recover the pigment, it was utilized a horn-type ultrasound (Sonic Vibracell, United States) with ethanol as the solvent (working volume 20 mL). The extraction conditions included an amplitude of 40%, an extraction time of 4 min, and a solid-to-liquid ratio of 1:10. Following the extraction, the biomass was separated by centrifugation at 6,236 g for 20 min at 4°C. Subsequently, ethanol was removed using rotary evaporation. The pigmented extract was then subjected to freezing at −20°C and subsequent lyophilization, resulting in the production of a violet-colored powder.
2.4 HPLC-MS-PDA analysis
The lyophilized powder obtained from Janthinobacterium lividum was dissolved in 1 mL of ethanol and subsequently filtered through a syringe filter (PTFE, 0.45 μm). The ethanolic solution was stored in fridge at 4°C until HPLC analyses were carried out. A Shimadzu Prominence UFLC XR system equipped with a CBM-20A Controller, a SIL-20A XR Autosampler, two LC-20AD XR Solvent Delivery Unit and a CTO-20A Column Oven was employed for HPLC analysis. The instrument was coupled to an SPD-M20A Photo Diode Array Detector and to an LCMS-Mass Spectrometer detector (Shimadzu, Duisburg, Germany).
Chromatographic separation was achieved an Ascentis® Express C18 column (100 × 2.1 mm; 2.7 μm, Merck KGaA, Damstad, Germany) employing water and acetonitrile (both acidified with 1% of formic acid) as eluent A and B, respectively. Gradient went from 40% to 80% of B in 10 min, flow rate was of 0.2 mL/min, sample injection volume was 1 μL, and an oven temperature was set to 30°C. DAD detector was acquiring in the 190–800 nm range and spectra were visualized at λ = 570 nm. Mass spectra were acquired employing an electrospray interface (ESI) operating in both positive and negative ion modes. Mass spectra were acquired in the range 180–700 m/z with a scan speed of 1875 u/sec. DL and heat block temperature were set at 250°C and 400°C, respectively. Nebulizing gas flow was 1.5 L/min and Drying gas flow was 10 L/min.
LabSolutions software ver. 5.82 (Shimadzu) was used for analysis and data processing. Identification of compounds was accomplished using both DAD and MS data acquired.
2.5 Extract optical properties investigation
The optical properties of the violacein solution have been investigated using Ultraviolet-Visible Spectroscopy (UV/Vis). Analyses were carried out by using a 190–1,100 nm scan of the pigment solutions by using a V-730 spectrophotometer (Jasco). The solvent used for the pigment resuspension, ethanol, was used as blank.
2.6 Fabrication of the SERS devices based on recycled cellulose substrates and Ag nanoparticles obtained by pulsed laser deposition
SERS substrates were produced in the laboratory from recycled paper decorated with Ag nanoparticles obtained via Pulsed Laser Deposition (PLD) (D’Andrea et al., 2009; Ossi et al., 2011; Fazio et al., 2009). The well-established deposition protocol, reported in a previous study, allows for covering the cellulose surface with a nanostructured thin film, where couples of Ag nanoparticles with dimensions of about 20 nm, generate localized hotspots which enhance the signals of adsorbed molecules (Fazio et al., 2014; Mollica Nardo et al., 2018).
In this process, the nanoparticle (NP) size is influenced by a delicate interplay of several factors, such as laser fluence, distance between the target and substrate, gas type and pressure inside the vacuum chamber, amount of material ablated per pulse (Zhan et al., 2018; Hutter and Fendler, 2004; Willets and Van Duyne, 2007. These factors have a significant impact on the film’s properties and consequently affect SERS activity. The most effective SERS performance occurs when the excitation wavelength is matched to the localized surface plasmon resonance of the nanostructures.
In our previous study (Giuffrida et al., 2025), we optimized the deposition protocol to suit the cellulose substrate, by tuning the sample holder within the deposition chamber and the environmental conditions (Figure 1). Paper-based samples are, indeed, highly flexible and fragile, making it impractical to use the same sample holder designed for glass and silicon fragments. To address this challenge, a custom sample holder was specifically designed and manufactured to securely accommodate cellulose substrates within the deposition chamber (Figures 1a–c). This included a set of aluminum masks to lock the paper in place on the support, ensuring stability during the deposition process. The morphology of plasmonic nanostructures has been widely investigated in a preliminary study (Giuffrida et al., 2025), in relation not only to the deposition process but also to the type of paper used, in particular for texture and roughness to choose the best for SERS application.
FIGURE 1

Scheme of Pulsed Laser Deposition process (a); aluminum paper substrate holder (b); Ag deposited paper (c).
2.7 Preparation violacein solution
To explore the effectiveness of violacein in SERS applications, solutions with varying molar concentrations (10−2 M, 10−5 M, 10–6, 10−7 M) of violacein were prepared and drop-casted on the SERS platforms, previously tested and optimized which lack evident color even at the highest concentrations (Figure 2). Tests were conducted on paper type, which had demonstrated the best performance using Rhodamine 6G solution as the probe molecule with a lower detection limit around 10–10 (Giuffrida et al., 2025).
FIGURE 2

Violacein solution at progressive concentration and SERS platforms drop-casted with violacein at different concentrations from 10−2 M to 10−7 M.
2.8 Raman/SERS spectroscopy
Raman spectroscopy is a highly efficient technique that enables the identification of various materials. This method relies on the inelastic scattering of light by molecules or materials, providing insights into their vibrational modes and structural and electronic properties (Eesley, 2013). It is fast, non-destructive, and offers high sensitivity for recognizing different species. Additionally, it can be integrated with advanced optical microscopy, optical fibres, miniaturized lasers, and other photonic devices to enhance diagnostic capabilities (Ferrari and Basko, 2013). For example, metal nanoparticles are used to significantly amplify Raman signals through their plasmonic response. Surface-enhanced Raman scattering (SERS) spectroscopy is based on the phenomenon where Raman signals from molecules adsorbed on rough surfaces or nanoparticles made of noble metals (typically gold and silver) are greatly enhanced when illuminated by a laser. This enhancement arises from two effects: a weak chemical mechanism and a stronger electromagnetic mechanism, both linked to the resonant interaction of light with localized surface plasmons (LSPs) excited in the nanoparticles. The aggregation of metal nanoparticles creates “hot spots,” which are nanocavity regions between adjacent particles that further amplify the Raman signal of adsorbed molecules (Fan et al., 2011; Camposeo et al., 2016). In this study, Raman spectroscopy was employed to evaluate the SERS activity of these violacein solutions drop-casted on the SERS substrates and dried naturally. Raman spectra were collected using the BRAVO™ (Bruker Optik GMBH, Germany) handheld Raman spectrometer. This instrumentation can exhibit improved performance in acquiring SERS spectral signals under specific sample types and testing conditions thanks to the employed technology, which optimizes signal acquisition depending on the sample’s characteristics (Figure 3).
FIGURE 3

Bravo-Bruker spectrometer during acquisitions (a) on the SERS platform; (b) prototype of sensor holder for SERS applications.
The BRAVO utilizes a dual-laser system centered at 785 nm and 853 nm (DuoLaser™), with each laser covering a different spectral region and partially overlapping, resulting in spectra recorded across the 300 to 3,200 cm−1 range. The spectral resolution ranges between 10 and 12 cm−1. The device incorporates patented SSE™ (Sequentially Shifted Excitation) technology for fluorescence suppression. This technology operates the laser diodes at different temperatures, causing minor shifts (<1 nm) in excitation wavelengths. Non-Raman signals, such as spectral artifacts and fluorescence bands, remain at fixed positions within the spectral space, while Raman bands shift slightly based on the changes in excitation wavelengths. This allows for computational subtraction of the fluorescence signal, obtaining a “clean” final Raman spectrum.
During acquisition, the instrument was connected to a computer via Wi-Fi for manual acquisition parameter control through OPUS software. Raman spectra were collected from multiple points on each substrate to ensure the uniformity of the signal using 1,200 ms × 3 scans as acquisition parameters.
The SERS measurements on the platform were conducted using a prototype substrate holder specifically designed and manufactured to align with the Bravo Bruker, as well as other Raman spectrometers. In this configuration, acquisitions are made by orienting the substrate holder in a horizontal position on an optical bench, while aligning the Raman instrumentation in a vertical orientation (Figure 3).
3 Results and discussion
3.1 Pigment characterization through HPLC-MS-PDA and spectrophotometric analyses
Extracts dissolved in ethanol were subject to HPLC-PDA-ESI-MS analysis following the condition detailed in the materials and methods section. Two compounds, eluting at 4.4 min and 6.6 min, have been detected (Figure 4). The two compounds showed similar absorption spectra with a maximum at λ = 574 nm for peak 1 and at λ = 562 nm, slightly blue shifted, for peak 2 (Figure 5). The HPLC results showed that the pigments produced by Janthinobacterium lividum contained 57.36% of compound 1% and 42.64% of compound 2.
FIGURE 4

HPLC-PDA chromatogram analysis of the pigment extract from Janthinobacterium lividum (λ = 570 nm) where AU is for absorbance unit.
FIGURE 5
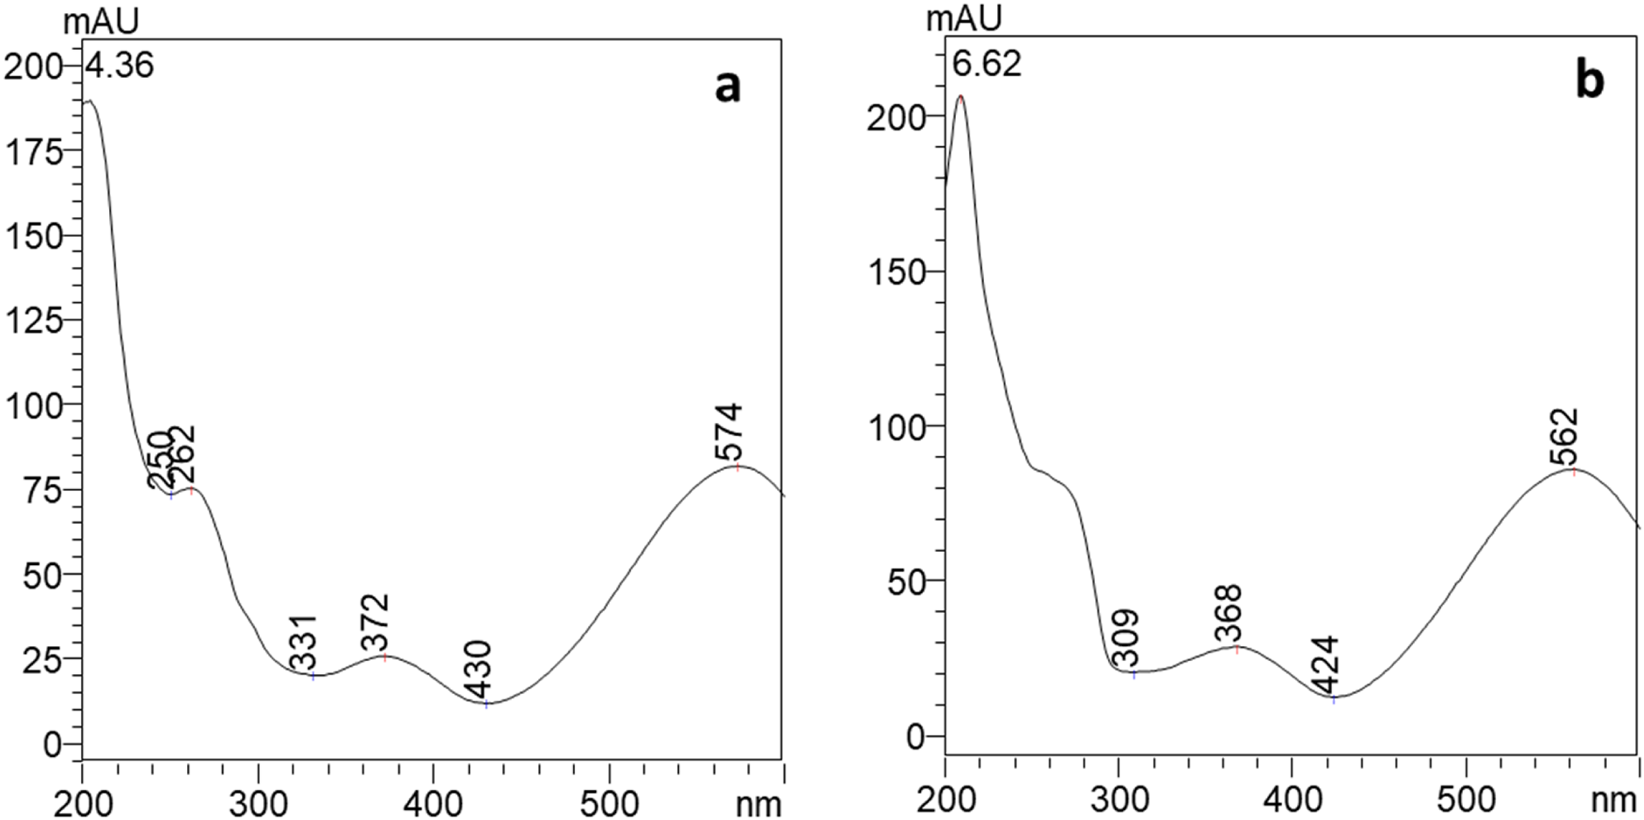
UV/Vis spectra of compound eluting a 4.4 min, peak 1 (a) and at 6.6 min, peak 2 (b) where AU is for absorbance unit.
Compounds were identified using mass spectrometry employing an electrospray interface. In detail, for the first eluted compound (peak 1 in Figure 4), a molecular ion [M-H]− was observed at m/z 342.0 for mass spectra acquired in negative ionization mode. Conversely, 344.0 m/z was the molecular ion [M–H]+ recorded in positive ionization mode. These masses are consistent with those of violacein (C20H13N3O3). For the compound eluting at 6.6 min (peak 2 in Figure 4), [M-H]- was found at 325.9 m/z and [M–H]+ at 328.0 m/z (Figure 6). Hence, the second peak can be attributed to deoxyviolacein (C20H13N3O2) (Wang et al., 2012). These results are consistent with previous ones where violeacein and deoxyviolacein have been identified as the main pigments produced by J. lividum (Choi et al., 2015).
FIGURE 6

ESI-MS spectra of compound eluting a 4.4 min, obtained in negative (a) and positive ionization mode (b); ESI-MS spectra of compound eluting a 6.6 min, obtained in negative (c) and positive (d) ionization mode.
A UV-Vis spectrophotometric measurement was performed on the solution prepared for SERS testing to confirm its physicochemical characteristics. The absorption spectrum in Figure 7 displays two absorption bands maxima at 370 and 575 nm and it was confirmed to be similar to the violacein standard spectrum (Anahas et al., 2022; Dantas et al., 2013) and to the compounds eluted from HPLC analyses.
FIGURE 7

Absorbance spectrum of a solution of Jantinobacterium lividum extract in ethanol.
3.2 Substrate characterization
The cellulose substrate before deposition was characterized via laser profilometry and results are reported in Giuffrida et al., 2025 (paper #3). Scanning Electron Microscopy (SEM) imaging was used to investigate the Ag nanoparticle distribution deposited by PLD onto the paper surface and assess their homogeneity, while UV-VIS absorption spectroscopy measurements were performed on the glass slide positioned beside the paper sheets during the deposition to track the position of the surface plasmon resonance peak (Figure 8). In Figure 8a, the red line represents the region analyzed for nanoparticle size estimation. The UV–Vis spectrum (Figure 8b) is characterized by the presence of a broad absorption band around 750 nm and extending between 350 and 1,100 nm.
FIGURE 8

(a) SEM image showing the distribution of the Ag NPs onto the cellulose fibers composing the paper substrate (the red line represents the region investuigated for NPs size estimation); (b) UV–Vis spectrum acquired on glass substrates coated with Ag NPs using the same deposition processes employed for paper #3 substrate; (c) Profile extracted illustrating surface variation; (d) Magnified view of a selection of the profile, highlighting nanostructure spacing.
Figure 8c provides an estimation of the NPs distribution and size along the selected profile line (for comparison, see also Giuffrida et al., 2025 and Romo-Herrera et al., 2021). While localized variations are present, the overall nanostructured morphology is consistent across the analyzed region. The images were processed and scaled in ImageJ using the embedded scale bar to ensure accuracy. The observed variations in the intensity profile do not correspond to the real elevation but rather to the distribution of Ag nanoparticles on the surface. The nanoparticle dimensions (Figure 8c, d) and distribution calculated in this study are fully consistent with with that obtained from other SEM images reported in our previous article, showing a size range approximately of 19–31 nm. This agreement is expected, as the deposition was carried out simultaneously and under identical experimental conditions. Further statistical analysis across multiple areas confirms the homogeneity of the pattern, ensuring substrate reproducibility.
3.3 Violacein tested as the probe molecule on the SERS device
As the first step, spectra were acquired from the recycled paper substrate alone (Figure 9), the same substrate with violacein at 10–2 M Ag Nps, and SERS substrate with Ag nanoparticles without violacein. As shown in Figure 9, the plain recycled paper exhibits the characteristic Raman peaks of cellulose, while no violacein-specific bands (e.g., 726 and 1,530 cm–1) are distinguishable on the paper substrate without Ag NPs even at the highest concentration tested (cfr. Agarwal et al., 2021). The bare SERS substrate (paper + AgNPs) shows a general reduction in cellulose peak intensity due to plasmonic damping effects.
FIGURE 9

Raman spectra comparing paper substrates and prepared samples (from bottom to top): Paper substrate (blue); Paper with violacein at 10–2 M concentration (orange); Paper with violacein at 10–5 M (green); Paper covered with Ag nanoparticles (SERS platform), shown as the mean spectrum with standard deviation shading (gray); SERS platform with violacein at 10–2 M (purple). Dashed vertical lines indicate characteristic peaks of violacein at 726 and 1530 cm–1.
As the second step, SERS measurements were conducted with violacein (10–2 M) on Ag-deposited platforms. The comparation between violacein at 10−2 M drop-casted on plain cellulose and Ag nanoparticle-coated substrates (Figure 9), respectively, revealed a marked enhancement in Raman signal upon nanoparticle decoration. While the spectrum collected on the plain paper (without deposition) shows only the peaks related to cellulose structure, given the low concentration of the probe molecule, vibrational modes attributed to violacein’s molecular structure, mainly those centered at 728 cm–1, 946 cm–1, and 1,530 cm–1, were amplified on the nanostructured surface by localized surface plasmon resonance effects.
To evaluate the capabilities of the paper-based SERS substrate, a series of Raman ans SERS spectra were collected for the recycled paper and the bare SERS substrate (paper + AgNP), both in absence and presence of the target molecule. Representative spectra are presented below, followed by the corresponding calibration curve and calculation of the enhancement factor (EF) to quantitatively assess SERS performance.
Figure 9 shows the Raman spectra of paper substrates dropcasted with violacein (VA), both with and without silver nanoparticles (AgNPs) and the Ag-deposited. From the Raman spectra is evident that violacein is not detectable on plain paper substrates, even at the highest tested concentration of 10–2 M. The spectrum of “Paper3 + VA 10–2 M” shows no distinct Raman peaks attributable to violacein emerging from the baseline signal of the cellulose-based substrate (Agarwal et al., 2021). This confirms that the cellulose-based substrate alone is not sufficient to reveal vibrational features of violacein at this concentration. The “Paper3 + AgNPs” spectrum shows suppression of the characteristic cellulose bands, suggestin that the AgNPs interact with the cellulose surface, altering its optical or scattering properties.
In contrast, the spectral profile changes under SERS condition (“Paper3 + AgNPs + VA 10–2 M”), where clear and intense vibrational modes characteristic of the target molecule (such as those centered at 728 cm–1, 946 cm–1, and 1,530 cm–1) start to emerge. These results demonstrate that the Ag nanostructured surface acts as an efficient SERS platform, amplifying the adsorbed molecules thanks to the localized surface plasmon resonance effects.
The Ag nanoparticles actes as hotspots, inducing strong electromagnetic fields near the molecule-nanoparticle interface that amplified violacein’s Raman signals by several orders of magnitude, while suppressing the background signals arising from from the cellulose support.
This amplification permits the clear visibility of violacein’s vibrational bands even at concentration that would be otherwise weak or undetectable in standard Raman spectroscopy. Notably, the peaks centered at 728 and 1,530 cm–1 demonstrated the highest intensity, making it a reliable indicator for quantifying violacein concentration across the tested range. The peak around 1,380 was excluded because it slightly emerge from the bare SERS substrate.
In Table 1 we reported the assignment of the specific vibrational modes of violacein, as suggested by previous studies (Jehlička et al., 2015) (Table 1).
TABLE 1
| Raman shift (cm-1) | Intensity | Assignment |
|---|---|---|
| 1,530 | sh | Pyrrole ring C=C and C-N |
| 1,465 | m | Pyrrole ring C=C and C-N |
| 1,379 | m, br | Quadrant CNC stretching |
| 1,175 | m | C-C stretching |
| 1,148 | m | C-C stretching |
| 1,141 | s | C-C stretching |
| 1,089 | w | — |
| 1,026 | vw | — |
| 958 | m | — |
| 945 | m | C-H bending or ring deformation vibrations |
| 870 | m | CN stretching |
| 808 | w | — |
| 726 | s | Aromatic ring C-C and CCC bending |
| 680 | m | Aromatic ring C-C and CCC bending |
| 620 | w | Aromatic ring C-C and CCC bending |
| 499 | m | CCO and CCN rocking and bending modes |
| 456 | m | CCO and CCN rocking and bending modes |
Violacein extracted from Janthinobacterium lividum-Raman shifts of major bands and assignments.
SERS spectra of violacein solutions were collected on the Ag nanostructured platforms across the following concentration rang: 10−2 M, 10−5 M, 10−6 M, 10−7 M. In Figure 10, the mean SERS spectra for each concentration are presented, each obtained by averaging three independent measurements under identical conditions. The shaded regions indicate the standard deviation, reflecting the good reproducibility of the measurements. The dashed vertical lines highlight key vibrational bands of violacein, particularly the most intense peaks at 728 cm−1 and 1,530 cm−1, which were selected as diagnostic markers. A progressive decrease in intensity with decreasing concentration is clearly observed for these peaks, confirming the SERS substrate’s ability to detect violacein down to 10–7 M. The scalability of signal intensity with concentration highlights the substrate’s suitability for quantitative analysis, demonstrating capacity to detect characteristic spectral fingerprints even at trace levels.
FIGURE 10

Mean Raman spectra of Violacein at different concentrations (from 10–2 M to 10–7 M), acquired on the on Ag-deposited SERS platform. For each concentration, the plotted spectrum represents the average of three measurements taken under identical conditions. The shaded regions indicate the standard deviation. The dashed vertical lines mark key peaks at 728 cm−1 and 1,530 cm−1.
The peaks centered around 1,084 and 1,124 cm−1 were excluded from the SERS evaluation, as they correspond also to vibrational modes common to cellulose, which appear with low intensity from the SERS substrate. However, the changing ratio of these peaks with violacein concentration suggested a relationship to violacein levels, indicating their potential link to concentration-dependent behavior.
The relative intensities of the bands around 1,084 and 1,124 cm−1 display an inversion trend at the lowest tested concentration (10–7 M). This is attributed to the decreasing contribution of violacein and the corresponding emergence of cellulose background signals, which become more prominent when the analyte concentration is insufficient. Cellulose typically exhibits a stronger Raman peak at 1,084 cm−1, while the 1,124 cm−1 band is more representative of violacein. As the analyte concentration increases, the violacein peak at 1,124 cm−1 becomes dominant again, confirming its molecular origin and the role of concentration in spectral composition.
This enhancement effect is further supported by the quantitative analysis in Figure 11, which presents (a) the calibration curves based on the integrated SERS intensities and (b) the calculated enhancement factors for the selected violacein bands, both plotted as a function of concentration in the range from 10–2 M to 10–7 M. We calculated the EF as the average Raman enhancement factor (AEF), which is defined as the ratio between the observed SERS intensity per molecule ISERS and the normal Raman intensity per molecule IR:
FIGURE 11

(a) Calibration curve of intensity for violacein at 726 cm−1 and 1,530 cm−1, plotted as a function of concentration (log-log scale). (b) Corresponding enhancement factors (EF) computed relative to the normal Raman signal at 10–2 M.
As reported above, a clear normal Raman spectrum cannot be obtained in absence of the Ag film even at the highest violacein concentration of 10–2 M (see Figure 9). In this case, in order to still have a EF trend as a function of the concentration we used the spectrum acquired on the 10–2 M concentration solution on the Ag coated paper as the IR value, even though this cannot be considered an actual EF. Considering that the same volume of solution at different concentrations was deposited on the substrates and that the measurements were carried out under the same experimental conditions (scattering volume, integration times), the trend of EF depends on the ISERS value assuming that all molecules within the scattering volume contribute to the SERS signal. The intensity values were extracted from three replicate spectra for each concentration, and the error bars represent the standard deviation. The calibration curve covers a concentration range from 10–2 M to 10–7 M, while at the lowest concentration it is not possible to distinguish signals from the noise, and results obviously 1 at 10−2 M. The curve shows a nearly linear relationship on a log-log scale, particularly for the peaks at 1,530 cm−1 which shows higher sensitivity. These trends confirm the concentration-dependent SERS response.
The EF values demonstrate a clear increase as concentration decreases. This trend demonstrates a strong amplification, especially at lower concentrations, confirming the efficiency of the AgNP-based substrate in generating electromagnetic hotspots for SERS and the suitability of the system.
As the final observation, we note that the calibration curve for Rhodamine 6G tested with the same device exhibits a similar behavior, with a linear increase in Raman intensity in the log-log scale. However, Rh6G showed higher sensitivity, particularly at low concentrations (10–10 M), whereas for violacein on Paper #3, the signal start to become indistinguishable from the noise at 10−7 M. This result remains significant when compared to the detectability range reported for other dyes used as probe molecules.
Literature reports limits of Detection (LOD) ranging from 10–8 to 10–5 M of different dyes, such as 10–8 M for Tartrazine (Ai et al., 2018), 10–7 M for Sunset Yellow (Ai et al., 2018) and p-aminothiophenol (PATP) (Liu et al., 2016), 10−6 M for Thiram (Siebe et al., 2021) and Congo Red (Iancu et al., 2014), 10–5 M Cristal Violet (Siebe et al., 2021), as shown in Table 2.
TABLE 2
| Dye | Substrates | Probe molecule, (LOD) M | Ref. |
|---|---|---|---|
| Tartrazine C16H9N4O9S2Na3 | flower-shaped Ag NPs in Polyvinylpyrrolidone (PVP) | 10–8 M | |
| Sunset yellow C16H10N2Na2O7S2 | 10–7 M | ||
| p-aminothiophenol H2NC6H4SH | Au NPs | 10–7 M | |
| Crystal violet C25H30ClN3 |
AgNPs in hydroxyethyl cellulose (HEC) | 10–5 M | |
| Thiram C6H12N2S4 |
10–6 M | ||
| Violacein C20H13N3O3 |
AgNPs | 10–7 M | This work |
Limit of Detection (LOD) of different dyes used as probe molecule in SERS detection.
3.4 Computational approaches
SERS spectra of a given molecule can differ substantially from the corresponding Raman spectra. For this reason, the evaluation of the effects of the metal surface on the Raman spectra has been studied by Density Functional Theory (DFT).
DFT calculations were performed with the Gaussian09 (Frisch et al., 2016) software package. We optimized both Violacein (1) and Deoxyviolacein (2) structures and computed their vibrational spectra at the B3LYP/6-311 (p,d) level of theory in gas phase. Raman spectra were reproduced using Lorentzian line shapes (FWHM = 10 cm−1) weighted by the off-resonance Raman activities computed by Gaussian09. The computed wavenumbers were scaled by the empirical factor of 0.983 in the whole range. In Figure 12 are reported the optimized geometries of the 1 (E = −1,160.20276112 Hartree) and 2 (E = −1,084.961941612 Hartree).
FIGURE 12

Optimized molecular structure of Violacein 1 and Deoxyviolacein 2.
The structure of Violacein can be described as composed by a 5-hydroxyindole, oxindole and a 2-pyrrolidone units. In Deoxyiviolacein the 5-hydroxyindole is replaced by an indole unit.
Violacein is a conjugated system so that most of the vibrational modes are expected to be coupled with vibrations involving many units along the whole molecules.
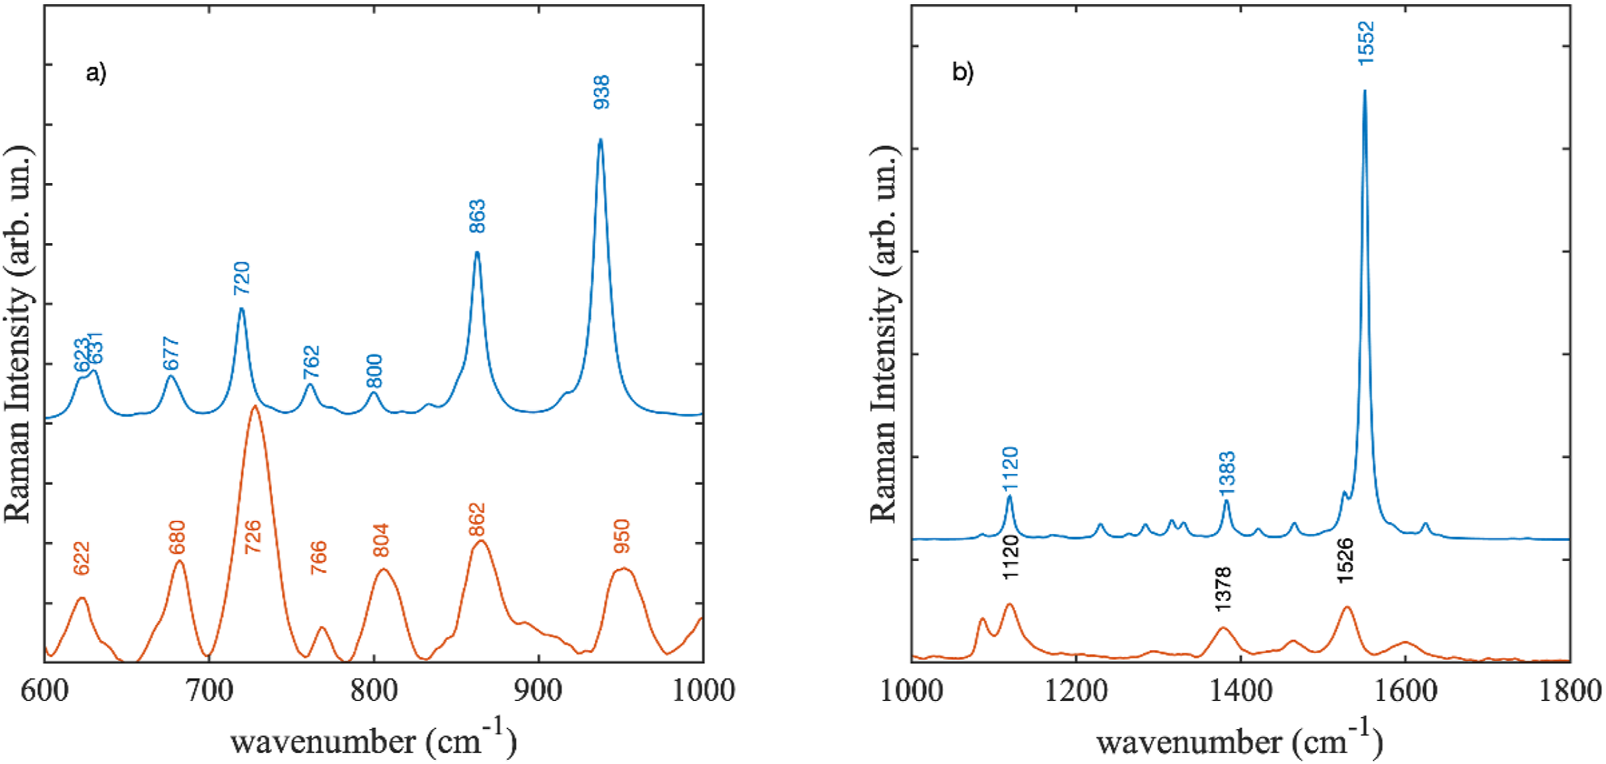
In Figure 13 are shown the DFT calculated Raman spectra of the two violacein structure 1 and 2. Comparison is reported in three different spectral regions, panels a), b) and c), owing to the very intense Raman activity of the 1,552 cm−1 mode with respect to the remaining Raman modes.
FIGURE 13

Density functional calculated Raman spectra of violacein structures 1 and 2. Wavenumbers are scaled by a semi-empirical factor of 0.983. Spectral regions are shown from 3000 to 3800 cm−1(a), 1000 to 1800 cm−1(b), and 600 to 1000 cm−1(c).
In the high frequency region between 3,000 and 3,800 cm−1 (Figure 13a), the calculated spectra showed little differences. Apart from the band at 3,763 cm−1 corresponding to OH stretching mode that is missing in the deoxyviolacein calculated spectrum. NH stretching modes appeared between 3,500 and 3,700 cm−1 while CH stretching modes were observed between 3,000 and 3,300 cm−1. Being such vibrational modes spatially localized major differences were not expected. In the region between 1,000 and 1800 cm-1 (Figure 13b) both structures showed the strongest Raman mode at 1,552 cm−1 and 1,553 cm−1, attributed to the stretching of the two CC bonds connecting the 2-pyrrolidone ring to oxindole and 5-hydroxindole units. In this region the spectra were almost identical the band at 1,383 cm−1 was exemplary of a coupled mode assigned to bending mode of CCH and CNH groups present in the oxindole and 2-pyrrolidone units. Similarly, the band at 1,120 cm−1 was attributed to the bending mode of CCH and CNH more intense in the 2-pyrrolidone and oxindole unit.
In the low-frequency region, as shown in Figure 13c, some differences were observed. Notably, the mode at 938 cm-1 in violacein split into two distinct modes in deoxyviolacein. This splitting occurs due to the activation of an out-of-plane CCH vibration in the indole units, caused by the absence of the hydroxyl group, while all other modes remain unaffected.
In Figure 14 the experimental SERS spectrum at the concentration level of 10–2 M was compared with the calculated DFT Raman spectra of the violacein structures. Two features were readily apparent in the region between 1,000 and 1800 cm−1. The most intense peak observed in the experimental spectrum was at 1,526 cm−1 this should correspond to the strongest calculated mode of the CC stretching at 1,552 cm−1 (Figure 14a). Experimentally it was observed in Janthinobacterium lividum extract at 1,552 cm−1. In SERS, variations in position and intensity compared to normal Raman or DFT gas-phase calculated spectra are expected, resulting from the interaction of the species with the metallic surfaces, either through covalent bonding or charge transfer mechanisms (Zanchi et al., 2020; Zanchi et al., 2024). Thus, the observed large shift of the CC stretching mode could derive from the establishment of a strong interaction mechanism between violacein and the metal surface. The peak at 1,120 cm−1 in the SERS spectrum coincided with a Raman peak of the cellulose substrate onto which the silver films were deposited. However, since this peak increased linearly with the concentration of violacein in the test solutions, we confidently attributed it to the DFT-calculated mode at 1,120 cm−1. Additionally, there was a good agreement among the most intense experimental peaks observed at 950, 862, 804 and 726 cm-1 that corresponded to the features at 938, 863, and 720 cm−1 in the Violacein DFT-calculated spectrum (Figure 14b).
FIGURE 14
SERS spectrum at 10−2 M concentration compared with the DFT calculated Raman spectra Violacein: (a) from 600 to 1000 cm−1, (b) from 1000 to 1800 cm−1. The experimental spectrum is scaled to enable easier comparison.
In the context of this work, the presence of a mixture of violacein and deoxyviolacein does not significantly influence the SERS activity on recycled paper coated with silver nanoparticles as the substrate. This characteristic represents a crucial advantage, as the enhanced Raman activity is unaffected by the presence in the mixture of a certain amount of deoxyviolacein, facilitating the application of violacein as an eco-friendly molecular probe.
4 Conclusion
This study successfully demonstrated the development of sustainable and flexible SERS-active devices by integrating an innovative deposition method with eco-friendly platforms and probe molecules. The use of recycled paper coated with silver nanoparticles as a SERS substrate proved effective for analytes detection and introduced the potential for material regeneration through a repulping process. This aligns with circular economy principles, minimizing waste, promoting reuse, and meeting the European Commission recycling targets.
The detection of violacein at concentrations as low as 10–7 M highlights its strong potential as a sustainable, non-toxic alternative to conventional dyes like Rhodamine 6G. Derived from microbial sources, violacein represents a significant advancement of applying biotechnological techniques and green chemistry principles to spectroscopic analyses. This innovation broadens the scope of SERS applications, including environmental monitoring, diagnostics, and cultural heritage preservation, while reducing the environmental impact associated with traditional probe molecules. Moreover, the portability of the testing instrument enhanced the level of sustainability along with materials and processes involved in this study.
In addition, the combined use of recycled cellulose-based substrates with naturally derived probes obtained through biotechnological techniques marks a significant step toward achieving full sustainability in SERS technology across all components. Ongoing exploration of alternative green solutions, such as silver colloid nanoparticles, further reinforces the integration of green chemistry in spectroscopic analyses. These findings highlight the potential for future advancements in eco-friendly sensor technologies and their application across diverse fields.
Statements
Data availability statement
The raw data supporting the conclusions of this article will be made available by the authors, without undue reservation.
Author contributions
AT: Conceptualization, Data curation, Formal Analysis, Investigation, Methodology, Validation, Visualization, Writing – original draft, Writing – review and editing. DS: Conceptualization, Data curation, Formal Analysis, Investigation, Methodology, Validation, Visualization, Writing – original draft, Writing – review and editing. DG: Data curation, Formal Analysis, Investigation, Methodology, Writing – original draft, Writing – review and editing. ST: Formal Analysis, Investigation, Writing – original draft. DG: Formal Analysis, Investigation, Writing – original draft, TS: Formal Analysis, Investigation, Writing – original draft. JM: Formal Analysis, Investigation, Writing – original draft. LM-O: Formal Analysis, Investigation, Writing – original draft. LM: Project administration, Resources, Supervision, Writing – review and editing. RP: Writing – review and editing, Investigation, Project administration, Resources, Supervision.
Funding
The author(s) declare that financial support was received for the research and/or publication of this article. The scientific research carried out by Chromaleont S.r.l was funded by Merck KGaA and Shimadzu Corporations. The funders were not involved in the study design, collection, analysis, interpretation of data, the writing of this article, or the decision to submit it for publication.
Acknowledgments
We thank European Union (Next-Generation EU), through the MUR-PNRR project SAMOTHRACE—Sicilian Micro and Nano Technology Research and Innovation Center (ECS00000022), as the eco-sustainable and flexible SERS platforms were designed and developed as part of this project. We thank FOE 2022 project FutuRaw - The raw materials of the future from non-critical, residual and renewable sources, for inspiring the use of biomass-derived, sustainable colorants as probe molecules for SERS performance assessment.
Conflict of interest
Author LM was Scientific Member of the Board of Directors of Chromaleont S.r.l.
The remaining authors declare that the research was conducted in the absence of any commercial or financial relationships that could be construed as a potential conflict of interest.
Generative AI statement
The author(s) declare that no Generative AI was used in the creation of this manuscript.
Publisher’s note
All claims expressed in this article are solely those of the authors and do not necessarily represent those of their affiliated organizations, or those of the publisher, the editors and the reviewers. Any product that may be evaluated in this article, or claim that may be made by its manufacturer, is not guaranteed or endorsed by the publisher.
References
1
Agarwal N. R. Tommasini M. Fazio E. Neri F. Ponterio R. C. Trusso S. et al (2014). SERS activity of silver and gold nanostructured thin films deposited by pulsed laser ablation. Appl. Phys. A117 (2), 347–351. 10.1007/s00339-014-8401-8
2
Agarwal U. P. Ralph S. A. Baez C. Reiner R. S. (2021). Detection and quantitation of cellulose II by Raman spectroscopy. Cellulose28, 9069–9079. 10.1007/s10570-021-04124-x
3
Ai Y. Liang P. Wu Y.-x. Dong Q.-m. Li J.-b. Bai Y. et al (2018). Rapid qualitative and quantitative determination of food colorants by both Raman spectra and Surface-enhanced Raman Scattering (SERS). Food Chem.241, 427–433. 10.1016/j.foodchem.2017.09.019
4
Anahas A. M. P. Kumaran S. Kandeel M. Muralitharan G. Silviya J. Adhimoolam G. L. et al (2022). Applications of natural violet pigments from halophilic Chromobacterium violaceum PDF23 for textile dyeing with antimicrobial and antioxidant potentials. J. Nanomater.2022. Article 3885396. 10.1155/2022/3885396
5
Araújo A. Pimentel A. João O. M. Mendes M. J. Franco R. Fortunato E. et al (2017). Direct growth of plasmonic nanorod forests on paper substrates for low-cost flexible 3D SERS platforms. Flexible Print. Electron.2 (1), 014001. 10.1088/2058-8585/2/1/014001
6
Barveen N. R. Wang T. J. Chang Y. H. Yuan-Liu Z. (2021). Ultrasensitive and reusable SERS probe for the detection of synthetic dyes in food industry through hybrid flower-shaped ZnO@Ag nanostructures. J. Alloys Compd.861, 157952. 10.1016/j.jallcom.2020.157952
7
Benešová M. Bernatová S. Mika F. Pokorná Z. Ježek J. Šiler M. et al (2023). SERS-tags: selective immobilization and detection of bacteria by strain-specific antibodies and surface-enhanced Raman scattering. Biosensors13 (182), 182. 10.3390/bios13020182
8
Bodelón G. Montes-García V. Costas C. Pérez-Juste I. Pérez-Juste J. Pastoriza-Santos I. et al (2017). Imaging bacterial interspecies chemical interactions by surface-enhanced Raman scattering. ACS Nano11 (5), 4631–4640. 10.1021/acsnano.7b00258
9
Bodelón G. Montes-García V. Pérez-Juste J. Pastoriza-Santos I. (2018). Surface-enhanced Raman scattering spectroscopy for label-free analysis of P. aeruginosa quorum sensing. Front. Cell. Infect. Microbiol.8, 143. 10.3389/fcimb.2018.00143
10
Camposeo A. Spadaro D. Magrì D. Moffa M. Gucciardi P. G. Persano L. et al (2016). Surface-enhanced Raman spectroscopy in 3D electrospun nanofiber mats coated with gold nanorods. Anal. Bioanal. Chem.408, 1357–1364. 10.1007/s00216-015-9226-9
11
Choi S. Y. Yoon K. Lee J. I. Mitchell R. J. (2015). Violacein: properties and production of a versatile bacterial pigment. BioMed Res. Int.2015, 1–8. 10.1155/2015/465056
12
D’Andrea C. Neri F. Ossi P. M. Santo N. Trusso S. (2009). The controlled pulsed laser deposition of Ag nanoparticle arrays for surface enhanced Raman scattering. Nanotechnology20 (24), 245606. 10.1088/0957-4484/20/24/245606
13
Dantas C. Tauler R. Ferreira M. M. C. (2013). Exploring in vivo violacein biosynthesis by application of multivariate curve resolution on fused UV–VIS absorption, fluorescence, and liquid chromatography–mass spectrometry data. Anal. Bioanal. Chem.405 (4), 1293–1302. 10.1007/s00216-012-6507-4
14
Durán N. Justo G. Z. Ferreira C. V. Melo P. S. Cordi L. Martins D. (2007). Violacein: properties and biological activities. Biotechnol. Appl. Biochem.48 (Pt 3), 127–133. 10.1042/BA20070115
15
Eesley G. L. (2013). Coherent Raman spectroscopy. Elsevier.
16
European Commission (2018). Circular economy: new rules will make EU the global front-runner in waste management and recycling. Available online at: https://ec.europa.eu/commission/presscorner/detail/en/ip_18_3846.
17
Fan M. Andrade G. F. Brolo A. G. (2011). A review on the fabrication of substrates for surface enhanced Raman spectroscopy and their applications in analytical chemistry. Anal. Chim. Acta693, 7–25. 10.1016/j.aca.2011.03.002
18
Fazio E. Neri F. Ossi P. M. Santo N. Trusso S. (2009). Growth process of nanostructured silver films pulsed laser ablated in high-pressure inert gas. Appl. Surf. Sci.255 (22), 9676–9679. 10.1016/j.apsusc.2009.04.050
19
Fazio E. Neri F. Ponterio R. C. Trusso S. Tommasini M. Ossi P. M. (2014). Laser controlled synthesis of noble metal nanoparticle arrays for low concentration molecule recognition. Micromachines5 (4), 1296–1309. 10.3390/mi5041296
20
Fazio E. Trusso S. Ponterio R. C. (2013). Surface-enhanced Raman scattering study of organic pigments using silver and gold nanoparticles prepared by pulsed laser ablation. Appl. Surf. Sci.272, 36–41. 10.1016/j.apsusc.2012.02.070
21
Ferrari A. C. Basko D. M. (2013). Raman spectroscopy as a versatile tool for studying the properties of graphene. Nat. Nanotechnol.8, 235–246. 10.1038/nnano.2013.46
22
Fierro-Mercado P. M. Hernández-Rivera S. P. (2012). Highly sensitive filter paper substrate for SERS trace explosives detection. Int. J. Spectrosc.10.1155/2012/71652
23
Frisch M. J. Trucks G. W. Schlegel H. B. Scuseria G. E. Robb M. A. Cheeseman J. R. et al (2016). Gaussian 09, revision A.02. Wallingford CT: Gaussian, Inc.
24
Gao W. Duan W. Peng D. Li J. Hu Z. Wang D. et al (2023). Surface-enhanced Raman Scattering (SERS) microbial sensor for fresh water acute toxicity monitoring. Microchem. J.191, 108822. 10.1016/j.microc.2023.108822
25
Gear A. R. (1974). Rhodamine 6G: a potent inhibitor of mitochondrial oxidative phosphorylation. J. Biol. Chem.249 (11), 3628–3637. 10.1016/S0021-9258(19)42620-3
26
Giuffrida D. Spadaro D. Strano V. Trusso S. Saladino M. L. Armetta F. et al (2025). Eco-sustainable and flexible SERS platform based on waste cellulose decorated by Ag nanoparticles. Mater. Chem. Phys.329, 130061. 10.1016/j.matchemphys.2024.130061
27
Hietala M. Varrio K. Berglund L. Soini J. Oksman K. (2018). Potential of municipal solid waste paper as raw material for production of cellulose nanofibres. Waste Manag.80, 319–326. 10.1016/j.wasman.2018.09.033
28
Hutter E. Fendler J. H. (2004). Exploitation of localized surface plasmon resonance. Adv. Mater.16 (19), 1685–1706. 10.1002/adma.200400271
29
Hwang J. S. Yang M. (2018). Sensitive and reproducible gold SERS sensor based on interference lithography and electrophoretic deposition. Sensors18 (4076), 4076. 10.3390/s18114076
30
Iancu V. Baia L. Tarcea N. Popp J. Baia M. (2014). Towards TiO2Ag porous nanocomposites based SERS sensors for chemical pollutant detection. J. Mol. Struct.1073, 51–57. 10.1016/j.molstruc.2014.05.026
31
Javanbakht S. Namazi H. (2018). Doxorubicin loaded carboxymethyl cellulose/graphene quantum dot nanocomposite hydrogel films as a potential anticancer drug delivery system. Mater. Sci. Eng. C87, 50–59. 10.1016/j.msec.2018.02.010
32
Jehlička J. Edwards H. G. M. Němec I. Oren A. (2015). Raman spectroscopic study of the Chromobacterium violaceum pigment violacein using multiwavelength excitation and DFT calculations. Spectrochimica Acta Part A Mol. Biomol. Spectrosc.151, 459–467. 10.1016/j.saa.2015.06.051
33
John E. F. (1989). NTP technical report on the toxicology and carcinogenesis studies of rhodamine 6G (C.I. Basic Red 1) (CAS No. 989-38-8) in F344/N rats and B6C3F1 mice (feed studies) (NTP TR 364). U.S. Department of Health and Human Services, National Institutes of Health.
34
Joshi K. Kumar P. Katari R. (2023). Microbial carotenoid production and their potential applications as antioxidants: a current update. Process Biochem.128, 190–205. 10.1016/j.procbio.2023.02.020
35
Kanelli M. Mandic M. Kalakona M. Vasilakos S. Kekos D. Nikodinovic-Runic J. et al (2018). Microbial production of violacein and process optimization for dyeing polyamide fabrics with acquired antimicrobial properties. Front. Microbiol.9, 1495. 10.3389/fmicb.2018.01495
36
Khan S. S. Ullah I. Zada S. Ahmad A. Ahmad W. Xu H. et al (2022). Functionalization of Se-Te nanorods with Au nanoparticles for enhanced anti-bacterial and anti-cancer activities. Materials15 (14), 4813. 10.3390/ma15144813
37
Kim W. Lee J.-C. Lee G.-J. Park H.-K. Lee A. Choi S. (2017). Low-cost label-free biosensing bimetallic cellulose strip with SILAR-synthesized silver core−gold shell nanoparticle structures. Anal. Chem.89 (11), 6448–6454. 10.1021/acs.analchem.7b00300
38
Li N. Wang Q. Zhou J. Li S. Liu J. Chen H. (2022). Insight into the progress on natural dyes: sources, structural features, health effects, challenges, and potential. Molecules27, 3291. 10.3390/molecules27103291
39
Liu J. Ji Z. Bin T. Tian Z. Li Y. Li J. et al (2016). Surface enhanced Raman scattering (SERS) fabrics for trace analysis. Appl. Surf. Sci.386, 296–302. 10.1016/j.apsusc.2016.05.150
40
Liu S. Cui R. Ma Y. Yu Q. Kannegulla A. Wu B. et al (2020). Plasmonic cellulose textile fiber from waste paper for BPA sensing by SERS. Spectrochimica Acta Part A Mol. Biomol. Spectrosc.227, 117664. 10.1016/j.saa.2019.117664
41
Lopez G. D. Alvarez-Rivera G. Carazzone C. Ibane E. Leidy C. Cifuentes A. (2023). Bacterial carotenoids: extraction, characterization, and applications. Crit. Rev. Anal. Chem.53 (6), 1239–1262. 10.1080/10408347.2021.2016366
42
Ma Y. Asaadi S. Johansson L. S. Ahvenainen P. Reza M. Alekhina M. et al (2015). High-strength composite fibers from cellulose–lignin blends regenerated from ionic liquid solution. ChemSusChem8, 4030–4039. 10.1002/cssc.201501094
43
Mollica Nardo V. Sinopoli A. Kabalan L. Ponterio R. C. Saija F. Trusso S. (2018). SERS and DFT study of indigo adsorbed on silver nanostructured surface. Spectrochimica Acta Part A Mol. Biomol. Spectrosc.205, 465–469. 10.1016/j.saa.2018.07.059
44
Moram B. S. S. Byram C. Shibu S. N. Chilukamarri B. M. Rao S. V. (2018). Ag/Au nanoparticle-loaded paper-based versatile surface-enhanced Raman spectroscopy substrates for multiple explosives detection. ACS Omega3, 8190–8201. 10.1021/acsomega.8b01318
45
Narsing Rao M. P. Xiao M. Li W.-J. (2017). Fungal and bacterial pigments: secondary metabolites with wide applications. Front. Microbiol.8, 1113. 10.3389/fmicb.2017.01113
46
Nechita P. (2020). Use of recycled cellulose fibers to obtain sustainable products for bioeconomy applications. IntechOpen. 10.5772/intechopen.86092
47
Nestmann E. R. Douglas G. R. Matula T. I. Grant C. E. Kowbel D. J. (1979). Mutagenic activity of rhodamine dyes and their impurities as detected by mutation induction in Salmonella and DNA damage in Chinese hamster ovary cells. Cancer Res.39 (11), 4412–4417.
48
Ogundare S. A. van Zyl W. E. (2019). A review of cellulose-based substrates for SERS: fundamentals, design principles, applications. Cellulose26, 6489–6528. 10.1007/s10570-019-02580-0
49
Ossi P. M. Neri F. Fazio E. Trusso S. (2011). Noble metal nanoparticles produced by nanosecond laser ablation. Appl. Phys. A104 (4), 829–837. 10.1007/s00339-011-6422-0
50
Park M. Hwang C. S. Jeong K.-H. (2018). Nanoplasmonic alloy of Au/Ag nanocomposites on paper substrate for biosensing applications. ACS Appl. Mater. and Interfaces10 (1), 290–295. 10.1021/acsami.7b16182
51
Phuong N. T. T. Nguyen T.-A. Huong V. T. Tho L. H. Anh D. T. Ta H. K. T. et al (2022). Sensors for detection of the synthetic dye rhodamine in environmental monitoring based on SERS. Micromachines13, 1840. 10.3390/mi13111840
52
Rajendran P. Somasundaram P. Dufossé L. (2023). Microbial pigments: eco-friendly extraction techniques and some industrial applications. J. Mol. Struct.1290, 135958. 10.1016/j.molstruc.2023.135958
53
Rettori D. Durán N. (1998). Production, extraction and purification of violacein: an antibiotic pigment produced by Chromobacterium violaceum. World J. Microbiol. Biotechnol.14, 685–688. 10.1023/A:1008809504504
54
Rollini R. Falciola L. Tortorella S. (2022). Chemophobia: a systematic review. Tetrahedron113, 132758. 10.1016/j.tet.2022.132758
55
Romo-Herrera J. M. Juarez-Moreno K. Guerrini L. Kang Y. Feliu N. Parak W. J. et al (2021). Paper-based plasmonic substrates as surface-enhanced Raman scattering spectroscopy platforms for cell culture applications. Mater. Today Bio11, 100125. 10.1016/j.mtbio.2021.100125
56
Serrano D. Sanchez-Delgado S. Horvat A. Marugan-Cruza C. Batuecas E. Kelebopile L. et al (2025). Non-recyclable municipal solid waste characterization and pyrolysis for energy recovery. Bioresour. Technol.415, 131641. 10.1016/j.biortech.2024.131641
57
Siebe H. S. Chen Q. Li X. Xu Y. Browne W. R. Bell S. E. J. (2021). Filter paper based SERS substrate for the direct detection of analytes in complex matrices. Analyst146 (1281), 1281–1288. 10.1039/d0an02103b
58
Sijia L. Rongkai C. Yibo M. Qian Y. Akash K. Bo W. et al (2020). Plasmonic cellulose textile fiber from waste paper for BPA sensing by SERS. Spectrochim. Acta, Part A. 227, 117664. 10.1016/j.saa.2019.117664
59
Singh A. T. Lantigua D. Meka A. Taing S. Pandher M. Camci-Unal G. (2018). Paper-based sensors: emerging themes and applications. Sensors (Basel)18 (9), 2838. 10.3390/s18092838
60
Suleimenova A. Frasco M. F. Sales M. G. F. (2024). An ultrasensitive paper-based SERS sensor for detection of nucleolin using silver-nanostars, plastic antibodies and natural antibodies. Talanta279, 126543. 10.1016/j.talanta.2024.126543
61
Szarka N. Haufe H. Lange N. Schier F. Weimar H. Banse M. et al (2021). Biomass flow in bioeconomy: overview for Germany. Renew. Sustain. Energy Rev.150, 111449. 10.1016/j.rser.2021.111449
62
Thaler S. Haritoglou C. Choragiewicz T. J. Messias A. Baryluk A. May A. C. et al (2008). In vivo toxicity study of rhodamine 6G in the rat retina. Investigative Ophthalmol. and Vis. Sci.49 (5), 2120–2126. 10.1167/iovs.07-1476
63
United Nations (Un) (2015). Transforming our world: the 2030. Agenda Sustain. Dev.
64
Usman M. Tang J.-W. Li F. Lai J.-X. Liu Q.-H. Liu W. et al (2023). Recent advances in surface-enhanced Raman spectroscopy for bacterial pathogen identifications. J. Adv. Res.51, 91–107. 10.1016/j.jare.2022.11.010
65
Vinti G. Bauza V. Clasen T. Medlicott K. Tudor T. Zurbrügg C. et al (2021). Municipal solid waste management and adverse health outcomes: a systematic review. Int. J. Environ. Res. Public Health18 (8), 4331. 10.3390/ijerph18084331
66
Vo T. N. L. Moon J. Mun C. Devaraj V. Oh J.-W. Park S.-G. et al (2019). A facile low-cost paper-based SERS substrate for label-free molecular detection. Sensors Actuators B Chem.291, 369–377. 10.1016/j.snb.2019.04.077
67
Wang F. Zhu X. Yan Y. Yu X. Jiang P. Xing X.-H. et al (2012). Biosynthesis and characterization of violacein, deoxyviolacein and oxyviolacein in heterologous host, and their antimicrobial activities. Biochem. Eng. J.67, 148–155. 10.1016/j.bej.2012.06.005
68
Wang H. Jiang P. Lu Y. Ruan Z. Jiang R. Xing X. H. et al (2009). Optimization of culture conditions for violacein production by a new strain of Duganella sp. B2. Biochem. Eng. J.44 (2-3), 119–124. 10.1016/j.bej.2008.11.008
69
Wang R. Luo J. (2023). Ag NP-filter paper based SERS sensor coupled with multivariate analysis for rapid identification of bacteria. RSC Adv.13, 499–505. 10.1039/d2ra05715h
70
Wang S. Guo J. Ma Y. Wang A. X. Kong X. Yu Q. (2021). Fabrication and application of SERS-active cellulose fibers regenerated from waste resource. Polymers13 (13), 2142. 10.3390/polym13132142
71
Willets K. A. Van Duyne R. P. (2007). Localized surface plasmon resonance spectroscopy and sensing. Annu. Rev. Phys. Chem.58, 267–297. 10.1146/annurev.physchem.58.032806.104607
72
World Health Organization (2015). Waste and human health: evidence and needs: WHO meeting report. Bonn, Germany: World Health Organization. Available online at: https://www.who.int/publications/i/item/WHO-FWC-IHE-15.03.
73
Wu W. Liu L. Dai Z. Liu J. Yang S. Zhou L. et al (2015). Low-cost, disposable, flexible and highly reproducible screen printed SERS substrates for the detection of various chemicals. Sci. Rep.5, 10208. 10.1038/srep10208
74
Xie Y. Chen T. Cheng Y. Wang H. Qian H. Yao W. (2014). SiO2@Au nanoshells-based SERS method for detection of sunset yellow and chrysoidine. Spectrochimica Acta Part A Mol. Biomol. Spectrosc.132, 355–360. 10.1016/j.saa.2014.04.096
75
Xiong Z. Chen X. Liou P. Lin M. (2017). Development of nanofibrillated cellulose coated with gold nanoparticles for measurement of melamine by SERS. Cellulose24 (6), 2801–2811. 10.1007/s10570-017-1297-7
76
Xiong Z. Lin M. Lin H. Huang M. (2018). Facile synthesis of cellulose nanofiber nanocomposite as a SERS substrate for detection of thiram in juice. Carbohydr. Polym.189, 79–86. 10.1016/j.carbpol.2018.02.014
77
Yadav S. Tiwari K. S. Gupta C. Tiwari M. K. Khan A. Sonkar P. S. (2023). A brief review on natural dyes, pigments: recent advances and future perspectives. Results Chem.5, 100733. 10.1016/j.rechem.2022.100733
78
Yusuf M. Shabbir M. Mohammad F. (2017). Natural colorants: historical, processing and sustainable prospects. Nat. Prod. Bioprospect.7, 123–145. 10.1007/s13659-017-0119-9
79
Zanchi C. Lucotti A. Pistaffa M. Ossi P. M. Trusso S. Fontana F. et al (2020). A Raman and SERS study on the interactions of aza[5]helicene and aza[6]helicene with a nanostructured gold surface. Vib. Spectrosc.111, 103180. 10.1016/j.vibspec.2020.103180
80
Zanchi C. Tommasini M. Lucotti A. Pistaffa M. Trusso S. Ossi P. M. et al (2024). SERS and DFT as powerful tools in the structure elucidation of a novel aza-aromatic derivative. J. Phys. Chem. C128, 19222–19232. 10.1021/acs.jpcc.4c04561
81
Zangana S. Veres M. Bonyár A. (2024). Surface-enhanced Raman spectroscopy (SERS)-based sensors for deoxyribonucleic acid (DNA) detection. Molecules29 (14), 3338. 10.3390/molecules29143338
82
Zeng F. Duan W. Zhu B. Mu T. Zhu L. Guo J. et al (2019). Paper-based versatile surface-enhanced Raman spectroscopy chip with smartphone-based Raman analyzer for point-of-care application. Anal. Chem.91 (2), 1064–1070. 10.1021/acs.analchem.8b04441
83
Zhan C. Chen X.-J. Li J. Y. Wu D.-Y. Tian Z.-Q. (2018). From plasmon-enhanced molecular spectroscopy to plasmon-mediated chemical reactions. Nat. Rev. Chem.2, 216–230. 10.1038/s41570-018-0031-9
Summary
Keywords
violacein, recycled-paper, municipal solid waste, SERS sensor, SERS probe, circular bioeconomy
Citation
Tropea A, Spadaro D, Giuffrida D, Trusso S, Giuffrida D, Salerno TMG, Montanez J, Morales-Oyervides L, Mondello L and Ponterio RC (2025) Exploring the application of the microbial pigment violacein as a sustainable probe molecule for recycled paper-based SERS substrates. Front. Chem. 13:1571986. doi: 10.3389/fchem.2025.1571986
Received
06 February 2025
Accepted
03 April 2025
Published
21 May 2025
Volume
13 - 2025
Edited by
Fabrizio Olivito, University of Calabria, Italy
Reviewed by
Lucio Litti, University of Padua, Italy
Sourav Pan, Indira Gandhi Centre for Atomic Research (IGCAR), India
Updates
Copyright
© 2025 Tropea, Spadaro, Giuffrida, Trusso, Giuffrida, Salerno, Montanez, Morales-Oyervides, Mondello and Ponterio.
This is an open-access article distributed under the terms of the Creative Commons Attribution License (CC BY). The use, distribution or reproduction in other forums is permitted, provided the original author(s) and the copyright owner(s) are credited and that the original publication in this journal is cited, in accordance with accepted academic practice. No use, distribution or reproduction is permitted which does not comply with these terms.
*Correspondence: Donatella Spadaro, donatella.spadaro@cnr.it; Dario Giuffrida, dario.giuffrida@cnr.it
Disclaimer
All claims expressed in this article are solely those of the authors and do not necessarily represent those of their affiliated organizations, or those of the publisher, the editors and the reviewers. Any product that may be evaluated in this article or claim that may be made by its manufacturer is not guaranteed or endorsed by the publisher.