 Mark Fletcher1
 Simon Tait1
 Jessica Steinlechner1,2*
 Iain W. Martin1
 Angus S. Bell1
 James Hough1Sheila Rowan1Roman Schnabel2
- 1Scottish Universities Physics Alliance, School of Physics and Astronomy, University of Glasgow, Glasgow, Scotland
- 2Institut für Laserphysik und Zentrum für Optische Quantentechnologien, Universität Hamburg, Hamburg, Germany
Future gravitational-wave detectors operated at cryogenic temperatures are expected to be limited by thermal noise of the highly reflective mirror coatings. Silicon nitride is an interesting material for such coatings as it shows very low mechanical loss, a property related to low thermal noise, which is known to further decrease under stress. Low optical absorption is also required to maintain the low mirror temperature. Here, we investigate the effect of stress on the optical properties at 1,550 nm of silicon nitride membranes attached to a silicon frame. Our approach includes the measurement of the thermal expansion coefficient and the thermal conductivity of the membranes. The membrane and frame temperatures are varied, and translated into a change in stress using finite element modeling. The resulting product of the optical absorption and thermo-optic coefficient (dn/dT) is measured using photothermal common-path interferometry.
1. Introduction
In the past 2 years, gravitational-wave (GW) signals from binary black-hole systems have been measured by the Advanced LIGO GW detectors (Abbott et al., 2016a,b, 2017). These detectors are large Michelson interferometers 4 km in length, which measure the change in the separation of suspended highly reflective coated mirrors (Harry and The LIGO Scientific Collaboration, 2010). In the most sensitive part of the detection band, between about 20 and 200 Hz, the detectors’ design sensitivity is limited by the thermal noise of the mirror coatings. In the future, coating thermal noise has to be reduced to significantly increase the detection rate of existing sources and to enable the detection of wider range of fainter sources.
Coating thermal noise power spectral density is proportional to temperature and coating mechanical loss, and inversely proportional to the beam radius squared. Future GW detectors, such as the European “Einstein Telescope” (Abernathy et al., 2011), which is aiming for a factor of ten increase in sensitivity compared to the Advanced LIGO design, will operate at low temperature and with a larger beam radius to reduce coating Brownian thermal noise. The mirror substrates in current GW detectors are made of fused silica (Abbott et al., 2016). As the mechanical loss of fused silica increases by several orders of magnitude when cooling it to low temperatures (Fine et al., 1954), it is planned to replace the substrate material in future detectors, with crystalline silicon (cSi) currently being the most promising candidate due to a very low mechanical loss at low temperatures (McGuigan et al., 1978; Nawrodt et al., 2008) and also other interesting properties such as zero crossings of the thermal expansion coefficient at 120 and 20 K, which results in low thermo-elastic noise (Winkler et al., 1991; Rowan et al., 2003). cSi is only transparent at wavelengths of about 1,450 nm and higher (Keevers and Green, 1995a). Due to the availability of high power lasers and optical components, the telecommunication wavelength of 1,550 nm is of particular interest for future GW detectors.
Highly reflective mirror coatings are made of alternating layers of a material with a low refractive index, and a material with a high refractive index. The mechanical loss, ϕ (coating thermal noise ), of the currently used coating materials SiO2 (refractive index n = 1.45 at 1,550 nm) and Ta2O5 (n = 2.05 at 1,550 nm) shows peaks at low temperatures around 20–30 K at which the maximum loss of an highly reflective coating is 2.5–5 times higher than at room temperature (Martin et al., 2009, 2014; Granata et al., 2013), and the resulting coating thermal noise would be significantly above the requirement of futures GW detectors. Alternative amorphous materials1 with low mechanical loss at low temperatures have to be found to reduce coating thermal noise.
Silicon nitride (Si3N4) deposited via low-pressure chemical vapor deposition (LPCVD) shows low mechanical loss, in the order of ϕ = 10−5 at cryogenic temperatures for a coating on a substrate (Liu et al., 2007) and <10−6 for highly stressed substrate-free thin films (Southworth et al., 2009). Therefore, Si3N4 may be a suitable alternative low-index material to SiO2 for use in highly reflective coatings. Investigations of SiNx, with x meaning different possible compositions of Si and N, deposited via plasma-enhanced chemical vapor deposition (PECVD) also show significant promise, with evidence of lower mechanical losses than current GW coating materials at room temperature and at low temperature down to 10 K and the interesting option to adjust material parameters such as the refractive index for varying compositions (Chao et al., 2016; Kuo et al., 2016).
Amorphous silicon (aSi) shows a very low mechanical loss of ϕSi <2 × 10⁻⁵ at temperature below ≈ 30 K (Murray et al., 2015). In addition, the very high refractive index (nSi = 3.5 at 1,550 nm) would reduce the numbers of layers required to achieve high reflectivity as the reflectivity per pair of high and low refractive layers increases with the contrast between the refractive indices. However, the optical absorption of aSi is too high for application in GW detectors at the envisioned wavelength of 1,550 nm (Steinlechner et al., 2014, 2016, 2017) and there has been research over the past years to reduce the absorption and to find ways to exploit the good mechanical properties while keeping the absorption low (Steinlechner et al., 2015; Yam et al., 2015; Steinlechner and Martin, 2016). An aSi/SiO2 multilayer coating would be dominated by the mechanical loss of the SiO2 layers, but Si3N4 would be a suitable low-index material with a similarly low mechanical loss as aSi.
From the observation of a mechanical loss, decrease of Si3N4 for more highly stressed films arises the question of the effect of stress on the optical properties. Here, we present measurements of the stress and temperature dependence of the product of optical absorption, α, and dn/dT, measured on low stress (≤250 MPa) amorphous Si3N4 membranes manufactured by Norcada.2 Such investigations are also of interest for other applications of Si3N4 such as photonic crystal mirrors (Moura et al., 2017).
The membranes were deposited via LPCVD which is the same deposition method studied in Liu et al. (2007). The stress, S, of the membranes was altered by heating either the membrane frame, which increases the membrane stress, or the membrane itself, which decreases the membrane stress, while α × dn/dT was measured. In a separate experiment, the change in stress with heating was calibrated via observation of a change in resonance frequency of the membrane. The challenge of the measurements is that α and dn/dT both depend on temperature and stress where the stress itself is a function of temperature, i.e., we vary the temperature T and measure α (T, S(T)) × dn/dT(T, S(T)). Disentangling the two quantities is subject to future work–for instance, via a separate (e.g., interferometric) measurement of dn/dT as a function of stress and temperature.
2. Characterization of the Membrane Stress
Figure 1A shows a photograph of one of the membrane samples studied. The membrane was fabricated by Norcada6 by depositing a 2-μm-thick Si3N4 film via LPCVD on a cSi substrate with dimensions 10 mm × 10 mm × 500 μm. Then a 5 mm × 5 mm area of the cSi was etched off, leaving a Si3N4 window in the center of a cSi frame.
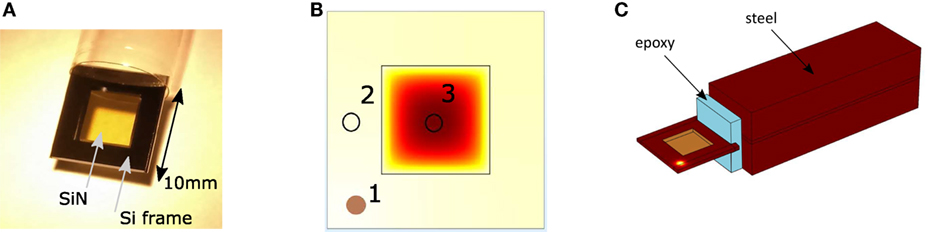
Figure 1. (A) Photo of a Si3N4 membrane fabricated by Norcada6: a cSi substrate was coated with Si3N4 using low-pressure chemical vapor deposition (LPCVD) and a 5 mm × 5 mm window was etched into the cSi substrate. (B) Schematic of the membrane: At position 1, 532 nm laser light was used to heat the cSi frame. At position 2, 1,550 nm laser light was used to heat the membrane. The temperatures listed in Table 1 were obtained at the positions marked with 2 and 3. (C) Geometry of the finite element model of the membrane (in this case heated at position 1) and its mounting. In the experiment, the membrane is glued to a screw with an epoxy without direct contact between the screw and the membrane. In the model, this is represented by the blue shape with thermal properties of an epoxy, while the rest of the mount is made of structural steel.
The resonance frequencies of the membrane can be described by
in which nx and ny are integer numbers to define the modes which have (nx − 1) and (ny − 1) nodes in the x and y directions, L is the length of the sides of a square membrane, S is the membrane stress, and ρ is the material density (Jabaraj and Jaadar, 2013).
This shows that the resonance frequencies of the membrane are proportional to the square root of the membrane stress S. (For the membranes of side length L = 5 mm, ρ = 3,100 kg/m3, and S ≤ 250 MPa1 used in this experiment, the resonance frequency of the first mode is f1,1 ≤40 kHz.)
2.1. Procedure of Changing the Stress of the Membrane
Two methods were used to alter the stress of the membrane: heating the cSi frame and heating the membrane itself. The difference in the thermal expansion coefficient of the Si3N4 membrane and the cSi frame is responsible for the change in stress with changing temperature. The temperature-dependent thermal expansion coefficient of cSi is well known and consistent within the literature and was used in our models (Okada and Tokumaru, 1984). The thermal expansion coefficient of amorphous silicon nitride shows a greater variety of values within the literature. As it strongly affects the modeled stress, the thermal expansion coefficient of the silicon nitride was obtained from the measured frequency shift when heating the sample.
For heating the frame, a laser beam at a wavelength of 532 nm was used. For a cSi substrate with refractive index nSi = 4.15 at 532 nm (Keevers and Green, 1995b), a 2-μm-thick Si3N4 layer with refractive index nSiN = 2.05 at 532 nm (Luke et al., 2015) is a good anti-reflection coating with a reflectivity of about 4% at normal incidence. Therefore, 96% of the laser power is transmitted into the substrate. Due to the very short absorption depth of cSi at 532 nm of 1.3 μm (Keevers and Green, 1995b), all laser power transmitted through the silicon nitride layer is absorbed in the membrane frame and converted into heat.
2.2. Temperatures of the Membrane and Frame
The temperature of the membrane and frame was measured (under atmospheric pressure) as a function of 532 nm light power using a thermal camera.3 This gave temperatures corresponding to the absorption measurements carried out while heating the frame with the 532 nm laser. The membrane was mounted by gluing it with an epoxy to a stainless steel screw. The measured temperatures can be found in Table 1.
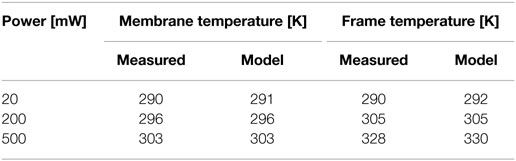
Table 1. Modeled temperatures for a thermal conductivity of 8.0 W/mK and measured temperatures of the membrane and the frame at atmospheric pressure when heating the frame with the 532 nm laser.
To enable relating the laser heating to the measured temperatures, a COMSOL4 finite element model of the membrane and its mount was built (model 1, see Figure 2). Figure 1C shows a picture of the model, in which the membrane is contacted to a simplified layer of epoxy that is contacted to a large piece of structural steel. A time-dependent study within a heat transfer in solids interface was used to determine the temperatures of the frame and membrane at different laser powers and times. The 532 nm laser used to heat the frame was modeled as a Gaussian heat distribution. Emissivity values for the different materials were included to account for radiative cooling.
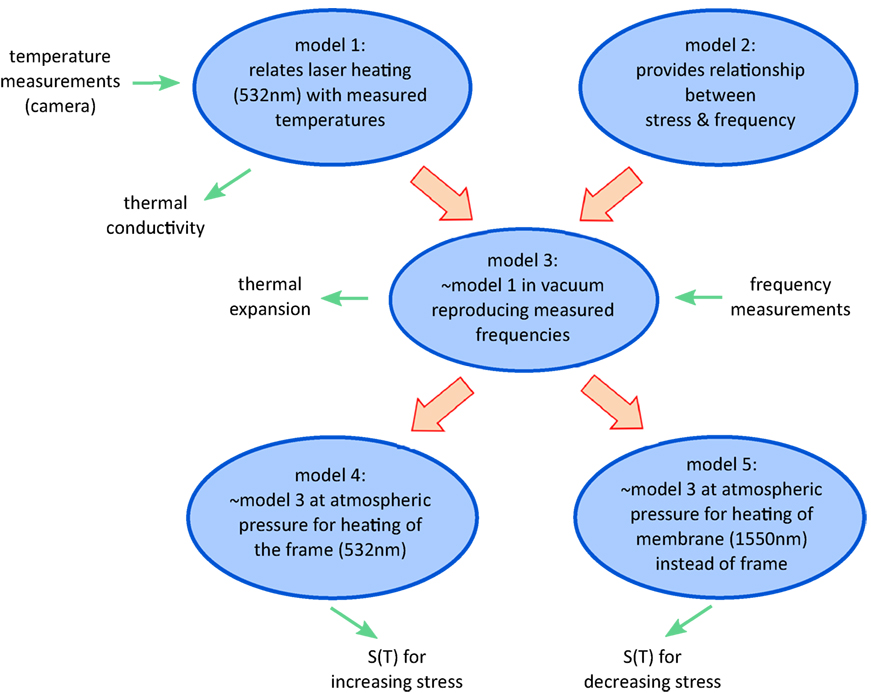
Figure 2. Schematic of the different models2 used, of their relationship, and the results: Model 1 (at atmospheric pressure) relates heating the membrane frame with the 532 nm laser to the temperatures of membrane and frame by fitting the thermal conductivity of the membrane. Model 2 is a purely theoretical model providing the relationship of resonance frequency and stress. Model 3 (in vacuum) combines models 1 and 2 to match the frequencies observed for heating the membrane frame by fitting the thermal expansion coefficient of the membrane. Model 3 under atmospheric pressure and for heating the membrane frame provides a stress increase as a function of temperature (model 4) and a stress decrease as a function of temperature (model 5) for heating the membrane directly.
Temperature-dependent heat transfer coefficients were also defined within the model to capture the loss of heat due to convection. To determine our heat transfer coefficients, the frame and membrane were approximated as being a uniform flat plate while the screw and mount were approximated as being a cylinder. Using the Natural Convection Heat Transfer from a Vertical Plate Microsoft Excel sheet,5 the heat transfer coefficients of the approximated flat plate were determined. The heat transfer coefficients of the vertical mount were calculated using (Bejan and Kraus, 2003). To facilitate meshing the various geometries in the model, a square cross-sectional clamp was used, instead of the cylindrical mount used in the experiment, to calculate the temperature dependent heat transfer coefficients of the epoxy and mount. However, the effect of both geometries is the same as they have a similar cross-sectional area and primarily act as a heat sink, with the cooling of the sample limited by conduction through the epoxy, which has a lower thermal conductivity than steel, between the sample and the mount.
While the modeled temperature of the frame agreed well with that measured experimentally, the modeled temperature of the membrane did not initially show agreement. It was possible to match the measured membrane temperatures by varying the thermal conductivity, which is size dependent for thin films (Liang and Li, 2006), of the membrane within the range of values found in the literature between (4.9 ± 0.7) W/(m K) (Jain and Goodson, 2008) and 15 W/(m K) (kyocera.com, 2017), whereas a thermal conductivity of (8.0 ± 0.1) W/mK gave the best agreement (see Figure 3).
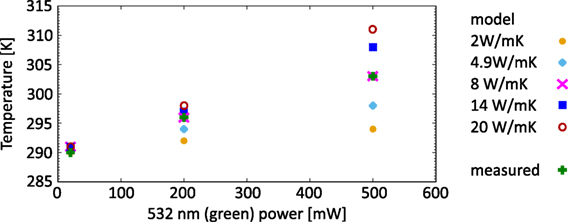
Figure 3. Temperature of the membrane as a function of continuous heating power with the 532 nm laser for the same duration as in the experiments. The temperature was obtained from the finite element model for different thermal conductivities of silicon nitride compared to the temperature measured with the thermal camera (green pluses).
The specified absolute error of the thermal-camera measurements of ±2°C does not affect the results from our models as we are measuring a change in temperature, while the relative error of ±0.08°C of the thermal-camera measurements while heating the membrane is negligible. The same is true for the power measurements. Therefore, the error of the thermal conductivity is defined by the agreement of the fit and the measurements, which has a maximum error of ±1% (which is too small to be visible in Figure 3).
The heat capacity affects the time constant after which the system reaches a steady state, but not the final temperature. In our models, for the heat capacity C = 700 J/kg K was used. This value was varied between C = 200 J/kg K and C = 2,500 J/kg K. As our measurements were all performed at or close to a steady-state temperature, a change in heat capacity within this range affects our results for the temperature by less than 1%.
2.3. Calibration of Thermal Stress Effect via Measurement of Resonance Frequencies
When the temperatures of the membrane and the membrane frame change, the dimensions change resulting in a stress change. This stress change produces a measurable change in the resonance frequencies of the membrane. This effect can be used to fit the thermal expansion coefficient of the membrane to match the measured resonance frequencies.
To allow measurements of the resonance frequencies, the membrane was clamped with one edge of the frame between two aluminum blocks. The resonances of the membrane were excited with a piezo attached to the clamp. The vibration of the membrane was read out via a laser beam reflected from the membrane onto a split photo diode that is sensitive to small motions of the beam. A schematic of the setup used is shown in Figure 4.
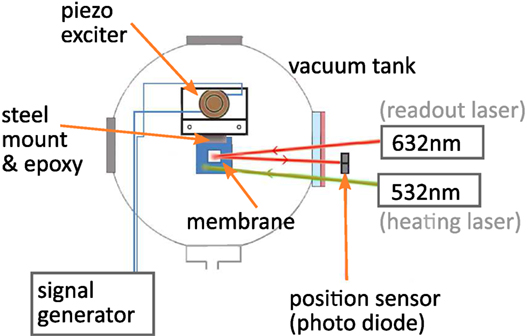
Figure 4. Schematic of the experimental setup used to measure the frequency shift caused by laser heating of the membrane frame with the 532 nm laser.
The first resonance frequency of the membrane is at approximately 32 kHz. The shift of this resonance frequency was measured as a function of the 532 nm laser power used to heat the frame and as a function of pressure at each laser power. The pressure was measured using an Inverted Magnetron vacuum gage. Figure 5A shows the relative frequency shift normalized to the 532 nm laser power for pressures between 10−5 mbar and 1 mbar. For higher pressures, the membrane modes were damped too much for a clear frequency shift to be observed. In general, the resonance frequency increased linearly with heating power (i.e., produced a constant percentage of frequency shift per heating power in Figure 5A), suggesting a uniform relationship of versus heating. Figure 5B shows the modeled relationship between the frequency of the resonance mode at about 32 kHz and the membrane stress.
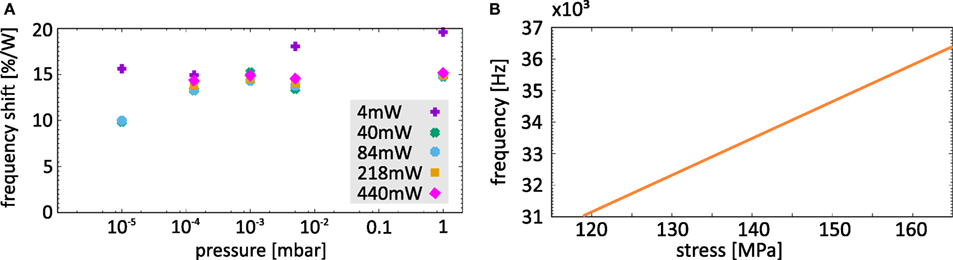
Figure 5. (A) Normalized frequency shift of the 32 kHz mode measured at varied pressure. The frequency shift was measured for several different frame heating powers (532 nm) and normalized to the power. (B) The relationship between the frequency of the first resonance mode of the membrane and the stress of the membrane simulated with model 2. This is a purely modeled relationship and not a measured dependence.
The measured frequency changes due to heating for pressures below 1 mbar were used to determine, via a finite element model4, the resulting change in the stress of the membrane. To simulate the clamp, one side of the frame and membrane were fixed in space within the model. The stress applied to the membrane in the model was varied until the modeled mode frequencies matched the observed frequencies for each laser-heating step (model 2, see Figure 2).
A finite element model (model 3 in Figure 2) was used to analyze these results. A thermal stress interface which coupled a heat transfer in solids interface with a solid mechanics interface was used in COMSOL to model the membrane and frame joined to a structural steel mount by a layer of epoxy. The heating due to the 532 nm laser beam incident on the frame was modeled as before. The laser power in the model was changed at appropriate time-intervals to simulate the heating increments used in the measurements, and the shift in the fundamental mode frequency of the membrane was calculated for each laser power. To allow comparison with the experimental frequency shifts, measured under vacuum, convection losses were set to zero within the model.
The results from the model were compared to the frequency changes observed experimentally. The thermal expansion coefficient of the membrane was then altered iteratively to find the value which best matched the change in frequency observed experimentally. The best value of the expansion coefficient was found to be (2.4 ± 0.3) × 10−6/K. This values falls within the literature values for the coefficient of thermal expansion of silicon nitride (azom.com, 2017).
As the frequency measurement itself is very accurate with an error of <1%, the dominating error in stress results from the spread in frequencies shown in Figure 5A, which then causes an error of (± 0.2 × 10⁻⁶)/K in the coefficient of thermal expansion. Errors in the Young’s modulus and Poisson ratio also couple into the simulation. The Young’s modulus of 270 GPa is provided by the manufacturer.6 An error of 10% on this value was assumed for the simulations. For the Poisson ratio, the literature values vary around 0.25, which was used for the simulations, also with an error of 10%. This results in a total error of (± 0.3 × 10⁻⁶)/K in the coefficient of thermal expansion.
3. Measurement of Optical Properties
The values obtained for the thermal conductivity and the thermal expansion coefficient were now used in the finite element model to simulate the stress of the membrane under heating and, thus, to analyze the effect of stress and temperature on α × dn/dT at 1,550 nm.
3.1. Absorption × Thermo-Optic Coefficient As a Function of Temperature
Photothermal common-path interferometry (PCI) was used (Alexandrovski et al., 2009) to measure the absorption of the membranes. This technique uses a strong pump laser beam at 1,550 nm with a small waist to create a thermally induced optical length change proportional to dn/dT in the membrane due to optical absorption (the optical length change due to thermal expansion is negligible compared to the change due to dn/dT). The pump beam is crossed by a much weaker probe beam at 1,620 nm with a larger diameter. A portion of the probe beam overlaps the pump and gets affected by the optical length change. This results in a phase shift for this part of the probe beam. The phase-shifted and non-phase-shifted portions of the probe beam interfere. The interference maximum occurs at a distance of one Rayleigh range (for the probe beam) from the crossing point of the beams. The interferometric phase change measured at this point is directly proportional to the absorption of the material and is calibrated using a fused silica substrate with known absorption. Based on the thermal diffusivity of the two materials, an additional scaling factor of 0.865 is used to scale the amplitude signal from silicon nitride to the signal from the fused silica calibration substrate (Alexandrovski et al., 2009). For the calculation of this scaling factor, material properties measured on membranes in the experiments presented here were used when possible. PCI has the advantage that it measures only the absorption while, e.g., cavity round-trip loss measurements include surface scattering, which makes the result less accurate. More details about the measurements, including some special considerations for the thin membranes, in which etalon effects can occur, are explained in Steinlechner et al. (2017).
In a first measurement series, we varied the power of the 1,550 nm pump beam that was incident on the membrane at the position marked with 3 in Figure 1B. A minimum laser power of about 200 mW was required to create a thermal effect large enough to measure. At this pump power, the absorption was found to be 337 ppm assuming that dn/dT = (4 × 10⁻⁵)/K. The laser power was increased stepwise. As the 1,550 nm laser power was increased, we waited for the absorption signal to settle, which indicated that the system had reached a steady state. The absorption signal was observed to increase with increasing laser power. It is not known how dn/dT of the membranes changes with stress and temperature. Therefore, we can only measure a change of the product α × dn/dT. The measured change in α × dn/dT compared to the start value of 337 ppm at 200 mW as a function of 1,550 nm laser power is shown in Figure 6A.
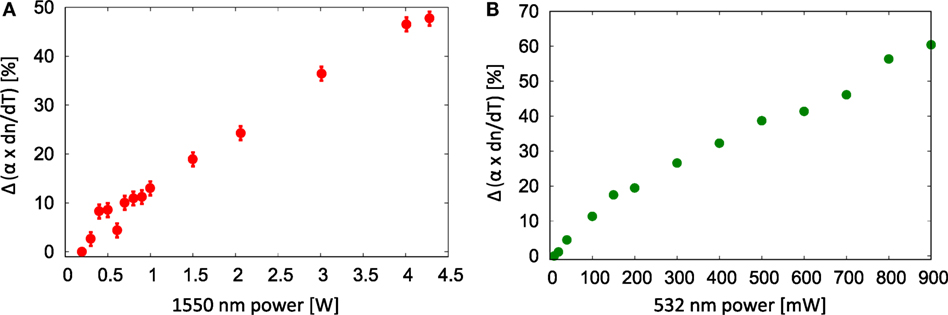
Figure 6. (A) Change in α × dn/dT measured with varied 1,550 nm (pump) beam power between 200 mW and 4.3 W. The 1,550 nm beam is 35 μm in diameter and hit the membrane at position 3 marked in Figure 1B. (B) Change in α × dn/dT measured with varied 532 nm laser power heating the frame at position 1 marked in Figure 1B. The 532 nm beam is about 1 mm in diameter.
The absorption signal is proportional to the 1,550 nm laser power and, therefore, errors in power measurement couple into the absorption measurements. The relative error of the power measurements is negligible as in this experiment the laser power was continuously measured while being increased, without realigning the positions of beam or power meter. Any systematic error in the power measurements cancels out by looking at a relative change in absorption. Errors in the material parameters relevant to calibrate the absorption also cancel out when looking at relative changes. Only inaccuracies due to misalignment occurring during the measurement series are relevant for the measurement error. To estimate this error, the absorption of the substrate used for calibration was measured again after the membrane measurement series. The measured absorption of the calibration substrate had changed from 21.4 to 20.8% resulting in an error bar of ±1.4% for the measurements for all measurements relative to the first measurement.
In a second measurement series, the 1,550 nm laser power was kept constant, while the cSi frame was heated with a 532 nm laser beam approximately 1.5 mm in diameter at the position marked with 1 in Figure 1B. In this measurement series, the start value for the absorption was 275 ppm. The lower absolute absorption for the same 1,550 nm power compared to the previous measurement series (337 ppm) can be explained by a slight variation from membrane to membrane and also due to alignment variations. Figure 6A shows the absorption change as a function of laser power.
As discussed for the measurements with varied 1,550 nm power, errors affecting all the absorption results such as power measurements cancel out and are, therefore, not relevant here. The difference in absorption between different membranes is also not relevant for observations of a relative change. For this measurement series, no decrease of the signal due to a change in alignment was observed and a negligible error is assumed.
3.2. Absorption × Thermo-Optic Coefficient As a Function of Stress and Temperature
A finite element model was used to calculate the temperature changes ΔT, and the resulting stress changes, ΔS, at atmospheric pressure induced by (i) heating the membrane and (ii) heating the frame. This model was developed using the membrane and frame temperatures measured with the thermal camera, and used a time-dependent study within a thermal stress interface in COMSOL. ΔT and ΔS were calculated separately for heating the membrane with the 1,550 nm laser (position 3) and heating the membrane frame with the 532 nm laser (position 1) with the powers used for the measurements of α × dn/dT. The resulting ΔS as a function of ΔT is shown in Figure 7. In the case of heating, the center of the membrane (position 3) with the 1,550 nm beam, the membrane becomes warmer than the frame. In this case, the membrane expands more than the frame, resulting in a stress reduction in the center of the membrane (at the position of the absorption measurement) compared to the non-heated case and ΔS becomes negative. In the case of heating the frame (position 1), the frame becomes warmer than the membrane (in addition to the thermal expansion coefficient of SiN being smaller than the thermal expansion coefficient of Si) resulting in a stress increase in the center of the membrane.
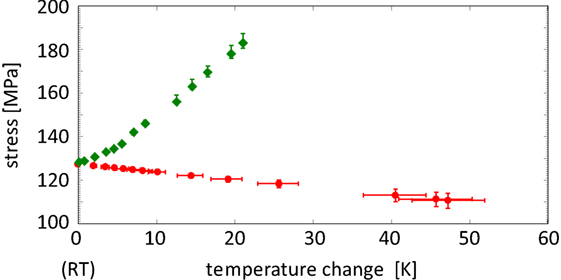
Figure 7. Change in stress as a function of membrane temperature change ΔT (at position 3) starting from room temperature (RT): the green diamonds show the resulting stress when heating the frame with the 532 nm laser. The red circles show the stress for heating the center of the membrane with the 1,550 nm beam.
In the case of heating, the membrane with the 1,550 nm laser at position 3, the heating power is proportional to the membrane absorption and so an absorption value had to be assumed for the calculation of the membrane temperatures. To estimate the absorption as a function of 1,550 nm laser power, the temperature of the membrane near position 3 was measured with the thermal camera. The relationship of 1,550 nm laser power and the membrane temperature is approximately linear as shown in Figure 8 and, therefore, a constant absorption was assumed for the model calculating membrane temperature. (Note that in addition to the temperature increase in these measurements the stress of the membrane changed so that we can not draw any conclusions for the behavior α × dn/dT as a function of temperature.)
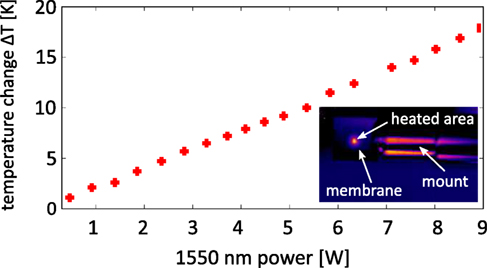
Figure 8. Temperature increase near position 3 on the membrane measured with the thermal camera as a function of 1,550 nm power indicating an approximately linear relationship and consequently a constant absorption. The smaller image in the right bottom corner of the graph shows a picture taken with the thermal camera.
Figure 7 shows the change in stress as a function of temperature when heating the frame with the 532 nm laser (green diamonds) and for heating the membrane in the center with the 1,550 nm beam (red circles). The total change in stress of 78.9 MPa around the (non-heated case) of 128.25 MPa corresponds to a change in stress of 62%.
The error bars on the stress for heating with the 532 nm laser result from the error in the thermal expansion coefficient. The error bars on the stress for heating with the 1,550 nm laser result from both the error in the thermal expansion coefficient and an error of 15% in the absorbed laser power used to calculate the temperature. Stepwise change of parameters, based on data measured and from the literature, caused the error bars of the calculated stress to be asymmetric.
α × dn/dT measured as a function of laser power (see Figures 6A,B) and the corresponding calculated temperatures can be translated into a change in α × dn/dT versus membrane temperature and a change in α × dn/dT versus membrane stress using the information shown in Figure 7. This is shown in Figures 9A,B. In these two graphs, the effects of stress and temperature contribute to the measured α × dn/dT. The difference between these two cases is the magnitude of the stress in the membrane (as shown in Figure 7). Further analysis was carried out to allow the contributions of stress and temperature to be separated.
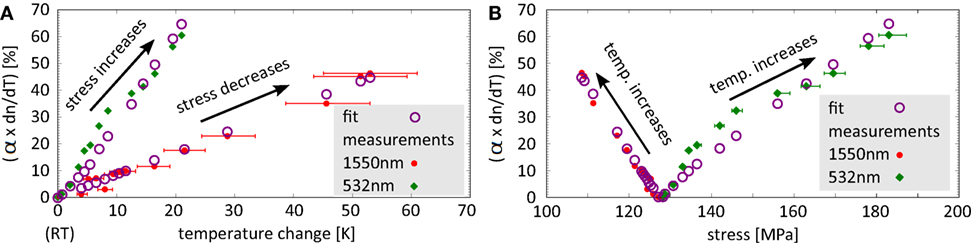
Figure 9. Change in α × dn/dT of the membrane. (A) shows α × dn/dT as a function of the membrane temperature. (B) shows α × dn/dT as a function of stress where the stress is also a function of temperature. Green diamonds show the case for heating the frame with the 532 nm laser, and red crosses show the case for heating the membrane in the center with the 1,550-nm laser. Blue circles show the fitted α × dn/dT such as described in the text.
Figure 9A shows that α × dn/dT increases with increasing temperature. For heating the frame with the 532 nm laser (green diamonds), the absorption increase is larger than for heating the membrane directly to a similar temperature with the 1,550 nm laser (red dots).
Figure 9B shows the same data plotted against the calculated stress in the membrane. This shows that the larger increase in α × dn/dT with temperature (for the case of heating the frame) shown in Figure 9A is associated with an increase in membrane stress, while the smaller increase in α × dn/dT with temperature (in the case of heating the membrane) is associated with a decrease in stress. The increase in α × dn/dT for a stress reduction is slightly steeper than for the stress increase, but this is due to different temperatures being required to cause a similar change in stress depending on whether the frame or the membrane is heated.
From the relations shown in Figures 9A,B, we can conclude that α × dn/dT increases with increasing temperature (both graphs in Figure 9A) and that an increase in stress additionally increases α × dn/dT (green diamonds), while a stress decrease reduces α × dn/dT. When heating the frame, both the temperature and the stress of the membrane increase and the two effects combine positively to give a larger increase in α × dn/dT. When heating the membrane, the membrane temperature increases but the stress decreases, resulting in the two effects partially compensating to give a smaller increase in α × dn/dT for the same membrane temperature.
Based on these conclusions, we have used an equation of the form
in which both α and dn/dT are functions of T and S, to fit the measurements shown in Figures 9A,B. A condition of performing a least squares fit with two variables is that no perfect linear relationship exists between them (i.e., no perfect multi-collinearity). We meet this condition for a fit of α × dn/dT against T and S because as T changes, S changes by different amounts due to the model using temperature-dependent material properties, which ensures a non-perfect linear relationship between T and S. a = (1.11 ± 0.08)%/K and b = (0.76 ± 0.08)%/MPa result in the blue circles reproducing the measurements with R2 = 0.96 and allow us to decouple the stress effect from the temperature effect.
In the Figures 10A,B, the separated temperature and stress effects are shown with the following relations
and
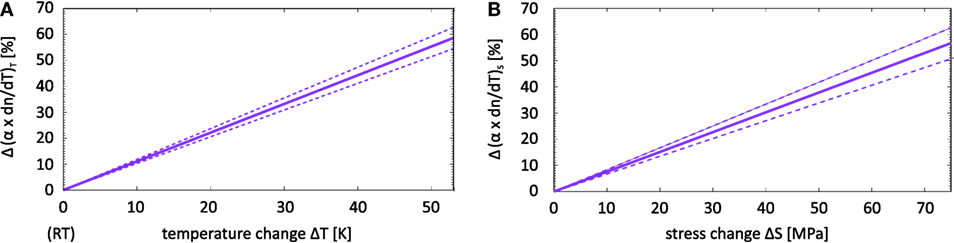
Figure 10. Separated dependence of Δ(α × dn/dT) on temperature and on stress. (A) shows the temperature dependence of the change in α × dn/dT for a temperature range of 290–333 K. (B) shows the change in α × dn/dT versus stress for a stress range of 110.6–189.5 MPa. The dashed lines show the error bars as given by equations (3) and (4).
This is a significant effect of the membrane stress on α × dn/dT. The effect on α only could be separately determined by measurement of (dn/dT)S.
4. Conclusion
We have measured the change in α × dn/dT of a silicon nitride membrane for increasing and decreasing stress by either heating the cSi frame or the membrane itself with a laser.
The temperature of the heated membrane at atmospheric pressure was measured with a thermal camera and a finite element model was created, and used to fit a value of the SiN thermal conductivity to the experimentally observed temperature change. This gave a value of (8 ± 0.1) W/mK for the thermal conductivity of SiN. The change in resonance frequency in vacuum when heating the cSi frame was measured. Based on the finite element temperature model, this delivered a thermal expansion coefficient of the silicon nitride membrane of (2.4 ± 0.3) × 10−6 K−1.
The model, including the results for the thermal conductivity and the thermal expansion coefficient, was used to convert the measured change in absorption versus laser power into a temperature and a stress change. The resulting stress dependence was found to be Δ(α × dn/dT)T = (1.11 ± 0.08)%/K × ΔT for 290 K ≤ T ≤ 333 K and the temperature dependence was found to be Δ(α × dn/dT)S = (0.76 ± 0.08)%/MPa × ΔS for 110.6 MPa ≤ T ≤ 189.5 MPa. In both cases, it cannot be determined whether the absorption, the dn/dT value, or both, are changing. Further study of this effect is of interest and may be investigated in a separate experiment.
Stress has a significant effect on α × dn/dT, with increasing stress increasing this product. Depending on the behavior of dn/dT with temperature, it seems likely that there is some increase of absorption with stress. Both of these properties are of interest for thermal noise in optical coatings for future gravitational-wave detectors, as the absorption must be minimized to prevent heating of a cryogenic mirror and the magnitude of thermo-optic noise in the mirror depends on dn/dT. The mechanical loss in silicon nitride is also stress dependent, affecting the Brownian thermal noise. Therefore, the stress in silicon nitride must be chosen carefully to ensure a coating has optimal optical and thermal noise properties.
Author Contributions
MF carried out finite element modeling of resonance frequencies and of the stress and temperature distributions in the samples and contributed to the preparation of the manuscript. ST measured resonance frequencies as a function of pressure and temperature and contributed to finite element modeling of the membrane temperature. JS developed the concept of the experiment, carried out measurements of optical absorption, and prepared the manuscript. IWM developed the concept of the experiment, assisted with measurements of resonance frequencies, carried out analysis of absorption data, and edited the manuscript. AB carried out measurements to allow estimation of heating effects in membranes and contributed to analysis of results. JH supported the experimental work and contributed to the preparation of the manuscript. SR supported the experimental work and contributed to the preparation of the manuscript. RS assisted in planning the experiment, supported experimental work, and contributed to the preparation of the manuscript.
Conflict of Interest Statement
The authors declare that the research was conducted in the absence of any commercial or financial relationships that could be construed as a potential conflict of interest.
Acknowledgments
We are grateful for support from the International Max Planck Patnership. We would like to thank our colleagues from the LIGO Scientific Collaboration (LSC) for their interest in this work. This paper has LIGO Document number LIGO–P1700096.
Funding
This research has been supported by the ERC project “MassQ” (grant agreement number 339897). We are grateful for financial support from the Royal Society (RG110331), STFC (ST/N005422/1) and the University of Glasgow. IWM is supported by a Royal Society Research Fellowship.
Footnotes
- ^Crystalline coatings are an option being discussed in the past years for application in GW detectors. Possible materials are GaAs/AlGaAs (Cole et al., 2013) and GaP/AlGaP (Lin et al., 2013; Cumming et al., 2015; Murray et al., 2017). Crystalline coatings have to be grown on substrates with matching lattice parameters. While GaP/AlGaP can be grown on cSi and, therefore, in theory, is available in the sizes of the GW mirror substrates, GaAs/AlGaAs coatings have to be grown on GaAs, which is currently not available in a size of about 0.5 m which is required for future GW detectors. However, an initial GaP/AlGaP coating has shown an absorption of 2.3% and requires further development. While both material combinations are an interesting alternative to amorphous coatings showing significantly lower thermal noise, in particular at low temperatures, there is still major development required to make them suitable for GW detectors and alternative amorphous coating materials still seem to be a promising approach.
- ^http://www.norcada.com/.
- ^FLIR THERMOVISION A40.
- ^http://www.comsol.com.
- ^http://www.brighthubengineering.com.
- ^http://www.norcada.com/.
References
Abbott, B. P., Abbott, R., Abbott, T. D., Abernathy, M. R., Acernese, F., Ackley, K., et al. (2016). Gw150914: the advanced ligo detectors in the era of first discoveries. Phys. Rev. Lett. 116, 131103. doi: 10.1103/PhysRevLett.116.131103
Abbott, B. P., Abbott, R., Abbott, T. D., Abernathy, M. R., Acernese, F., Ackley, K., et al. (2016a). Observation of gravitational waves from a binary black hole merger. Phys. Rev. Lett. 116, 061102. doi:10.1103/PhysRevLett.116.061102
Abbott, B. P., Abbott, R., Abbott, T. D., Abernathy, M. R., Acernese, F., Ackley, K., et al. (2016b). Gw151226: observation of gravitational waves from a 22-solar-mass binary black hole coalescence. Phys. Rev. Lett. 116, 241103. doi:10.1103/PhysRevLett.116.241103
Abbott, B. P., Abbott, R., Abbott, T. D., Acernese, F., Ackley, K., Adams, C., et al. (2017). Gw170104: observation of a 50-solar-mass binary black hole coalescence at redshift 0.2. Phys. Rev. Lett. 118, 221101. doi:10.1103/PhysRevLett.118.221101
Abernathy, M., et al. (2011). Einstein Gravitational Wave Telescope (ET) Conceptual Design Study. Available at: https://tds.ego-gw.it/ql/?c=7954
Alexandrovski, A., Fejer, M., Markosian, A., and Route, R. (2009). Photothermal common-path interferometry (PCI): new developments. Proc. SPIE 7193, 71930D–71930D–13. doi:10.1117/12.814813
azom.com. (2017). Available at: http://www.azom.com/properties.aspx?articleid=53
Chao, S., Pan, H., Kuo, L., Huang, S., Wu, M., Juang, Y., et al. (2016). “Silicon-nitride films deposited by PECVD method on silicon substrate for next generation laser interference gravitational wave detector,” in Optical Interference Coatings 2016, OSA Technical Digest (Online) (Tucson, AZ: Optical Society of America).
Cole, G. D., Zhang, W., Martin, M. J., Ye, J., and Aspelmeyer, M. (2013). Tenfold reduction of brownian noise in high-597 reflectivity optical coatings. Nat. Photonics 7, 644–650. doi:10.1038/nphoton.2013.174
Cumming, A. V., Craig, K., Martin, I. W., Bassiri, R., Cunningham, L., Fejer, M. M., et al. (2015). Measurement of the mechanical loss of prototype gap/algap crystalline coatings for future gravitational wave detectors. Classical Quantum Gravity 32:035002. doi:10.1088/0264-9381/32/3/035002
Fine, M. E., Duyne, H. V., and Kenney, N. T. (1954). Low-temperature internal friction and elasticity effects in vitreous silica. J. Appl. Phys. 25, 402–405. doi:10.1063/1.1721649
Granata, M., Craig, K., Cagnoli, G., Carcy, C., Cunningham, W., Degallaix, J., et al. (2013). Cryogenic measurements of mechanical loss of high-reflectivity coating and estimation of thermal noise. Opt. Lett. 38, 5268–5271. doi:10.1364/OL.38.005268
Harry, G. M., and The LIGO Scientific Collaboration. (2010). Advanced LIGO: the next generation of gravitational wave detectors. Classical Quantum Gravity 27, 084006. doi:10.1088/0264-9381/27/8/084006
Jabaraj, D. J., and Jaadar, M. S. (2013). Theoretical calculation of resonant frequencies of the human alveolar wall and its implications in ultrasound induced lung hemorrage. Int. J. Biosci. Biochem. Bioinform. 3, 5–9. doi:10.7763/IJBBB.2013.V3.153
Jain, A., and Goodson, K. E. (2008). Measurement of the thermal conductivity and heat capacity of free-standing shape memory thin films using the 3w method. ASME J. Heat Transfer. 130:102402. doi:10.1115/1.2945904
Keevers, M. J., and Green, M. A. (1995a). Absorption edge of silicon from solar cell spectral response measurements. Appl. Phys. Lett. 66, 174–176. doi:10.1063/1.113125
Keevers, M. J., and Green, M. A. (1995b). Optical properties of intrinsic silicon at 300 K. Prog. Photovolt. 3, 189–192.
Kuo, L., Pan, H., Lin, C., and Chao, S. (2016). “Cryogenic losses for titania, silica, silicon nitride films and silicon substrates,” in LIGO Technical Document LIGO-G1601703.
kyocera.com. (2017). Available at: http://global.kyocera.com/prdct/fc/list/material/silicon_nitride/silicon_nitride.html
Liang, L. H., and Li, B. (2006). Size-dependent thermal conductivity of nanoscale semiconducting systems. Phys. Rev. B 73, 153303. doi:10.1103/PhysRevB.73.153303
Lin, A., Bassiri, R., Craig, K., Cumming, A., Fejer, M., Harris, J., et al. (2013). “Epitaxial integration of monocrystalline iii-v coatings on silicon for thermal noise reduction,” in Optical Interference Coatings, OSA Technical Digest, eds M. Tilsch, and D. Ristau (Whistler: Optical Society of America).
Liu, X., Metcalf, T. H., Wang, Q., and Photiadis, D. M. (2007). Elastic Properties of Several Silicon Nitride Films. Warrendale, PA: Materials Research Society.
Luke, K., Okawachi, Y., Lamont, M. R. E., Gaeta, A. L., and Lipson, M. (2015). Broadband mid-infrared frequency comb generation in a Si3N4 microresonator. Opt. Lett. 40, 4823–4826. doi:10.1364/OL.40.004823
Martin, I. W., Chalkley, E., Nawrodt, R., Armandula, H., Bassiri, R., Comtet, C., et al. (2009). Comparison of the temperature dependence of the mechanical dissipation in thin films of Ta2O5 and Ta2O5 doped with TiO2. Classical Quantum Gravity 26, 155012. doi:10.1088/0264-9381/26/15/155012
Martin, I. W., Nawrodt, R., Craig, K., Schwarz, C., Bassiri, R., Harry, G., et al. (2014). Low temperature mechanical dissipation of an ion-beam sputtered silica film. Classical Quantum Gravity 31, 035019. doi:10.1088/0264-9381/31/3/035019
McGuigan, D. F., Lam, C. C., Gram, R. Q., Hoffman, A. W., Douglass, D. H., and Gutche, H. W. (1978). Measurements of the mechanical q of single-crystal silicon at low temperatures. J. Low Temp. Phys. 30, 621–629. doi:10.1007/BF00116202
Moura, J. P., Norte, R. A., Guo, J., Schäfermeier, C., and Gröblacher, S. (2017). Centimeter-Scale Suspended Photonic Crystal Mirrors. arXiv:1707.08128 [physics.optics].
Murray, P. G., Martin, I. W., Craig, K., Hough, J., Robie, R., Rowan, S., et al. (2015). Ion-beam sputtered amorphous silicon films for cryogenic precision measurement systems. Phys. Rev. D 92, 062001. doi:10.1103/PhysRevD.92.062001
Murray, P. G., Martin, I. W., Craig, K., Hough, J., Rowan, S., Bassiri, R., et al. (2017). Cryogenic mechanical loss of a single-crystalline gap coating layer for precision measurement applications. Phys. Rev. D 95, 042004. doi:10.1103/PhysRevD.95.042004
Nawrodt, R., Zimmer, A., Koettig, T., Schwarz, C., Heinert, D., Hudl, M., et al. (2008). High mechanical q-factor measurements on silicon bulk samples. J. Phys. Conf. Ser. 122, 012008. doi:10.1088/1742-6596/122/1/012008
Okada, Y., and Tokumaru, Y. (1984). Precise determination of lattice parameter and thermal expansion coefficient of silicon between 300 and 1500 K. J. Appl. Phys. 56, 314–320. doi:10.1063/1.333965
Rowan, S., Byer, R. L., Fejer, M. M., Route, R. K., Cagnoli, G., Crooks, D. R. M., et al. (2003). “Test mass materials for a new generation of gravitational wave detectors,” in Proceedings Volume 4856, Gravitational-Wave Detection (Waikoloa, HI).
Southworth, D. R., Barton, R. A., Verbridge, S. S., Ilic, B., Fefferman, A. D., Craighead, H. G., et al. (2009). Stress and silicon nitride: a crack in the universal dissipation of glasses. Phys. Rev. Lett. 102, 225503. doi:10.1103/PhysRevLett.102.225503
Steinlechner, J., Khalaidovski, A., and Schnabel, R. (2014). Optical absorption measurement at 1550 nm on a highly-reflective Si/SiO2 coating stack. Classical Quantum Gravity 31, 105005. doi:10.1088/0264-9381/31/10/105005
Steinlechner, J., Krüger, C., Martin, I. W., Bell, A., Hough, J., Kaufer, H., et al. (2017). Optical absorption of silicon nitride membranes at 1064 nm and at 1550 nm. Phys. Rev. D 96, 022007. doi:10.1103/PhysRevD.96.022007
Steinlechner, J., and Martin, I. W. (2016). High index top layer for multimaterial coatings. Phys. Rev. D 93, 102001. doi:10.1103/PhysRevD.93.102001
Steinlechner, J., Martin, I. W., Bassiri, R., Bell, A., Fejer, M. M., Hough, J., et al. (2016). Optical absorption of ion-beam sputtered amorphous silicon coatings. Phys. Rev. D 93, 062005. doi:10.1103/PhysRevD.93.062005
Steinlechner, J., Martin, I. W., Hough, J., Krüger, C., Rowan, S., and Schnabel, R. (2015). Thermal noise reduction and absorption optimization via multimaterial coatings. Phys. Rev. D 91, 042001. doi:10.1103/PhysRevD.91.042001
Winkler, W., Danzmann, K., Rüdiger, A., and Schilling, R. (1991). Heating by optical absorption and the performance of interferometric gravitational-wave detectors. Phys. Rev. A 44, 7022–7036. doi:10.1103/PhysRevA.44.7022
Keywords: gravitational-wave detectors, coatings, silicon nitride, stress, optical absorption
Citation: Fletcher M, Tait S, Steinlechner J, Martin IW, Bell AS, Hough J, Rowan S and Schnabel R (2018) Effect of Stress and Temperature on the Optical Properties of Silicon Nitride Membranes at 1,550 nm. Front. Mater. 5:1. doi: 10.3389/fmats.2018.00001
Received: 31 August 2017; Accepted: 03 January 2018;
Published: 31 January 2018
Edited by:
Daniel Schick, Helmholtz-Zentrum Berlin (HZ), GermanyReviewed by:
Venugopal Rao Soma, University of Hyderabad, IndiaRaul J. Martin-Palma, Universidad Autonoma de Madrid, Spain
Clemens Schäfermeier, Delft University of Technology, Netherlands
Copyright: © 2018 Fletcher, Tait, Steinlechner, Martin, Bell, Hough, Rowan and Schnabel. This is an open-access article distributed under the terms of the Creative Commons Attribution License (CC BY). The use, distribution or reproduction in other forums is permitted, provided the original author(s) and the copyright owner are credited and that the original publication in this journal is cited, in accordance with accepted academic practice. No use, distribution or reproduction is permitted which does not comply with these terms.
*Correspondence: Jessica Steinlechner, amVzc2ljYS5zdGVpbmxlY2huZXJAcGh5c2lrLnVuaS1oYW1idXJnLmRl