- 1School of Civil Engineering, Architecture and Environment, Hubei University of Technology, Wuhan, China
- 2Railway Siyuan Survey and Design Group Co., Ltd., Wuhan, China
The energy dissipation usually occurs during rock failure, which can demonstrate the meso failure process of rock in a relatively accurate way. Based on the results of conventional triaxial compression experiments on the Jinping marble, a numerical biaxial compression model was established by PFC2D to observe the development of the micro-cracks and energy evolution during the test, and then the laws of crack propagation, energy dissipation and damage evolution were analyzed. The numerical simulation results indicate that both the crack number and the total energy dissipated during the loading process increase with confining pressures, which is basically consistent with the experiment results. Two damage variables were presented in terms of the density from other researchers’ results and energy dissipation from numerical simulation, respectively. The energy-based damage variable varies with axial strain in the shape of “S,” and approaches one more closely than that based on density at the final failure period. The research in the rock failure from the perspective of energy may further understand the mechanical behavior of rocks.
Introduction
Physical failure process of the material is always accompanied with energy conversion, which has great significance to investigate the energy evolution law in the process of loading the rock materials for solving practical engineering problems (Zhang et al., 2015). The energy evolution process is accompanied with damage, and the essence of damage is the generation and the development of micro-cracks. During the process of the rock deformation and failure, the micro-cracks have some relation to the energy.
Through the laboratory experiments,we can only observe the macro-cracks when the specimen is finally destroyed, and cannot trace the distribution and development of micro-cracks during the destruction. Therefore, the development of micro-cracks of rock materials were generally simulated by numerical software. For instance, Yang et al. (2014) conducted triaxial compression tests on sandstone and studied the geometry and distribution characteristics of cracks under different confining pressures by using CT scanning technology. Yin et al. (2015) used RFPA2D to analyze the crack propagation of a single-fissure composite rock. Zhao et al. (2020) studied the crack evolution of coal samples under impact loading by CDEM method. The 2D particle flow code (PFC2D) is an important way to study the crack propagation characteristics of rock at present because it can obtain the dynamic development of the crack easily and quickly. With the method of PFC2D, Zhang et al. (2016) studied the crack propagation of the fractured sandstone under uniaxial compression at different loading rates. Zhang et al. (2015) found that the micro-cracks have a power function relationship with axial strain. Zhou et al. (2017) studied the displacement distribution of cracks after specimens failed, the changes in the number of cracks, evolution law of crack distribution and the distribution of crack angles. Yang et al. (2018) studied the crack evolution process of mudstone under single-stage and multi-stage triaxial compression. Huang et al. (2016) carried out numerical simulation on specimens with two non-parallel cracks, and analyzed the crack initiation, propagation and coalescence process of pre-cracked specimens under triaxial compression conditions. The generation, propagation and penetration of cracks in rock are accompanied with energy dissipation, the study of rock damage and deformation from the perspective of energy is objective and closer to its failure mechanism, which develop to be an important way to reveal the mechanism of rock failure (Yang et al., 2007; Zhang and Gao, 2015). Miao et al. (2021) studied the evolution characteristics of energy dissipation, friction energy dissipation and fracture energy dissipation of granite under triaxial cyclic loading. Qin et al. (2020) analyzed the three types of strain energy and the variation of dissipation energy with axial strain. Liu et al. (2013) analyzed the relationship between the total energy and stress and strain by means of the triaxial compression experiments on marble. Based on the laboratory triaxial compression tests, Li et al. (2020), calculated the energy and its distribution under different loading rates.
At present, the research on energy depends mainly on the laboratory tests, and the laboratory tests cannot obtain energy directly, which needs complex calculations. However, the energy can be calculated quickly and simply by PFC2D. Most scholars used PFC to carry out the triaxial compression tests of rock materials which focused on the micro-cracks, and little attention was paid to the combination of energy and micro-cracks. Therefore, the numerical simulation was conducted in this paper based on the laboratory tests to obtain the distribution and number of the micro-cracks within the specimen, and analyzed the energy under different confining pressures. In addition, the energy conversion process and the influence of confining pressures on the dissipation energy were analyzed. By analyzing the micro-cracks distribution and energy conversion law, the failure mechanism of the specimen under triaxial compression was explained.
Micro-Crack Propagation
Laboratory Uniaxial and Conventional Triaxial Compression Experiments
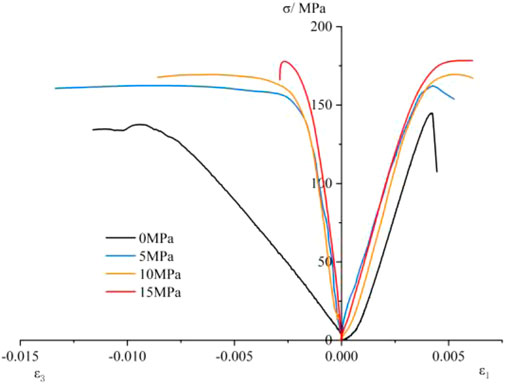
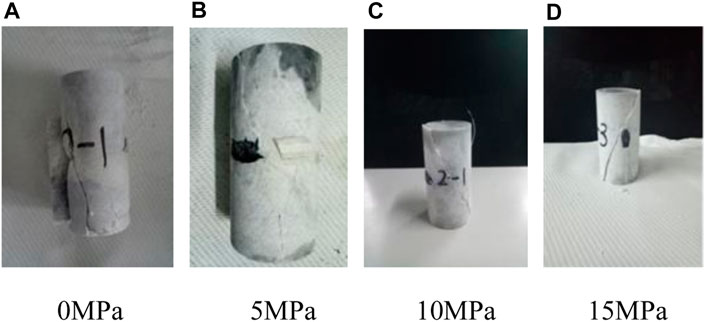
The laboratory experiments were conducted on the THMC multi-functional coupling test machine developed by the Wuhan Institute of Rock and Soil Mechanics, Chinese Academy of Sciences. The marble samples were taken from the Jinping Hydropower Station, and processed into cylindrical samples with diameter of 50 mm and height of 100 mm the triaxial compression experiments were conducted on the rock samples, with confining pressures of 0, 5, 10, and 15 MPa, respectively, and the stress-strain curves are shown in Figure 1. The stress-strain curve shows that the Jinping marble is a kind of classical hard brittle rock. Figure 2 shows the failure profiles of the rock specimens, the fracture plane of marble under confining pressure of 0 MPa is more complicated than those under other confining pressures. The single fracture plane with diagonal failure occurs when the confining pressure is not zero.
Numerical Model
The contact models in PFC mainly include parallel bond model, which only transmits force, and contact bond model, which transmits both force and torque (Wang and Dai, 2019). Therefore, the parallel bond model was used in this article to numerically simulate the biaxial compression experiments. The size of the numerical model was consistent with the size of the laboratory marble sample. The investigation by Zhou et al. (2011) shows that when the particle size ratio is 1.66, the value of the particle radius has less effect on the simulation results. Thus, the particle size ratio was 1.66 here and the minimum particle radius was taken as 0.4 mm. After the model was established, the macro-mechanical parameters of the material were determined to match the corresponding meso-mechanical property parameters. The meso-parameters of the numerical model obtained by repeated debugging are listed in Table 1.
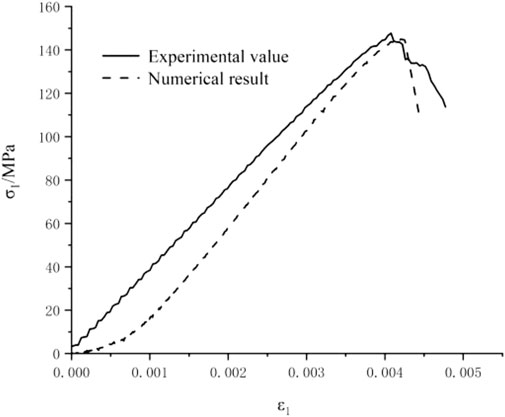
The uniaxial experiment was used to calibrate the meso-mechanical parameters of the specimen, and their stress-strain curves are shown in the Figure 3. The uniaxial strengths from the experiment and are almost identical with that from numerical model, especially at the peak of curve.
Parameter Verification by the Laboratory Experiment
To verify the numerical model in PFC2D, the numerical experiments under confining pressures of 5, 10 and 15 MPa were carried out. The peak strengths from laboratory experiments and numerical simulation under different confining pressures are listed in Table 2, which indicates that the numerical model can simulate the Jinping marble in a satisfactory way.

TABLE 2. Peak strengths from laboratory experiments and numerical simulation under different confining pressures.
The Mohr-Coulomb criterion expressed by the principal stress can be written as:
where M and N are strength criterion parameters. Eq. 1 indicates that the normal strength of the specimen has a linear relationship with the confining pressures (Yang et al., 2005). In addition, M and N have relationship with the internal friction angle φ and cohesion c (Wang et al., 2019a) as:
Figure 4 indicates that the peak strengths, cohesions and internal friction angles of the numerical model and the marble specimen are generally similar but have some differences due to the use of round particles in parallel bond model and the influences of the samples and instruments in laboratory experiments (Zhou et al., 2017). The linear fitting correlation coefficients of numerical and laboratory experiments are 0.99 and 0.95, respectively. Linear fitting correlation coefficient from simulation experiments is larger than that from laboratory experiments, indicating that the laboratory experiment results are affected by many factors. Thus, the discreteness of laboratory experiments is greater than that of numerical simulation. The PFC2D used this paper to simulate the laboratory experiments can abandon the influencing factors such as sample preparation and test equipment.
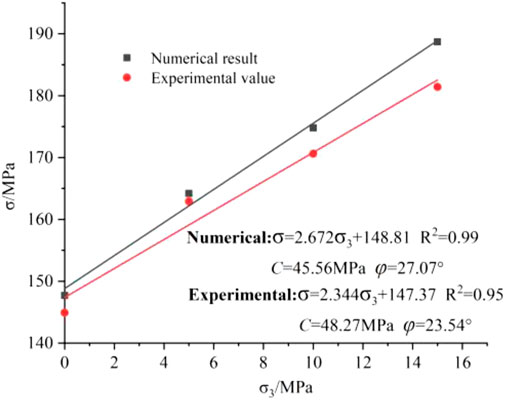
FIGURE 4. Relationship between confining pressure and peak strengths from laboratory tests and numerical simulation.
Micro-Crack Propagation Law
Through the numerical simulation, the evolution process of the initiation, propagation and final penetration of the micro-cracks during the loading process of the specimen can be obtained. Figure 5 shows the test results at 5, 10, and 15 MPa confining pressures. The pictures are the states at the pre-peak strength of 70%σc (σc is the peak strength), the post-peak strength of 45%σc, the residual stage and the specimen profile in laboratory, prospectively. The crack distribution of the numerical model during the failure process can be observed and the failure profile of the marble can be compared.
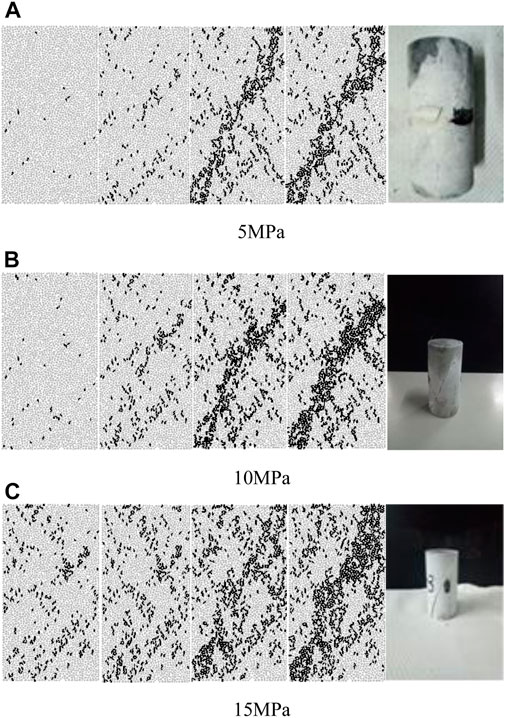
FIGURE 5. Crack distribution evolution and failure patterns of marble samples under various confining pressures.
The whole process of macro-crack formation is shown in Figure 5. Under the same confining pressure, the damage or the number of micro-cracks was little and scattered before the stress reaches 70% of the peak strength. As the load approached the peak strength, the number of the micro-cracks increased, and the trend of macro-crack development was roughly observed. Then the specimens entered into the failure stage, and the micro-crack propagation accelerated, the crack at the post-peak strength of 45%σc extended and formed macroscopic fracture plane. When the specimens finally failed, the main shear failure plane formed, which were consistent with the failure mode of marble in the laboratory experiments.
The total number of the micro-cracks gradually increased with confining pressure. At the confining pressure of 15 MPa, the fracture plane was the widest and the cracks near the fracture plane were densest. The failure needs more energy at higher confining pressure to resist higher circumferential confinement, and thus more micro-cracks accumulated (Wang et al., 2019b).
Energy Evolution Law
Energy Conversion Law
Without considering the external environment, according to the first law of thermodynamics and the energy conservation law (Li et al., 2011), the boundary energy can be expressed as:
where U is the boundary energy, that is, the total energy input to the specimen by external work, Ue is the elastic strain energy, and Ud is the dissipation energy.
Energy conversion is the essence of the physical changes in materials. There are two kinds of energy conversion mechanisms, namely, the strain hardening mechanism and strain softening mechanism. The strain hardening mechanism considers that the energy input from the outside is converted into strain energy, and then accumulated inside the specimen to prevent plastic deformation of the specimen. The strain softening mechanism considers that the strain energy is converted into dissipation energy, causing plastic deformation of the specimen (Zheng, 1990; Zhang and Gao, 2012).
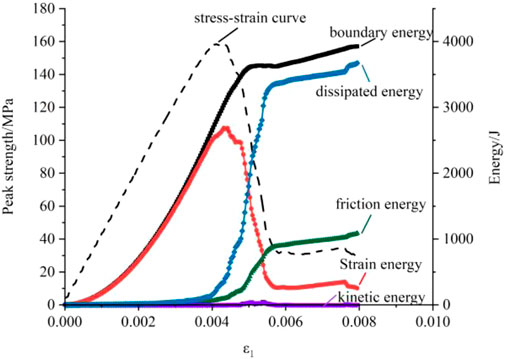
The energy conversion in the rock loading is divided into four processes: energy input, energy accumulation, energy dissipation and energy release, which can be observed by PFC2D. Taking the confining pressure of 5 MPa as an example, the variation of energy with strain is shown in Figure 6.
Before the peak strength, most energy from external work was converted into strain energy, accumulating in the specimen, with concave strain energy curve in Figure 6. The strain energy increased slowly at the initial loading stage, and then gradually. the specimen behaved strain hardening. The energy dissipation before the peak strength was little, generally without friction energy and kinetic energy.
At the peak strength, the strain energy reached the maximum and the energy storage capacity of the specimen reached the limit. Subsequently, the strain energy converted into the dissipation energy at high speed, and the dissipation energy increased sharply. The specimen behaved strain softening. This stage was the failure stage, during which the micro-cracks expanded rapidly, and began to be affected by friction energy, with fast growth rate. In the later stage of failure, the strain energy stored in the specimen was released in the form of kinetic energy. Since the deformation and failure of the specimen were not severe, the kinetic energy increased insignificantly with small fluctuations.
In the residual stage, the strain energy was basically converted into dissipation energy. As a part of dissipation energy, the friction energy increased, and the residual strength in this stage was mainly provided by friction.
The investigation on the energy conversion law and the crack distribution evolution of the specimen indicates that the damage process of rock is related to the dissipation energy and friction energy which developed simultaneously with the crack. The dissipation energy and friction energy increase sharply when the micro-cracks develop rapidly. However, the strain energy decreases rapidly when the micro-cracks develop sharply.
Evolution Law of Dissipation Energy
In the process of the rock deformation and failure, the generation and propagation of cracks are usually accompanied with energy dissipation.
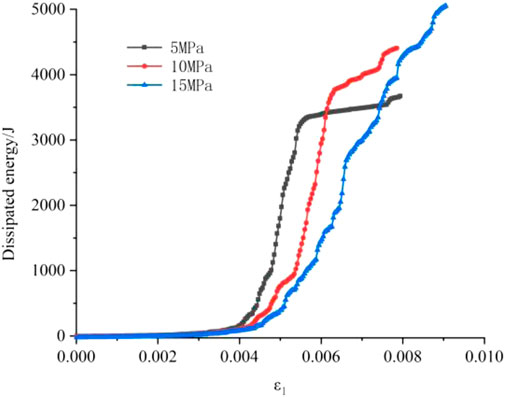
Figure 7 shows that higher confining pressure will consume more energy when the specimen fails. Under confining pressure of 5 MPa, the dissipation energy increased with the axial strain steadily at the pre-peak strength stage, sharply at the failure stage, and steadily at the residual stage of the stress-strain curve (see Figure 6). In the residual stage, dissipation energy increased with the confining pressures. Therefore, when the confining pressure was 15 MPa, the dissipation energy does not comply with the three-stage growth law.
The crack evolution under different confining pressures is shown in Figure 5. In the pre-peak stage, the micro-cracks grew slowly. The dissipation energy was low and relatively stable. In the failure stage, energy dissipation increased sharply, with rapid development of cracks. In the residual stage, the slope of the dissipation energy curve increased with the confining pressures, and the specimens had formed a complete macroscopic fracture plane, with generation of only a few cracks. The fracture plane of the specimens widened gradually with confining pressures, which led to large friction slip area of the cracks and high energy dissipation rate.
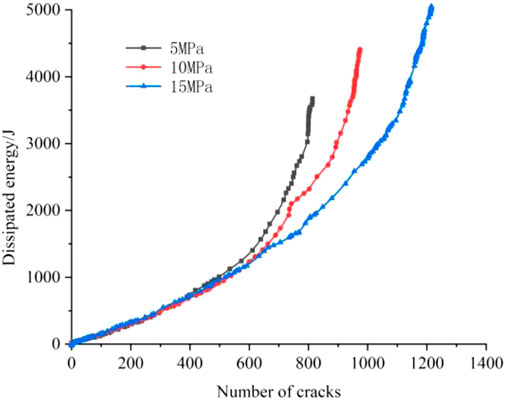
Figure 8 shows the relationship between the dissipation energy and the number of cracks under different confining pressures, which indicates that the energy dissipation curves are almost coincident with each other at the early stage, and both the crack number and the dissipation energy increase with confining pressure.
According to the crack distribution (Figure 5), energy is dissipated through the generation of cracks and friction slip between macroscopic cracks under a given confining pressure. In the early stage of the specimen loading, only a few micro-cracks occurred, without generation of macro-cracks, and the energy was just dissipated by the generation of micro-cracks. therefore, the dissipation energy approximately increases with the crack number in a linear way. Subsequently, the curve became concave. With the increase of micro-cracks, the macro-cracks gradually formed, the growth rate of the dissipation energy accelerated. The development trend of the energy dissipation curves is almost vertical in the final stage. The number of cracks kept basically constant, and the energy continued to dissipate through the friction slip between the macro-cracks.
Damage Evolution Law
There are many damage variables defined in different ways. In this paper, the damage variable was expressed based on the energy evolution law of micro-crack propagation in rock. The specific expression is:
where U is the boundary energy, Ud is the dissipation energy, and Ue is the total strain energy.
It was believed that the damage of rock materials behaves the change in density from a macroscopic view (Zhang et al., 2011). According to the method of describing the damage in terms of density, the damage variable was defined as:
where
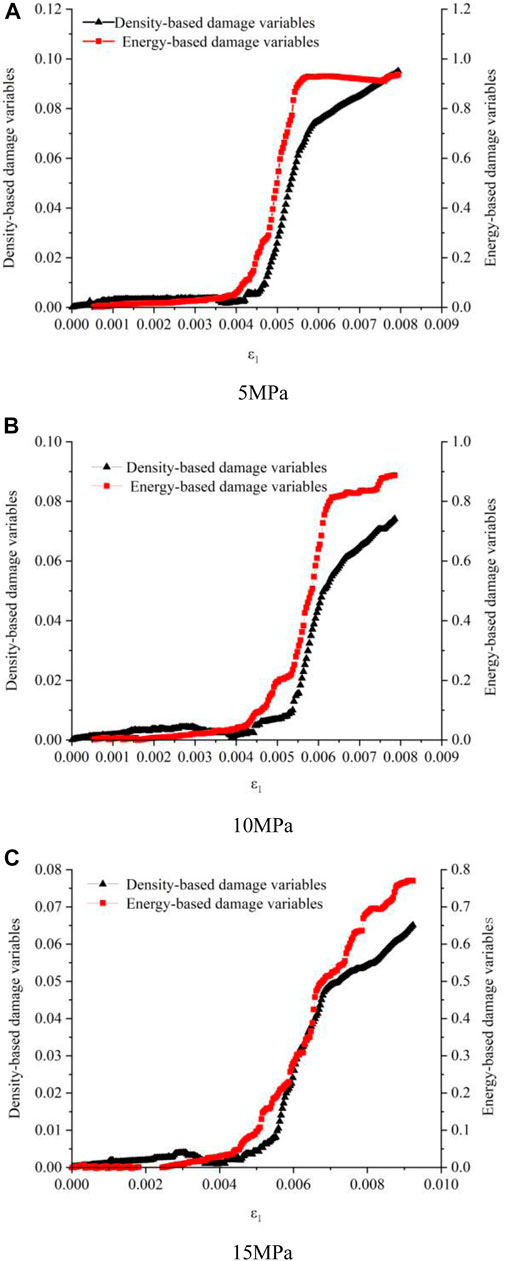
In this paper, the damage variables were obtained based on energy and density under different confining pressures, as shown in Figure 9. Under the confining pressures of 5, 10, and 15 MPa, all the damage variables obtained on the base of energy and density are shaped like “S.” Two kinds of curves are highly similar in the whole process, but the damage variable obtained from energy is closer to 1 at the end value than the other one, which has better physical expression for the failure process of rock.
Conclusion
To explore the micro-crack propagation and energy evolution laws of the rock specimens under triaxial compression conditions, the numerical simulation by PFC2D program was conducted on the basis of the results of laboratory experiments, and then the variation of the micro-crack evolution and energy dissipation was analyzed. The following conclusions can be made:
1. The exerted load is basically converted into strain energy, which results in the crack generation and propagation. The micro-cracks develop slowly in the early stage but expand rapidly in the later stage due to the sudden release of strain energy, forming the macroscopic cracks finally.
2. Energy is generally dissipated by the crack generation and friction slip between macro cracks. The micro-cracks increase with confining pressure, which widens the fracture plane and dissipates more energy.
3. Confining pressure also has some effect on the damage and deformation of the rock specimen. As the confining pressure increases, the damage degree increases, but with slower accumulation speed, and the specimen deformation is greater when the rock specimen fails.
Data Availability Statement
The original contributions presented in the study are included in the article/Supplementary Material, further inquiries can be directed to the corresponding author.
Author Contributions
All authors listed have made a substantial, direct, and intellectual contribution to the work and approved it for publication.
Funding
This work was supported by the National Natural Science Foundation of China (Nos.51609080 and 51708188).
Conflict of Interest
Z-RZ was employed by Railway Siyuan Survey and Design Group Co., Ltd.
The remaining authors declare that the research was conducted in the absence of any commercial or financial relationships that could be construed as a potential conflict of interest.
Acknowledgments
The authors would like to thank the National Natural Science Foundation of China (Nos. 51609080 and 51708188). We also would like to express our sincere gratitude to the editor and reviewers for their valuable comments, which have greatly improved this paper.
References
Huang, Y. H., Yang, S. Q., and Zhao, J. (2016). Three-dimensional Numerical Simulation on Triaxial Failure Mechanical Behavior of Rock-like Specimen Containing Two Unparallel Fissures. Rock Mech. Rock Eng. 49, 4711–4729. doi:10.1007/s00603-016-1081-2
Li, D., Ren, G. F., Ke, B., and Zhang, C. R. (2020). Loading Rate Effect and Energy Dissipation Mechanism of Dihydrate gypsum under Confining Pressures. J. Chin. J. Rock Mech. Eng. 39, 1883–1892. doi:10.13722/j.cnki.jrme.2020.0031
Li, L. Y., Xie, H. P., and Ju, Y. (2011). Experimental Investigations of Releasable Energy and Dissipative Energy within Rock. J. Eng. Mech. 28, 35–40. doi:10.6052/j.issn.1000-4750.2009.08.0584
Liu, T. W., He, J. D., and Xu, W. J. (2013). Energy Properties of Failure of marble Samples under Triaxial Compression. J. Chin. J. Geotechnical Eng. 35, 395–400.
Miao, S. J., Liu, Z. J., Zhao, X. G., and Huang, Z. J. (2021). Characteristics of Energy Dissipation and Damage of Beishan Granite under Cyclic Loading and Unloading. J. Chin. J. Rock Mech. Eng. 40, 928–938. doi:10.13722/j.cnki.jrme.2020.0953
Qin, T., Duan, Y. W., and Sun, H. R. (2020). Mechanical Characteristics and Energy Dissipation Characteristics of sandstone during Triaxial Loading. J. J. China Coal Soc. 45, 255–262. doi:10.13225/j.cnki.jccs.2019.1393
Wang, H., and Dai, J. G. (2019). Strain Transfer Analysis of Fiber Bragg Grating Sensor Assembled Composite Structures Subjected to thermal Loading. Composites B: Eng. 162, 303–313. doi:10.1016/j.compositesb.2018.11.013
Wang, H. P., Ni, Y. Q., Dai, J. G., and Yuan, M. D. (2019a). Interfacial Debonding Detection of Strengthened Steel Structures by Using Smart CFRP-FBG Composites. Smart Mater. Struct. 28, 115001–115013. doi:10.1088/1361-665x/ab3add
Wang, H., Xiang, P., and Jiang, L. (2019b). Strain Transfer Theory of Industrialized Optical Fiber-Based Sensors in Civil Engineering: a Review on Measurement Accuracy, Design and Calibration. Sensors Actuators A: Phys. 285, 414–426. doi:10.1016/j.sna.2018.11.019
Yang, S. Q., Su, C. D., and Xu, W. Y. (2005). Experimental Investigation on Strength and Deformation Properties of marble under Conventional Triaxial Compression. J. Rock Soil Mech. 26, 475–478. doi:10.16285/j.rsm.2005.03.028
Yang, S. Q., Tian, W. L., Jing, H. W., Huang, Y.-H., Yang, X.-X., and Meng, B. (2018). Deformation and Damage Failure Behavior of Mudstone Specimens under Single-Stage and Multi-Stage Triaxial Compression. Rock Mech. Rock Eng. 52, 673–689. doi:10.1007/s00603-018-1622-y
Yang, S. Q., Xu, W. Y., and Su, C. D. (2007). Study on the Deformation Failure and Energy Properties of marble Specimen under Triaxial Compression. J. Eng. Mech. 24, 136–142. doi:10.3969/j.issn.1000-4750.2007.01.023
Yang, Y. M., Ju, Y., Chen, J. L., and Gao, F. (2014). Cracks Development Features and Energy Mechanism of Dense sandstone Subjected to Triaxial Stress. J. Chin. J. Rock Mech. Eng. 33, 691–698. doi:10.13722/j.cnki.jrme.2014.04.005
Yin, P. F., Yang, S. Q., and Zeng, W. (2015). Simulation Study on Strength and Crack Propagation Characteristics of Composite Rock with Single Fracture. J. J. Basic Sci. Eng. 23, 608–621. doi:10.16058/j.issn.1005-0930.2015.03.019
Zhang, G. K., Li, H. B., and Xia, X. (2015). Study on the Evolution Law of Energy and Damage of Rock under Uniaxial Compression. J. Rock Soil Mech. 36, 94–100. doi:10.16285/j.rsm.2015.s1.016
Zhang, X. P., Jiang, Y. J., Wang, G., Wang, J. C., Wu, X. Z., and Zhang, Y. Z. (2016). Numerical Experiments on Rate-Dependent Behaviors of Granite Based on Particle Discrete Element Model. Rock Soil Mech. 37, 2679–2686. doi:10.16285/j.rsm.2016.09.033
Zhang, Z. L., Xu, W. Y., and Wang, W. (2011). Investigation on Conventional Triaxial Compression Tests of Ductile Rock and Law of Deformation and Damage Evolution. J. Chin. J. rock Mech. Eng. 30, 3857–3862.
Zhang, Z. Z., and Gao, F. (2015). Experimental Investigation on Energy Evolution Characteristics of Coal, sandstone and Granite during Loading Process. J. J. China Univ. Mining Technology 44, 416–422. doi:10.13247/j.cnki.jcumt.000321
Zhang, Z. Z., and Gao, F. (2012). Research on Nonlinear Characteristics of Rock Energy Evolution under Uniaxial Compression. J. Chin. J. Rock Mech. Eng. 31, 1198–1207. doi:10.13247/j.cnki.jcumt.000321
Zhao, Y. X., Sun, Z., Song, H. H., and Zhao, S. Q. (2020). Crack Propagation Law of Mode Ⅰ Dynamic Fracture of Coal: Experiment and Numerical Simulation. J. J. China Coal Soc. 45, 3961–3972. doi:10.13225/j.cnki.jccs.2019.1347
Zheng, Z. S. (1990). Energy Transfer Process and Dynamic Analysis during Rock Deformation. J. Sci. China: Ser. B. 5, 524–537. doi:10.1007/BF02919267
Zhou, J., Wang, Y. X., and Zhou, Y. F. (2017). Macro-micro Mechanism of Triaxial Fracture Evolution of sandstone Based on Particle Flow. J. J. China Coal Soc. 42, 76–82. doi:10.13225/j.cnki.jccs.2016.1435
Keywords: particle flow, triaxial compression, energy dissipation, damage evolution, crack distribution
Citation: Yang Y-S, Cheng W, Zhang Z-R, Tian H-Y, Li K-Y and Huang C-P (2021) Energy Evolution Law of Marble Failure Process Under Different Confining Pressures Based on Particle Discrete Element Method. Front. Mater. 8:665955. doi: 10.3389/fmats.2021.665955
Received: 09 February 2021; Accepted: 10 June 2021;
Published: 24 June 2021.
Edited by:
Huaping Wang, Lanzhou University, ChinaReviewed by:
Tong Jiao, Chengdu University of Technology, ChinaMinghua Huang, Hunan University, China
Chong Wang, Lanzhou University, China
Copyright © 2021 Yang, Cheng, Zhang, Tian, Li and Huang. This is an open-access article distributed under the terms of the Creative Commons Attribution License (CC BY). The use, distribution or reproduction in other forums is permitted, provided the original author(s) and the copyright owner(s) are credited and that the original publication in this journal is cited, in accordance with accepted academic practice. No use, distribution or reproduction is permitted which does not comply with these terms.
*Correspondence: Yan-Shuang Yang, eTF5MXMxQHFxLmNvbQ==
 Yan-Shuang Yang
 Wei Cheng
 Zhan-Rong Zhang2