 Jianwei Han1Xinglong Yao1Xiaohui Wang2Yunfei Yan2Endong Zhu1Zhi He1Lisong Zhang1
 Zhanyang Yu3Mengyu Zhan3*
- 1Longyuan New Energy Co., Ltd., Yantai, China
- 2Xi’an Thermal Power Research Institute Co., Ltd., Xi’an, China
- 3School of Electrical Engineering, Shenyang University of Technology, Shenyang, China
The significant magnetostrictive effect of amorphous alloy leads to severe vibration of iron core and debris shedding, which limits the wide application of amorphous alloy materials in transformer field. Therefore, the vibration characteristics of amorphous alloy coil core transformer are analyzed in this paper. Firstly, a mathematical model for predicting the magnetostrictive characteristics of the core material is constructed, and the magnetostrictive characteristics of amorphous alloy core is accurately measured with the help of a high-precision laser tester. This model can accurately reflect the vibration characteristics under magnetostrictive effect. Secondly, the vibration and noise characteristics of amorphous single frame coil core are analyzed. An amorphous alloy transformer with a rated capacity of 50 kVA was used as the experimental object to carry out a comprehensive experimental test. The key indicators such as vibration amplitude, frequency distribution and noise spectrum of the core were tested. The results show that the experimental and simulation data are highly consistent, which strongly confirms the accuracy and reliability of the simulation model. Finally, the influence mechanism of clamping force on vibration characteristics of amorphous alloy core is considered, and the relationship between clamping force and vibration characteristics is revealed.
1 Introduction
The amorphous alloy materials applied in the field of transformer core have the characteristics of high magnetic permeability and low loss. Transformer power equipment using amorphous alloy core has remarkable energy-saving effects (Sun et al., 2020; Zhang et al., 2023), which is very in line with the development requirements. However, the magnetohysteretic effect of amorphous alloy used in transformer is much greater than that of traditional silicon steel material. The saturation hysteresis constant of amorphous alloy is about 20ppm, while that of silicon steel material is almost zero (Zhang et al., 2019). This results in the fact that the mechanical vibration generated by the amorphous alloy core during operation is difficult to control. The stronger electromagnetic vibration not only leads to higher noise of the power equipment but also affects the operating life of the power equipment.
The magnetostriction effect of amorphous alloy will cause the deformation of the core and significantly aggravate the vibration and noise of core (Li et al., 2022a). Therefore, how to design and manufacture an amorphous power transformer with low vibration and noise has become an urgent problem to be solved in its popularization and application (Liu et al., 2024a). In (Zhang et al., 2022), the magnetic properties of nanocrystalline, amorphous alloy, X-Flux(Fe-Si-Si), Sendust(Fe-Si-Al) and ferrite at different frequencies and temperatures, including initial permeability, saturation magnetic induction, etc., were tested. The results showed that the nanocrystalline magnetic core had the best performance in five kinds of materials. In (Zhou et al., 2024), based on the traditional B-H curve method for measuring soft magnetic materials, a new 2-D magnetic property measuring device was developed, and its effectiveness was verified by experimental tests. In (Alvarez et al., 2018), the effects of annealing treatment at different temperature and time on the magnetic properties of ferro-based amorphous alloy were analyzed. In (Sato and Todaka, 2018), the effect of bending stress on the magnetic properties of amorphous alloy coil core was studied by experiments. The results show that the magnetic properties of amorphous alloy coil core deteriorate with the increase of bending stress, and magnetic annealing is an effective method to restrain the magnetic properties deterioration caused by bending stress. In (Wang et al., 2024), the magnetostrictive effect of electrical steel sheet under temperature gradient was measured. The results show that the magnetostrictive characteristics do not change significantly at low magnetic flux density, but the effect is very obvious at high magnetic flux density. In (Chen et al., 2019), the magnetostrictive effect of electrical steel sheet under different DC magnetic bias was measured, the results show that DC magnetic bias has great influence on the direction of turns and little influence on the vertical direction of turns. However, this difference gradually disappears as the magnetic flux density of the sample reaches saturation. In (Mizuta et al., 2018), in order to measure the magnetic properties of amorphous alloy strip and laminated amorphous block under 50 MPa tension to 50 MPa pressure, an experimental measurement platform for the stress magnetic properties of amorphous alloy was developed. It was proposed that the maximum magnetic field intensity of amorphous strip during excitation decreases with the tensile stress and increases with the compressive stress. In (Li et al., 2022b), the vibration and noise test platform was used to test the vibration acceleration of silicon steel GT-050, GT-100 and amorphous alloy CACC30. The results show that the vibration noise of amorphous alloy CACC30 is higher than that of silicon steel under sinusoidal excitation, and the vibration noise of non-sinusoidal excitation is significantly higher than that under sinusoidal excitation. The magnetostriction characteristic of amorphous alloy is the main factor affecting the vibration of amorphous transformer core, and it is also the basic characteristic data necessary to analyze the vibration noise of amorphous transformer (Wu et al., 2018). In (Hu et al., 2016), the results show that the vibration of amorphous alloy transformer mainly comes from the magnetostrictive effect of iron core. In (Wu et al., 2019), the vibration noise of amorphous alloy core and silicon steel core was compared. The results show that the vibration noise of amorphous alloy core is obviously higher than that of silicon steel core with the same capacity. In (Romaric et al., 2022), the vibration and noise of amorphous alloy dry type transformer is calculated and analyzed, and the method of adding reinforcing bars to the upper clamp of transformer was proposed to suppress the vibration of iron core. In (Liu et al., 2024b), the noise of amorphous alloy core is suppressed by means of active noise reduction. In (Du and Liu, 2015), in order to analyze the vibration characteristics of amorphous core, two 2605SA1 amorphous coil core frames with the same height and different widths are fixed with insulation tape. Vibration analyzer was used to measure and investigate the vibration acceleration value of each measuring point of the core, and the vibration change of the core was compared and analyzed when different vibration damping materials are added to the bottom of the core.
Existing literature shows that the magnetic characteristics of amorphous alloy core are sensitive to stress, but when amorphous alloy power transformer is manufactured, the iron core is in a free state resulting in large vibration. The vibration effect caused by the clamping force of iron core has not been determined in engineering, and the related research reports are few. Therefore, in order to investigate the effect of clamping force on amorphous alloy iron core, the magnetostrictive characteristics of amorphous alloy 3D core are measured. Based on measured data, the vibration of amorphous core under different clamping forces is calculated. Finally, the effect of clamping force on the vibration of amorphous core is summarized and analyzed.
2 Model analysis method
2.1 Magnetization and magnetostrictive characteristics of amorphous alloy
The magnetostriction of amorphous alloy material is the important element for vibration and noise generated. Therefore, the magnetic and magnetostrictive characteristics of amorphous alloy are the basis of vibration and noise calculation of amorphous alloy 3D wound coil core. The magnetic characteristics of one single-frame core was measured by the volt-ampere method. By changing the excitation voltage on the high-voltage side, the magnetic field intensity is changed. The measurement device is shown in Figure 1. According to GB/T 19346.1-2017, the core magnetic flux density is measured by voltammetry, which is mainly based on the law of electromagnetic induction and the law of ampere-loop.
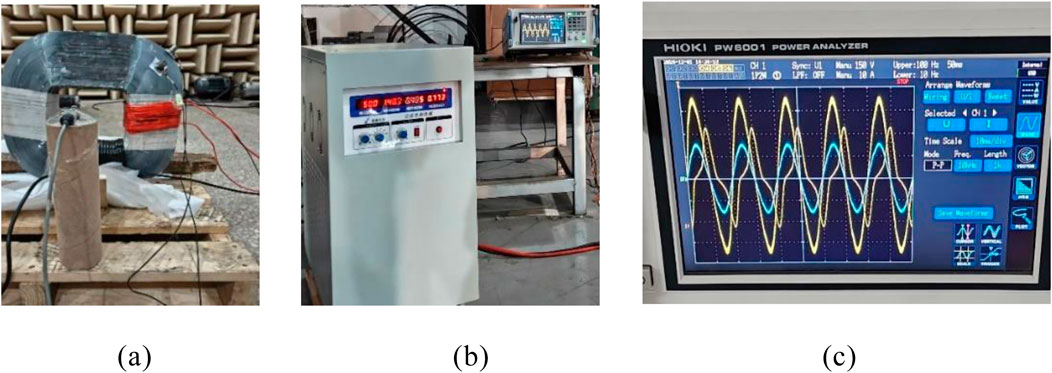
Figure 1. Magnetic property testing device. (a) Single-frame amorphous 3D wound core. (b) AC power supply with different output voltages and frequencies. (c) Oscilloscope.
When the magnetic flux through a closed coil changes, an induced electromotive force is generated in the coil, the magnitude of which is proportional to the rate of change of the magnetic flux, the mathematical expression is
Where, e is the instantaneous value of induced electromotive force, ϕ is the magnetic flux, t is time, and N1 is the number of turns of a side coil.
Because the magnetic flux is generated by the alternating magnetic field, the magnetic induction intensity of the magnetic field is
Where, B is magnetic induction intensity, Bm is the amplitude of magnetic induction intensity, and w is the angular frequency.
For a core with an effective cross-sectional area of S, the magnetic flux is
Where, Bm is the amplitude of magnetic induction intensity, ϕ is the magnetic flux, and Bm is the amplitude of magnetic induction intensity.
Then the induced electromotive force is
Where, e is the instantaneous value of induced electromotive force, B is magnetic induction intensity, N1 is the number of turns of a side coil, and S is the effective cross-sectional area of the core.
The effective value of the induced electromotive force
Where, E is the effective value of induced electromotive force; V,f is the frequency; Hz, B is magnetic induction intensity; T, S is the effective cross-sectional area of the core, m2.
In an iron core, the relationship between the strength of the magnetic field and the magnetomotive force follows the Ampere loop law, which is
Where, H is the magnetic field intensity, I is the primary side coil current, A, and l is the closed path of the magnetic field line.
For a single frame amorphous alloy 3D wound core, the average magnetic path length of the core is l, and the magnetic field strength H of the core is
Where, H is the magnetic field intensity, I is the primary side coil current, and l is the closed path of the magnetic field line.
The measurement results of B-H curve and relative permeability of amorphous alloy 3D wound core are shown in Figure 2. The iron core of an amorphous power transformer mostly operates at about 1.2T, and its saturation magnetic flux is about 1.5T.
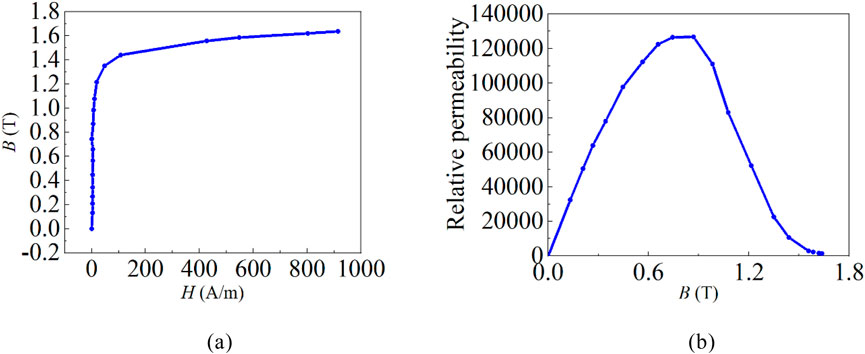
Figure 2. Magnetic characteristic of amorphous alloy strips. (a) Amorphous magnetization characteristic. (b) Amorphous relative magnetic permeability characteristic.
To investigate the vibration and noise of amorphous alloy 3D wound core, it is necessary to analyze the magnetostrictive characteristics of core. Therefore, the magnetostrictive properties of amorphous alloy samples at different frequencies have been measured. An amorphous alloy magnetostrictive test system based on a monolithic magnetic property measurement device was built, as shown in Figure 3. The device was produced by Brouchaus, Germany, model MST500. Its primary side winding was powered by a power amplifier, which could be set in two forms, alternating and alternating superimposed DC bias. The secondary side winding measures the magnetic flux density in the sample to be measured. Based on the closed-loop control, the waveform of the magnetic flux density in the sample to be measured changes according to the sinusoidal law. When the sample is magnetized, a small geometric deformation occurs, which is also caused the strain gauge to deform. The strain gauge converts the deformation signal into a change in resistance value and turn it into a voltage signal through the strain bridge box, which is amplified by the strain amplifier and transmitted to a computer, where it is become into the corresponding strain signal. The strain gauge is connected with the strain bridge box and strain amplifier, and the strain signal is transferred to the LabVIEW control program in the computer through the BNC adapter and data acquisition card to complete the measurement and processing of the signal. Among them, the strain bridge box adopts DB-120A series produced by KYOWA Company, whose balance bridge arm resistance is 120Ω. Since the magnitude of strain signal is very small, so the collected signal needs to be amplified by a strain amplifier, which has the functions of filtering AND amplification.
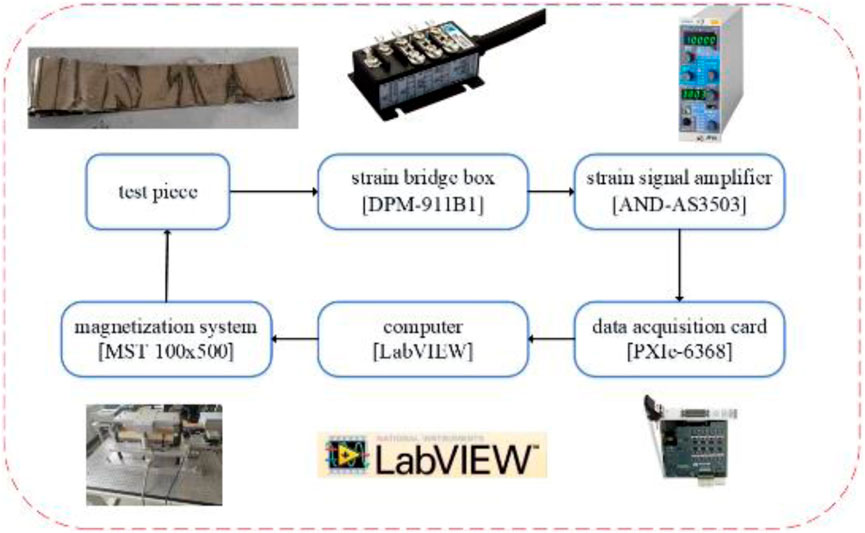
Figure 3. Schematic diagram of measuring device for magnetostriction of amorphous alloy.
Based on above testing system, the magnetostrictive characteristics of amorphous alloy material under sinusoidal alternating magnetization at different frequencies were tested. The test samples are made of amorphous alloy core materials produced by Advanced Technology & Mater. Figure 4 shows the waveform curves of the magnetostrictive strain changing with the excitation frequencies of 50 Hz and 100 Hz. It can be seen that the change period of magnetostriction is twice that of the change period of magnetic flux density. At the same frequency, the peak-to-peak value λpp of magnetostriction increases with the increase of magnetic flux density. Among them, the peak value λpp describes the maximum change of the magnetostrictive loop, which can be defined as the difference between the maximum and minimum value of magnetostrictive loop, and is calculated as.
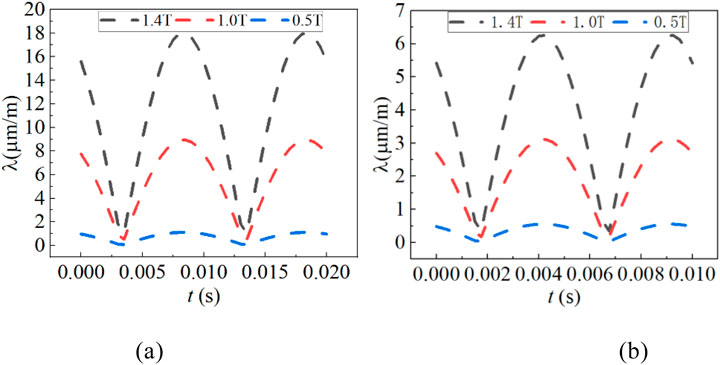
Figure 4. Waveforms of magnetostriction within a time-period. (a) Excitation frequency domain is 50 Hz. (b) Excitation frequency domain is 100 Hz.
Where, λmax and λmin are the maximum value and the minimum value of magnetostriction loop respectively. When the magnetization frequency changes from 50 Hz to 100 Hz, the magnetization time of magnetic domains becomes shorter, and the change period of magnetic domains becomes shorter, resulting in the decrease of magnetostriction value.
The single value curve of magnetostriction under different clamping forces under 50 Hz sinusoidal excitation was extracted, as shown in Figure 5. It can be seen that as the external magnetic field increases, the peak-to-peak value λpp of magnetostriction gradually increases. When the magnetic flux density of the external magnetic field gradually increases from 0.5T to 1.0T, the peak-to-peak value λpp of magnetostriction shows an approximately linear growth. However, after the magnetic flux density reaches 1.4T, the magnetostriction also began to appear inflection point, gradually entering the saturation region, that is, the peak-to-peak value λpp of magnetostriction shows a non-linear trend. From the microscopic perspective shows that under the excitation of the external magnetic field, the magnetic domains forming the amorphous alloy core material is gradually parallel to the direction of the external field direction, and the entire magnetization process is accompanied by changes in the size of the magnetic domains. When all magnetic domains become a single-domain sample, the magnetization intensity reaches saturation, and the strain of the magnetic domains also tends to be saturated. If the magnetic field is further increased, the magnetization intensity increases slowly, and the strain also increases slowly.
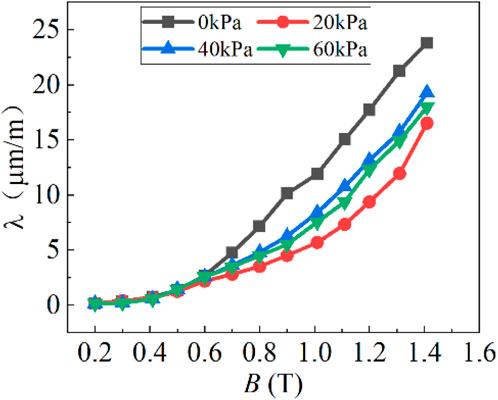
Figure 5. Single-value curves of magnetostriction under different clamping forces.
2.2 Magnetic-mechanical coupling mathematical model
COMSOL software is used to simulate the vibration and noise of amorphous alloy 3D wound core. Amorphous distribution transformers work at power frequency, Maxwell equations are the basis for solving magnetic field problems. In magnetic field analysis, magnetic flux density B is obtained from the curl of magnetic potential A, and the displacement current can be ignored.
The electromagnetic field solution equations are as follows.
Where, σ is the electrical conductivity, A is the magnetic potential, μ0 is the vacuum magnetic permeability, μr is the relative magnetic permeability, Je is the external current, B is the magnetic flux density, H is the magnetic field intensity, and Vm is the scalar magnetic potential. The structure field theory equations are as follows.
Where, ρ is the core density, u is the displacement vector, F is the load, v is the Poisson’s ratio, T is the stress, Ti is the initial stress, C is the stiffness matrix, S is the strain, and Si is the initial strain.
The calculation of electromagnetic vibration is based on the theory of elasticity, ignoring the damping term of amorphous alloy prototype structure, and vibration control equation is as follows.
Where, M and K respectively represent the mass matrix and the stiffness matrix, u(t) represents the displacement that needs to be determined, F(t) is the acting force. The force on the prototype of the amorphous alloy 3D wound transformer includes external pressure and electromagnetic force.
For the core of amorphous distribution transformer and other power equipment, the electromagnetic force includes Maxwell force fmw and magnetostrictive force fms. The magnetostrictive stress tensor can be obtained from the measured magnetostrictive single value curve.
Where, T is Maxwell’s stress tensor, D is the elasticity tensor, B is the magnetic flux density, σms is electrical conductivity, S is the effective cross-sectional area of the core, εms is the stress tensor of hysteresis.
The sound pressure equation is as follows. The vibration of the iron core is the source of the sound generated by the transformer, and the vibration of the sound source propagates in the air in the form of waves. The control equation of sound pressure is as follows.
Where, ρ is the fluid density, q is the dipole source, Q is the monopole source, P is the sound pressure, and c is the speed of sound.
3 Model calculation and experimental comparison and analysis
3.1 Model establishment
The model parameters of a 50 kVA amorphous 3D wound core are shown in Table 1. The core model was established. The actual, finite-element model and core section of amorphous alloy 3D wound core are shown in Figure 6. Every two single-frame amorphous alloy wound cores are fixed with insulating tape at the core column part. The magnetic circuits of the three single-frame wound cores are completely symmetrical, and the contact parts between every two single-frame wound cores are separated by insulating paper.
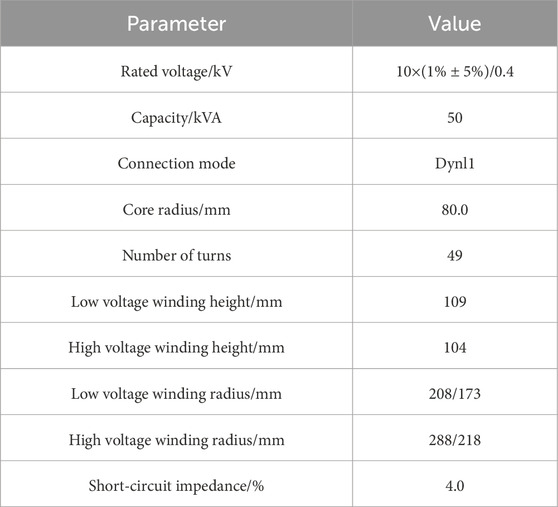
Table 1. Main parameters of transformer.
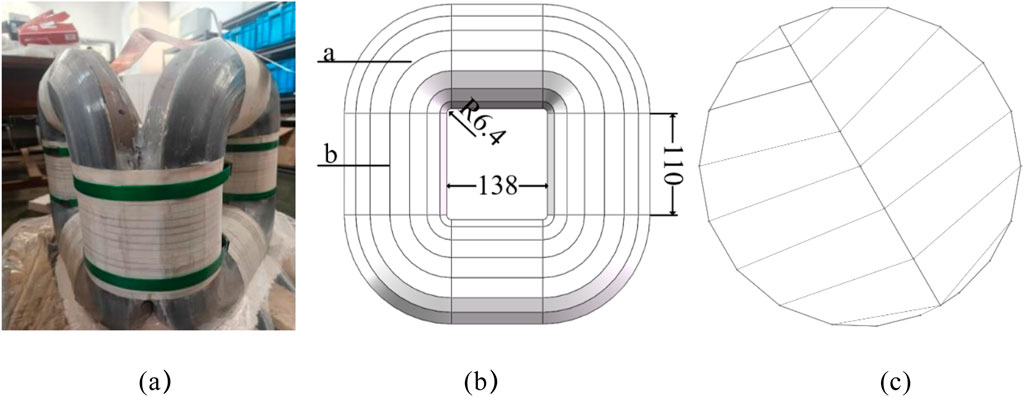
Figure 6. Model of the amorphous alloy 3D wound core. (a) Actual core. (b) Finite element model. (c) Core column cross-section.
3.2 Calculation results of magnetism-vibration-noise
Since the magnetic circuits of 3D wound cores are independent of each other. Therefore, the experiment and simulation of one single frame is compared and analyzed. To investigate the magnetic characteristics and vibration-noise the core under different working conditions, at the same time, the magnetic flux density maps under different excitations are shown in Figure 7. The magnetic flux density distribution becomes more uniform as the excitation increases, and the magnetic flux density is large at the inner corners of the core.
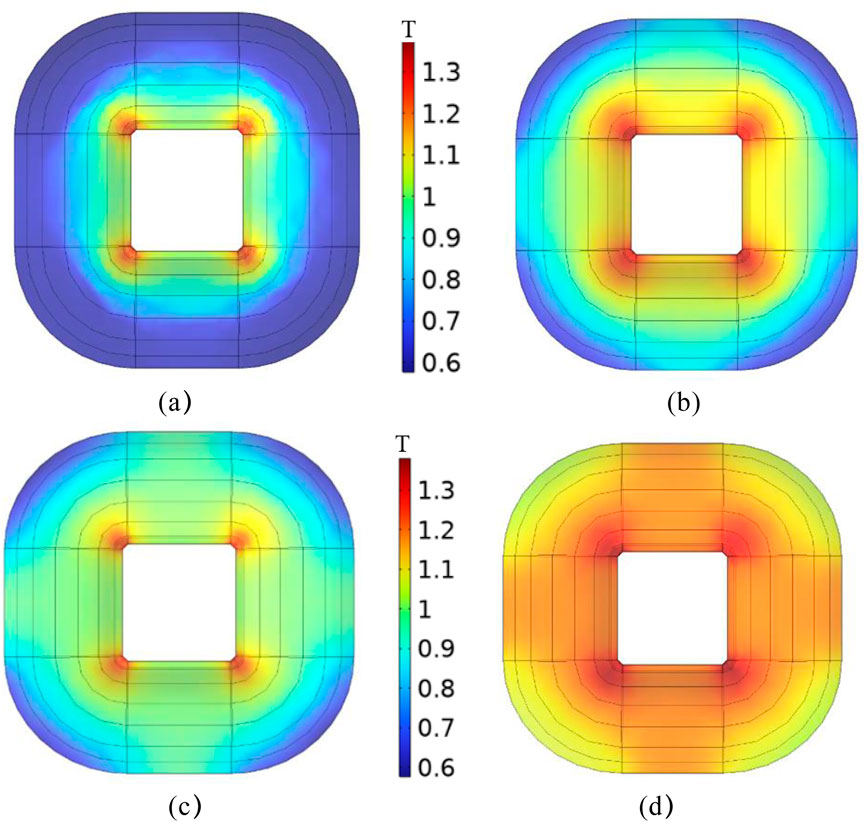
Figure 7. Magnetic flux density of single frame under different excitation current. (a) Excitation current is 0.09A. (b) Excitation current is 0.12A. (c) Excitation current is 0.15A. (d) Excitation current is 0.41A.
In order to verify the accuracy of the simulation calculation of magnetic flux density of single-frame amorphous alloy 3D coil core, the simulation amplitude of magnetic flux density of amorphous alloy 3D coil core under excitation of 0.12A was compared with the experimental amplitude. According to the relationship between magnetic flux density and induced voltage, is shown in Equation 18.
Where, B is the magnetic flux density, S is the effective cross-sectional area of the core, U2 are the secondary side voltage, N2 are the number of turns of the secondary side coil.
The experimental pictures and measurement results of the test are shown in Figures 8, 9. It can be seen that the variation rule of the simulated magnetic flux density inside the iron core is the same as that of the experimental value, and the amplitude error is less than 5%, indicating a good agreement between the simulation and experimental results.
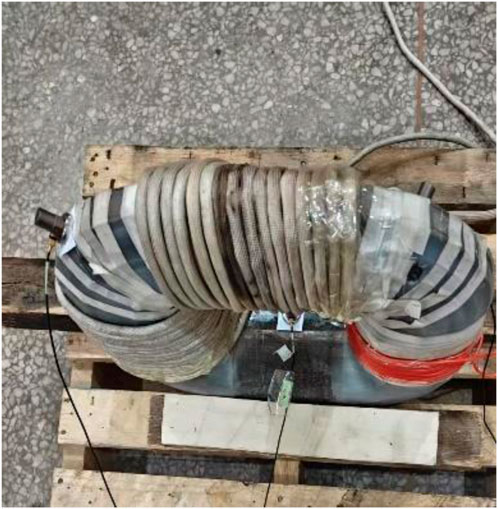
Figure 8. Measurement of magnetic flux density of amorphous alloy 3D coil core.
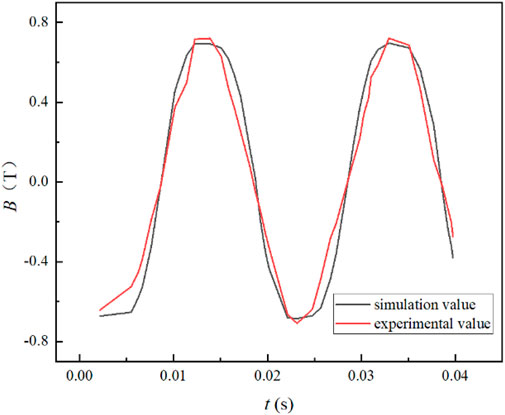
Figure 9. Comparison between simulated amplitude and experimental amplitude of magnetic flux density at 0.12A.
Based on the correct calculation of the magnetic field, considering the magnetostriction effect of the amorphous alloy 3D wound core, solid mechanics and sound field analysis of the amorphous alloy core under different working conditions were carried out. A fixed boundary condition is applied at the bottom of the core. The results of the core displacement magnitude under different working conditions are shown in Figure 10.
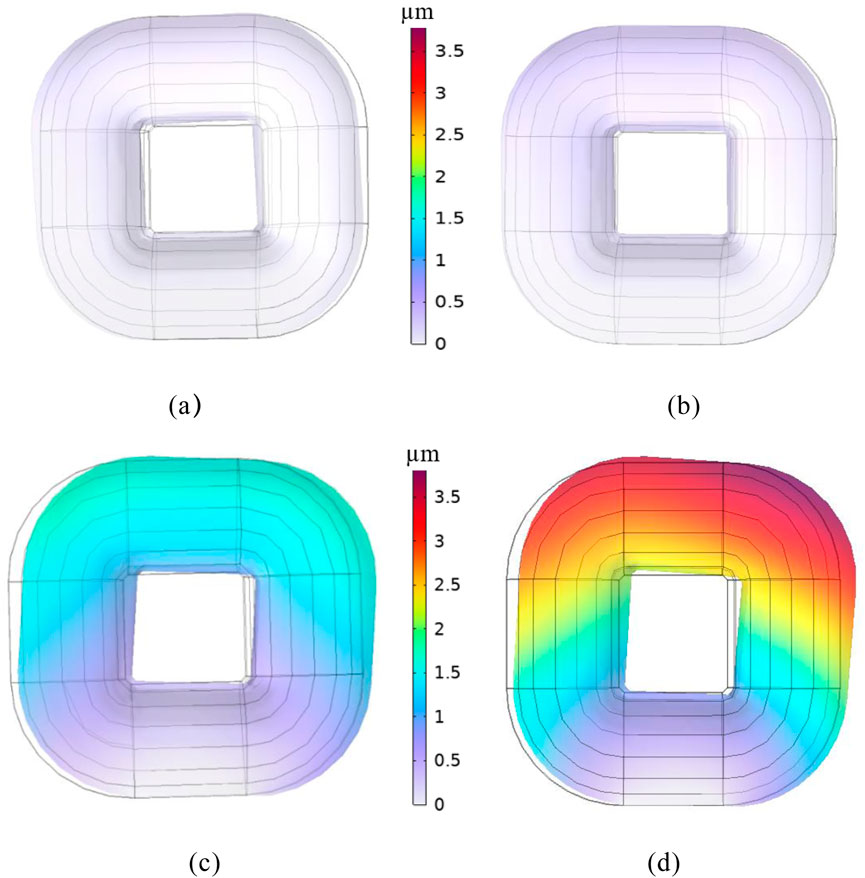
Figure 10. Vibration distribution of the core under different excitation current. (a) Excitation current is 0.09A. (b) Excitation current is 0.12A. (c) Excitation current is 0.15A. (d) Excitation current is 0.41A.
The calculation results show that the vibration of the core gradually increases from top to bottom, and the maximum vibration occurs at the upper yoke and corners.
To analyze the vibration of the amorphous alloy 3D wound core under different working conditions, magnetostriction is analyzed from the calculation results of the points, the vibration-noise conditions of the amorphous alloy 3D wound core under different working conditions were compared. The vibration experiment site diagram is shown in Figure 11.
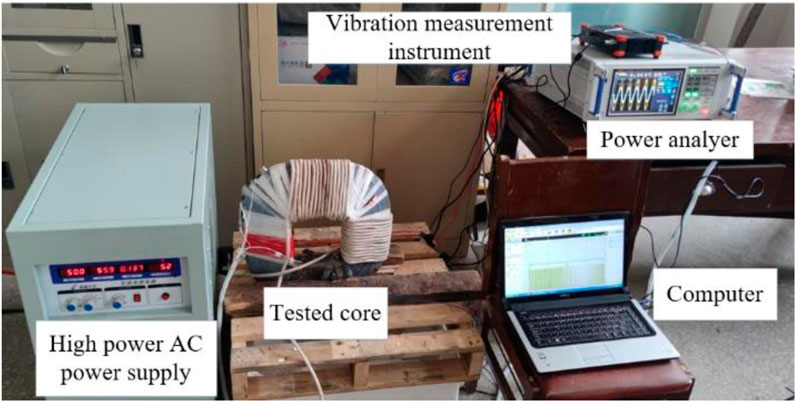
Figure 11. Magnetic properties measuring device for amorphous alloy 3D wound core.
In this experiment, an AC voltage and frequency adjustable power supply of model DH-11020 is used to provide an alternating and adjustable power source for the iron core. Meanwhile, voltage clamps and current clamps are connected to the PW6001 power analyzer produced by HIOKI of Japan to monitor the voltage and current on the primary and secondary sides. The vibration measurement system is produced by DEWE soft of Austria. The sensor probe adopts PCB piezoelectric acceleration sensor, which will not interfere with the leakage magnetic field distribution of the transformer. It is connected to the DEWE-43-A series data collector to obtain good vibration signals. The vibration signals of multiple measurement points are collected through the PC-based data acquisition system.
According to Equation 19, the vibration acceleration of the core caused by hysteresis of soft magnetic materials is oscillated at twice the AC frequency as the fundamental frequency, that is, generally 100 Hz.
Where, ac is the vibration acceleration of the iron core, εS is the saturation flux coefficient, L is the actual linear length of the material, U0 is the primary side voltage amplitude, S is the effective area of magnetic flux passing through the core, N1 is the number of turns of the primary side coil, and BS is the saturated magnetic flux density.
The vibration acceleration at point a in Figure 6a is extracted, and the vibration condition of the core with an excitation current of 0.15A is analyzed, as shown in Figure 12.
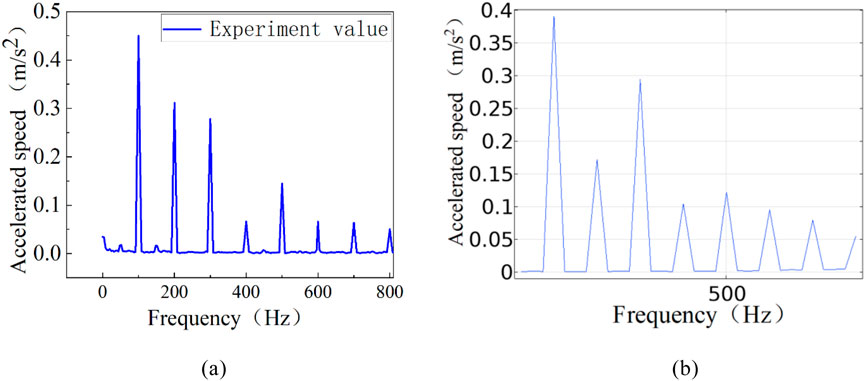
Figure 12. Experimental and simulation curves of core vibration with the excitation current of 0.15A. (a) Experimental test. (b) Simulation result.
To further verify the accuracy of the method, the comparative analysis of error is shown in Figure 12. It can be seen from Figure 12, 13 that the core vibration energy is mainly concentrated within 100–300 Hz, and the simulation value has a good follow-up with the experimental value. The vibration tendency is consistent with the theory of vibration acceleration, verifying the accuracy of the method. However, there is a error between the simulation and experiment test, which may be due to the fact that the core is regarded as whole in simulation model, while the actual model is wound up.
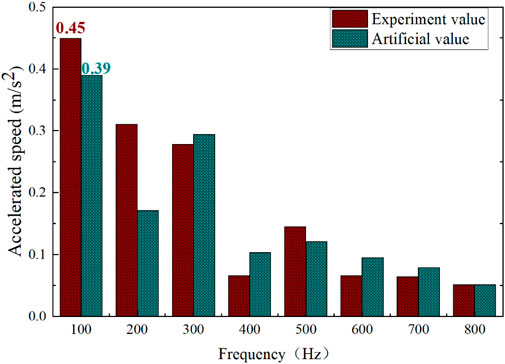
Figure 13. Comparative analysis of experimental test and finite element simulation for vibration acceleration amplitude under different frequencies.
To further explore the noise generated by amorphous alloy 3D wound core, the measurement of amorphous alloy core noise was carried out in the noise reduction laboratory. The noise value of the amorphous core under different working conditions are simulated and tested as shown in Figure 14. The results are shown in Figure 15. A sound level meter is used to collect noise information, and its working principle is to collect a signal once per second and measure its maximum value. The sound pressure value of the core changes within 0.02 s. Therefore, the maximum values of the simulation is compared with the experimental values, and the comparison results are shown in Figure 16. The error between the experimental value and the simulation value is less than 5%, further verifying the correct of simulation model.
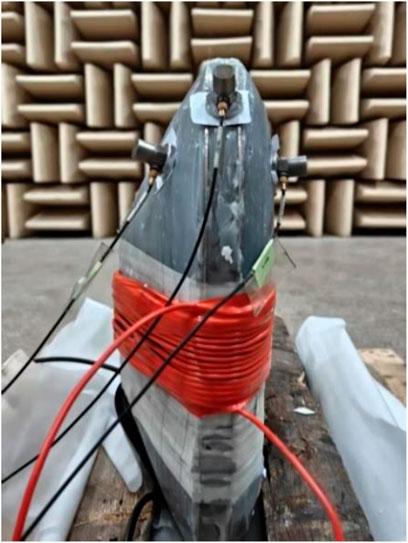
Figure 14. Noise test field diagram of amorphous alloy 3D coil core.
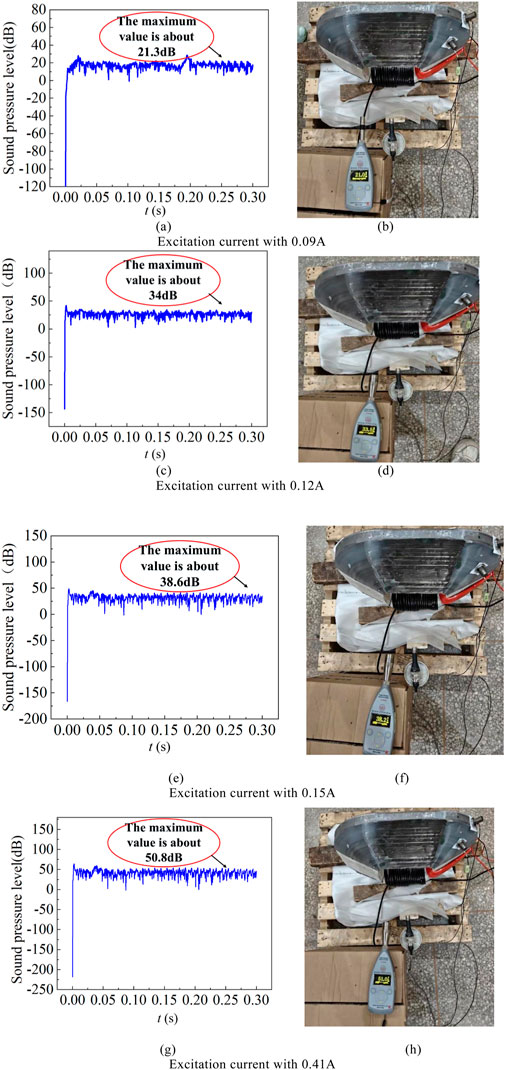
Figure 15. Noise values under different excitations. (a) Simulation value. (b) Experimental value. (c) Simulation value. (d) Experimental value. (e) Simulation value. (f) Experimental value. (g) Simulation value. (h) Experimental value.
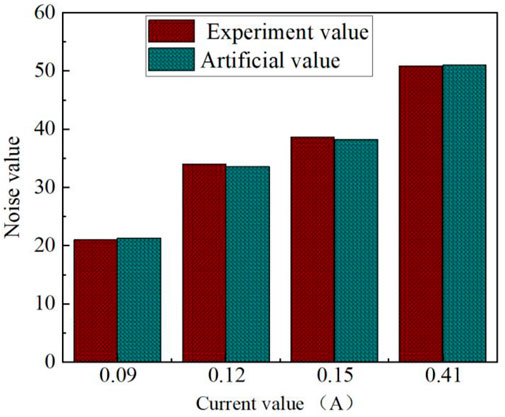
Figure 16. Comparative analysis of experimental test and finite element simulation for noise values under different excitations.
4 Calculation and analysis of the core vibration under different clamping force
In the field of power system, amorphous alloy transformer has been widely used for its excellent energy-saving characteristics. However, the vibration problem during its operation cannot be ignored, which makes the significance of studying the effect of clamping force on the vibration suppression of amorphous alloy 3D wound core transformers more prominent. From the perspective of stable operation of the transformer, intense vibration can cause core wear and fatigue, shorten the service life of equipment, and may also produce amorphous debris, causing insulation damage to the windings of oil-immersed amorphous alloy transformers, ultimately affecting the stability and reliability of power transmission. By reasonably applying the clamping force, the displacement of the core can be constrained. The core column is the part that exerts the clamping force on the amorphous alloy 3D coil core. It is helpful to optimize the design of amorphous alloy 3D coil core to investigate the relationship between clamping force and vibration of core column. Accurately determine the appropriate range of clamping force values.
Under the condition of verifying the correct of the model and simulation method, this paper analyzes the vibration of the amorphous alloy 3D wound core under different clamping forces with an excitation of 0.15A. Since the clamping force has little effect on the magnetic density of the core, it is not taken into account in the calculation of the magnetic field. The single-value curves under different clamping forces are added to solid mechanics to investigate the vibration conditions of the core column of the amorphous alloy 3D wound core. Because the amorphous core is a soft magnetic material with a unique microscopic structure, its atomic arrangement exhibits long-range disorder and short-range order. This special structure makes the amorphous core highly sensitive to stress. Therefore, the clamping force of the amorphous core should not be too large. Therefore, the vibration of the amorphous core at 20kPa, 40kPa, and 60 kPa is analyzed. The stress distribution cloud diagrams of the amorphous core are shown in Figure 17, and the maximum stress values on the core column are shown in Figure 18.
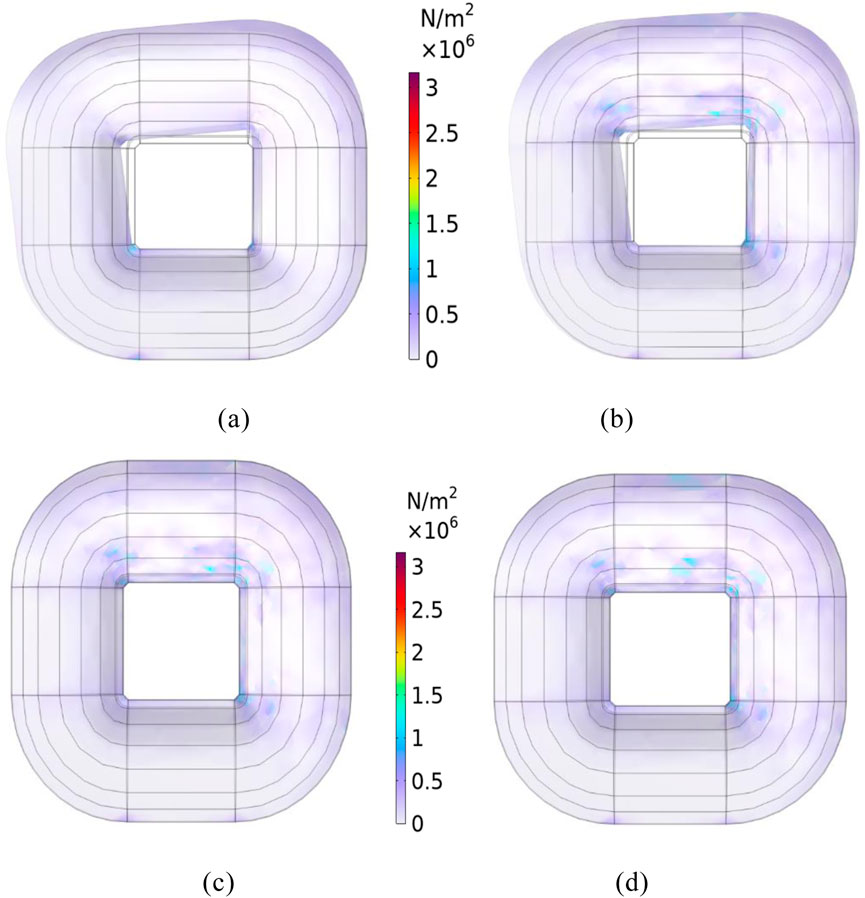
Figure 17. Stress distribution under different clamping forces. (a) 0 kPa. (b) 20 kPa. (c) 40 kPa. (d) 60 kPa.
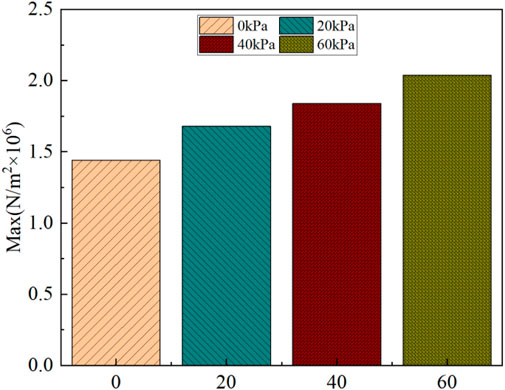
Figure 18. Maximum stress values under different clamping force.
The calculation results show that the stress of amorphous 3D coil core is larger at the place where a fixed constraint is applied and at the upper yoke of the core, the core stress changes less where the clamping force is not applied. The stress distribution of the core column changes greatly under the influence of external force and magnetostriction. In general, the core stress increases with the increase of clamping force, as shown in Figure 18.
Figure 19 shows the vibration displacement distribution of the core column position at 100 Hz under different clamping forces. To further investigate the vibration distribution of the amorphous core under different clamping forces, the vibration displacement distribution of point b on the core column in Figure 6b is extracted, and the results are shown in Figure 20.
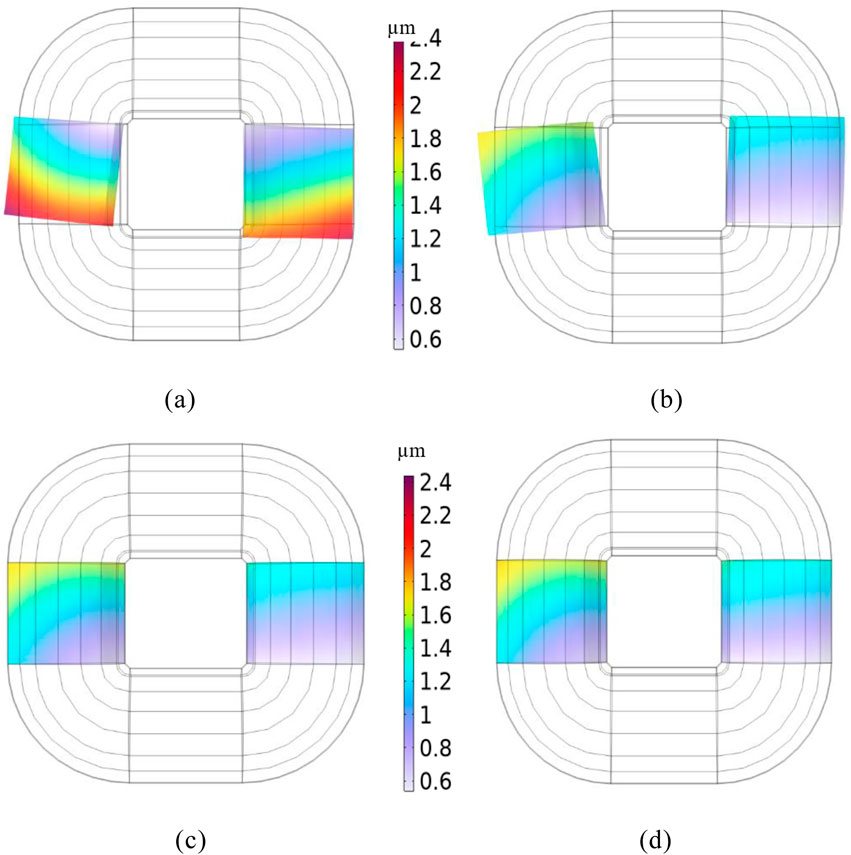
Figure 19. Vibration displacement distribution under different clamping forces. (a) 0 kPa. (b) 20 kPa. (c) 40 kPa. (d) 60 kPa.
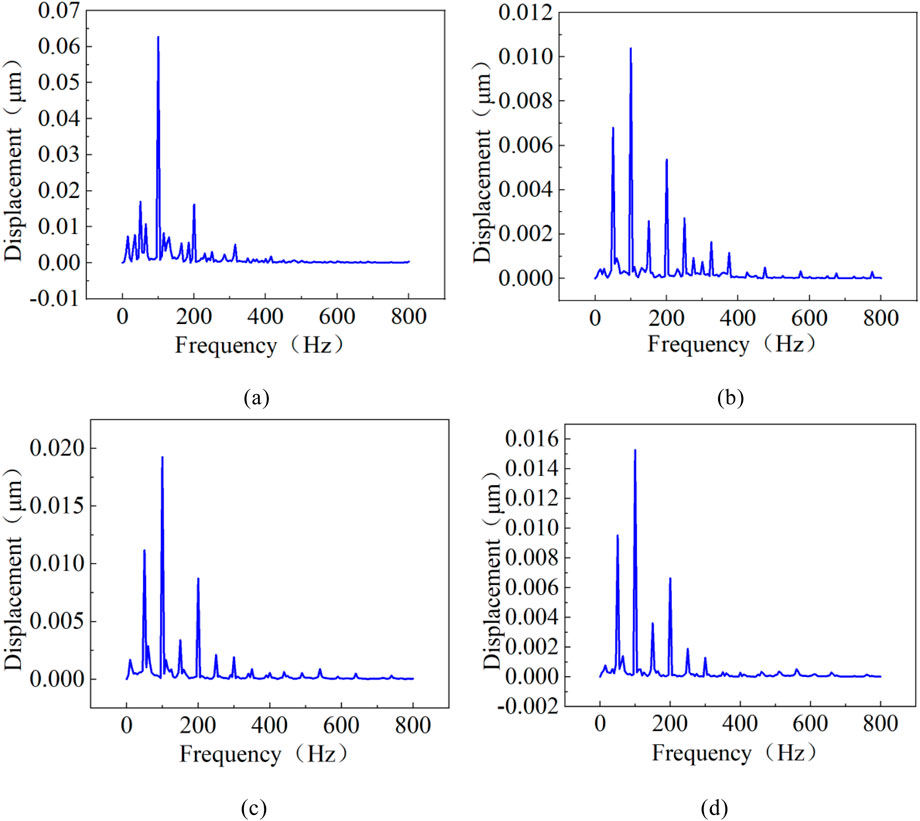
Figure 20. Spectrogram under different clamping forces. (a) 0 kPa. (b) 20 kPa. (c) 40 kPa. (d) 60 kPa.
As shown in Figures 20, 21, the vibration displacement of core is the smallest at 20 kPa. The vibration amplitude of the core is concentrated at 100 Hz, and its vibration energy is concentrated within 100–300 Hz. Through the analysis of the vibration displacement spectrum of the amorphous alloy 3D wound core under different clamping forces, it can be concluded that the change of the clamping force will affect the mechanical vibration under the same working state. The amorphous alloy 3D wound core is wound by strip. Applying a clamping force can effectively suppress the vibration, but the influence of the clamping force on the magnetostriction of each strip must also be taken into account. Selecting an appropriate clamping force can effectively reduce the vibration of the core during the operation of the transformer, but when the clamping force is too large, the vibration will be intensified.
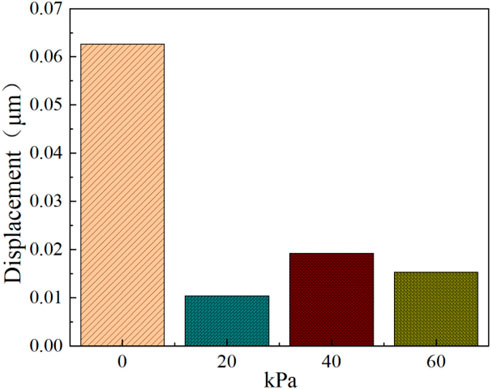
Figure 21. Vibration displacement amplitude of core under different clamping forces.
5 Conclusion
Based on the structural characteristics of amorphous alloy 3D wound core, a magnetic property experimental platform is built and the measurement of the basic magnetization and magnetostrictive characteristics of amorphous alloy 3D wound core is obtained. The magnetic field and vibration noise of the amorphous 3D wound core transformer is calculated and analyzed. The vibration noise of the prototype core under different working magnetic density is measured. The stress and vibration displacement changes under different clamping forces are compared and analyzed.
(1) The vibration characteristics of amorphous alloy material can be significantly changed when different frequencies are excited. Under the same amplitude excitation, the maximum value of amorphous vibration under 100 Hz excitation is decreases significantly compared with the fundamental frequency excitation.
(2) Based on the magnetic-mechanical-noise coupling model, the vibration and noise of a 50 kVA single-frame amorphous 3D wound core under different operating conditions were compared and analyzed. The error between the simulated noise values and the experimental values was less than 5%, verifying the accuracy and effectiveness of the model.
(3) After verifying the accuracy of the simulation model, a systematic calculation and analysis of the vibration of amorphous cores under different clamping forces was conducted. The results show that the vibration characteristics of amorphous alloy 3D wound change significantly under clamping forces. When the clamping force is 20 kPa, the displacement of the amorphous wound core column is the smallest, decreasing by 22.8% compared to no clamping force, indicating that the clamping force can effectively suppress the vibration of amorphous cores. However, when the clamping force exceeds a certain range, the amplitude of the core column vibration displacement increases, and the vibration displacement and clamping force have a complex nonlinear relationship. At the same time, the vibration amplitude of the amorphous core mainly occurs at 100 Hz, providing theoretical support for avoiding resonance in amorphous 3D wound cores.
In the later stage, a certain clamping force will be applied to the amorphous alloy 3D wound core, and experimental investigated will be carried out.
Data availability statement
The original contributions presented in the study are included in the article/supplementary material, further inquiries can be directed to the corresponding author.
Author contributions
JH: Formal Analysis, Writing – review and editing. XY: Formal Analysis, Writing – review and editing. XW: Formal Analysis, Writing – review and editing. YY: Formal Analysis, Writing – review and editing. EZ: Validation, Writing – review and editing. ZH: Formal Analysis, Writing – review and editing. LZ: Formal Analysis, Writing – review and editing. ZY: Data curation, Formal Analysis, Writing – original draft. MZ: Formal Analysis, Validation, Writing – original draft.
Funding
The author(s) declare that no financial support was received for the research and/or publication of this article.
Conflict of interest
Authors JH, XY, EZ, ZH, and LZ were employed by Longyuan New Energy Co., Ltd. Authors XW and YY were employed by Xi’an Thermal Power Research Institute Co., Ltd.
The remaining authors declare that the research was conducted in the absence of any commercial or financial relationships that could be construed as a potential conflict of interest.
Generative AI statement
The author(s) declare that no Gen AI was used in the creation of this manuscript.
Publisher’s note
All claims expressed in this article are solely those of the authors and do not necessarily represent those of their affiliated organizations, or those of the publisher, the editors and the reviewers. Any product that may be evaluated in this article, or claim that may be made by its manufacturer, is not guaranteed or endorsed by the publisher.
References
Alvarez, K. L., Martín, J. M., Ipatov, M., Dominguez, L., and Gonzalez, J. (2018). Magnetic properties of annealed amorphous Fe72.5Si12.5B15 alloy obtained by gas atomization technique. IEEE Trans. Magn. 54 (11), 1–5. Art no. 2002405. doi:10.1109/tmag.2018.2839258
Chen, D., Hou, B., Feng, Z., and Bai, B. (2019). Study of magnetostriction influence of electrical sheet steel under different DC biases. IEEE Trans. Magn. 55 (2), 1–5. doi:10.1109/tmag.2018.2873785
Du, B. X., and Liu, D. S. (2015). Dynamic behavior of magnetostriction-induced vibration and noise of amorphous alloy cores. IEEE Trans Magn 51 (4), 1–8. doi:10.1109/tmag.2014.2358960
Hu, J., Liu, D., Liao, Q., Yang, Y., and Shanshan, L. (2016). Electromagnetic vibration noise analysis of transformer windings and core. IET Electr. Power Appl. 10 (2), 251–257. doi:10.1049/iet-epa.2015.0309
Li, Y., Yang, Z., Zhang, C., and Mu, S. (2022a). Vibration and noise measurement of medium-high frequency transformer cores under non-sinusoidal excitation. IEEE Trans. Magn. 58 (8), 1–5. doi:10.1109/tmag.2022.3157669
Li, Y., Yang, C, Z., Zhang, C., and Mu, S. (2022b). Vibration and noise measurement of medium-high frequency transformer cores under non-sinusoidal excitation. IEEE Trans. Magnetics 58 (8), 1–5. doi:10.1109/tmag.2022.3157669
Liu, D., Liu, L., and Qiu, H. (2024a). “Active noise reduction of amorphous alloy three-dimensional coiled cores,” in 2024 11th international forum on electrical engineering and automation (IFEEA) (Shenzhen, China), 316–319.
Liu, D., Liu, L., and Qiu, H. (2024b). “Active noise reduction of amorphous alloy three-dimensional coiled cores,” in 2024 11th international forum on electrical engineering and automation (IFEEA). Shenzhen, China, 316–319.
Mizuta, T., Tani, Y., and Fujiwara, K. (2018). Magnetic property of amorphous magnetic thin ribbon and its laminated bulk under tensile and compressive stresses. IEEE Trans. Magn. 54 (11), 1–5. doi:10.1109/tmag.2018.2829191
Romaric, K. N., Liu, D., and Du, B. (2022). Investigation on vibration characteristics of amorphous metal alloy core dry-type distribution transformer. CES Trans Elect Mach Syst 6 (3), 324–331. doi:10.30941/cestems.2022.00042
Sato, T., and Todaka, T. (2018). Effect of magnetic annealing on magnetic characteristic of amorphous wound core. IEEE Trans. Magn. 54 (11), 1–4. doi:10.1109/tmag.2018.2847698
Sun, S., Jiang, F., Li, T., Xu, B., and Yang, K. (2020). Comparison of A Multi-Stage axial flux permanent magnet machine with different stator core materials. IEEE Trans Appl Supercond 30 (4), 1–6. doi:10.1109/tasc.2020.2990761
Wang, Z., Fan, Z., Zhang, Y., Ren, Z., Chen, D., and Seop Koh, C. (2024). Magnetostriction model of electrical steel sheets considering temperature gradient. IEEE Trans. Magn. 60 (12), 1–4. doi:10.1109/tmag.2024.3462472
Wu, S., Li, W., Tong, W., and Tang, R. (2019). Electromagnetic vibration and noise comparison of amorphous metal PMSMs and silicon steel PMSMs. IEEE Access 7, 62672–62680. doi:10.1109/access.2019.2916391
Wu, S., Tong, W., Sun, R., and Tang, R. (2018). A generalized method of electromagnetic vibration analysis of amorphous alloy permanent magnet synchronous machines. IEEE Trans. Magn. 54 (11), 1–5. doi:10.1109/tmag.2018.2852800
Zhang, J., Cui, R., Wei, Y., Yu, D., Xie, S., Fang, S., et al. (2023). Optimization and experimental validation of amorphous alloy high-speed asynchronous motor for simultaneous reduction on core and copper losses. IEEE Access 11, 101112–101122. doi:10.1109/access.2023.3312992
Zhang, P., Li, L., Cheng, Z., Tian, C., and Han, Y. (2019). Study on vibration of iron core of transformer and reactor based on Maxwell stressand anisotropic magnetostriction. IEEE Trans. Magn. 55 (2), 1–5. doi:10.1109/tmag.2018.2875017
Zhang, W., Yang, Q., Li, Y., Lin, Z., and Yang, M. (2022). Temperature dependence of powder cores magnetic properties for medium-frequency applications. IEEE Trans. Magn. 58 (2), 1–5. doi:10.1109/tmag.2021.3092013
Keywords: amorphous alloy, clamping force, magnetization characteristic, Magnetostriction, electromagnetic vibration
Citation: Han J, Yao X, Wang X, Yan Y, Zhu E, He Z, Zhang L, Yu Z and Zhan M (2025) Research on vibration and noise of amorphous alloy 3D wound core transformer considering magnetostrictive effect. Front. Mater. 12:1561567. doi: 10.3389/fmats.2025.1561567
Received: 18 January 2025; Accepted: 02 April 2025;
Published: 16 April 2025.
Edited by:
Raffaele Ardito, Polytechnic University of Milan, ItalyReviewed by:
Zhiyi Ding, University of Shanghai for Science and Technology, ChinaTadeusz Szumiata, Kazimierz Pułaski University of Technology and Humanities in Radom, Poland
Copyright © 2025 Han, Yao, Wang, Yan, Zhu, He, Zhang, Yu and Zhan. This is an open-access article distributed under the terms of the Creative Commons Attribution License (CC BY). The use, distribution or reproduction in other forums is permitted, provided the original author(s) and the copyright owner(s) are credited and that the original publication in this journal is cited, in accordance with accepted academic practice. No use, distribution or reproduction is permitted which does not comply with these terms.
*Correspondence: Mengyu Zhan, MTU3MDM5NDA2OTdAMTYzLmNvbQ==