 Shengya He1Hengyi Li1Liang Ye1He Huang1Wei Peng1
 Peng Xie2,3*
 Zhijia Wang2Youliang Zhang2Shu Lin2Haijia Wen4Zhanfeng Fan3,5Huchen Duan6
- 1Guangzhou Metro Design & Research Institute Co., Ltd., Guangzhou, China
- 2College of Civil Engineering and Architecture, Hainan University, Haikou, China
- 3Sichuan Engineering Research Center for Mechanical Properties and Engineering Technology of Unsaturated Soils, Chengdu University, Chengdu, China
- 4School of Civil Engineering, Chongqing University, Chongqing, China
- 5School of Architecture and Civil Engineering, Chengdu University, Chengdu, China
- 6College of Aerospace Engineering and Mechanics, Tongji University, Shanghai, China
During tunnel excavation in a soft soil stratum, a transparent model test can present the whole failure process, and a similar transparent material with stable physical and mechanical properties is essential for obtaining valid experimental results. Therefore, a new type of similar transparent material was developed in which fused quartz sand served as the coarse aggregate, nanoscale hydrophobic fumed silica powder acted as the binder, and a mixture of n-dodecane and 15# white oil was used as the pore fluid. The key parameters of the developed similar transparent material, including unit weight, internal friction angle, cohesion, and compression modulus, were evaluated. Furthermore, the consistency between the similar transparent material and natural soft soil was verified in three aspects, namely, physical properties, compressive strength characteristics, and shear properties. Finally, appropriate adjustment measures were proposed based on the results of the analysis of variance (ANOVA) and the analysis of range (ANOR) to meet the similarity requirements of parameters under different engineering conditions.
1 Introduction
Global urbanization and the growth of megacities are accompanied by the increasing use of underground space and new subway projects (Shi and Li, 2015). However, when subway tunnels pass through soft soil areas, surface subsidence and tunnel face collapse are prone to occur, leading to accidents with casualties, property losses, and environmental damage (Jia et al., 2023). Soft and muddy soils of marine, lacustrine, and transitional marine origin are frequently encountered in subway projects across China, located in the Yangtze River and Pearl River Deltas and coastal plains (Chao and Hong, 2023). China’s largest megacity, Shanghai, is a typical soft soil area (Shi, 2010; Vu et al., 2015), where muddy soils with a thickness of approximately 6–20 m are widely distributed throughout the construction area of the Shanghai subway. Therefore, accurate prediction and prevention of the failure processes during tunnel excavation in soft soil strata are critical for the safe operation of subway systems.
The proper selection and preparation of similar materials are crucial for these purposes (Chai et al., 2019). Chen and Wada (1986) proposed using transparent glass beads or quartz powder as aggregates of similar transparent materials, which inspired more researchers to use silicon oxide materials. For example, Iskander et al. (2002) studied the transparency and mechanical properties of a mixture of silica powder and oil, and the results indicated that the transparent clay was similar to natural clay. Hird and Stanier (2010) compared transparent clays made from amorphous silica powder and fumed silica and found that the transparency and speckle effect of fumed silica-based transparent clay were superior, enabling better observation of internal migration characteristics in soil. Ads et al. (2021) simulated natural clay using Laponite RD. Zhou (2021) developed transparent clay using silica powder as the soil skeleton, combined with a mixed solvent of 15# white oil and n-dodecane (with matching refractive indices), and investigated its physical and mechanical properties. Leng et al. (2021) formulated a similar transparent material for soft rock using fused quartz as the skeleton, hydrophobic fumed silica powder as the binder, and a mixture of 15# white oil and n-dodecane as the pore fluid. Ma et al. (2021) used quartz sand, nanoscale silica, and n-dodecane mixed with 15# white oil to configure a similar transparent material. In addition, NaOH + U10 powder, AVC copolymer, and sodium polyacrylate cross-linked polymer were also introduced to simulate soft clay (Kong, 2020; Liang et al., 2019; Wu et al., 2020). A sucrose solution and a brine mixture were used instead of mineral oil to prepare transparent soil (Zhang et al., 2020).
In summary, studies on transparent soil are still in the early stages, and the lack of strength and control over the mechanical parameters (unit weight, internal friction angle, cohesion, and compression modulus) of transparent soil needs to be addressed. Therefore, considering the requirements of material transparency and similarity, a new type of similar transparent material was developed, and the consistency between this material and natural soft soil was verified in terms of physical nature, compressive strength characteristics, and shear properties. Finally, adjustment measures were proposed to meet the similarity requirements of parameters under different engineering conditions.
2 Material and methods
In this paper, fused quartz sand was used as the coarse aggregate, nanoscale hydrophobic fused silica powder was used as the binder, and a mixture of n-dodecane and 15# white oil was used as the pore fluid. The three types of raw materials had the same refractive index of 1.4585, which met the transparency principle requirements, as shown in Table 1.

Table 1. Parameters and manufacturers of raw materials.
To determine the inherent properties and shear characteristics of natural soft soil, unit weight γ, internal friction angle φ, cohesion c, and compression modulus Es were used as evaluation indices. The particle size of quartz sand and the fumed silica-to-fused quartz mass ratio (further referred to as the cement–stone ratio) were determined to be the two main influencing factors. The preparation scheme of materials is summarized in Table 2.

Table 2. Test schemes of material proportions.
Sample fabrication comprised the following five steps (see Figure 1).
(1) Pore fluid preparation (n-dodecane mixed with 15# white oil): to meet the transparency requirements, we obtained the pore fluid by mixing n-dodecane with 15# white oil thoroughly to a volume ratio of 12:400, and we controlled the temperature below 20°C.
(2) Binder-made faction: we determined the quality of moist quartz sand and silica powder based on the pore fluid quality and the cement–stone ratio value. When the amount of quartz sand was constant, the cement–stone ratio increased by 5%, and the minimum quality of mixed oil added was 5% of the added sand mass quality.
(3) Mixture stirring: first, we divided the silica powder into 8 to 10 groups and added them to the pore fluid in the proper sequence. After adding each group, the mixture was stirred for more than 5 min using a glass rod. After thorough stirring, the mixture became milky white and uniform in texture. Subsequently, we added fused quartz particles.
(4) Model filling: we poured the mixture into a glass box, and the size of the glass box was 150 mm × 150 mm × 150 mm.
(5) Vacuum pumping: we prepared 2–3 times the amount of pore fluid in step 1 and added the same amount of fluid to the glass box. First, we vacuumed the test piece for 1 h at a vacuum pumping pressure of −0.1 MPa. Then, we added the remaining fluid and vacuumed the test piece for 2 h. Finally, we compressed the test piece until it could not be pressed further to obtain the standard similar transparent material (Figure 2).
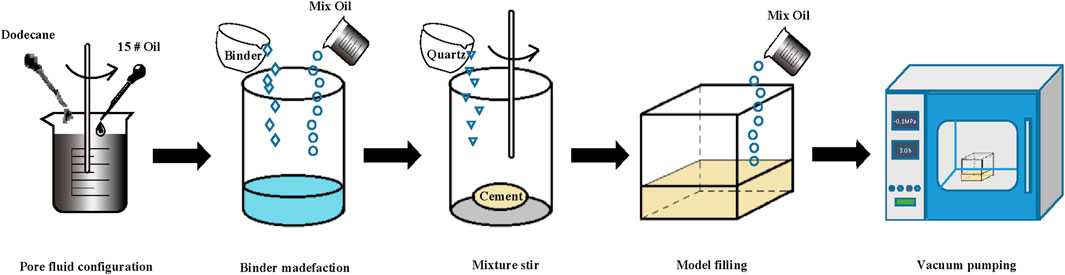
Figure 1. Configuration process of transparent cemented soil.
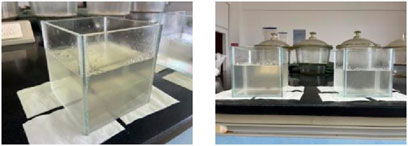
Figure 2. Transparent cemented soil.
The original data on the similar transparent material’s main physical and mechanical parameters (unit weight γ, internal friction angle φ, cohesion c, and compression modulus Es) were measured through density and oil content tests, the standard consolidated test, and rapid consolidation shear tests (Ministry of Housing and Urban–Rural Development of the People’s Republic of China, 2019). The results are depicted in Figure 3 and tabulated in Table 3.
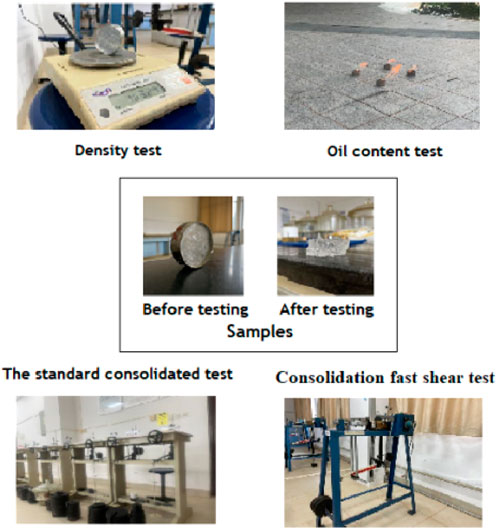
Figure 3. Parameter test of transparent cemented soil. (a) 1–0.5 mm 10% e–p curve. (b) 1–0.5 mm 15% e–p curve. (c) 1–0.5 mm 20% e–p curve. (d) 2–1 mm 10% e–p curve. (e) 2–1 mm 15% e–p curve. (f) 2–1 mm 20% e–p curve. (g) 5–3 mm 10% e–p curve. (h) 5–3 mm 15% e–p curve. (i) 5–3 mm 20% e–p curve.
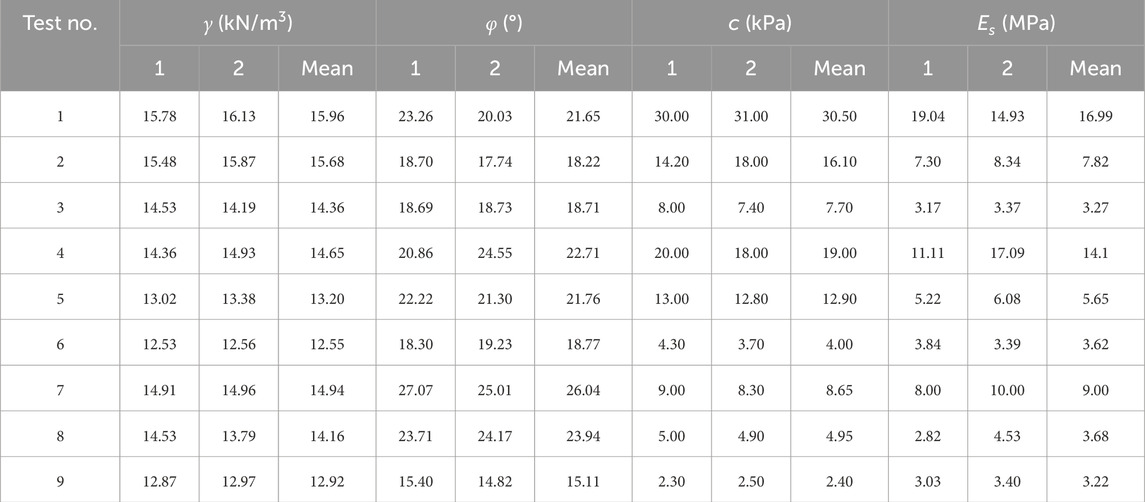
Table 3. Orthogonal test and the experimental data.
3 Analysis of orthogonal test results
3.1 Feasibility of similar transparent material
To verify the feasibility of using a similar transparent material to simulate natural soft soil, we assessed the consistency between the similar transparent material and natural soft soil in terms of physical properties, compressive strength characteristics, and shear properties.
3.1.1 Physical nature
To compare the quantitative relationship between the parameters of natural soft soil and those of similar transparent material, the parameters of marine, lake, and delta soils in southern China were summarized, as shown in Table 4 (Editorial Committee of Engineering Geology Handbook, 2007; Meng, 2020). The parameters’ range (γ, c, φ, and Es) for the similar transparent material covered all or most of the parameters’ range of natural soft soil. The consolidation coefficient (Cv) was obtained using the square-root time method (Ministry of Housing and Urban–Rural Development of the People’s Republic of China, 2019), and its range was between 7.87 × 10⁻⁴ and 1.77 × 10⁻² cm2/s. The Cv range for the similar transparent material was consistent with that of natural soft soil (between 10−4 and 10−2 cm2/s) (Wu, 2013; Zhang et al., 2013). The results indicate that the parameters (ω0, e0, and av) of the similar transparent material met the requirements of the similarity criterion.
Table 4. Parameters of natural soft soil and transparent cemented soil.
3.1.2 Compressor strength characteristics
The e–p curves (Figure 4) and e–lgp curves (Figure 5) were plotted using the standard consolidated test data. Since they demonstrate the same trends, the plots in Figures 5b, 6b were selected as typical examples. Figure 6 presents the e–p and e–lgp curves of samples from the soft soil at Shenzhen Airport, Shenzhen Bay silt soft soil, and transparent cement soil (Wei, 2013). The e–p curve had a downward convex shape, and the curvature decreased with a decrease in the porosity ratio (Figure 6a). The e–lgp curve displayed an S-shape with an obvious inflection point (Figure 6b). The deformation characteristics of transparent cemented soil were similar to those of natural soft soil.
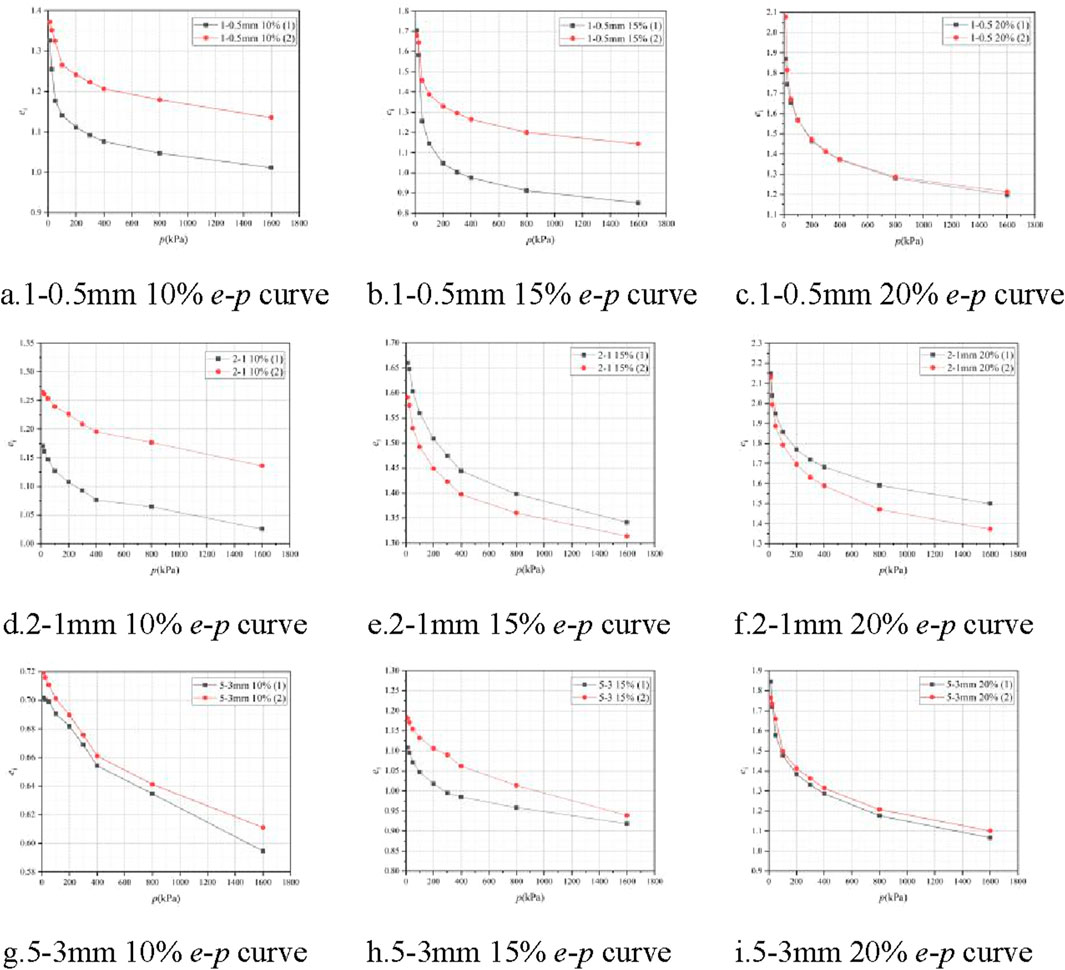
Figure 4. e–p curves of transparent cemented soil. (a) 1–0.5 mm 10% e–p curve. (b) 1–0.5 mm 15% e–p curve. (c) 1–0.5 mm 20% e–p curve. (d) 2–1 mm 10% e–p curve. (e) 2–1 mm 15% e–p curve. (f) 2–1 mm 20% e–p curve. (g) 5–3 mm 10% e–p curve. (h) 5–3 mm 15% e–p curve. (i) 5–3 mm 20% e–p curve.
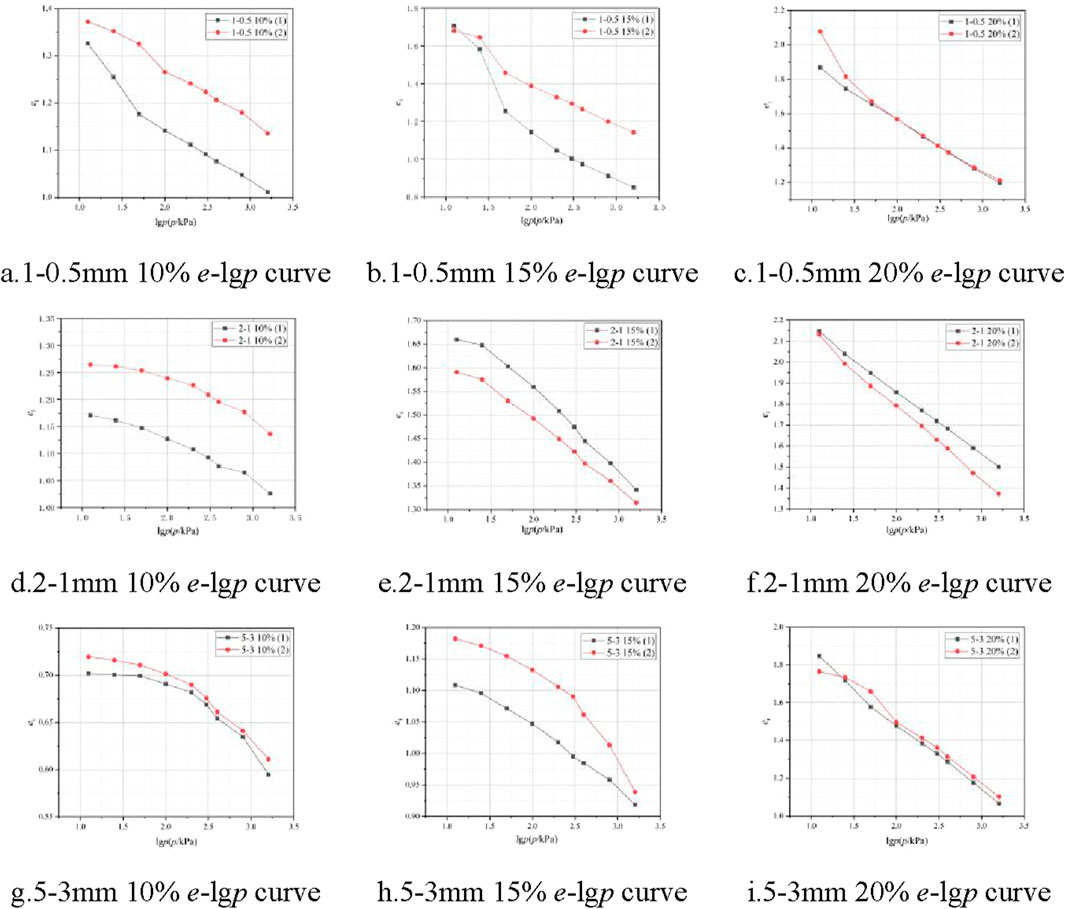
Figure 5. e–lgp curves of transparent cemented soil. (a) 1–0.5 mm 10% e–lgp curve. (b) 1–0.5 mm 15% e–lgp curve. (c) 1–0.5 mm 20% e–lgp curve. (d) 2–1 mm 10% e–lgp curve. (e) 2–1 mm 15% e–lgp curve. (f) 2–1 mm 20% e–lgp curve. (g) 5–3 mm 10% e–lgp curve. (h) 5–3 mm 15% e–lgp curve. (i) 5–3 mm 20% e–lgp curve.
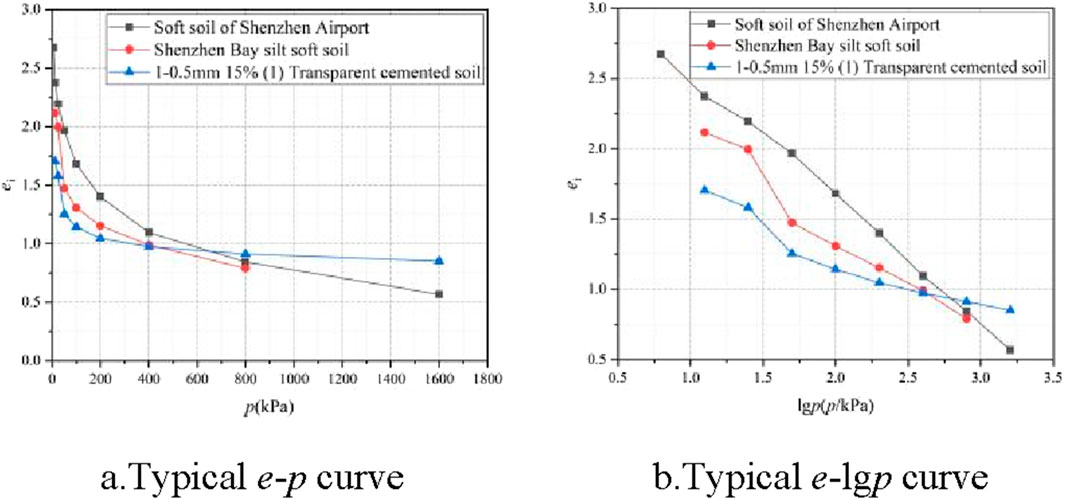
Figure 6. Standard consolidation test typical curve of transparent cemented soil. (a) 1–0.5 mm 10% shear stress–shear displacement curves. (b) 1–0.5 mm 10% shear stress–shear displacement curves. (c) 1–0.5 mm 15% shear stress–shear displacement curves. (d) 1–0.5 mm 15% shear stress–shear displacement curves. (e) 1–0.5 mm 20% shear stress–shear displacement curves. (f) 1–0.5 mm 20% shear stress–shear displacement curves. (g) 2–1 mm 10% shear stress–shear displacement curves. (h) 2–1 mm 10% shear stress–shear displacement curves. (i) 2–1 mm 15% shear stress–shear displacement curves. (j) 2–1 mm 15% shear stress–shear displacement curves. (k) 2–1 mm 20% shear stress–shear displacement curves. (l) 2–1 mm 20% shear stress–shear displacement curves. (m) 5–3 mm 10% shear stress–shear displacement curves. (n) 5–3 mm 10% shear stress–shear displacement curves. (o) 5–3 mm 15% shear stress–shear displacement curves. (p) 5–3 mm 15% shear stress–shear displacement curves. (q) 5–3 mm 20% shear stress–shear displacement curves. (r) 5–3 mm 20% shear stress–shear displacement curves.
3.1.3 Shear properties
According to the experimental data of the rapid consolidation shear tests, the shear stress–shear displacement curves were plotted, as shown in Figure 7.
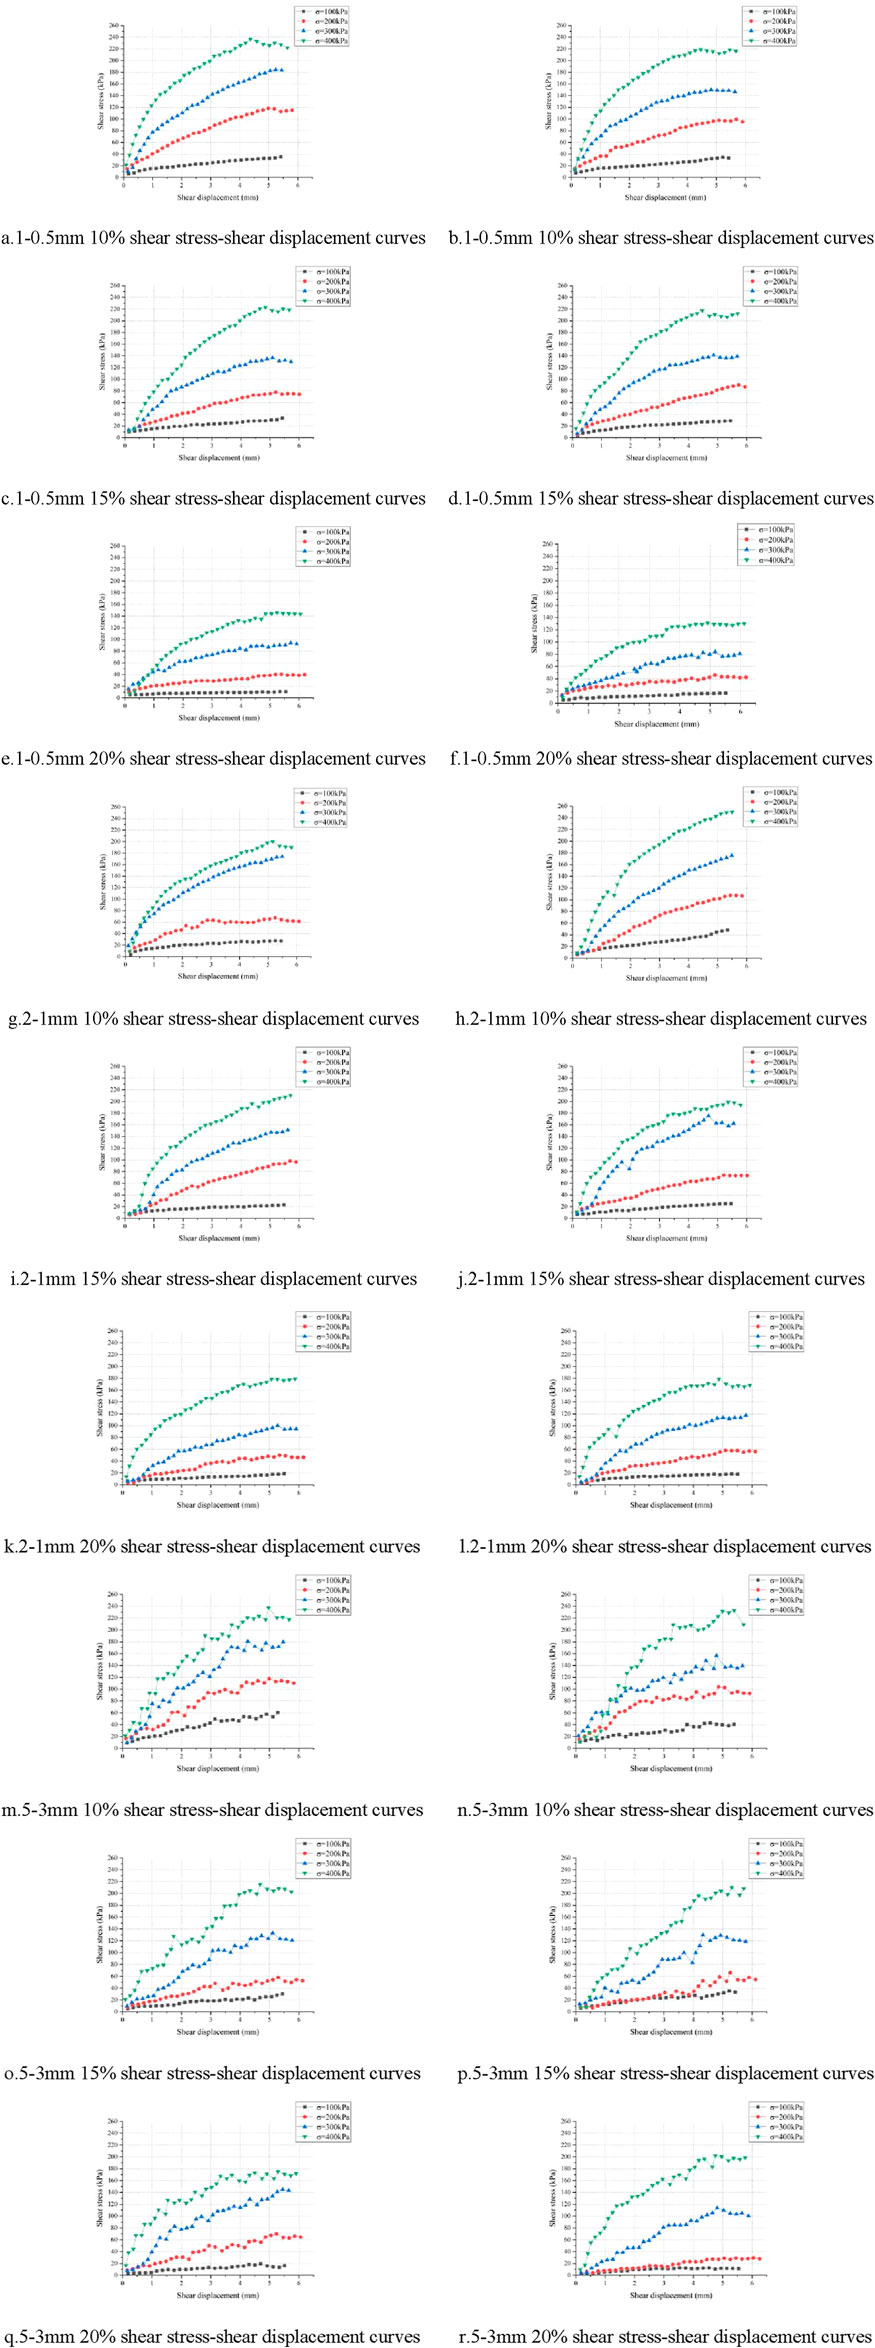
Figure 7. Shear stress–shear displacement curves of transparent cemented soil.
Since all shear stress–shear displacement curves in Figure 7 exhibited the same trend, the plot in Figure 7c was selected as a typical example to describe the curve characteristics. The curve contains three stages, namely, linear stage, yield stage, and after-tack stage. The relationship is linear in the initial loading period, with elastic deformation being the main component. As the value approaches the peak, the curvature gradually decreases. In the after-tack stage, shear deformation continues to increase, while the shear stress tends to be constant. Furthermore, Figure 8 integrates the normalized stress–displacement curves of soft soil at Shenzhen Airport, Shenzhen Bay silt soft soil, and transparent cemented soil (Zhou, 2021; Zhang et al., 2018; Zuo et al., 2016). The shear characteristics of the similar transparent material closely simulate those of natural soft soil.
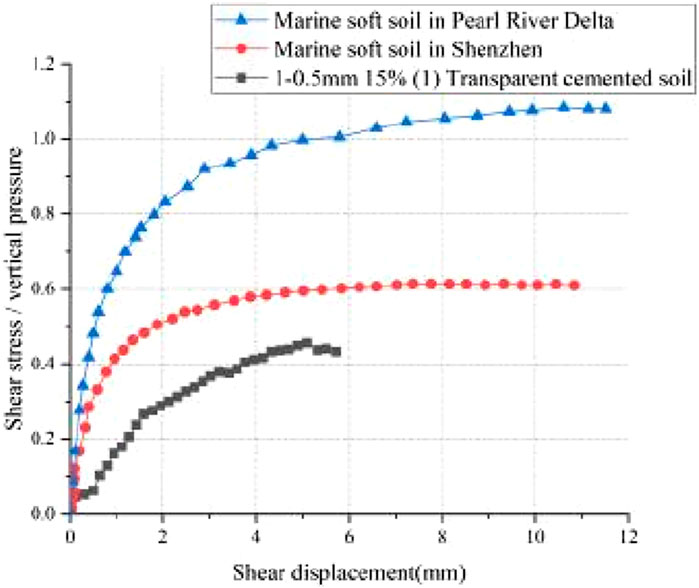
Figure 8. Normalized stress–displacement curves (soft soil in Shenzhen Airport, Shenzhen Bay silt soft soil, and transparent cement soil). (a) Visual analysis of the unit weight γ. (b) Visual analysis of the internal friction angle φ. (c) Visual analysis of the cohesion c. (d) Visual analysis of the compression modulus Es.
3.2 Sensitivity analysis and adjustment measure development
Reasonable adjustment measures are a precondition for ensuring that the parameters of similar transparent materials align with those of natural soft soil. Therefore, a sensitivity analysis of the influencing factors on the main physical and mechanical parameters was conducted, and corresponding adjustment measures were developed.
3.2.1 Unit weight γ
3.2.1.1 Analysis of variance
Based on experimental data, the analysis of variance (ANOVA) results were obtained. They are tabulated in Table 5, where the F values of particle size and the cement–stone ratio are 50.296 and 49.646, respectively. At a significance level of α = 0.05 and using the degrees of freedom from the experimental data, the critical F-values were calculated as follows: F0.05 (2,13) was equal to 3.81 and F0.01 (2,13) was equal to 6.70. The F-value of particle size and cement–stone ratio exceeded the critical value, indicating that they all play an important role in the unit weight γ. Notably, particle size had the highest level of significance.
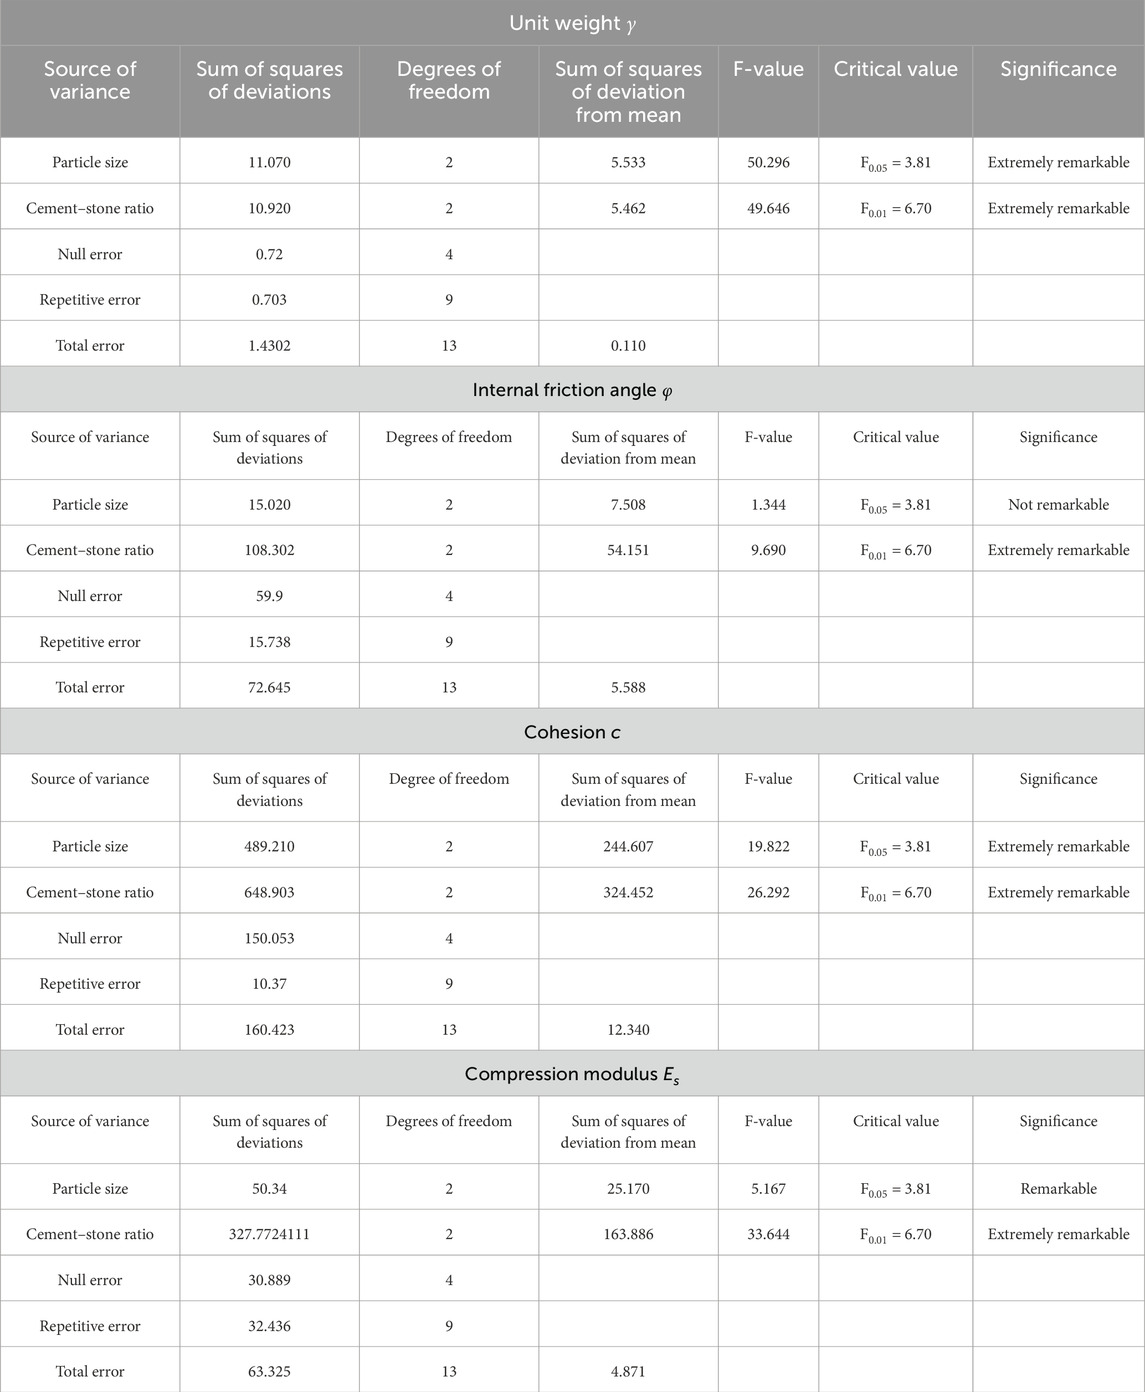
Table 5. Variance analysis on the unit weight γ, internal friction angle φ, cohesion c, and compression modulus Es.
3.2.1.2 Analysis of range
To analyze the variation trend in the unit weight γ, an analysis of range (ANOR) was performed, and the results are listed in Table 6. The parameter Kgi represents the sum of corresponding test results when the level number is i in any column, while kgi is the ratio between Kgi and s, where s represents the number of occurrences at either level.
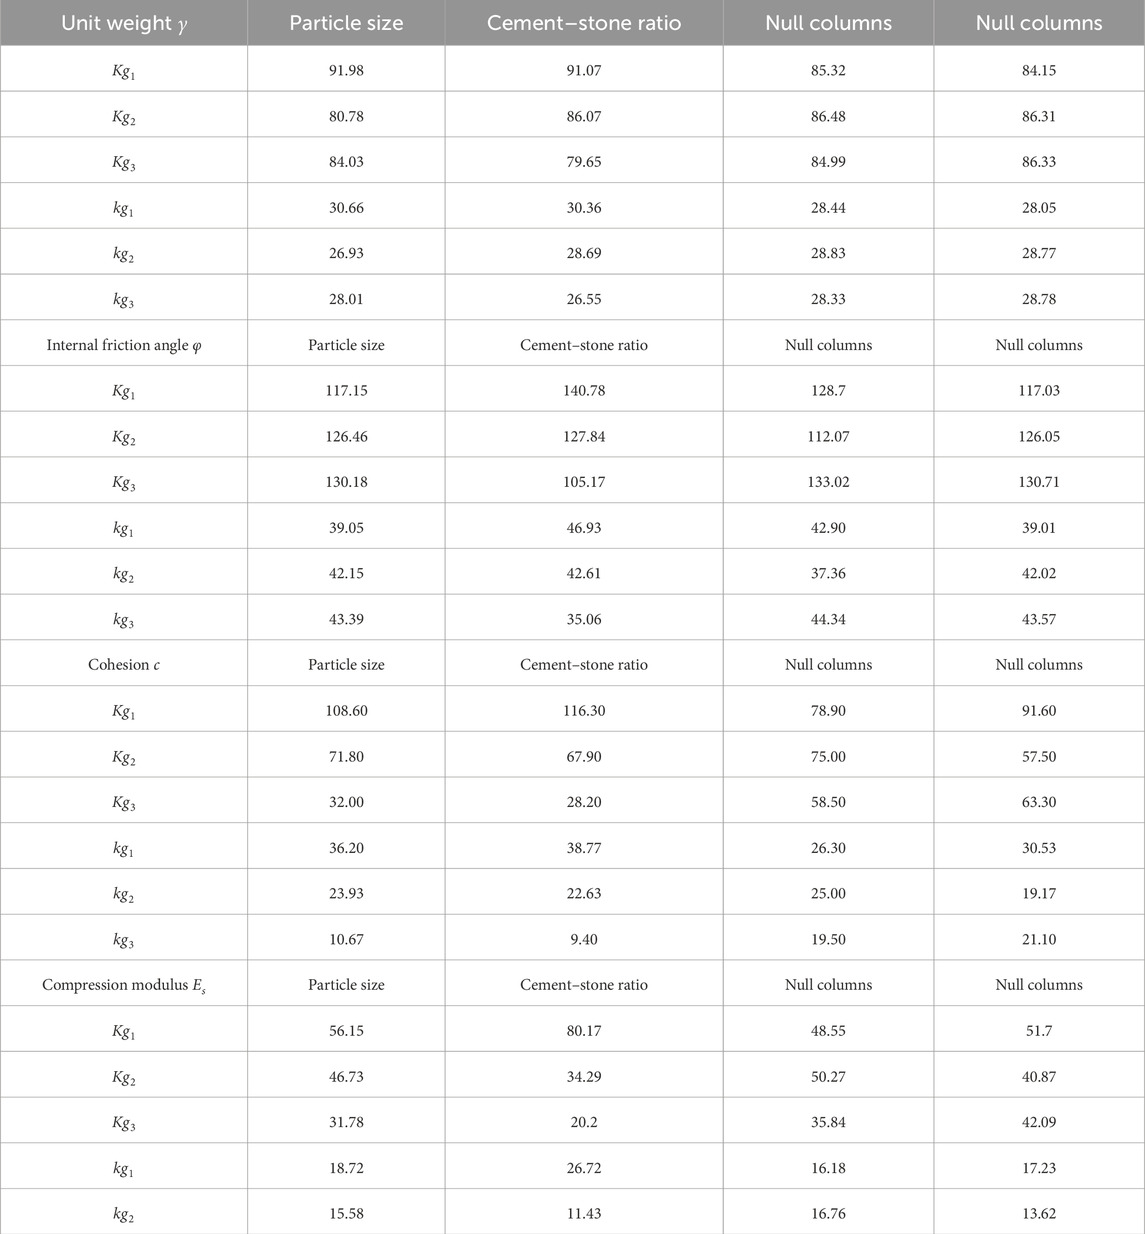
Table 6. Analysis of range on the unit weight γ, internal friction angle φ, cohesion c, and compression modulus Es.
Using the results in Table 6, visual analysis charts of particle size and cement–stone ratio are drawn in Figure 9a. The value of the unit weight γ increased first and then decreased with an increase in particle size, and the value of unit weight γ decreased with an increase in the cement–stone ratio.
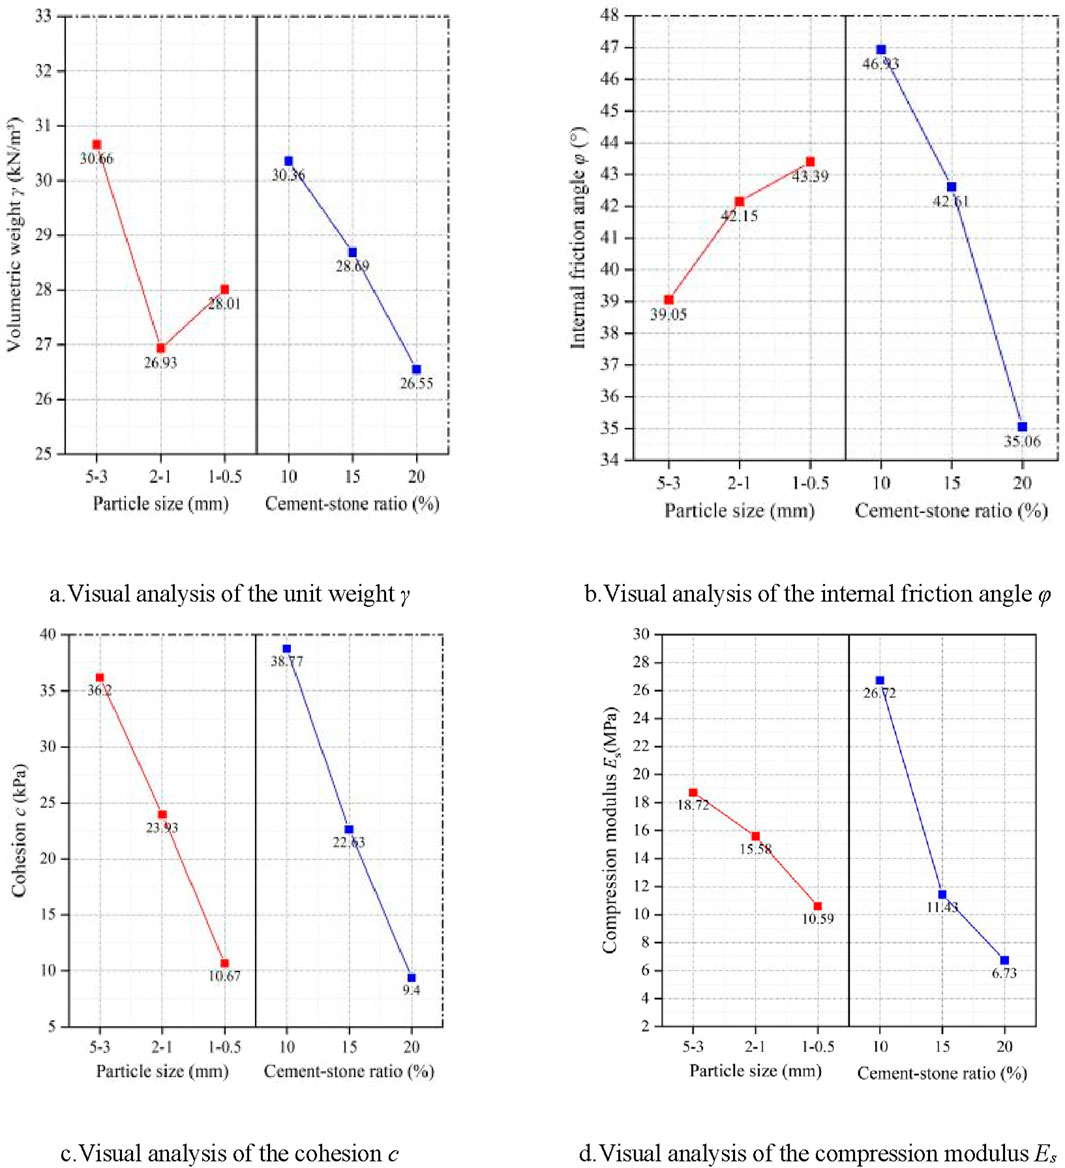
Figure 9. Visual analysis of the unit weight γ, internal friction angle φ, cohesion c, and compression modulus Es.
According to the sensitivity analysis results of the unit weight γ, to ensure that the unit weight γ of the similar transparent material meets the required value, the particle size and cement–stone ratio were adjusted. They both achieved the objective, while the particle size adjustment had a higher priority. At a cement–stone ratio of 20%, the particle size reduced from 5–3 mm to 1–0.5 mm, and the unit weight γ value decreased from 12.92 to 12.55 kN/m3 and then increased to 14.36 kN/m3. At a cement–stone ratio of 15%, the particle size decreased from 5–3 mm to 1–0.5 mm, and the unit weight γ value decreased from 14.16 to 13.20 kN/m3 and then increased to 15.68 kN/m3. At a cement–stone ratio of 10%, the particle size decreased from 5–3 mm to 1–0.5 mm, and the unit weight γ value decreased from 14.94 to 14.65 kN/m3 and then increased to 15.96 kN/m3. When the particle size was unchanged and the cement–stone ratio was adjusted, the following trend was observed. At a particle size of 5–3 mm, when the cement–stone ratio decreased from 20% to 10%, the unit weight γ increased from 12.92 to 14.16 kN/m3 and then to 14.94 kN/m3. For a particle size of 2–1 mm, when the cement–stone ratio decreased from 20% to 10%, the unit weight γ increased from 12.55 to 13.2 kN/m3 and then to 14.65 kN/m3. For a particle size of 1–0.5 mm, when the cement–stone ratio decreased from 20% to 10%, the unit weight γ increased from 14.36 to 15.68 kN/m3 and then to 15.96 kN/m3.
3.2.2 Internal friction angle φ
3.2.2.1 Analysis of variance
Based on the experimental data, ANOVA results were obtained and are listed in Table 5. The F-values of particle size and cement–stone ratio were 1.344 and 9.696, respectively. At a significance level of α = 0.05 and using the degrees of freedom from the experimental data, the critical F-values were calculated as follows: F0.05 (2,13) was equal to 3.81, while F0.01 (2,13) was equal to 6.70. The F-value of the cement–stone ratio exceeded the critical value, and the results indicate that the cement–stone ratio plays a vital role in the internal friction angle φ.
3.2.2.2 Analysis of range
To analyze the variation trend in the internal friction angle φ, ANOR was performed, and the results are shown in Table 6. Kgi represents the sum of corresponding test results when the level number is i in any column. kgi is the ratio between Kgi and s, where s is the number of occurrences at each level in either level.
Using the ANOR results in Table 6, visual analysis charts of particle size and cement–stone ratio are plotted, as shown in Figure 9b. The value of the internal friction angle φ is basically unchanged with a decrease in particle size, and the value of the internal friction angle φ decreases with an increase in the cement–stone ratio.
According to the sensitivity analysis results of the internal friction angle φ, to ensure that the internal friction angle φ of the similar transparent material meets the required value, the cement–stone ratio must be adjusted. For a particle size of 5–3 mm, when the cement–stone ratio decreased from 20% to 10%, the internal friction angle φ increased from 15.11° to 23.94° and then to 26.04°. For a 2–1 mm particle size, when the cement–stone ratio decreased from 20% to 10%, the internal friction angle increased from 18.77° to 21.76° and then to 22.71°. For a 1–0.5 mm particle size, when the cement–stone ratio decreased from 20% to 10%, the internal friction angle φ increased from 18.71° to 21.65°.
3.2.3 Cohesion c
3.2.3.1 Analysis of variance
Based on the experimental data, the ANOVA results were obtained and are summarized in Table 5. Here, the F-values of particle size and cement–stone ratio were 19.822 and 26.292, respectively. At a significant level of α = 0.05 and using the degrees of freedom from the experimental data, the critical F-values were calculated as follows: F0.05 (2,13) was equal to 3.81, while F0.01 (2,13) was equal to 6.70. The F-values of the particle size and cement–stone ratio were more significant than the critical value. These results indicated that they all played an essential role in cohesion c. In addition, the significance level of the cement–stone ratio exceeded that of particle size.
3.2.3.2 Analysis of range
To analyze the change in cohesion c, ANOR was performed, and the results are shown in Table 6. Kgi represents the sum of corresponding test results when the level number is i in any column. kgi is the ratio between Kgi and s. s represents the number of occurrences at either level.
Using the ANOR results in Table 6, visual analysis charts of particle size and cement–stone ratio were plotted, as shown in Figure 9c. The value of cohesion c decreased with increasing particle size and increased with higher cement–stone ratios.
According to the sensitivity analysis results of cohesion c, ensuring that the cohesion c of the similar transparent material meets the required value can be effectively achieved by adjusting the particle size and cement–stone ratio, with the cement–stone ratio adjustment being the top priority. For a particle size of 5–3 mm, when the cement–stone ratio decreased from 20% to 10%, cohesion c increased from 2.40 to 4.95 kPa and then to 8.65 kPa. For a particle size of 2–1 mm, when the cement–stone ratio decreased from 20% to 10%, cohesion c increased from 4.00 to 12.90 kPa and then to 19.00 kPa. For a particle size of 1–0.5 mm, when the cement–stone ratio decreased from 20% to 10%, cohesion increased from 7.70 to 16.10 kPa and then to 30.50 kPa. When the cement–stone ratio was unchanged and the particle size was adjusted, the change was as follows. At a cement–stone ratio of 20%, particle size decreased from 5 to 3 mm, and cohesion c increased from 2.40 kPa to 4.00 kPa and then to 7.70 kPa. At a cement–stone ratio of 15%, particle size reduced from 5 to 3 mm, and cohesion c increased from 4.95 to 12.90 kPa and then to 16.10 kPa. At a cement–stone ratio of 10%, the particle size decreased from 5 to 3 mm, and cohesion c increased from 8.65 to 19.00 kPa and then to 30.50 kPa.
3.2.4 Compression modulus Es
3.2.4.1 Analysis of variance
Based on the experimental data, ANOVA results were obtained and are summarized in Table 5. The F-values of particle size and cement–stone ratio were 5.167 and 33.644, respectively. At a significance level of α = 0.05 and using the degrees of freedom from the experimental data, the critical F-values were calculated as follows: F0.05 (2,13) was equal to 3.81, while F0.01 (2,13) was equal to 6.70. The F-value of the cement–stone ratio was more significant than the critical value, and the results indicate they all played an essential role in the compression modulus Es. In addition, the cement–stone ratio was more significant.
3.2.4.2 Analysis of range
ANOR was performed to analyze the compression modulus Es changing trend, and the results are shown in Table 6. Kgi represents the sum of corresponding test results when the level number is i in any column. kgi is the ratio between Kgi and s. s represents the number of occurrences at either level.
Using the result in Table 6, visual analysis charts of particle size and cement–stone ratio were plotted in Figure 9d. The compression modulus Es significantly decreases with a decrease in particle size and an increase in the cement–stone ratio.
According to the sensitivity analysis results of the compression modulus Es, to ensure that the modulus Es of the similar transparent material met the required value, the particle size and cement–stone ratio were adjusted, and the adjustment of the cement–stone ratio was the top priority. At a particle size of 5–3 mm, when the cement–stone ratio decreased from 20% to 10%, the Es value decreased from 3.27 to 7.82 MPa and then increased to 16.99 MPa. For a particle size of 2–1 mm, when the cement–stone ratio decreased from 20% to 10%, the Es value increased from 3.62 to 5.65 MPa and then to 14.1 MPa. For the particle size of 1–0.5 mm, when the cement–stone ratio decreased from 20% to 10%, the Es value increased from 3.22 to 3.68 MPa and then to 9.00 MPa. When the cement–stone ratio was unchanged and the particle size was adjusted, the change was as follows. At a cement–stone ratio of 20%, particle size decreased from 5–3 mm to 1–0.5 mm, and the Es value decreased from 3.27 to 3.62 MPa and then to 3.22 MPa. At a cement–stone ratio of 15%, particle size decreased from 5–3 mm to 1-0.5 mm, and the Es value decreased from 7.82 to 5.65 MPa and then to 3.68 MPa. At a cement–stone ratio of 10%, particle size decreased from 5–3 mm to 1–0.5 mm, and the Es value decreased from 16.99 to 14.1 MPa and then to 9.00 MPa.
4 Discussion
The failure process during tunnel excavation in a soft soil foundation can be efficiently simulated by similar transparent material tests. Considering the requirements of material transparency and similarity, this paper carried out an experimental study on mixing proportions of similar transparent materials via the orthogonal design. However, the performed similar material test had the following limitations: 1) the range of similar transparent material parameters was limited and needs to be expanded. 2) There were significant discrepancies in the experimental e–p curves, e–lgp curves, and shear stress–shear displacement curves of the proposed similar transparent material and natural soft soil samples, which need to be reduced by considering more influencing factors in the orthogonal design and developing more realistic similar transparent materials.
5 Conclusion
This study proposed a new type of similar transparent material, which can simulate the natural soft soil (marine, lacustrine, and delta soft soil). Its parameters’ range was found to nearly coincide with that of natural soft soils, exhibiting similar deformation characteristics and shear properties. In particular, when the unit weight of the similar transparent material changed from 16.13 to 12.53 kN/m3, its internal friction angle varied from 27.07° to 14.82°, cohesion varied from 31.00 to 2.30 kPa, the compression modulus ranged from 19.04 to 2.82 MPa, and the consolidation coefficient varied from 7.87 × 10⁻⁴ to 1.77 × 10⁻² cm2/s. Second, the similar transparent material’s e–p curves displayed a downward convex shape, while its e–lgp curves featured an S-shape with an obvious inflection point. Finally, the shear stress–shear displacement curves of similar transparent material samples showed the same trend, featuring three stages (linear, yield, and after-tack stages).
The parameters of the similar transparent material were mainly influenced by the particle size (particle size) of quartz sand and the fumed silica-to-fused quartz mass ratio (referred to as the cement–stone ratio). From a significance perspective, the particle size of quartz sand had a more noticeable effect on unit weight, and the impact of the cement–stone ratio on cohesion, compression modulus, and internal friction angle was more substantial. In terms of variation trends, as the particle size of quartz sand decreased, cohesion c and compression modulus Es decreased, while the internal friction angle φ was unchanged. In addition, the value of unit weight γ initially decreased and then increased. On the other hand, with a decrease in the cement–stone ratio, the values of unit weight γ, internal friction angle φ, and cohesion c increased, and the value of compression modulus Es first remained unchanged and then increased.
Similarity theory was used to calculate the parameters of similar transparent material samples used in the model test. Some adjustments were necessary when the similar transparent material parameters were inconsistent with those of the simulated soils. Due to the difference in F-values derived via ANOVA, the factors influencing the priority adjustment of each parameter differed: for unit weight γ, the particle size adjustment of quartz sand was prioritized, while for the internal friction angle φ, cohesion c, and compression modulus Es, the cement–stone ratio adjustment had the highest priority.
Data availability statement
The original contributions presented in the study are included in the article/supplementary material; further inquiries can be directed to the corresponding author.
Author contributions
SH: methodology and writing – original draft. HL: software and writing – original draft. LY: validation and writing – original draft. HH: formal analysis and writing – original draft. WP: investigation and writing – original draft. PX: conceptualization and writing – original draft. ZW: methodology, writing – original draft, and writing – review and editing. YZ: project administration, writing – original draft, and writing – review and editing. SL: data curation, writing – original draft, and writing – review and editing. HW: writing – review and editing. ZF: writing – original draft and validation. HD: writing – review and editing and visualization.
Funding
The author(s) declare that financial support was received for the research and/or publication of this article. The research on which this article is based has been supported by the following grants: the Hainan Provincial Natural Science Foundation of China (grant nos: 520QN229, 422RC599, and 122RC540); the National Natural Science Foundation of China (grant nos: 42002293 and 52068019); the Fund of Chongqing Key Laboratory of Facility Damage Mechanism and Protection in Highland Mountain Environment (grant no: LQ24KFJJ06); the Open Fund of Sichuan Engineering Research Center for Mechanical Properties and Engineering Technology of Unsaturated Soils (grant no: SC-FBHT0023-01); the Systematic Project of State Key Laboratory of Mechanical Behavior and System Safety of Traffic Engineering Structures, Shijiazhuang Tiedao University (grant no: KF2022-03); S&T Program of Hebei (grant no: 215676145H); and Sichuan Science and Technology Program (grant no: 2025YFHZ0321); the Innovation Platform for Academicians of Hainan Province (grant no: YSPTZX202320).
Acknowledgments
The authors are grateful for the support.
Conflict of interest
Authors SH, HL, LY, HH, and WP were employed by the Guangzhou Metro Design and Research Institute Co., Ltd.
The remaining authors declare that the research was conducted in the absence of any commercial or financial relationships that could be construed as a potential conflict of interest.
Generative AI statement
The author(s) declare that no Gen AI was used in the creation of this manuscript.
Publisher’s note
All claims expressed in this article are solely those of the authors and do not necessarily represent those of their affiliated organizations, or those of the publisher, the editors and the reviewers. Any product that may be evaluated in this article, or claim that may be made by its manufacturer, is not guaranteed or endorsed by the publisher.
References
Ads, A., Shariful, I. M., and Iskander, M. (2021). Effect of face losses and cover-to-diameter ratio on tunneling induced settlements in soft clay, using transparent soil models. Geotechnical Geol. Eng. 39 (8), 5529–5547. doi:10.1007/s10706-021-01843-7
Chai, S. F., Wang, P., and Guo, H. T. (2019). Model material similarity and associated evaluation for soil slopes in a large-scale shaking table test. China Earthq. Engi neering J. 41 (5), 1308–1315. doi:10.3969/j.issn.1000-0844.2019.05.1308
Chao, Y., Hong, S., Wang, H., Zhang, M., Huang, Z., and Niu, F. (2023). Microstructure properties of soft soils under marine, interactive marine, and river-lake facies sedimentary environments. Appl. Ocean Res. 130, 103445. doi:10.1016/j.apor.2022.103445
Chen, J. D., and Wada, N. (1986). Visualization of immiscible displacement in a three-dimensional transparent porous medium. Exp. Fluids 4 (6), 336–338. doi:10.1007/BF00266299
Editorial Committee of Engineering Geology Handbook (2007). Engineering Geology Handbook-. 4th Edition. China: China Building Industry Press.
Hird, C. C., and Stanier, S. A. (2010). “Modelling helical screw piles in clay using a transparent soil,” in Physical modelling in geotechnics, 769–774. doi:10.1680/geng.13.00021
Iskander, M. G., Liu, J., and Sadek, S. (2002). Transparent amorphous silicato model clay. J. Genotechnical and Geoenvironmental Eng. 128 (3), 262–273. doi:10.1061/(ASCE)1090-0241(2002)128:3(262)
Jia, Z., Bai, Y. T., Liu, C., Zhang, D., Ji, Y., and Zhao, H. (2023). Visualization investigation on stability of shield tunnel face with transparent soil, considering different longitudinal inclination angles. Tunn. Undergr. Space Technol. incorporating Trenchless Technol. Res. 137, 105154. doi:10.1016/j.tust.2023.105154
Kong, G. Q., Zhou, Y., Yang, Q., Wang, C., and Chen, Y. (2020). Geotechnical properties of a new transparent clay. Int. J. Geomechanics 20 (12), 06020032. doi:10.1061/(ASCE)GM.1943-5622.0001880
Leng, X., Wang, C., Pang, R., Sheng, Q., and Chen, J. (2021). Material preparation and geotechnical properties of transparent cemented soil for physical modeling. Front. Mater. 8, 740388. doi:10.3389/fmats.2021.740388
Liang, Y., Chen, P. F., and Lin, J. D. (2019). Pore flow characteristics of porous media based on transparent soil Technology. Chin. J. Geotechnical Eng. 41 (7), 1361–1366. doi:10.11779/CJGE201907022
Ma, S. K., Wei, R. K., and Shao, Y. (2021). 3D visual model tests on stability of tunnel excavation surface based on transparent soil. Chin. J. Geotechnical Eng. 43 (10), 1798–1806. doi:10.11779/CJGE202110005
Meng, D. Q. (2020). Discussion on subarea and statistical characteristics of parameters of soft soil in China (Master’s thesis). Shijiazhuang: Shijiazhuang Tiedao University. doi:10.27334/d.cnki.gstdy
Ministry of Housing and Urban–Rural Development of the People’s Republic of China (2019). Standard for Geotechnical Testing Methods (Standard No. GB/T 50123-2019). Beijing: China Architecture & Building Press.
Shi, P. X., and Li, P. (2015). Mechanism of soft ground tunnel defect generation and functional degradation. Tunn. Undergr. Space Technol. incorporating Trenchless Technol. Res. 50 (1), 334–344. doi:10.1016/j.tust.2015.08.002
Shi, Y. J. (2010). Engineering geological conditions and major geological problems during construction of metro tunnels in Shanghai area. J. Eng. Geol. 18 (5), 774–780. doi:10.04-9665/2010/18(5)-0774-07
Vu, M. N., Broere, W., and Bosch, J. (2015). The impact of shallow cover on stability when tunnelling in soft soils. Tunn. Undergr. Space Technol. incorporating Trenchless Technol. Res. 50 (1), 507–515. doi:10.1016/j.tust.2015.09.005
Wei, G. F. (2013). Study on compression characteristics of marine silt in shenzhen Bay. Sci. Technol. Eng. 13 (3), 795–798. doi:10.3969/j.issn.1671-1815.2013.03.054
Wu, X. T. (2013). Research on relation between consolidation coefficient and consolidation stress of silt in Wenzhou shoal. Rock Soil Machanics 34 (6), 1675–1680. doi:10.16285/j.rsm.2013.06.010
Wu, Y. D., Chen, M. J., and Zhou, Y. F. (2020). Distribution and basic characteristics of new transparent clay. Chin. J. Geotechnical Eng. 42 (S1), 141–145. doi:10.11779/cjge2020s1028
Zhang, C. S., Gao, M. X., and Qiang, X. J. (2013). Variation laws of consolidation coefficent of marine clay in Houhai Bay of Shenzhen. J. Geotechnical Eng. 35 (S1), 247–252. doi:10.3969/j.issn.1001-4632.2024.01.006
Zhang, W. G., Gu, X., Zhong, W. H., Ma, Z., and Ding, X. (2020). Review of transparent soil model testing technique for underground construction: ground visualization and result digitalization. Undergr. Space 7, 702–723. doi:10.1016/j.undsp.2020.05.003
Zhang, Y., Geng, J., and Mao, L. (2018). Compression and shear deformation properties of marine soft soil deposits in the Pearl River Delta. China Earthq. Eng. J. 40 (4), 745–751. doi:10.3969/j.issn.1000-0844.2018.04.745
Zhou, H. (2021). Basic mechanical properties of transparent clay madefrom spherical silica powder: an experimental study. China J. Highw. Transp. 34 (9), 172–180. doi:10.19721/j.cnki.1001-7372.2021.09.014
Keywords: similar material, transparent cemented soil, similarity theory, soft soil stratum, sensitivity analysis, mixing proportion
Citation: He S, Li H, Ye L, Huang H, Peng W, Xie P, Wang Z, Zhang Y, Lin S, Wen H, Fan Z and Duan H (2025) Physicomechanical characteristics and mix proportions of a new transparent cemented soil: similar material tests and ANOVA/ANOR analyses. Front. Mater. 12:1569566. doi: 10.3389/fmats.2025.1569566
Received: 01 February 2025; Accepted: 14 April 2025;
Published: 21 May 2025.
Edited by:
Pawel Polaczyk, Texas Tech University, United StatesReviewed by:
Thy Truc Doan, Kien Giang University, VietnamRen Mingyang, Henan University of Urban Construction, China
Copyright © 2025 He, Li, Ye, Huang, Peng, Xie, Wang, Zhang, Lin, Wen, Fan and Duan. This is an open-access article distributed under the terms of the Creative Commons Attribution License (CC BY). The use, distribution or reproduction in other forums is permitted, provided the original author(s) and the copyright owner(s) are credited and that the original publication in this journal is cited, in accordance with accepted academic practice. No use, distribution or reproduction is permitted which does not comply with these terms.
*Correspondence: Peng Xie, UGVuZ19YaWVAaGFpbmFudS5lZHUuY24=