 Jiarong Shen1,2
 Shouguang Wang
 Yulong Chen
- 1State Key Laboratory of Hydroscience and Engineering, Tsinghua University, Beijing, China
- 2School of Future Cities, University of Science and Technology Beijing, Beijing, China
- 3Deep Mining and Rockburst Branch, China Coal Research Institute, Beijing, China
In this study, the effects of the interval time between successive layers on the microstructures and macro performances of overlay transition zones (OTZs) in conventional concrete and roller-compacted concrete (RCC) are investigated. First, the fluorescent epoxy impregnation method is used to obtain microstructure images of their OTZs. Microcrack skeletons are distinguished and extracted using the traditional digital image recognition algorithm. Thus, the effects of the interval time on OTZ microstructures can be better evaluated. Then, splitting tensile strength tests are conducted to study the effects of the interval time on the macromechanical properties and failure surfaces of the OTZs. Accordingly, the relationships between the microstructural characteristics and macromechanical properties of the OTZs are established. Finally, the differences in the microstructural characteristics of the conventional concrete and the RCC are examined. The effects of their microstructures on their macro performance and failure surfaces are compared and analyzed. Consequently, this study provides experimental and theoretical references for constructing concrete dams.
1 Practical application
In hydraulic engineering, new and old concrete have specific pouring requirements. When a layer of concrete is poured, another layer cannot be immediately poured above it, owing to the limitation of construction conditions. Thus, the properties of the interlayers between old and new concrete become crucial factors in controlling the overall durability of concrete structures. As shown in Figure 1, an interlayer consists (Carol et al., 1997) of a substrate (lower layer), an overlay (upper layer), and an overlay transition zone (OTZ). An OTZ, mainly comprising oriented Ca(OH)2 crystals, may have a limited contribution to concrete strength compared with C–S–H. The existence of an OTZ may affect the strength, deformation, and durability of concrete structures. Therefore, studying the microstructure and macro performance of an OTZ is highly significant.
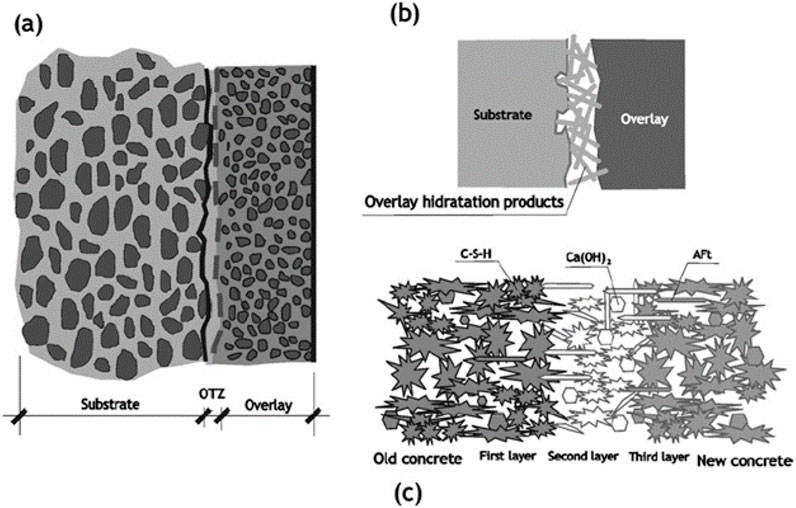
Figure 1. Microstructure of OTZ (obtained from (Carol et al., 1997)). (a) Macro scale (b) Meso scale (c) Micro scale.
2 Introduction
The interval time between successive layers is an important factor affecting the properties of an OTZ. Generally, the permeability of concrete is very low. However, when the interval time is significant, owing to the extension and connection of microcracks in an OTZ, seepage channels are eventually generated. Thus, the permeability of concrete may increase by several orders of magnitude and further threaten the safety of engineering structures (Sævik et al., 2013; Vu et al., 2014). The existence of microcracks accelerates the transmission rates of water and iron in concrete and reduces the impermeability of structures. This reduction in impermeability further increases the intrusion of hazardous substances and enhances structural damage (Krajcinovic, 2000; Wu et al., 2024; Wu et al., 2025). The macro performance of an OTZ is closely related to its internal microstructure. Therefore, analyzing the effects of the interval time on the microstructural characteristics and macro performance of an OTZ is necessary.
Currently, a sufficient understanding of the microstructure of an OTZ is lacking. Thus, using advanced measurement methods to obtain microstructural information and establish the relationship between the microstructure and macroperformance of an OTZ is essential. Presently, observation technologies for the microstructure of concrete mainly include the following nondestructive testing methods for detecting porosity: ultrasonic pulse (Güçlüer, 2020; Liu et al., 2019), acoustic emission (Xie et al., 2020), infrared thermography (Ludwig et al., 2018), Mercury Intrusion Porosimetry (MIP) (He et al., 2023; He and Lu, 2024a), and microwave (Wei et al., 2021) testing. These methods collect observational information during experimental tests and identify defects in concrete using algorithms. However, microstructure images cannot be directly obtained. X-ray tomography (Suzuki et al., 2010; He and Lu, 2024b; He et al., 2024), which scans samples using layer-by-layer technology, obtains real three-dimensional microstructural information by image reconstruction (Promentilla and Sugiyama, 2010). However, X-ray tomography imposes high standards on the sample size owing to the limitation of the conflict between its resolution and observation area. Although scanning electron microscopy (SEM) (Shen et al., 2021) is the most well-known high-resolution microstructural observation technology, it also suffers from the conflict between its resolution and observation area. Therefore, SEM is not commonly used for microcrack observations.
In addition to the technologies mentioned above, optical microscopy is used for microstructural observation. Although the resolution of optical microscopy is lower than that of SEM, the observation area in the former is larger than in the latter. With the development of observation technology and computer graphics processing, thousands of observation images can be automatically stitched, dramatically extending the observation area and reducing the sample size requirements. Homand et al. (2000) observed the microcrack characteristics of granite under different loading conditions using the fluorescent epoxy impregnation method (FEIM). Ammouche et al. (2000) immersed concrete samples in a fluorescent solution and analyzed the length and direction characteristics of microcracks. Litorowicz (2006) tested the microcrack morphologies of concretes with different water–cement ratios and under various curing conditions using the FEIM. Based on the principle of quantitative stereology, Zhang and Zhang (2015) analyzed the microstructure of concrete using the FEIM and Image Pro Plus software. Li et al. (2011) obtained microstructure images of concrete after damage by the freeze–thaw behavior of the FEIM. Accordingly, the areas, lengths, and stomatal apertures of the microcracks in the concrete were statistically analyzed.
In this study, the microstructures and macro performances of OTZs in conventional concrete and roller-compacted concrete (RCC) were investigated. First, the FEIM was used to obtain microstructure images of both concrete types with different interval times. Microcrack skeletons could be distinguished and extracted intelligently based on the traditional digital image recognition algorithm. Thus, the locations and direction distributions of the microcracks in the OTZs were studied. Moreover, the macromechanical properties and failure surface types of the OTZs with different interval times were characterized by splitting tensile strength tests. Finally, the relationships between the microstructures and macro performances of the OTZs of the concretes were established. The effects of the interval time on both the microstructures and macro performances of the concretes were examined. This study on OTZs is expected to provide useful references for practical engineering.
3 Experimental details
3.1 Material and mix designs
3.1.1 Conventional concrete
In this study, ordinary Portland cement was used, and its chemical composition is provided in Table 1. Crushed granite with a continuous gradation of 5–20 mm was selected as the coarse aggregate. Natural sand with a fineness modulus of 2.9 was selected as the fine aggregate. The detailed mix proportion of the concrete is listed in Table 2. The penetration resistance method was used to determine the initial and final setting times. Samples were prepared by pouring two layers of the concrete. When pouring the upper layer of concrete, 0.2% inert stain was added to the mixture to better distinguish the layer position. A concrete sample with a pouring layer is shown in Figure 2.

Table 1. Chemical composition of cement.
Table 2. Mix proportions of concrete.

Figure 2. Concrete sample with pouring layer (10 mm × 10 mm).
Based on the initial and final setting times, the internal times were set as 0, 3, 6, 9, 12, and 15 h, representing no layer, hot, hot, warm, warm, cold, and cold joints, respectively. Each group contained 6 concrete samples. The samples with the corresponding interval times are referred as C1–C6, respectively, as specified in Table 3. Concrete samples with dimensions of 100 mm × 100 mm × 100 mm were cured in a standard curing room (Temperature = 20°C ± 2°C, Humidity ≥95%) to prepare for tests.
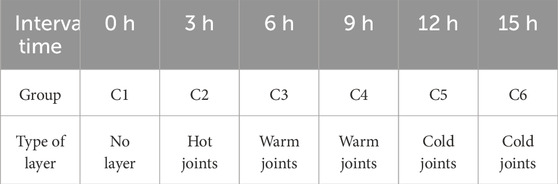
Table 3. OTZs of different conventional concretes.
3.1.2 RCC
The detailed mix proportion of the RCC is provided in Table 4. The penetration resistance method was used to determine the initial and final setting times. The tested initial and final setting times were 10 h and 19 h, respectively. RCC samples with dimensions of 150 mm × 150 mm × 150 mm were cured in a standard curing room to prepare for tests.
Table 4. Mix proportions of RCC.
During the construction of roller-compacted concrete, different types of construction joints are formed based on the interval time: joints formed before the initial setting time are classified as hot joints, those formed between the initial and final setting times are warm joints, and those formed after the final setting time are cold joints. Depending on the interval time and the interlayer treatment method, the RCC samples were divided into six groups, which are listed in Table 5. According to the initial/final setting time and the treatment, the selected working conditions are 0 h (hot joint, no treatment), 4 h (hot joint, no treatment), 12 h (warm joint, no treatment), 12 h (warm joint, paving a thin layer of mortar at the OTZ), 24 h (cold joint, no treatment), and 24 h (cold joint, paving a thin layer of mortar at the OTZ). Each group contained 6 concrete samples. For the RCC specimens, the same layered pouring process as described in Section 3.1.1 was adopted.

Table 5. OTZs of different RCCs.
3.2 Experimental procedures
3.2.1 FEIM tests
When using a scanning electron microscope, the field of view captured by the microscope is very limited, and the requirements for the sample size are also very strict. During FEIM observation, the concrete specimens were scanned grid by grid on the stage. The pixel size was 2 μm. Each local unit image covers an area of 2.784 × 2.080 mm (1,392 × 1,040 pixels). Consequently, the global image (100 mm × 20 mm) of each specimen was composed of 360 local unit images: 10 local unit images along the width direction and 36 local unit images in the length direction. To maximize the field of view and accommodate larger samples, FEIM was employed as an alternative to SEM.
The conventional concrete and RCC samples were cut into 100 mm × 100 mm × 20 mm specimens. The prepared specimens were polished, cleaned, dried, and injected into a fluorescent epoxy resin (Li et al., 2014). After the epoxy resin hardened, the specimens were placed on the FEIM system stage to obtain microstructure images. Unit images were spliced into monolithic images using the image splicing software of the system. Microcracks in the images were recognized and extracted using the following five modules. The flow process is shown in Figure 3. As shown, FEIM images are first converted into gray images. Subsequently, in the binary module, defects (microcracks and pores) in the concrete are extracted using image segmentation technology. Following this, the gray images are converted into binary images. In the shape analysis module, the noise and the pores are removed after characterizing the shapes of the extracted defects. The detailed process of the shape analysis module can be found in our previous study (Shen et al., 2021). In the skeleton module, the skeletons of the microcracks are extracted by fitting lines. Finally, the processed images are imported into computer-aided design (CAD) software to extract the geometric information of the microcracks.
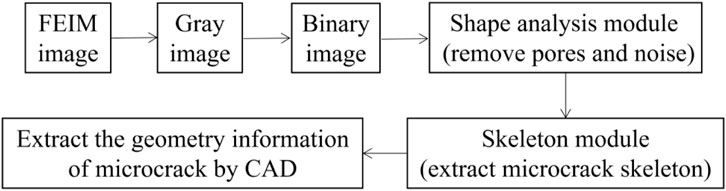
Figure 3. Diagram of flow process of system.
3.2.2 Digital image process
Using the process shown in Figure 3, two-dimensional (2D) CAD vector graphs were obtained. The microcracks in the vector graphs were fitted using multiple line segments. In the CAD graphs, the vertex coordinates of each line segment are pixel point positions. Specifically, the horizontal and vertical ordinates of a vertex are the horizontal and vertical orders of the pixel where the vertex is located, respectively. Before the calculation, determining the real size of each pixel in both the horizontal and vertical directions was necessary. For example, if the real length of an image is 10 cm and the number of pixels in the horizontal direction is 10,000, the real size of each pixel is 10 μm. Thus, the real vertex coordinates of each line segment can be converted.
The length and direction vector of each line segment can be calculated using the vertex coordinates. As shown in Figure 4, the length of line segment having vertexes (x1, y1) and (x2, y2) is calculated using the two-point distance formula, and its direction vector n1 = (x2 − x1, y2 − y1). The lengths and direction vectors of the remaining lines can be analogously deduced.
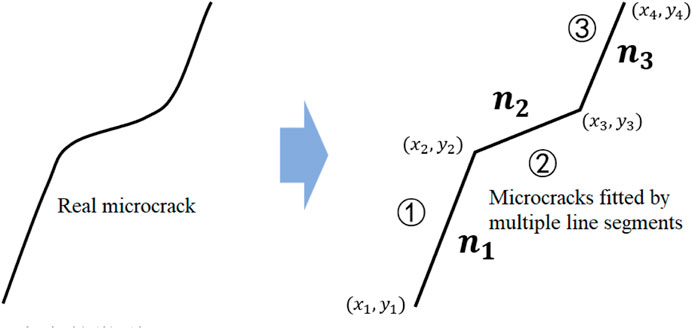
Figure 4. Schematic of 2D microcrack calculation.
3.2.3 Splitting tensile strength
According to the Chinese standard, the size requirement for the splitting tensile strength test of conventional concrete is 100 mm × 100 mm × 100 mm, and that for roller-compacted concrete is 150 mm × 150 mm × 150 mm. Therefore, conventional concrete samples with dimensions of 100 mm × 100 mm × 100 mm and RCC samples of size 150 mm × 150 mm × 150 mm RCC were used in the splitting tensile strength tests. These tests were performed using a compression test machine in accordance with the Chinese national standard, Hydraulic Concrete Test Procedure (SL352-2006) (MWR, 2006). Stress was controlled in these tests, and the loading rate was 0.01 MPa/s. A schematic of the test device is shown in Figure 5.

Figure 5. Schematic of test device.
4 Microstructural characteristics of OTZ
To better analyze the distribution of microcracks in an OTZ, the microcracks observed by the FEIM were divided into OTZ and non-layer microcracks. In this study, OTZ microcracks were assumed to be distributed only within 5 mm on both sides of the interlayer; this is shown in Figure 6.
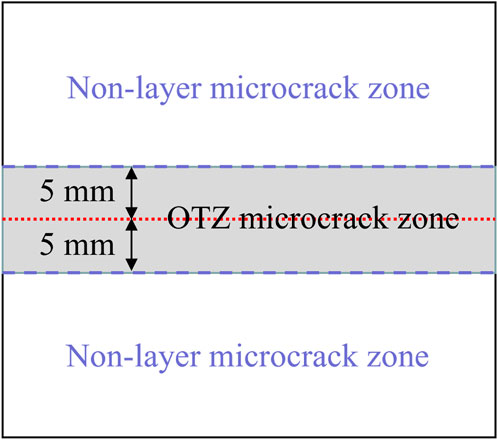
Figure 6. Interface microcrack zones.
4.1 Non-layer microcrack characteristics
Using the flow process presented in Figure 3, the FEIM results and microcrack distributions of conventional concrete (C1 and interval time of 0 h) and RCC (A and interval time of 0 h) samples are shown in Figures 7, 8, respectively. After comparing these results, the following matrix characteristics of the conventional concrete and RCC samples can be summarized:
(1) Pore characteristics: As shown in Figure 7b, macropores are isolated in the conventional concrete and their area percentage is low. In contrast, visible macropores are evenly distributed throughout the RCC (Figure 8b). The macropore content of the RCC is significantly greater than that of the conventional concrete sample, which may deteriorate of the RCC macro performance.
(2) Microcrack characteristics: As presented in Figures 7c,d, 8c,d, most microcracks are generated in the interfacial transition zones (ITZ) of both the conventional concrete and RCC samples. However, their microcrack characteristics are different. The average microcrack length in the conventional concrete (C1) is significantly larger than that in the RCC concrete (A). The other statistical results of the microcracks in the conventional concrete and RCC samples are summarized in Table 6. The average microcrack width and density of the RCC are larger than those of the conventional concrete. These differences may significantly impact on macro performance of the overall structure.
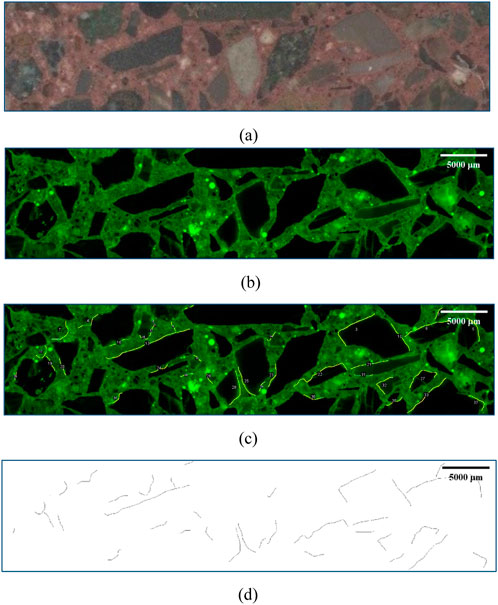
Figure 7. Microstructure characteristics of substrate of conventional concrete (C1). (a) Original section of conventional concrete (b) FEIM results (c) Microcrack distribution (d) Microcrack distribution (after background removal).
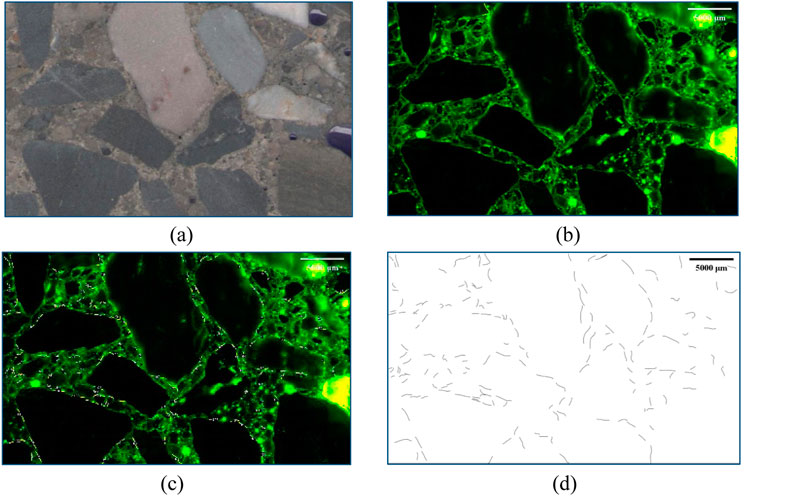
Figure 8. Microstructure characteristics of substrate of RCC (A). (a) Original section of RCC (b) FEIM results (c) Microcrack distribution (d) Microcrack distribution (after background removal).
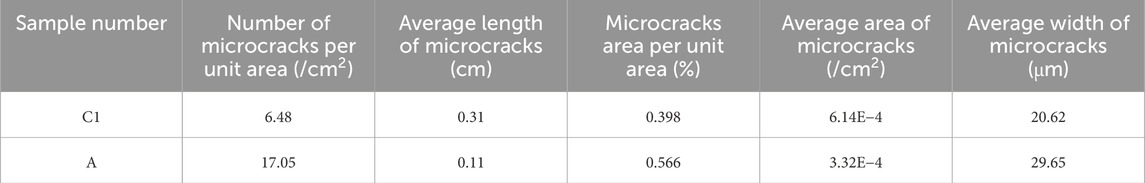
Table 6. Statistical results of microcracks.
4.2 OTZ microstructural characteristics
4.2.1 OTZ microstructural characteristics of conventional concrete
Conventional concrete samples C2–C6 with corresponding interval times of 3, 6, 9, 12, and 15 h were studied using the FEIM. In each case, the observation area was 5 mm both above and below the interlayer. The microcrack distributions of the conventional concrete OTZs are presented in Figure 9. The figure shows that with the increase in the interval time, the interlayer “trace” of the conventional concrete becomes increasingly remarkable. When the interval time is within the limit of the initial setting time, the interlayers are difficult to distinguish. After the initial setting time, microcracks appear gradually near the interlayer. When the interval time exceeds the final setting time, the interlayer can be easily traced. The microcracks tend to be connected near the interlayer.
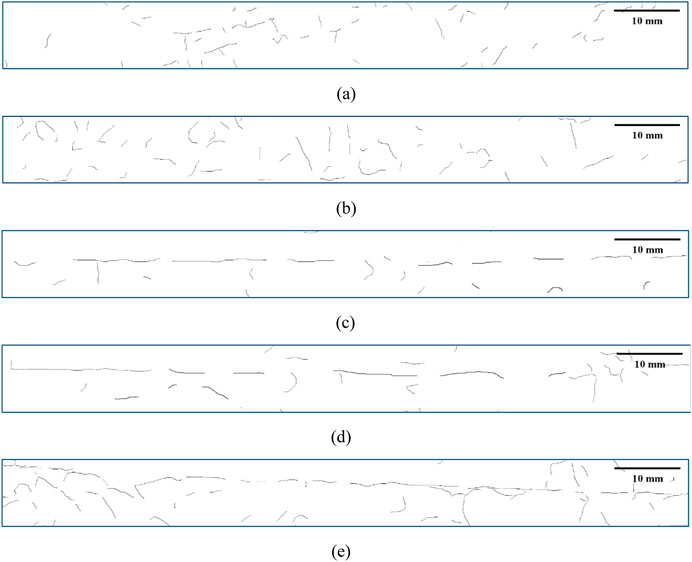
Figure 9. Microcrack distributions of conventional concrete OTZs. (a) Internal time of 3 h (b) Internal time of 6 h (c) Internal time of 9 h (d) Internal time of 12 h (e) Internal time of 15 h.
The direction distributions of the microcracks in the conventional concrete samples for the different interval times are presented in Figure 10 and the statistical results are summarized in Table 7. With the increase in the interval time, the direction distribution of the microcracks significantly changes. Instead of a random distribution, the total lengths of the microcracks along the direction of the interlayer rapidly increase. In contrast, the ratios of the total length in the other directions gradually decrease.
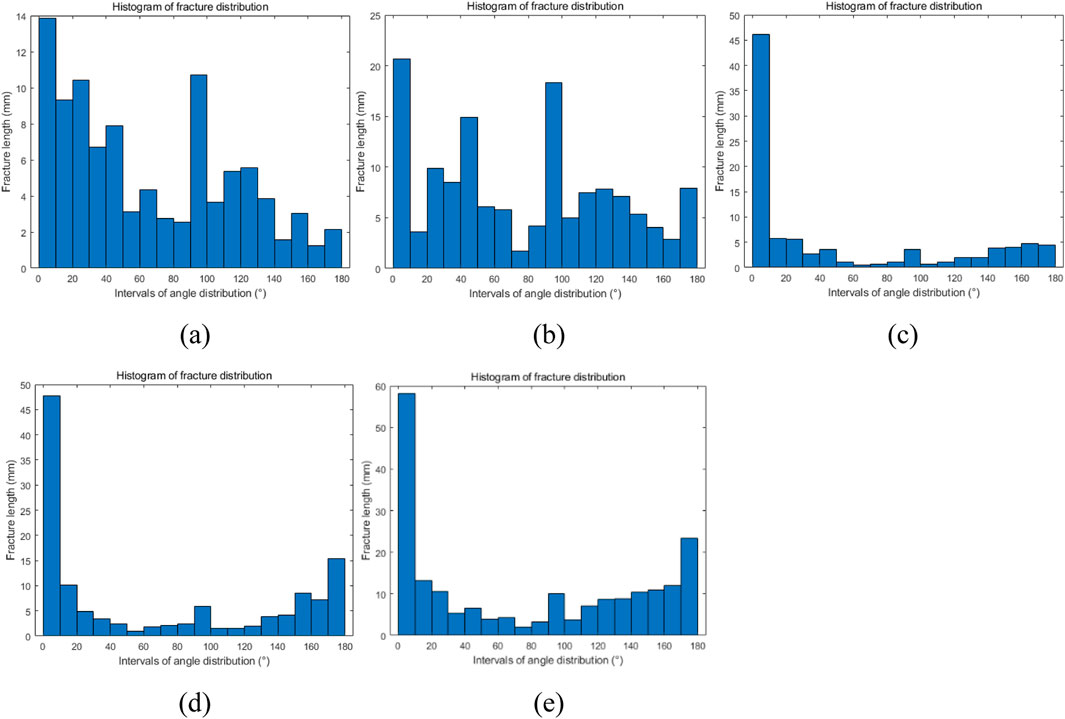
Figure 10. Direction distributions of microcracks in conventional concrete samples. (a) Interval time of 3 h (b) Interval time of 6 h (c) Interval time of 9 h (d) Interval time of 12 h (e) Interval time of 15 h.
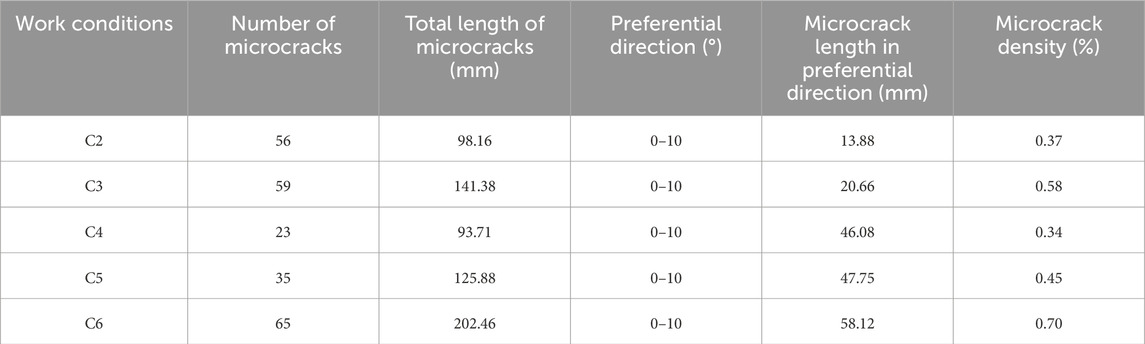
Table 7. Statistical results of OTZs of conventional concretes.
4.2.2 OTZ microstructural characteristics of RCC
RCCs B–F with the corresponding interval times of 4 h (no treatment), 12 h (no treatment), 12 h (paving a thin layer of mortar at the OTZ), 24 h (no treatment), and 24 h (paving a thin layer of mortar at the OTZ) were studied using the FEIM. The observation area was 5 mm both above and below each interlayer. The microcrack distributions of the RCC OTZs are presented in Figure 11. Noticeably, the interlayer “trace” of an RCC sample is less remarkable than that of a conventional concrete sample. When the interval time is within the limit of the final setting time (Figures 11a–c), the interlayer “trace” is hardly observed. When the final setting time is exceeded (Figures 11d,e), numerous short microcracks are newly generated and continuously concentrated at the OTZ and form a weak channel along the interlayer.
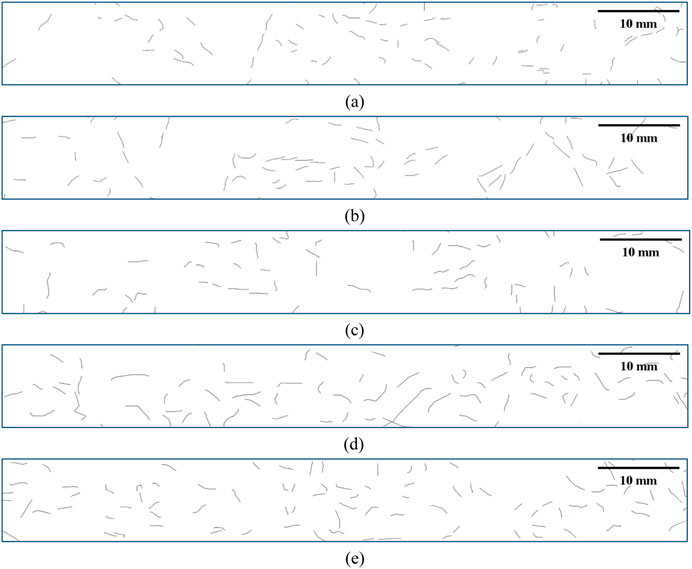
Figure 11. Microcrack distributions of RCC OTZs. (a) Interval time of 4 h (b) Interval time of 12 h (c) Interval time of 12 h and mortar treatment (d) Interval time of 24 h (e) Interval time of 24 h and mortar treatment.
The direction distributions of the microcracks in the RCC samples for the various interval times are presented in Figure 12 and the statistical results are summarized in Table 8. Figure 12a shows that before the initial time, the microcracks are randomly distributed in all directions. With the increase in the interval time (Figures 12a,b,d), the length of the microcracks along the direction of the interlayer and the total length and density of the microcracks gradually increase. Comparing Figures 12b–e, the total length, length in the preferential direction (along the interlayer), and density of the microcracks decrease significantly after paving a thin layer of mortar on the OTZ. Therefore, surface treatment can improve the microstructure of the RCC and decreases the connection and concentration of the microcracks.
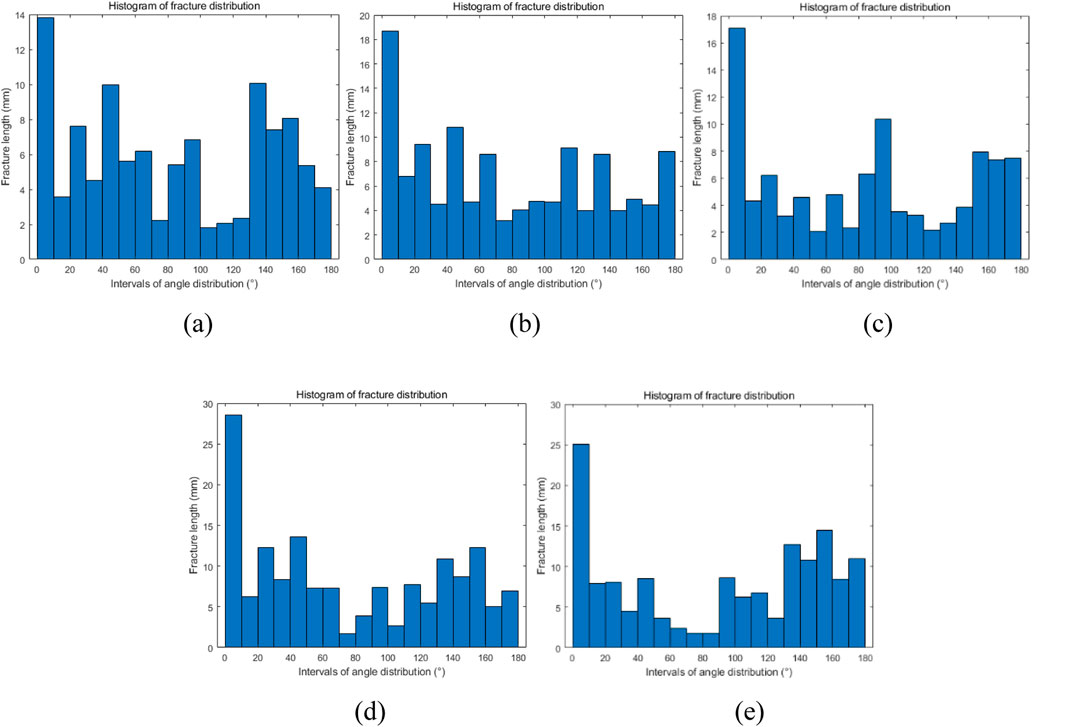
Figure 12. Direction distributions of microcracks in RCC samples. (a) Interval time of 4 h (b) Interval time of 12 h (c) Interval time of 12 h and mortar treatment (d) Interval time of 24 h (e) Interval time of 12 h and mortar treatment.
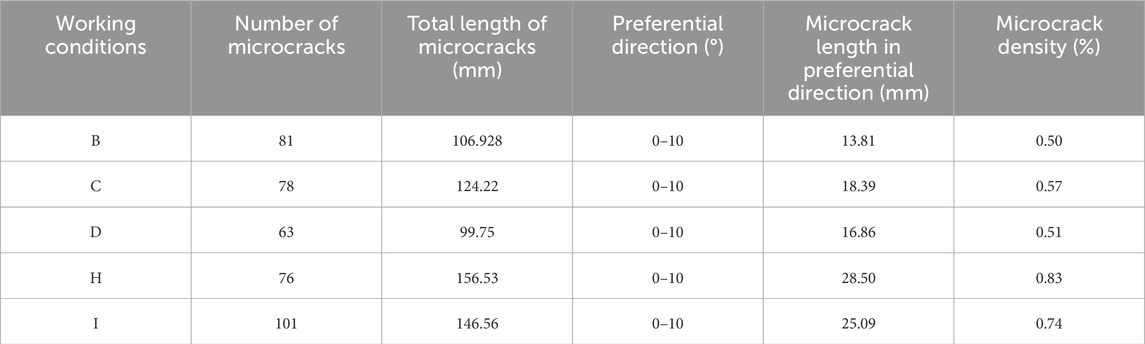
Table 8. Statistical results of OTZs of RCC samples.
4.3 Discussion
Comparing the microcrack distributions of the non-layer and OTZ zones for both the conventional concrete and RCC samples showed that the density of the microcracks in the OTZ zone was much higher than that in the non-layer zone. Therefore, microcracks are more probable to be generated in the OTZ zone than in the non-layer zone. With the increase in the interval time, increasing number of OTZ microcracks were generated, and the directions of these microcracks were basically along the interlayer. However, the “traces” of the interlayers in the conventional concrete samples were more remarkable than those in the RCC samples. When the interval time exceeded the final setting time, long connected microcracks were formed in the OTZ of the conventional concrete. Connected microcracks almost spread through the entire interlayer. Unlike in the conventional concrete samples, in the RCC samples, numerous short microcracks were generated and concentrated in the OTZs. However, the connectivity of the microcracks was relatively poor in the latter.
Based on the analysis of the non-layer microstructures, in both the conventional concrete and RCC, most microcracks were generated in the ITZs. However, their microcrack and pore characteristics varies. The average microcrack length in the RCC was shorter than that in the conventional concrete, whereas the average microcrack width and density of the former were significantly larger than those in the latter. Moreover, pores were intensely distributed in the RCC. This is completely different from the trend in the conventional concrete, in which pores were isolated.
5 Macro performance characteristics of OTZ
5.1 Splitting tensile strength
The splitting tensile strength results for both the conventional concrete and RCC samples are presented in Figure 13. As shown in Figure 13a, the effect of the interval time on the splitting tensile strength of the conventional concrete is significant. With the increase in the interval time, the number of microcracks along the direction of the interlayer increases, and the splitting tensile strength gradually decreases. Taking the splitting tensile strength of C1 (0 h) as the standard value, the strengths of C2–C6 are 90%, 79%, 69%, 60%, and 54% standard value, respectively. The quality of the combination between the layers decreases.
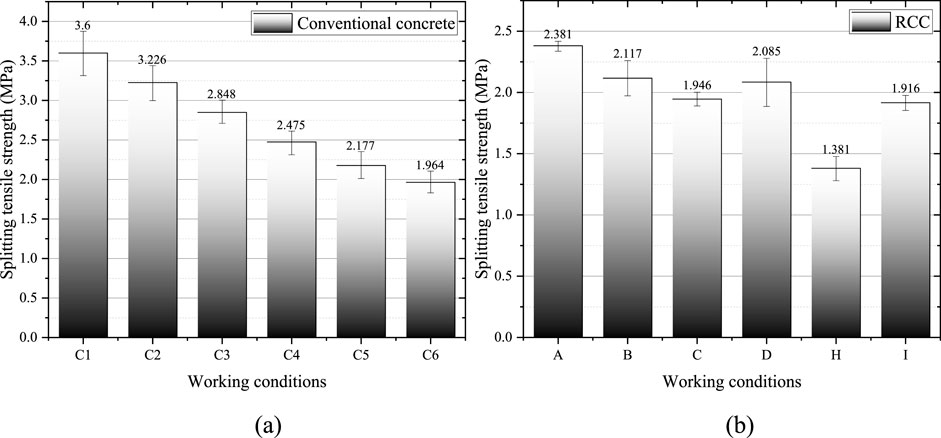
Figure 13. Splitting tensile strengths of concretes under various work conditions. (a) Conventional concrete (b) RCC.
The splitting tensile strength of A (0 h, no treatment) is taken as the standard value. As shown in Figure 13b, the strength of group B, which is poured before the initial setting time, is 90% standard value. For groups C and D, whose interval times are the same and in the range of the initial and final setting times, respectively, the splitting tensile strengths are 82% and 87% standard value, respectively. For groups H and I, whose interval times exceed the final setting time, the splitting tensile strengths are only 58% and 80% standard value, respectively. Treatment of the interlayers improves the tensile strengths of these RCC samples by 5% and 22%, respectively.
Based on the above results, the following conclusions can be drawn. With the increase in the interval time, the strength rapidly decreases, particularly when the interval time exceeds the final setting time. Moreover, the treatment of the interlayers improves the tensile strength of the RCCs. With the increase in the interval time, the improvement in the tensile strength significantly increases. Therefore, mortar treatment of the interlayers when the final setting time is exceeded is necessary and can provide maximum benefits for the quality of concrete.
5.2 Failure surface in splitting tensile tests
5.2.1 Failure surface of conventional concrete
Based on the failure surface characteristics in the splitting tensile strength tests, the damage modules of an OTZ were divided into four types. Type Ⅰ is complete fracture, in which almost all aggregates on the failure surface are broken. Type Ⅱ is a combination of fracture and interface failure, in which some fractured aggregates are observed on the failure surface. Type III refers to a small proportion of fracture and a large proportion of interface failure, in which only a small portion of the aggregates is broken. Most of the failure surface is flat. Type IV is pure interface failure, and the failure surface is completely composed of aflat mortar matrix.
As shown in Figure 14, the damage module of C1 (0 h, no OTZ) is Type I. The failure surface is fracture-like and contains many destroyed aggregates. For conventional concrete C2, the internal time is shorter than the initial setting time, and its damage module is Type II. Most of the failure surface is fracture-like with large fluctuations. The general “trace” of the interlayer is not observed. For concretes C3 and C4, whose interval times are between the initial and final setting times, the damage module can be classified as Type III. The failure surface is damaged along the interlayer with clear outlines. Only a small part of the area of the failure surface exhibits a small undulating fracture. For concretes C5 and C6, the interval times exceed the final setting time, and the damage module is Type IV. The failure surfaces of C5 and C6 contain almost no aggregates. In the splitting tensile tests, C5 and C6 are completely damaged along the interlayer. Therefore, the failure surfaces are very flat and smooth.
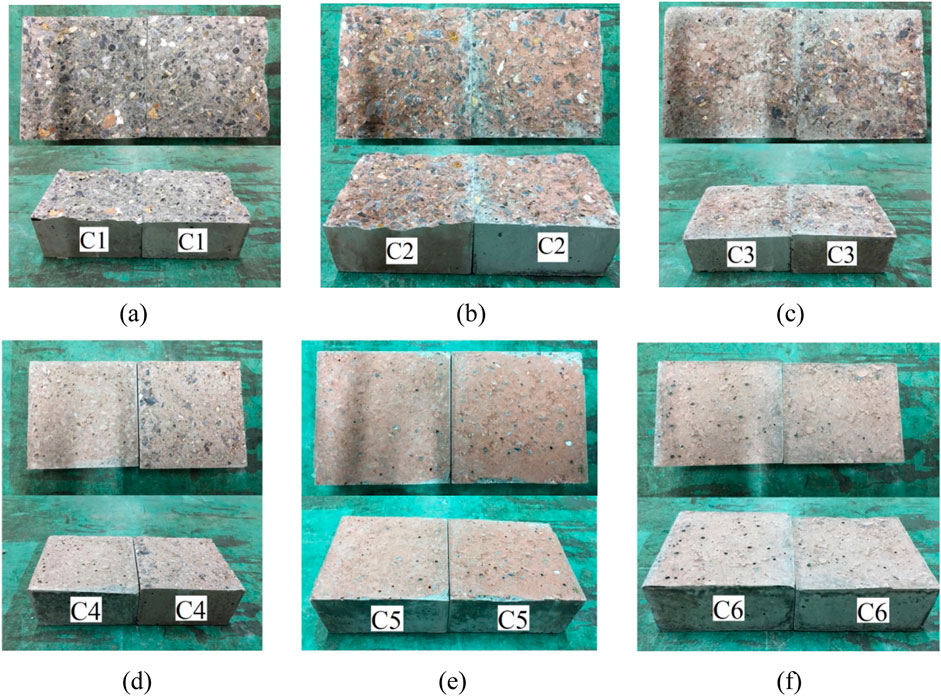
Figure 14. Failure surfaces of conventional concrete specimens. (a) Interval time 0 h (b) Interval time 3 h (c) Interval time 6 h (d) Interval time 9 h (e) Interval time 12 h (f) Interval time 15 h.
5.2.2 Failure surface of RCC
As shown in Figure 15, the number of fractured aggregates on the RCC failure surfaces with different interval time is smaller than on the conventional concrete surfaces owing to the low content of the cementitious materials. Even for RCC A (0 h), the proportion of fractured aggregates on the failure surface is under 50%. Therefore, Type Ⅰ failure is not observed on its failure surface. This phenomenon is different from that of the failure surfaces of the conventional concrete specimens (see Figure 14a for details).
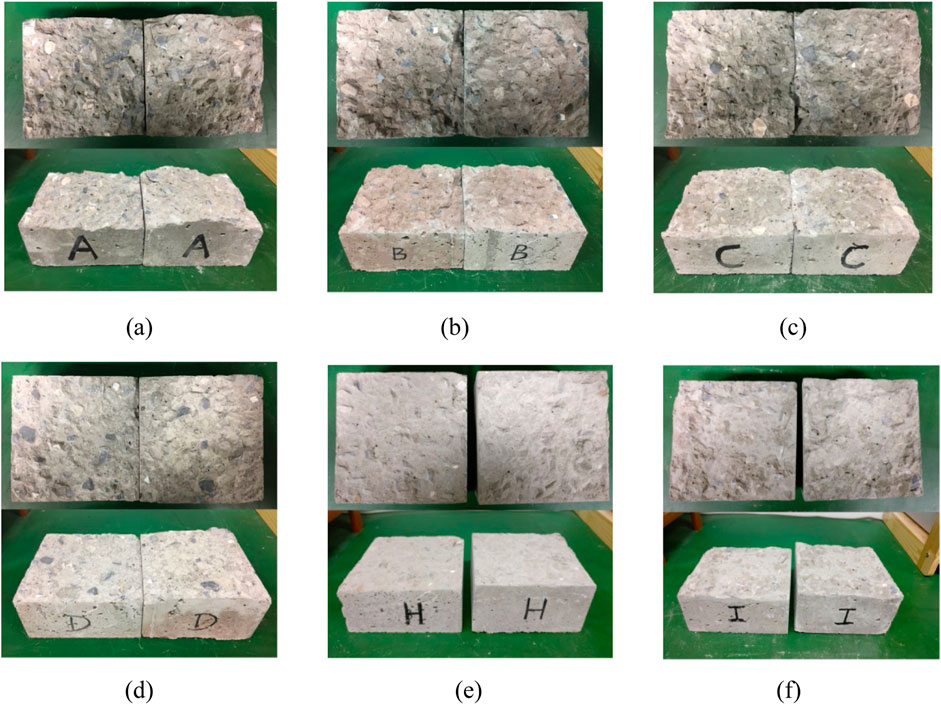
Figure 15. Failure surfaces of RCC specimens. (a) Interval time of 0 h (b) Interval time of 4 h (c) Interval time of 12 h (d) Interval time of 12 h and (e) Interval time of 24 h (f) Interval time of 24 h and mortar treatment.
When the concrete is poured before the final setting time (A–D), the damage modules are Type Ⅱ. Most failure surfaces are fracture-like with large fluctuations. However, a few fractured aggregates are observed in the failure surfaces, and a basic “trace” appears in the interlayer. When the concrete is poured after the final setting time and no treatment (I) is applied, the failure surface is completely along the mortar interlayer, and it is very flat and contains almost no aggregates. The damage module is Type IV. With interlayer treatment, even if the interval time exceeds the final setting time, the failure surface of the RCC is Type III. Only a small part of the area shows small fluctuations. Most of the failure surface is destroyed along the interlayer with clear outlines.
5.2.3 Discussion
Based on the evaluation of the failure surface characteristics in the splitting tensile strength tests, four types of damage modules were observed. For the conventional concretes, with the increase in the interval time, the damage modules changed from Type Ⅰ (complete fracture) to Type IV (pure interface failure). The proportions of the destroyed aggregates and fluctuations in the failure surface gradually decreased.
For the RCCs, owing to the low content of the cementitious materials, the Type Ⅰ damage module could not be observed, even on the failure surface of A (0 h). With the increase in the interval time, the damage modules changed from Type Ⅱ (combination of fracture and interface failure) to Type IV (pure interface failure). Interlayer treatment significantly improved the interlayer bonding performance, particularly when the interval time was longer than the final setting time. Comparing the failure surfaces of H and I revealed that the interlayer treatment could change the damage modules from Type IV to Type III. The other characteristics of the failure surfaces of the RCCs were similar to those of the conventional concretes.
6 Relationship between microstructure and macro performance
Based on the microstructure and macro performance results presented in Sections 5, 6, the effect mechanism of the microstructure on the macro performances of both the conventional concrete and RCC was inferred. As presented previously, with the increase in the interval time, the microcrack length along the interlayer increased, and thus, the splitting tensile strength decreased. Consequently, the relationship between the microcrack length along the interlayer and the splitting tensile strength was established. As shown in Figure 16a, for the conventional concrete (without interlayer treatment), the slitting tensile strength decreases linearly with increasing microcrack length along the interlayer. The R2 value is 0.93, indicating a strong linear relationship. Similarly, for the RCCs (B, C, and H and without interlayer treatment), Figure 16b shows a strong negative linear correlation between the splitting tensile strength and the microcrack length along the interlayer. The R2 value is greater than 0.99. Therefore, for both the conventional concrete and RCC with various interval times, without the interlayer treatment, the splitting tensile strength decreases linearly with increasing microcrack length along the interlayer.
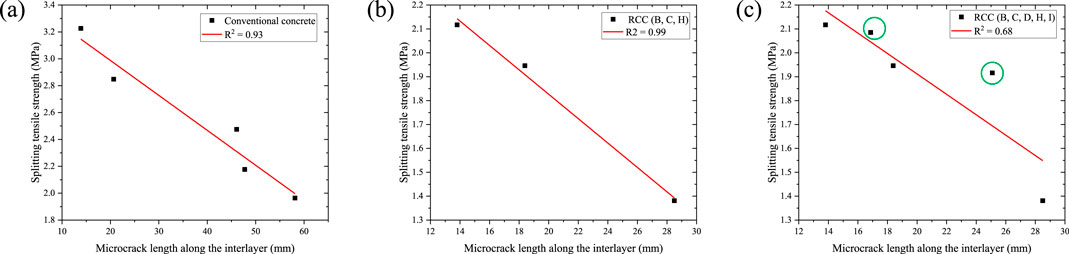
Figure 16. Relationship between microcrack length along interlayer and splitting tensile strength of different concretions. (a) Without interlayer treatment (b) The B, C and H RCCs (c) The B, C, D, H and IRCCS.
However, with the mortar treatment of the RCC interlayer, the prior linear relationship is no longer appropriate (shown in Figure 16c). The interlayer treatment significantly improves the macromechanical properties of the RCC (marked with green circles in Figure 16c), particularly when the interval time exceeds the final setting time.
7 Conclusion
In this study, based on the FEIM and splitting tensile strength tests, the microstructures and macro performance of OTZs in conventional concrete and RCC were studied. The effects of the interval time between successive layers on their microstructures and macro performances were characterized. The relationship between the microstructure and the macro performance was established. The differences in the microstructural characteristics and failure surfaces of the conventional concrete and the RCC were also examined. The conclusions are summarized as follows:
(1) The microcrack and pore characteristics of the conventional concrete and RCC samples varied. The average microcrack length in the RCC was shorter than in the conventional concrete, whereas the average microcrack width and density in the former were significantly larger than those in the conventional concrete. In addition, pores were intensely distributed within the RCC, whereas they were isolated in conventional concrete.
(2) With the increase in the interval time, for both the conventional concrete and RCC, microcracks along the interlayer increased and the splitting tensile strength gradually decreased. The “trace” of the interlayer in the conventional concrete was more remarkable than that in the RCC.
(3) With the increase in the interval time, the damage modules of both the conventional concrete and RCC varied. The proportions of destroyed aggregates and fluctuations in the failure surface gradually decreased.
(4) Interlayer treatment improved the cohesive properties. With the interlayer treatment, microcrack density and microcrack length along the interlayer decreased. However, the splitting tensile strength increased.
(5) For conventional concrete and RCC samples with different interval times, the splitting tensile strengths of the OTZs decreased linearly with increasing microcrack length along the interlayer. With the interlayer treatment of the OTZ, the prior linear relationship was no longer appropriate.
(6) During the construction of conventional concrete and RCC dams, controlling the interval time between layers as soon as possible before the final setting time can effectively reduce microcrack formation and enhance the mechanical properties of the layers.
Data availability statement
The original contributions presented in the study are included in the article/supplementary material, further inquiries can be directed to the corresponding author.
Author contributions
JS: Investigation, Writing – review and editing. SW: Writing – original draft, Writing – review and editing. PQ: Investigation, Writing – review and editing. YL: Investigation, Writing – review and editing. YC: Investigation, Writing – review and editing.
Funding
The author(s) declare that financial support was received for the research and/or publication of this article. This study was supported by Open Research Fund Program of the State Key Laboratory of Hydroscience and Engineering (sklhse-2023-D-03, sklhse-KF-2025-D-06), the National Natural Science Foundation of China (52204094) and the National Key Research and Development Program of China (2023YFC3707803).
Conflict of interest
The authors declare that the research was conducted in the absence of any commercial or financial relationships that could be construed as a potential conflict of interest.
Generative AI statement
The author(s) declare that no Generative AI was used in the creation of this manuscript.
Publisher’s note
All claims expressed in this article are solely those of the authors and do not necessarily represent those of their affiliated organizations, or those of the publisher, the editors and the reviewers. Any product that may be evaluated in this article, or claim that may be made by its manufacturer, is not guaranteed or endorsed by the publisher.
References
Ammouche, A., Breysse, D., Hornain, H., Didry, O., and Marchand, J. (2000). A new image analysis technique for the quantitative assessment of microcracks in cement-based materials. Cem. Concr. Res. 30 (1), 25–35. doi:10.1016/s0008-8846(99)00212-4
Carol, I., Prat, P. C., and López, C. M. (1997). Normal/shear cracking model: application to discrete crack analysis. J. Eng. Mech. 123 (123), 765–773. doi:10.1061/(asce)0733-9399(1997)123:8(765)
Güçlüer, K. (2020). Investigation of the effects of aggregate textural properties on compressive strength (CS) and ultrasonic pulse velocity (UPV) of concrete. J. Build. Mater. 27, 100949. doi:10.1016/j.jobe.2019.100949
He, R., and Lu, N. (2024a). Hydration, fresh, mechanical, and freeze-thaw properties of cement mortar incorporated with polymeric microspheres. Adv. Compos. Hybrid Mater. 7, 92. doi:10.1007/s42114-024-00899-2
He, R., and Lu, N. (2024b). Air void system and freezing-thawing resistance of concrete composite with the incorporation of thermo-expansive polymeric microspheres. Constr. Build. Mater. 419, 135535. doi:10.1016/j.conbuildmat.2024.135535
He, R., Nantung, T., and Lu, N. (2024). Unraveling microstructural evolution in air-entrained mortar and paste: insights from MIP and micro-CT tomography amid cyclic freezing-thawing damage. Constr. Build. Mater. 94, 109922. doi:10.1016/j.jobe.2024.109922
He, R., Nantung, T., Olek, J., and Lu, N. (2023). Field study of the dielectric constant of concrete: a parameter less sensitive to environmental variations than electrical resistivity. J. Build. Eng. 74, 106938. doi:10.1016/j.jobe.2023.106938
Homand, F., Hoxha, D., Belem, T., Pons, M. N., and Hoteit, N. (2000). Geometric analysis of damaged microcracking in granites. Mech. Mater. 32 (6), 361–376. doi:10.1016/s0167-6636(00)00005-3
Krajcinovic, D. (2000). Damage mechanics: accomplishments, trends and needs. Int. J. Solids Struct. 37 (1), 267–277. doi:10.1016/s0020-7683(99)00081-5
Li, S. G., Chen, G. X., Ji, G. J., and Lu, Y. (2014). Quantitative damage evaluation of concrete suffered freezing–thawing by DIP technique. Constr. Build. Mater. 69 (11), 177–185. doi:10.1016/j.conbuildmat.2014.07.072
Li, W., Sun, W., and Jiang, J. (2011). Damage of concrete experiencing flexural fatigue load and closed freeze/thaw cycles simultaneously. Constr. Build. Mater. 25 (5), 2604–2610. doi:10.1016/j.conbuildmat.2010.12.007
Litorowicz, A. (2006). Identification and quantification of cracks in concrete by optical fluorescent microscopy. Cem. Concr. Res. 36 (8), 1508–1515. doi:10.1016/j.cemconres.2006.05.011
Liu, L. Z., Miramini, S., and Hajimohammadi, A. (2019). Characterising fundamental properties of foam concrete with a non-destructive technique. Nondestruct. Test. Eval. 34 (1), 54–69. doi:10.1080/10589759.2018.1525378
Ludwig, N., Rosina, E., and Sansonetti, A. (2018). Evaluation and monitoring of water diffusion into stone porous materials by means of innovative IR thermography techniques. Measurement 118, 348–353. doi:10.1016/j.measurement.2017.09.002
Promentilla, M. A. B., and Sugiyama, T. (2010). X-ray microtomography of mortars exposed to freezing-thawing action. J. Adv. Concr. Technol. 8 (2), 97–111. doi:10.3151/jact.8.97
Sævik, P. N., Berre, I., Jakobsen, M., and Lien, M. (2013). A 3D computational study of effective medium methods applied to fractured media. Transp. porous media 100 (1), 115–142. doi:10.1007/s11242-013-0208-0
Shen, J. R., Xu, Q. J., and Liu, M. Y. (2021). Statistical analysis of defects within concrete under elevated temperatures based on SEM image. Constr. Build. Mater. 293, 123503. doi:10.1016/j.conbuildmat.2021.123503
Suzuki, T., Ogata, H., Takada, R., Aoki, M., and Ohtsu, M. (2010). Use of acoustic emission and X-ray computed tomography for damage evaluation of freeze-thawed concrete. Constr. Build. Mater. 24 (12), 2347–2352. doi:10.1016/j.conbuildmat.2010.05.005
Vu, M. N., Pouya, A., and Seyedi, D. M. (2014). Theoretical and numerical study of the steady-state flow through finite fractured porous media. Int. J. Numer. Anal. Methods Geomechanics 38 (3), 221–235. doi:10.1002/nag.2200
Wei, W., Shao, Z. S., Qiao, R. J., Chen, W., Zhou, H., and Yuan, Y. (2021). Recent development of microwave applications for concrete treatment. Constr. Build. Mater. 269, 121224. doi:10.1016/j.conbuildmat.2020.121224
Wu, J. Y., Wong, H. S., Zhang, H., Yin, Q., Jing, H., and Ma, D. (2024). Improvement of cemented rockfill by premixing low-alkalinity activator and fly ash for recycling gangue and partially replacing cement. Cem. Concr. Compos. 145, 105345. doi:10.1016/j.cemconcomp.2023.105345
Wu, J. Y., Yang, S., Williamson, M., Wong, H. S., Bhudia, T., Pu, H., et al. (2025). Microscopic mechanism of cellulose nanofibers modified cemented gangue backfill materials. Adv. Compos. Hybrid Mater. 8, 177. doi:10.1007/s42114-025-01270-9
Xie, C., Yuan, L. J., Zhao, M., and Jia, Y. (2020). Study on failure mechanism of porous concrete based on acoustic emission and discrete element method. Constr. Build. Mater. 235, 117409. doi:10.1016/j.conbuildmat.2019.117409
Keywords: conventional concrete, RCC, OTZ, microcrack, tensile strength, failure surface
Citation: Shen J, Wang S, Qian P, Liu Y and Chen Y (2025) Experimental research on microstructure characteristics and mechanical performance of interfaces between concrete layers. Front. Mater. 12:1576065. doi: 10.3389/fmats.2025.1576065
Received: 21 February 2025; Accepted: 23 April 2025;
Published: 15 May 2025.
Edited by:
Jiangyu Wu, China University of Mining and Technology, ChinaReviewed by:
Lucio Nobile, University of Bologna, ItalyChuanqing Fu, Zhejiang University of Technology, China
Copyright © 2025 Shen, Wang, Qian, Liu and Chen. This is an open-access article distributed under the terms of the Creative Commons Attribution License (CC BY). The use, distribution or reproduction in other forums is permitted, provided the original author(s) and the copyright owner(s) are credited and that the original publication in this journal is cited, in accordance with accepted academic practice. No use, distribution or reproduction is permitted which does not comply with these terms.
*Correspondence: Shouguang Wang, d3NnMTVAdHNpbmdodWEub3JnLmNu