 Lichun Gu
 Tianhui Zhang
- Faculty of Mechanical & Electrical Engineering, Yunnan Agricultural University, Kunming, China
Introduction: This is study investigates fatigue crack propagation in B780CF steel, aiming to establish an integrated experimental-simulation analysis framework.
Methods: The fatigue crack growth tests were conducted on compact tensile (CT) specimens under a stress ratio of R = 0.1, the fatigue crack growth rate (FCGR) was calculated using a seven-point polynomial method, and the Paris formula parameters were fitted to the range of stress intensity factors (ΔK). Then, A numerical simulation of fatigue crack propagation based on the J-integral was conducted using an improved meshing strategy.
Results: Comparative analysis revealed a 4.9% mean absolute error in fatigue life prediction using the improved meshing approach.
Discussion: This error margin validates the simulation accuracy, demonstrating the framework’s effectiveness in evaluating fatigue crack growth characteristics of B780CF steel.
1 Introduction
Fatigue fracture, as one of the predominant failure modes in metallic structures, poses significant challenges to the safety and longevity of engineering components subjected to cyclic loading. Among advanced structural materials, B780CF steel is a novel low-carbon bainitic steel, and has garnered considerable attention due to its exceptional combination of high strength, favorable toughness, and robust mechanical properties. These attributes render it indispensable for critical pressure-bearing components, such as hydropower station volutes and high-pressure pipelines (Li et al., 2021; Kumar et al., 2024). However, under prolonged cyclic loading, irreversible damage accumulation occurs in metallic materials, evolving into crack initiation and eventual fracture. This process is governed by fatigue crack propagation and dictates the structural integrity and service life of components (Yang X. S. et al., 2025; Yang Y. et al., 2025). Consequently, investigating the fatigue crack propagation behavior of B780CF steel is imperative for accurately predicting its fatigue life and ensuring operational reliability (Kim et al., 2024; Yi et al., 2025).
The fatigue crack growth rate (FCGR), a fundamental parameter characterizing material degradation, is conventionally described by the Paris law (Lian et al., 2024). The stress intensity factor K based on linear elasticity (LEFM) is utilized to express the strength of the stress field at the crack tip, and the relationship between the stress intensity factor range K and the fatigue crack growth rate (FCGR) is established. This model offers simplicity and broad applicability in engineering practice (Kyungmin et al., 2020; Wang et al., 2023; Jia et al., 2024). Zhu et al. (2018) conducted fatigue crack growth tests on Ti-6Al-4V/ELI and 7050-T7452 alloys at high temperatures, obtained the relationship curves between the fatigue crack growth rate and the stress intensity factor range K at different temperatures, analyzed the damage mechanism at high and normal temperatures, and proposed an improved cumulative damage rule, accurately evaluating the remaining life of the alloy. Song et al. (2024) took 10CrNi3MoV steel as the research subject and carried out experimental studies on its fatigue crack behavior under different stress ratios and temperatures. Metallographic tests were performed to observe the characteristics of crack evolution at different temperatures and analyze its mechanism. The test results indicated that low temperature had a positive effect on its fatigue crack growth rate (FCGR), and mismatched welded joints had lower FCG resistance. Chen et al. (2024) conducted fatigue crack growth tests on 2024 aluminum alloy with different stress ratios and studied the relationship between microstructure and fatigue growth path. The analysis results demonstrated that the main influencing factor of fatigue life was the stress amplitude, and the grain twist angle and Schmid factor were used to effectively describe the fatigue crack growth elements under different stress ratios.
However, during cyclic loading, the local plastic zone generated by stress concentration at the crack tip often has a complex effect on the fatigue crack propagation process, LEFM-based models exhibit limitations in scenarios involving localized plasticity at crack tips. Fatigue crack propagation analysis based on elastic-plastic fracture mechanics (EPFM) is an important basis for studying fatigue crack propagation mechanisms (Htut et al., 2024; Park et al., 2023). The J-integral, as a very important parameter in EPFM, is similar to the stress intensity factor in linear elastic fracture mechanics and can accurately describe the stress-strain field at the crack tip, representing the influence of crack existence from the perspective of energy absorption. It can not only be used in elastic-plastic materials but also can be used as a parameter for linear elastic fatigue crack propagation in a small range of yielding state. The model based on J-integral can effectively simulate stress-strain singularity at the crack tip (Li et al., 2014; Wang et al., 2018; Niu et al., 2022). Kumar et al. (2019) studied the i-type and mixed-type fatigue crack propagation behavior of Plastically Graded Materials using the J-integral method and the extended finite element method. Hosseini and Seifi (2020) used the Chaboche model to predict the cyclic plastic zone around the crack tip of a CT specimen and analyzed the cyclic J-integral and the area of the cyclic plastic zone two parameters, further studying the influence of nonlinear motion and isotropic hardening behavior on the cyclic plastic response at the crack tip. Zhou et al. (2024) used the improved J-integral driven model to predict the fatigue crack propagation rate of CFRP (carbon fiber-reinforced polymer) and obtained good results.
In this paper, the fatigue crack growth test of B780CF steel was conducted on CT samples, and the fatigue crack growth rate equation based on the Paris formula was obtained through fitting. The J-integral method was used to simulate the crack growth process, and the experimental results were compared with the numerical simulation results, providing an effective test and simulation analysis method for the fatigue life of B780CF steel.
2 Test material and method
2.1 Tensile test
The steel plate was tested by X-ray and ultrasonic nondestructive testing, and two tensile specimens were extracted from the test plate after the defect was staggered. The cross-section of the tensile specimen is a circle d = 10 mm, and its length l = 110 mm. The test process is carried out by strain control at a rate of 0.5%/min. The mechanical properties of B780CF steel obtained through tensile test are shown in Table 1.

Table 1. Mechanical properties of B780CF steel.
2.2 Metallographic test
To deepen our comprehension of the correlation between the physical properties of B780CF steel and its internal microstructure, and to facilitate fatigue crack propagation test of B780CF steel, a metallographic test of B780CF steel was conducted to observe its microstructure. The microstructure of B780CF steel is shown in Figure 1.
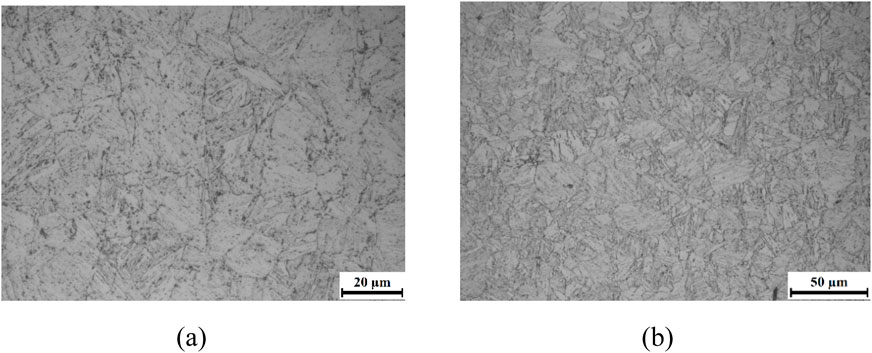
Figure 1. Metallographic organization chart. (a) 200 times metallographic structure. (b) 500 times metallographic structure.
It can be seen from Figure 1 that the B780CF steel structure has a mechanical mixture of fine granular cementite and ferrite. The fine granular cementite structure limits the formation of large plastic zones at the crack tip under cyclic loading, reducing energy dissipation and retarding crack growth. The ferrite has essentially no carbon supersaturation, and the carbides present are stable types. At room temperature, ferrite forms an equilibrium microstructure that exhibits both good toughness and plasticity while maintaining relatively high strength, which suppresses early-stage crack propagation, thus demonstrating excellent comprehensive mechanical properties.
2.3 Fatigue crack propagation test
CT specimens were extracted from defect-free areas of the test plate and machined into standard CT specimens. The dimensions of the CT specimens are shown in Figure 2: the thickness B is 12.5 mm, the width W is 50 mm, and the diameter of the loading hole d is 12.5 mm.

Figure 2. B780CF steel compact tensile specimen.
To avoid the dispersion of the test results, the fatigue crack propagation test was carried out with multiple samples. The crack propagation test was conducted on compact tensile (CT) specimens subjected to cyclic axial tensile loads using the MTS810 electro-hydraulic servo fatigue testing machine, as shown in Figure 3. The fatigue crack propagation tests on CT specimens were performed in air using the constant K-increasing loading method, with a control mode of constant amplitude sinusoidal loading at a frequency of 10 Hz. The crack length was measured by the compliance method. During the testing process, the specimens were loaded using U-bolts and pins, with a rational design of the clearance between the pins and pin holes to minimize friction. The loading method used was Type I force (vertical loading, constant amplitude cyclic load), with one of the two loading holes fixed and the other subjected to tensile and compressive loads. The loading principle and process are illustrated in Figure 4.

Figure 3. MTS810 servohydraulic fatigue test system.
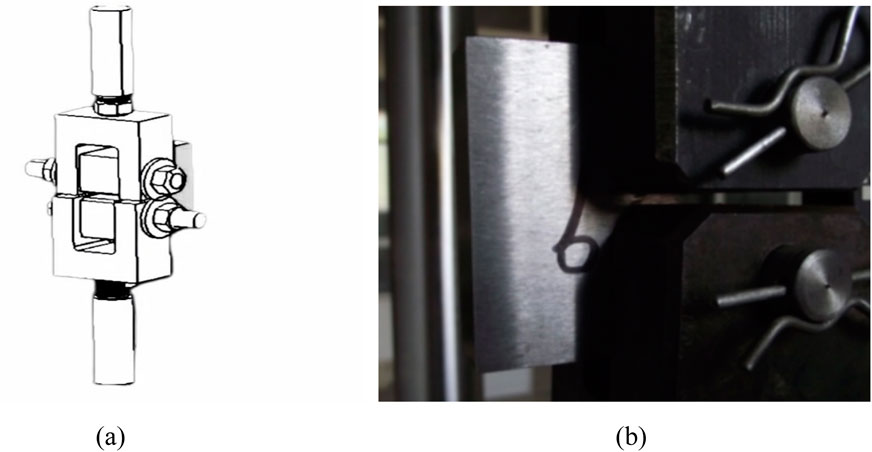
Figure 4. Loading principle and loading process of fatigue crack propagation test. (a) Loading principle. (b) Loading process.
To ensure that the calibration calculation of the stress intensity factor K is not affected by the shape of the machined initial notch, a crack of a certain length is prefabricated at the tip of each CT specimen. The pre-crack is approximately 15 mm. The CT specimens are loaded using the increasing K constant method with a sinusoidal load at a stress ratio R = 0.1, the maximum load Pmax = 15 kN, the minimum load Pmin = 1.5 kN. The stress ratio of R = 0.1 was selected in accordance with ASTM E647 Standard, which recommends this value as a representative low stress ratio for high-cycle fatigue characterization in engineering applications. Under low stress ratio conditions, crack closure effects dominate due to limited crack tip plasticity, the effective stress intensity factor range as the principal driver of fatigue crack growth rate (da/dN). The crack length is measured by the flexibility method. The data curves for crack length a and fatigue cyclic life N in the fatigue crack propagation test are shown in Figure 5, and the initial crack length, final crack length, and fatigue cyclic life for specimens 1 to 6 are summarized in Table 2.
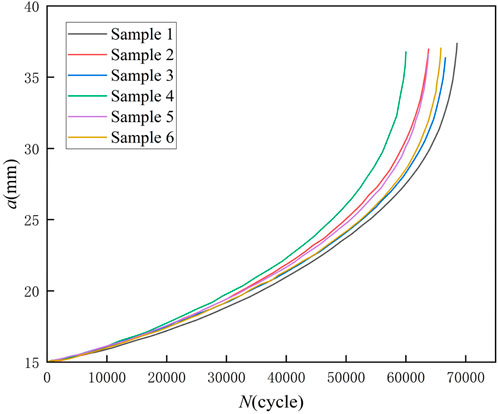
Figure 5. a-N curve of fatigue crack propagation test of B780CF steel.

Table 2. B780CF steel fatigue crack propagation data.
As shown in Figure 5, the a-N curves of the six samples exhibit certain scatter. The slope of the a-N curve for the crack length around 32.5mm–37 mm is slightly larger than that of other crack lengths, indicating that the crack is in the rapid propagation stage (crack instability expansion) when the crack length exceeds this range.
Paris formula has been widely used to describe the relationship between fatigue crack propagation rate (da/dN) and crack tip range of stress intensity factors (ΔK), and its expression as shown in Equation 1:
where da/dN is the increase in crack length per unit time, C and m are material related parameters, and ΔK is the stress intensity factor range. Taking the logarithm of both sides of the Paris formula, we obtain Equation 2:
The following seven-point increasing polynomial in Equation 3 was employed for curve fitting and differentiation to solve the fatigue crack propagation rate across crack lengths in the specimen.
where
Calculating the range of stress intensity factors (ΔK) corresponding to the da/dN value of the CT sample in Equation 5 as follows:
where ΔP is the difference between maximum load and minimum load, B is the thickness of the CT sample, W is the width of the CT sample, and h (x) is the function of crack length a and the CT sample width in Equation 6:
The scatter plot of samples ΔK and da/dN obtained under the above calculation formula is marked in the double logarithmic coordinate system, as shown in Figure 6. lgC and m can be obtained by fitting the discrete points at least square method. lgC and m of samples 1–6 are shown in Table 3. The average values obtained are lgC = −7.166 (C = 6.82 × 10⁻⁸) and m = 2.257, with minimal scatter among specimens. The obtained m = 2.257 falls within the typical range for ferritic-bainitic steels, indicating moderate sensitivity of da/dN to ΔK. For example, 42CrMo high-strength steel exhibits m = 2.68 and C = 1.45 × 10⁻⁸ under the low stress ratios (Sui et al., 2023). The C value further confirms the superior fatigue resistance of B780CF steel.

Figure 6. Experiment lg(da/dN)-lg(ΔK) scatter plot.
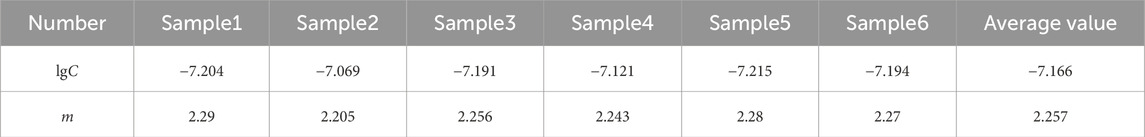
Table 3. Fitting data for lgC and m.
Based on the experimental a–N curves in Figure 5 and the range of stress intensity factors (ΔK) in Figure 6, three distinct fatigue crack growth stages are identified in B780CF steel:
(1) Near-Threshold Stage: occurs at small initial crack lengths (15–25 mm), where ΔK is close to the threshold value. Here, crack growth is dominated by microstructural interactions, such as grain boundary deflections and tortuous paths induced by the fine granular cementite-ferrite mixture.
(2) Stable Propagation Stage: Extends from approximately 25–32.5 mm crack length, where ΔK ranges from 20 to 35 MPa. m1/2. In this stage, the a–N curve shows a linear relationship in the double-logarithmic plot, validating the Paris law with minimal scatter. The slope of the lg(da/dN)–lg(ΔK) curve aligns with the stable propagation regime of ferritic-bainitic steels, where crack growth is primarily driven by stress intensity.
(3) Final Fracture Stage: Initiates when the crack length exceeds 32.5 mm, characterized by a steep increase in the a–N curve slope. At this stage, ΔK surpasses the critical stress intensity factor, leading to unstable crack propagation and imminent fracture.
3 Numerical simulation of fatigue crack propagation
3.1 Calculation of numerical simulation stress intensity factor
The fracture criterion of linear elastic fracture mechanics is established with J-integral as the parameter. Therefore, the commercial finite element software Abaqus was used for numerical simulation in this paper, and the relevant calculation was carried out based on J-integral linear elastic fracture mechanics.
The J-integral criterion states that when the J-integral surrounding the crack front reaches a critical value, the crack begins to propagate. It is a contour integral around the crack tip, and its value is a constant independent of the integration path. This value can reflect the intensity of the stress-strain field at the crack tip, and the numerical solution of this parameter is less dependent on the singularity at the crack tip, eliminating the need for special refinement of elements at the crack tip. This characteristic aligns well with the properties of the extended finite element method (XFEM), making it an effective computational method for determining fracture mechanics parameters such as the stress intensity factor. The expression in Equation 7 is as follows:
In the formula, Γ represents an integration curve around the crack tip, with the counterclockwise direction taken as positive, starting from the lower surface of the crack and ending at the upper surface of the crack. s is the arc length of the integration path; T is the traction force on the integration boundary; u is the displacement on the integration boundary;
where w is the cross-strain energy of the actual field and the auxiliary field. σij is the stress components; εij is the strain components.
The J-integral value reflects the strain energy in the crack tip region, that is, the degree of stress strain concentration. In the linear elastic state, it has a clear physical meaning, which is the strain energy release rate—the energy released per unit area as the crack extends, characterizing the intensity of the stress-strain field near the crack tip. Under linear elastic conditions, the relationship between J-integral and stress intensity factor K for type I cracks in Equation 9 is as follows:
where E is the elastic modulus.
3.2 Numerical simulation model and parameter setting
The model used for the numerical simulation of fatigue crack propagation is the same as the compact tensile specimen of B780CF steel shown in Figure 1. In the numerical simulation model, the material parameters were defined as follows: the elastic modulus was set to 210 GPa, Poisson’s ratio to 0.3, and tensile strength to 847 MPa. The Paris law parameters were configured with lgC = −7.166 and m = 2.257. For damage evolution, an energy-based criterion was adopted, with linear in the Softening.
The accuracy of numerical simulation results is closely related to the meshing around the crack tip of CT sample model. The model is meshed by the common meshing method, and the grid diagram of the encrypted crack growth path is shown in Figure 7.
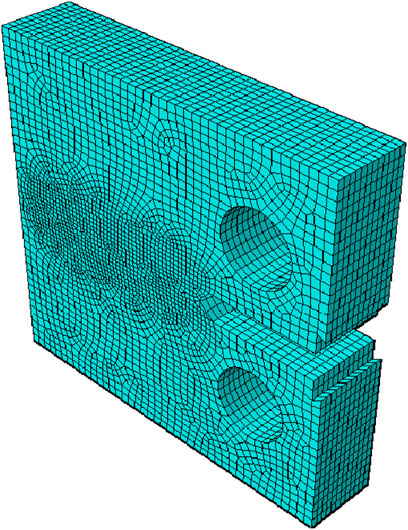
Figure 7. Common meshing model.
It can be seen from Figure 7 that the width of the mesh encryption part is the same as the defect part of the CT sample, resulting in larger blocks divided along the crack propagation path. If the mesh of this part is continued to be encrypted, the calculation amount of the crack tip will increase. If we do not continue the encryption finite element calculation convergence will be affected, so it is necessary to improve the mesh division, so that the numerical simulation results are convergent and accurate without excessive computation. The improvement method is as follows: When the refined mesh is carried out, the model is divided into upper and lower parts based on the defective parts in the middle of the two loading holes. The lower part is in a left and right symmetric state, and the modules on the crack propagation path are reduced as far as possible to facilitate mesh refinement. The prefabricated cracks for numerical simulation are assembled in the middle part. When the module is divided, the structure of the two loading holes is kept intact to improve the accuracy of applying constraints and loads; and eliminate external influences. During the initial stage of the test, the crack propagation rate was relatively slow, and the elastic-plastic stress-strain field near the crack tip exhibited steep gradients. To ensure numerical accuracy, mesh refinement was implemented along the crack propagation path, with element density gradually decreasing outward. The conventional meshing model comprised 69,468 elements, while the optimized model contained 78,456 elements, including 23,708 linear hexahedral elements (C3D8R type) along the crack propagation path. Subsequently, a 15 mm prefabricated crack is inserted into the model. The finite element analysis model is shown in Figure 8.
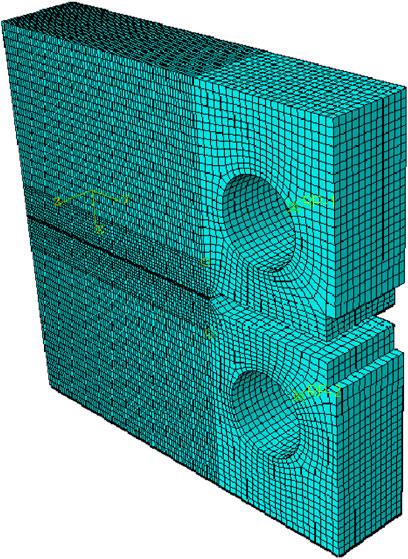
Figure 8. Prefabricated crack finite element analysis model.
To improve the convergence of model analysis, the maximum number of incremental steps is set to 1 × 10⁵, with an initial increment step of 0.001, the minimum value is 1 × 10⁻¹², and the maximum value is 0.1. The loading hole on the left applies the load, and the loading hole on the right applies the constraint. The von Mises stress cloud diagram of the loading process of the numerical simulation of fatigue crack growth for B780CF steel is shown in Figure 9. It can be seen from the figure that the von Mises stress cloud diagram area at the crack tip increases with the continuous expansion of the fatigue crack, consistent with the fundamental principle of fracture mechanics: stress concentration intensifies as the crack grows, leading to a larger high-stress region near the tip. This observation aligns with linear elastic fracture mechanics (LEFM) predictions for stress intensity factor dominance in the crack growth driving force, as well as elastic-plastic fracture mechanics (EPFM) descriptions of localized plastic deformation around the crack tip.
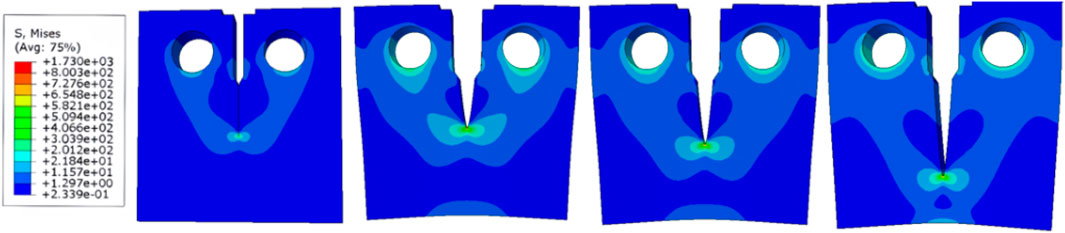
Figure 9. Numerical simulation of the loading process of fatigue crack propagation.
4 Comparative analysis of experiment and simulation
4.1 Comparison of crack length and fatigue life
The data of crack length a and fatigue life N obtained by test and numerical simulation are plotted in Figure 10.
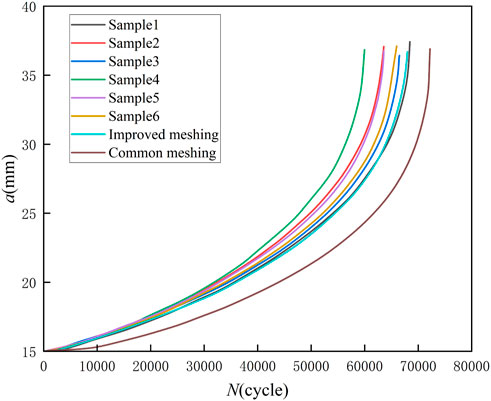
Figure 10. Experimental and numerical simulation of a-N curves.
As shown in Figure 10, the numerical simulation matches well with the test specimen in the early stages of crack propagation. However, as the crack continues to expand, there is an error between the fatigue life of the numerical simulation and the specimen at the same crack length. The fatigue crack propagation test of B780CF steel has a good agreement with the model simulation results of improved meshing, but a poor agreement with the model simulation results of common meshing. In order to visually compare the results of the test and numerical simulation, the comparative results of the relative errors of the crack propagation cycle life data of the test and numerical simulation are listed in Table 4 based on the model data of the improved meshing method. Based on the data of common meshing models, the relative error comparison results between them and the test data are listed in Table 5.
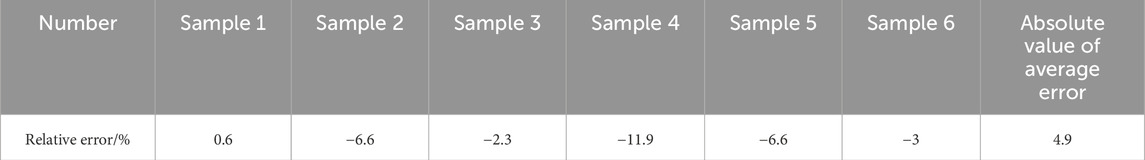
Table 4. Comparison of cycle error between experimental and improved meshing model simulation.
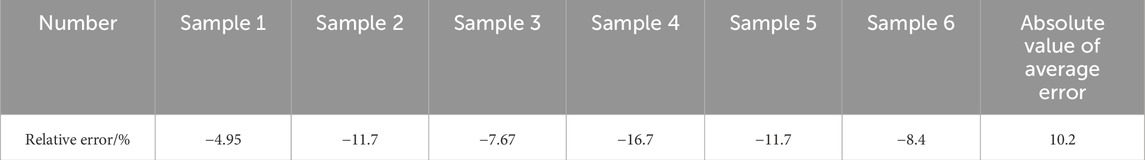
Table 5. Comparison of cycle error between experimental and common meshing model simulation.
According to Tables 4, 5, the absolute value of average error between the experimental results and the numerical simulation results of the improved meshing method is 4.9%, and the average absolute error between the experimental results and the results of the common grid division method is 10.2%. It is considered that the improved grid division method is effective, an average error of ≤5% is widely regarded as acceptable in engineering practice.
4.2 Comparison of fatigue crack propagation rate and stress intensity factor range
The fatigue crack propagation rate and stress intensity factor range of the sample and the numerical simulation were plotted in the double-logarithmic coordinate system, and the least square method was used for linear fitting, as shown in Figure 11. In Figure 11, the trend of the numerical simulation values is the same as that of the experimental mean values, lg(ΔK) is positively correlated with lg(da/dN). The linear equation of the crack propagation rate simulated by the improved meshing model is closer to the experimental mean value of the fatigue crack propagation rate than that simulated by the common meshing model, The slopes of the linear fitting equations for the fatigue crack propagation rates simulated by the two meshing models exceed the mean slope derived from the experimental samples, with the conventional meshing model yielding the largest slope. During the initial crack propagation stage, the experimental crack growth rates surpass those predicted by both meshing models. However, as crack propagation progresses, the simulated crack growth rates from both meshing models exhibit a gradual increase.
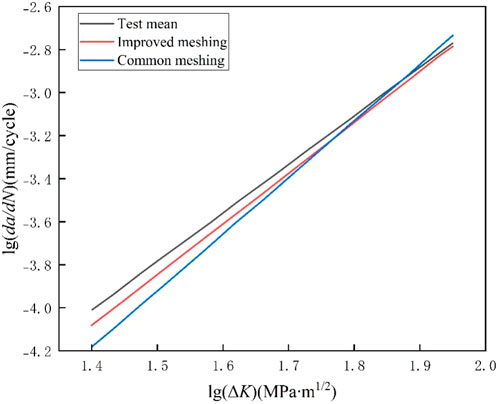
Figure 11. Fitted linear equations.
5 Conclusions
Through the fatigue crack propagation test and numerical simulation of the CT sample of B780CF steel, the following conclusions can be drawn:
(1) Fatigue crack propagation tests on B780CF steel CT specimens successfully established the relationship between crack length (a) and cyclic life (N), with the Paris formula effectively characterizing the fatigue crack growth rate (FCGR) in terms of the range of stress intensity factors (ΔK).
(2) The numerical simulation of fatigue crack propagation of B780CF steel based on J-integral is carried out by using the improved mesh division method. The area of the von Mises stress cloud diagram at the crack tip increased with the expansion of the fatigue crack during numerical simulation loading.
(3) Comparative analysis revealed that the improved meshing method reduced the average error in cyclic life prediction to 4.9%, significantly outperforming conventional meshing approaches (10.2% error). The discrepancies between experimental samples and numerical simulations may arise from rolling-induced defects in the steel plate or interference from experimental instabilities. Numerical simulations represent an idealized representation of the testing process, assuming homogeneous, stable, and isotropic material properties, From an engineering perspective, the observed errors between experimental and simulated results are practically acceptable.
(4) Under the applied low stress ratio (R = 0.1), mechanisms such as fatigue crack closure (e.g., plasticity-induced or roughness-induced closure) may influence crack growth behavior. The potential role of closure effects in reducing the effective driving force aligns with classical models (e.g., Elber’s closure theory). Additionally, the fine bainitic microstructure of B780CF steel could contribute to roughness-induced crack lag by promoting crack path tortuosity. Future work could integrate closure models (e.g., the Newman model) to further refine fatigue life predictions under varying stress ratios.
Data availability statement
The original contributions presented in the study are included in the article/supplementary material, further inquiries can be directed to the corresponding author.
Author contributions
LG: Writing – original draft. ML: Data curation, Writing – original draft, Investigation. TZ: Software, Writing – original draft, Methodology. GL: Writing – review and editing.
Funding
The author(s) declare that no financial support was received for the research and/or publication of this article.
Conflict of interest
The authors declare that the research was conducted in the absence of any commercial or financial relationships that could be construed as a potential conflict of interest.
Generative AI statement
The author(s) declare that no Generative AI was used in the creation of this manuscript.
Publisher’s note
All claims expressed in this article are solely those of the authors and do not necessarily represent those of their affiliated organizations, or those of the publisher, the editors and the reviewers. Any product that may be evaluated in this article, or claim that may be made by its manufacturer, is not guaranteed or endorsed by the publisher.
References
Chen, H. T., Liu, S. Y., Wang, P., Wang, X. B., Liu, Z. B., and Aldakheel, F. (2024). Effect of grain structure on fatigue crack propagation behavior of 2024 aluminum alloy under different stress ratios. Mater. Des. 244, 113117. doi:10.1016/j.matdes.2024.113117
Hosseini, R., and Seifi, R. (2020). Fatigue crack growth determination based on cyclic plastic zone and cyclic J-integral in kinematic – isotropic hardening materials with considering Chaboche model. Fatigue Fract. Eng. Mater. Struct. 43 (11), 2668–2682. doi:10.1111/ffe.13330
Htut, Z. L., Osawa, N., Tanaka, S., and Toyosada, M. (2024). Efficient technique for evaluation of three-dimensional elastic–plastic fracture mechanics parameters based on equivalent distributed stress concept. Theor. Appl. Fract. Mech. 131, 104357. doi:10.1016/j.tafmec.2024.104357
Jia, M. D., Wu, Z. M., Jiang, X. Y., Yu, R. C., Zhang, X. X., and Wang, Y. J. (2024). Modified Paris law for mode I fatigue fracture of concrete based on crack propagation resistance. Theor. Appl. Fract. Mech. 131, 104383. doi:10.1016/j.tafmec.2024.104383
Kim, Y., Bae, J., Lee, J., Kang, H., Kim, J. G., and Kim, S. (2024). Effect of stabilization annealing on fatigue crack propagation behavior of inconel 706 alloy at 25 and 650°c. J. Mater. Res. Technol. 30, 7084–7094. doi:10.1016/J.JMRT.2024.05.030
Kumar, M., Singh, I. V., and Mishra, B. K. (2019). Fatigue crack growth simulations of plastically graded materials using XFEM and J-integral decomposition approach. Eng. Fract. Mech. 216, 106470. doi:10.1016/j.engfracmech.2019.05.002
Kumar, S., Mandal, G. K., and Mukherjee, K. (2024). Stretch flangeability of low carbon micro-alloyed ferrite-pearlite and ferrite-bainite steel. Metallurgical Mater. Trans. 55 (10), 4093–4107. doi:10.1007/s11661-024-07539-w
Kyungmin, B., Ingyun, C., and Hyunseong, S. (2020). Multiscale study for the temperature effect on the mechanical properties and fatigue crack growth rate of polyamide 66. Extreme Mech. Lett. 43 (10), 2416. doi:10.1111/ffe.13312
Li, C., Duan, R., Fu, W., Gao, H., Wang, D., and Di, X. (2021). Improvement of mechanical properties for low carbon ultra-high strength steel strengthened by Cu-rich multistructured precipitation via modification to bainite. Mater. Sci. Eng. 817, 141337. doi:10.1016/j.msea.2021.141337
Li, L., Yang, Y. H., Xu, Z., Chen, G., and Chen, X. (2014). Fatigue crack growth law of API X80 pipeline steel under various stress ratios based on J-integral. Fatigue Fract. Eng. Mater. Struct. 37 (10), 1124–1135. doi:10.1111/ffe.12193
Lian, F., Hu, J., Liu, J., Xu, J., and Zhao, Y. (2024). Model for predicting type Ι fatigue crack growth rate in RKE field considering stress gradient. Eng. Fract. Mech. 311, 110579. doi:10.1016/j.engfracmech.2024.110579
Niu, Y. F., Fan, J. Q., Shi, X. Y., Wei, J. X., Jiao, C. J., and H, J. (2022). Application of the J-integral and digital image correlation (DIC) to determination of multiple crack propagation law of UHPC under flexural cyclic loading. Materials. 16 (1), 296. doi:10.3390/MA16010296
Park, T., Kitahara, A., Ishina, T., Hamada, S., and Noguchi, H. (2023). Proposal of new crack-tip-opening-displacement as a mechanical driving force of elastic-plastic fracture mechanics. Theor. Appl. Fract. Mech. 128, 104116. doi:10.1016/j.tafmec.2023.104116
Song, W., Huang, T., Zhou, G. T., Xie, H. T., Wang, X. X., He, M., et al. (2024). Fatigue cracking propagation behavior of 10CrNi3MoV steel mismatched welded joints at sub-temperature. Eng. Fract. Mech. 313, 110669. doi:10.1016/j.engfracmech.2024.110669
Sui, G. Y., Wang, Z. Q., Jiang, F. C., Zhao, C. Z., B Guo, Y., and Li, W. Y. (2023). Fatigue crack growth behavior of 42CrMo high-strength steel with tempered sorbite/bainite microstructures: roles of grain and constituent in microstructures. Eng. Fract. Mech. 279, 109051. doi:10.1016/j.engfracmech.2023.109051
Wang, J., Jiang, W., Li, Y. Y., Wang, Q., and Xu, Q. (2018). Numerical assessment of cyclic J-integral △J for predicting fatigue crack growth rate. Eng. Fract. Mech. 205, 455–469. doi:10.1016/j.engfracmech.2018.11.031
Wang, L., Zhang, C., Tao, C. C., Ji, H. L., Yang, Y. Y., and Qiu, J. H. (2023). Prediction of multiple fatigue crack growth based on modified Paris model with particle filtering framework. Mech. Syst. Signal Process. 90, 110124. doi:10.1016/j.ymssp.2023.110124
Yang, X. S., Xiao, W. Y., Huang, W. J., Zhu, X. J., Liu, M. F., and Qian, Y. Z. (2025a). The influence of stress levels on crack initiation and propagation behaviors of an Al-Li alloy under high cycle fatigue. Int. J. Fatigue 197, 108934. doi:10.1016/j.ijfatigue.2025.108934
Yang, Y., Zhang, Q. W., J Ma, R., and Pan, Z. C. (2025b). Investigation of multiple fatigue crack propagation behavior in corroded high-strength steel wires using Peridynamic simulation and beach mark testing. Eng. Fail. Anal. 172, 109409. doi:10.1016/j.engfailanal.2025.109409
Yi, Q., Liu, X., Wang, S., Chang, H., Jiang, J., and Wang, W. (2025). Failure mechanism and crack propagation behavior of turnout stock rail in high-speed railway. Eng. Fail. Anal. 167 (PB), 109026. doi:10.1016/J.ENGFAILANAL.2024.109026
Zhou, Q. Z. Y., Guo, X. Y., Yang, Y., Zhou, X., and Xu, K. T. (2024). Surface fatigue crack propagation behavior of CFRP-steel plates with improved J-integral driving model. Int. J. Fatigue 185, 108330. doi:10.1016/J.IJFATIGUE.2024.108330
Keywords: B780CF steel, fatigue crack propagation test, range of stress intensity factors, J-integral, numerical simulation
Citation: Gu L, Li M, Zhang T and Li G (2025) Fatigue crack propagation test and numerical simulation analysis of B780CF steel. Front. Mater. 12:1593388. doi: 10.3389/fmats.2025.1593388
Received: 14 March 2025; Accepted: 07 May 2025;
Published: 21 May 2025.
Edited by:
Geoffrey Robert Mitchell, Polytechnic Institute of Leiria, PortugalReviewed by:
Amir R. Masoodi, Ferdowsi University of Mashhad, IranAndrea Chiocca, Università di Pisa, Italy
Copyright © 2025 Gu, Li, Zhang and Li. This is an open-access article distributed under the terms of the Creative Commons Attribution License (CC BY). The use, distribution or reproduction in other forums is permitted, provided the original author(s) and the copyright owner(s) are credited and that the original publication in this journal is cited, in accordance with accepted academic practice. No use, distribution or reproduction is permitted which does not comply with these terms.
*Correspondence: Guirong Li, MTQ4NjY5NzUyN0BxcS5jb20=