 Xia Li
 Jun Du
 Xinggang Shen1
 Chenghan Wang
 Mingjie Jiang
- 1College of Architecture and Civil Engineering, Kunming University, Kunming, Yunnan, China
- 2College of Civil Engineering and Architecture, Guangxi University, Nanning, Guangxi, China
- 3Key Laboratory of Disaster Prevention and Structural Safety of Ministry of Education, Guangxi University, Nanning, Guangxi, China
- 4Key Laboratory of Disaster Prevention and Mitigation and Engineering Safety of Guangxi, Nanning, Guangxi, China
Coarse-grained soil is a common material for earth-rock dams and soft-ground projects. However, such soil particles are prone to breakage under load, thus affecting project safety. Accurately understanding the particle breakage characteristics is crucial to the safety design of related projects. Due to the scale effect, the indoor test results of scaled soil materials often fail to effectively reflect the breakage of coarse-grained soil particles with the original gradation. According to previous studies, the scale effect of scaled soil materials is mainly affected by the maximum particle diameter Dmax and the gradation structure. Among them, the gradation structure can be represented by the gradation area S. By changing the gradation area S and the maximum particle diameter Dmax, 39 coarse-grained soil specimens with the same relative compaction were prepared for loading tests on a large-scale triaxial coarse-grained soil test system. The indices Bw and Bg were developed to quantitatively analyze the scale effect’s influence on coarse-grained soil particle breakage, with a focus on identifying strategies to mitigate this scale effect. The test results show the following findings: Maintaining a constant maximum particle diameter, the indices Bw and Bg for particle breakage show a decrease as the gradation area enlarges, revealing a logarithmic correlation. Conversely, with a stable gradation area, these indices, Bw and Bg, rise as the maximum particle diameter increases, indicating an exponential relationship. The experimental findings led to the development of a scale effect-based calculation model for Bw and Bg using the similar gradation approach, whose accuracy has been confirmed. Furthermore, a prediction technique for the breakage degree of original-gradation coarse-grained soil under specific confining pressure was formulated using indoor test data, potentially enhancing project design safety. In the design of earth-rock dams, the research results can be used to more accurately predict the degree of particle breakage of coarse-grained soil with the original gradation. This can optimize the design of the dam body structure and improve the safety of the project.
1 Introduction
Recent progress in soil mechanics and geotechnical engineering has deepened our understanding of coarse-grained soil properties and behaviors in various projects. Known for its superior engineering qualities, including high strength, minimal deformation, and notable water permeability, coarse-grained soil is a vital component in earth-rock dam construction. The tendency of these soil particles to break under stress significantly impacts their strength, permeability, and deformation characteristics, posing potential safety risks in earth-rock dam projects (Cai et al., 2016; Li et al., 2022; Xu et al., 2017; Shi et al., 2025; Shi et al., 2024; Shi et al., 2023; Wu et al., 2025; Wu et al., 2024; Wu et al., 2022; Wu et al., 2020a). Therefore, elucidating the mechanism of particle breakage and its evolutionary pattern is crucial for the safe design of such projects.
Currently, research into the breakage of coarse-grained soil particles predominantly employs experimental methods. While acquiring test data is relatively straightforward, the restriction of testing equipment size necessitates the scaling of the original gradation to create testable specimens. This scaling is essential to fit the limitations of the test instruments. However, as scaling changes the pore size and connectivity between the soil particles, the test results of scaled specimens often cannot accurately reflect the true engineering properties of the materials with the original gradation, i.e., the scale effect (Wu et al., 202b; Wang et al., 2013). The scale effect also influences the breakage indexes of coarse-grained soil particles, which could impact the safety of earth-rock dam projects. Research indicates that changes in the gradation of coarse-grained soil are the primary reason for the scale effect (Wu et al., 2019; Wu et al., 2020c). Hence, it is vital to investigate how the gradation of coarse-grained soil affects its particle breakage indexes. This understanding is crucial for addressing the impact of the scale effect on these indexes and developing strategies to mitigate this effect.
The breakage phenomenon of coarse-grained soil particles has long been a focal point of concern among experts and scholars in the geotechnical engineering domain. To conduct in-depth investigations, researchers have employed a combination of experimental and simulation techniques to establish and identify various particle breakage indexes. These methods have enabled a comprehensive understanding of the complex mechanisms underlying particle breakage, facilitating the development of more accurate theoretical models and practical engineering applications. Currently, a wide array of quantitative indexes for describing the gradation changes in particle breakage has been introduced. These can be broadly categorized into three types. The first type centers around specific particle sizes or characteristic indexes. For example, the breakage index proposed by Lee and Farhoomand (1976) is based on the changes in particle size d15 before and after breakage, and the breakage index proposed by Biarez and Hicher (1997) describes the changes in the non-uniform coefficient Cu. The second category is based on the different soil particle fractions, represented by Bg defined by Marsal (1967), and the third category is based on the energy changes before and after the breakage, represented by Br defined by Hardin (1985). The common breakage indexes are listed in Table 1.
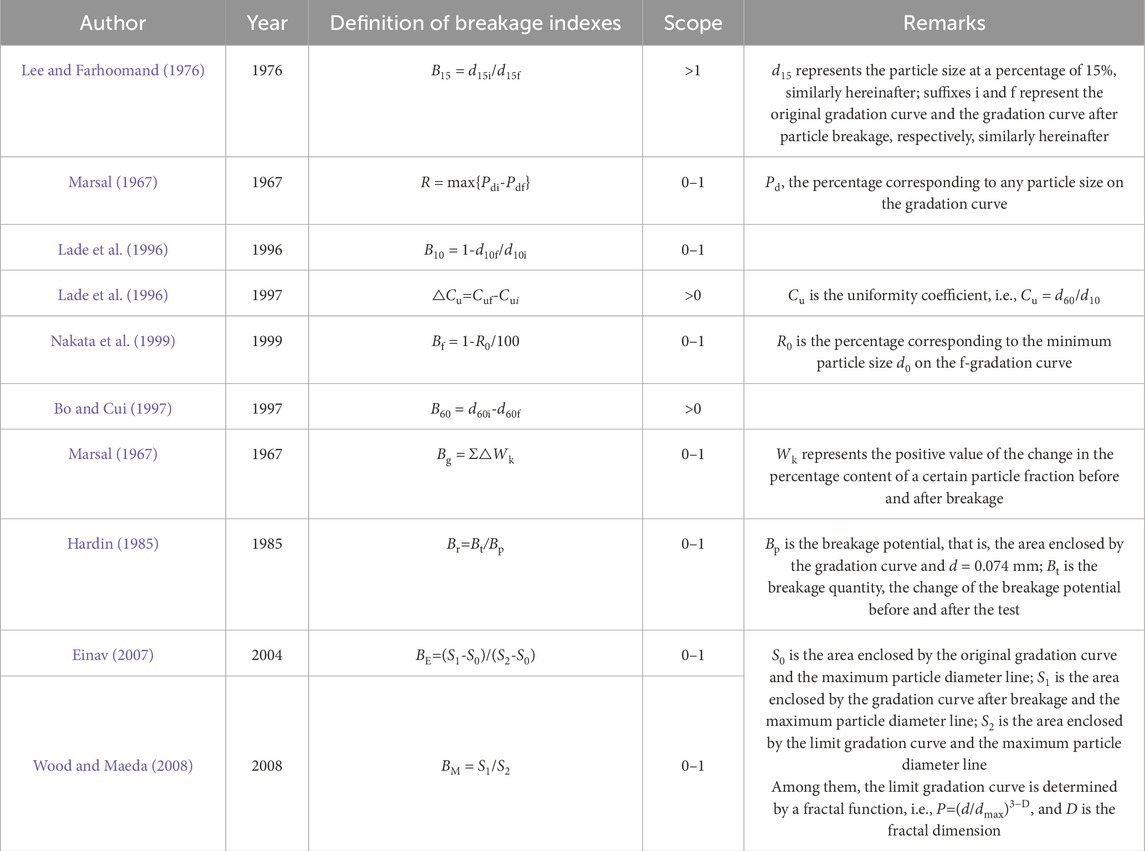
Table 1. Summary of test soil sample gradation parameters and sample preparation density.
In recent years, scholars have carried out numerous experimental studies on the relationship between the characteristic parameters of coarse-grained soil gradation and particle breakage indices. These studies have yielded many important scientific research achievements, providing valuable insights for geotechnical engineering. Bo and Cui (1997) found that the compressive deformation of the rockfill depends mainly on the frictional resistance of the particles against displacement and the breakage quantity of the rocks. In the case of rocks with high hardness, good gradation, and small porosity, the frictional resistance between the particles is large, and the compressive deformation is small. Using super-large and large triaxial test systems, Ling et al. (2011) tested rockfill materials with different maximum particle diameters after gradation scaling and found that under the same stress conditions, the particle breakage rate increased with the maximum particle diameter. They also found that under small stress conditions, the breakage rate of rockfill materials with different maximum particle diameters was similar. Cai et al. (2016) found through large-scale triaxial tests that the gradation significantly affected the particle size distribution of the specimen after shearing, and the breakage was more intensive when the particles were more coarse. Consequently, quantifying the scale effect’s impact on these indexes remains a complex task. Additionally, understanding the variation patterns in coarse-grained soil particle breakage indexes after gradation scaling is still in a qualitative research phase. Thus, developing a formula to calculate particle breakage influenced by scale effect is of significant importance.
To investigate the scale effect’s influence on coarse-grained soil particle breakage indexes, experimental studies were conducted, focusing on the soil’s breakage and evolution under varying gradations and maximum particle sizes. Based on the gradation equation for coarse-grained soil proposed by Zhu et al. (2017), 39 coarse-grained soil specimens were prepared by controlling the relative compaction constant and changing the gradation area and maximum particle diameter. Large-scale triaxial consolidation drained tests were conducted under known confining pressure, and appropriate breakage indexes were selected to quantify the test results. This study examined how gradation area S and maximum particle diameter Dmax affect these indexes and developed a model to quantitatively relate scale effect to particle breakage indexes. The research aimed to predict the breakage indexes of original-gradation materials accurately and mitigate scale effect impact, providing insights for safer earth-rock dam designs. In terms of methodology, by precisely controlling the specimen gradation based on the continuous gradation equation, it is possible to conduct a more in-depth investigation into the influence of gradation changes on particle breakage compared to traditional methods. Regarding the research findings, this study quantitatively reveals, for the first time, the logarithmic and exponential relationships between the gradation area, the maximum particle diameter, and the particle breakage indices. In practical applications, the proposed prediction technique can accurately estimate the degree of particle breakage of in-situ coarse-grained soil using indoor test data, providing a more reliable basis for engineering design.
2 Theoretical basis
2.1 Determination of gradation indexes
In order to reflect the effect of particle gradation on particle breakage, the gradation equation proposed by Zhu et al. (2017) was used to quantitatively describe the soil gradation, which can be expressed as Equation 1:
P signifies the percentage of soil particles smaller than a given size, and d represents the size of the soil particles in millimeters. dmax is the maximum diameter of the soil particles, also in millimeters. The parameters b and m in the equation are crucial as they define the shape and slope of the gradation curve, thereby influencing the gradation characteristics of the soil. This equation is fundamental in quantifying how gradation affects particle breakage.
The maximum value of P is 100%, and its minimum value is infinitely close to but not equal to 0. Therefore, it is impossible to integrate P over the range of 0–1 when using integral to calculate the area. Guo et al. (2019) divided the area S enclosed by the gradation curve and the maximum particle diameter line into two parts, SA and SB, as shown in Figure 1. Among them, SA is enclosed by the gradation curve, the maximum particle diameter line, and the P = k line, which can be calculated by integrating P over the range of k to 1; SB is rectangular with the length of (logDmax - logdk) and the height of k, whose area can be calculated directly; if k tends to 0, then SA + SB can be regarded as the total area S.
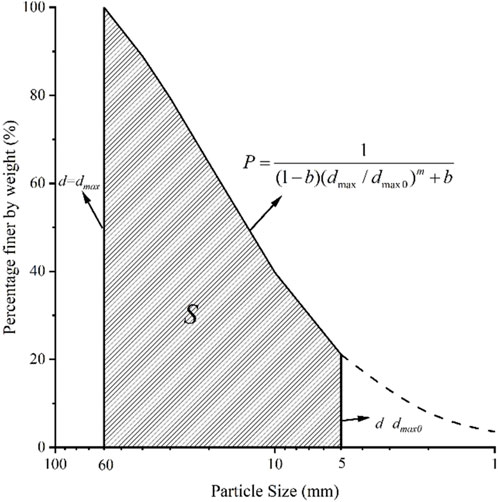
Figure 1. Schematic of S.
The gradation area S is enclosed by the gradation equation curve, the horizontal axis of the coordinates, the maximum particle diameter line d = Dmax and the d = Dmax0 line. Its calculation is as Equations 2, 3:
where
According to the above equation, the area of the gradation curve can be calculated by substituting the parameters m, b, and Dmax/Dmax0 into the equation. If Dmax/Dmax0 can be determined as a constant, the area S of the gradation curve is determined by m and b, and the gradation structure is only related to m and b. Therefore, the gradation area can serve as a characteristic parameter to represent the gradation structure changes. Guo (Guo, 2003) suggested using 5 mm as the boundary particle size between sand and gravel. Therefore, when calculating the gradation area S in this study, Dmax was set to 60 mm, and Dmax0 was set to 5 mm.
2.2 Particle breakage index
Rock and soil particle breakage is generally divided into three types (Lade et al., 1996), namely, fracturing, breakage, and grinding, as shown in Figure 2.
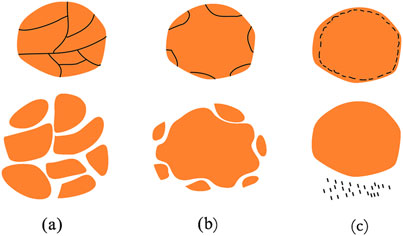
Figure 2. Types of rock and soil particle breakage. (a) Fracturing, (b) Breakage, (c) Grinding.
Geotechnical particles breaking into multiple irregular particles is due to the defects in their structure, as shown in Figure 2a. Geotechnical particles with multiple angles contact each other, leading to stress concentration and causing the angles to fall off, as shown in Figure 2b. In addition, geotechnical particles with a more uniform shape and a lower surface roughness experience friction against each other, rendering the shape more uniform and the surface smoother, as shown in Figure 2c.
In the context of particle breakage measurement, the multi-particle size index Bg, conceptualized by Marsal (1967), serves as a vital metric. This index is calculated by summing up the absolute values of the differences in the percentage of particle composition before and after the test, thereby reflecting the degree of particle breakage. The Bg as Equation 4 Bg’s methodological simplicity and comprehensive consideration of gradation changes have made it a popular choice among researchers. As part of the model, Bg is determined by summing the positive differences (ΔWk-ΔW0k) in particle fraction content before and after testing. This process involves calculating changes in each particle fraction’s content and then summing half of these changes to arrive at Bg’s value, offering a balanced and nuanced measure of particle breakage.
ΔW0k represents the quantity of a specific particle size in the gradation curve prior to breakage, whereas ΔWk indicates the quantity of a particle size in the gradation curve following breakage.
As shown in Figure 3, ΔW0k and ΔWk can be expressed with gradation parameters as Equation 5:
where di and di-1 are the maximum and minimum particle sizes in a particle fraction. According to the Standard for Geotechnical Testing Method (Liu et al., 2020), di is usually the pore size used for particle analysis tests, that is, 60, 40, 20, 10, 5, 2, 1, 0.500, 0.250, and 0.075 mm.

Figure 3. Schematic of Bg calculated by gradation equation.
In the research conducted by Hardin (1985) and Bo and Cui (1997), the breakage quantity was determined by measuring the area enclosed by the gradation curves before and after particle breakage. They then divided this by their defined breakage potential to calculate the rates of breakage. Specifically, Hardin used the area enclosed by d = 0.074 mm and the original gradation curve as the breakage potential. Einav believed that particles with the same original gradation eventually break into the same limit gradation. Consequently, the decision was made to disregard the d = 0.074 mm measurement. Instead, the area between the original gradation curve and the limit gradation curve was utilized to define the breakage potential, a choice that theoretically held more validity.
Based on the research of Hardin and Einav, Guo et al. (2019) proposed and defined a new breakage rate Bw. Bw is defined as the ratio of the difference between two areas, the one enclosed by the gradation curve after loading and the original gradation curve and the one enclosed by the gradation curve after loading and d = Dmax, and the area enclosed by the original gradation curve and d = Dmax, as shown in Figure 4.
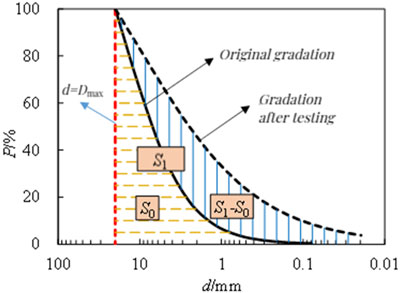
Figure 4. Schematic of Bw.
S0 is the notation used to represent the area enclosed between the original gradation curve and the gradation curve following the test, while S1 denotes the area enclosed by the limit gradation curve and the line representing the maximum particle diameter, d = Dmax. This can be expressed as Equation 6:
If the original gradation curve is represented by gradation parameters b0 and m0, and the gradation curve after particle breakage is represented by b and m, the areas S0 and S1 can be derived by integration, and the breakage index Bw can be expressed as Equation 7:
where k is a constant, 0.01.
Bw reflects the overall changes in gradation and is simple and practical. Therefore, Bw was identified as another breakage index required in the test.
3 Triaxial compression test of coarse-grained soil
3.1 Test equipment
Experiments were performed using the DJSZ-150 dynamic and static triaxial compression testing machine for coarse-grained soil (refer to Figure 5) at the Kunming Institute’s Geotechnical Engineering Experiment Center. This system is capable of dynamic and static loading on soil samples measuring Φ300 mm × 600 mm and accommodates various stress path conditions. The testing apparatus comprises several key components: systems for axial loading and confining pressure loading, along with systems for measuring volume change and porosity, and a servo control system for managing the loading process. The testing machine can provide a maximum confining pressure of 3.0 MPa, static loading of 0–1,500 kN, a volume change measurement range of 0–8,000 mL, and a pore water pressure measurement accuracy of 0.1% F·S. The test data were automatically acquired by computer. Prior to each experiment, a standard pressure source is utilized to calibrate the axial loading system and the confining pressure loading system, ensuring that the pressure measurement error is within ±0.05 MPa. Additionally, standard volume blocks are employed regularly to calibrate the volume change measurement system, guaranteeing that the measurement accuracy remains within the range of ±50 mL.
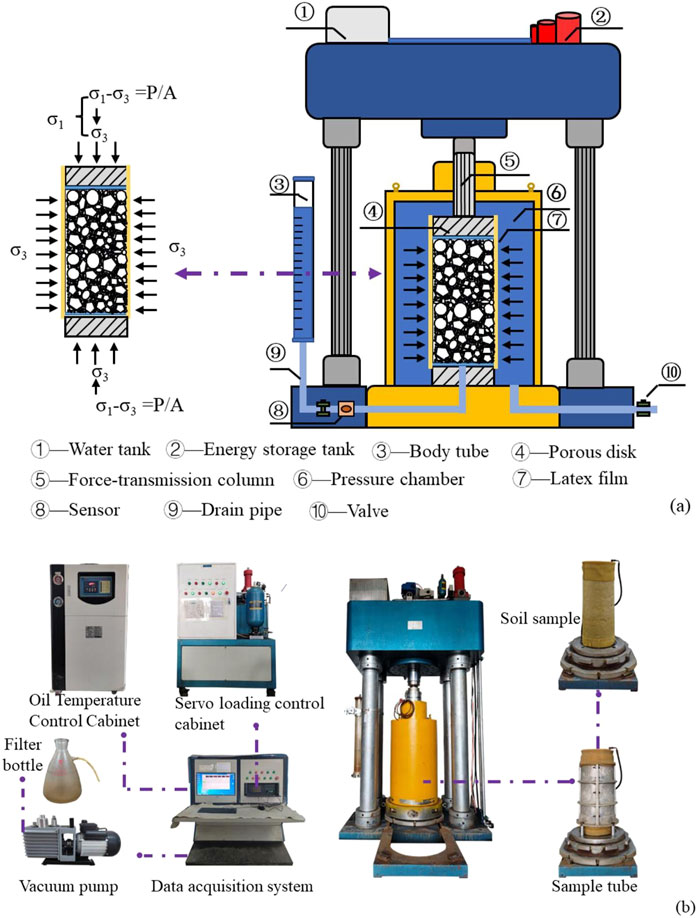
Figure 5. DJSZ-150 coarse-grained soil dynamic and static triaxial compression testing machine. (a,b) correspond schematic diagram and object pictures.
According to the Standard for Geotechnical Testing Method, the particle size of the test soil should be less than 1/5 to 1/6 of the instrument size, that is, the testing machine can shear specimens with a maximum particle diameter of 60 mm. The confining pressures in this experiment were 0.4, 0.8, and 1.2 MPa, and the loading rate was 1 mm/min.
3.2 Test materials
For the experiment, the test material was sourced from the rockfill used in the Lincang Daqiaopo Reservoir’s dam in Yunnan Province. This material, a granular gravel soil, was produced through blasting and subsequent processing. Its particles are mostly angular with rough surfaces. The main minerals are quartz and feldspar, with a small amount of mica. Its originating rock is weakly weathered granite, characterized by an average saturated uniaxial compressive strength of 50 MPa, a softening coefficient of 0.79, and a specific gravity of 2.70. In weakly weathered granite, quartz has a relatively high hardness. During the process of particle breakage, it is relatively resistant to breakage and can enhance the skeletal support effect between particles. Conversely, feldspar has a relatively low hardness and is more prone to breakage under the action of load, which affects the overall strength of the particles and their breakage patterns. Meanwhile, the presence of a small amount of mica reduces the friction between particles, making it easier for particles to slide relative to each other when subjected to force. This, in turn, influences the degree and manner of particle breakage. The combined effects of the characteristics of these mineral components have an impact on the particle breakage results of the coarse - grained soil in this experiment. The properties of the various particle fractions of this test soil, post-screening, are depicted in Figure 6.

Figure 6. The characteristics of each particle group of test soil material.
3.3 Test protocol
Prior research indicates that factors such as the maximum particle diameter and the gradation area significantly influence the strength of coarse-grained soil. In the current study, nine sets of specimens, each with varying gradation areas, S1-40 to S9-40, were designed by keeping the maximum particle diameter constant, with 3 specimens per group. In addition, 4 groups of specimens with different maximum particle diameters, D1-60 to D1-10, were designed by keeping the gradation area constant, with 3 specimens per group. In total, 39 specimens were designed according to the above test gradation configuration.
In practical engineering projects, coarse-grained soils are often subjected to different confining pressure environments. Investigating the particle breakage laws under the combined action of confining pressure, gradation, and maximum particle size is more in line with the actual engineering situation. This can provide more comprehensive data support for engineering design. Thus, the 3 specimens in each group were tested at confining pressures of 0.4 MPa, 0.8 MPa, and 1.2 MPa, respectively, and were recorded as Sn-40–1, Sn-40–2, and Sn-40–3 (n represents any integer from 1 to 9) and D1-m-1, D1-m-2, and D1-m-3 (m represents 60, 40, 20, and 10). Control that all specimens are subjected to the same vertical stress. During the test, apply 50 kN vertical stress to the specimens using a triaxial apparatus. The corresponding gradation parameters and specimen preparation density are listed in Table 2.
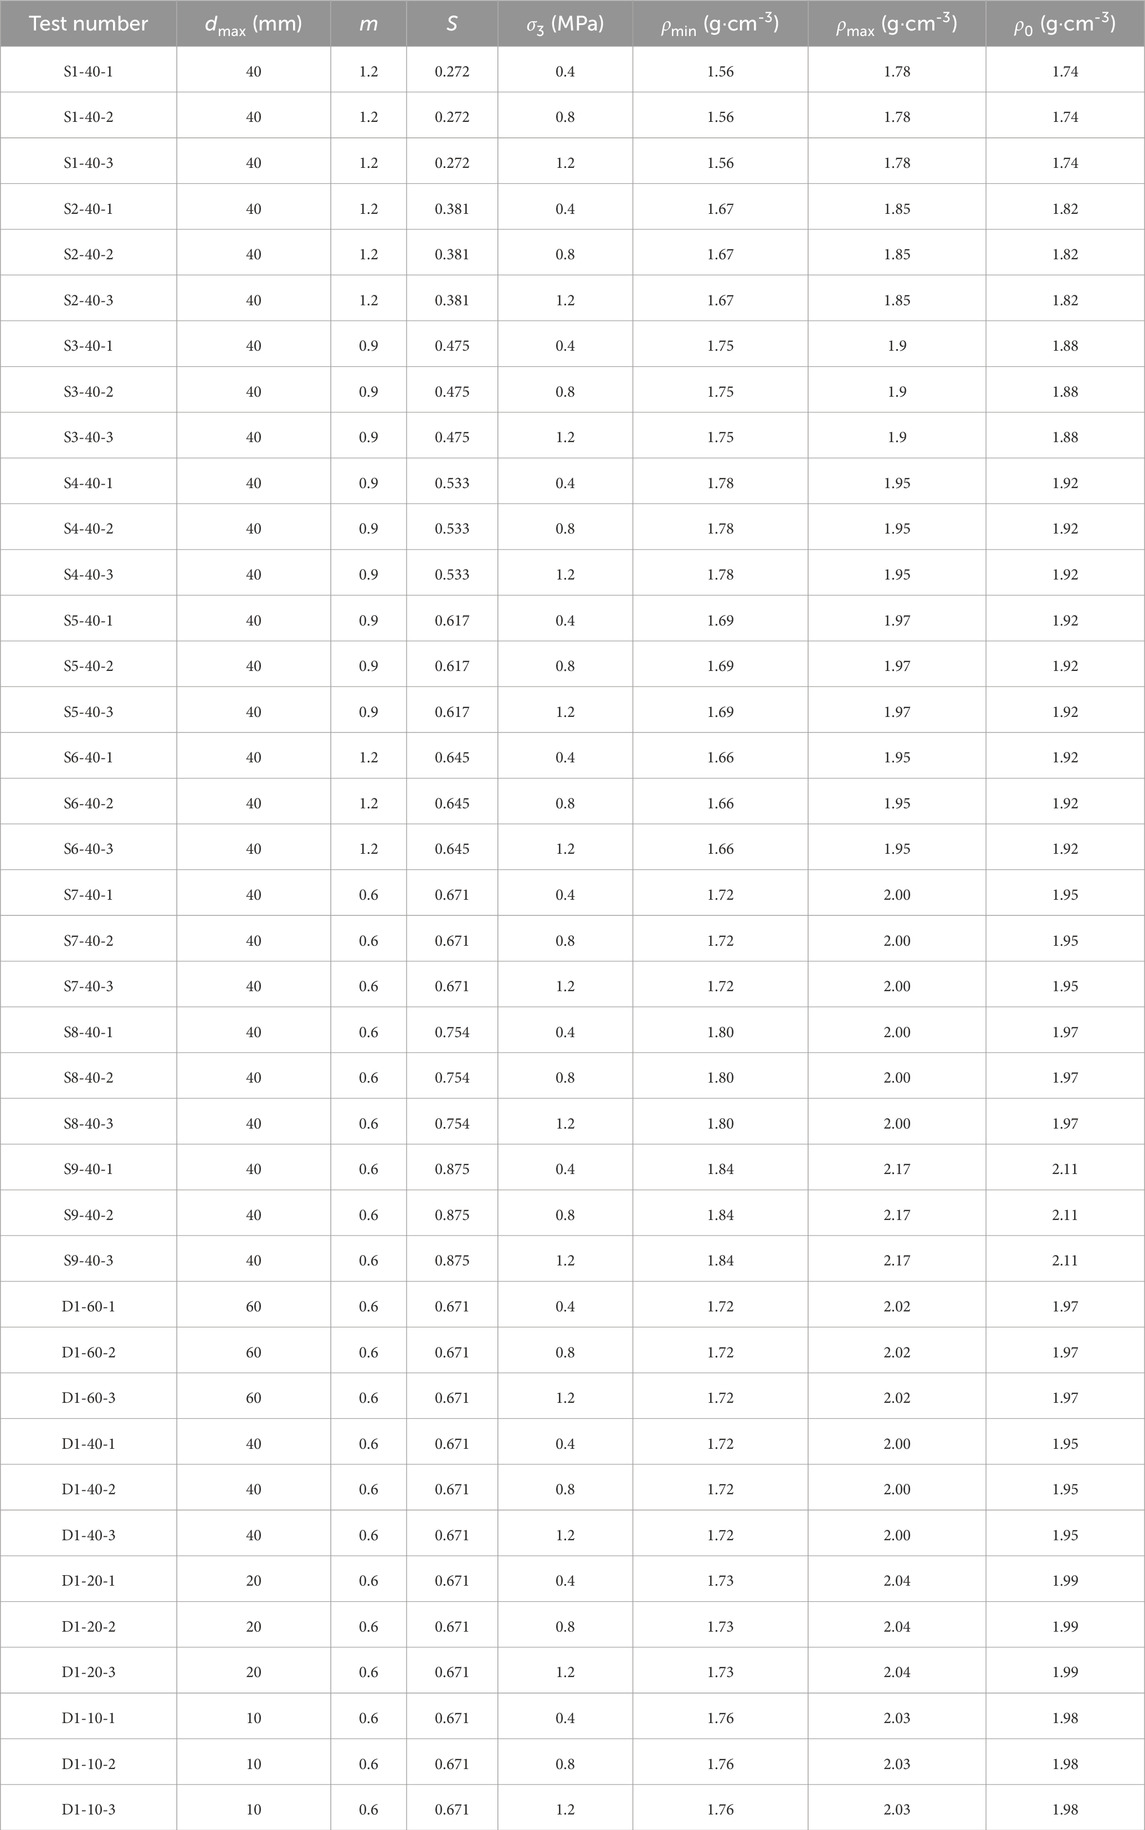
Table 2. Summary of gradation parameters and densities of samples.
Briefly, the test soil material was dried and screened into particle sizes of 60, 40, 20, 10, 5, and 2 mm. The mass of the specimen was calculated based on the dry density and specimen barrel size, and the required soil material was weighed according to the gradations in Table 2. The prepared specimen was mixed until the coarse and fine particles were homogeneous, which was transferred layer by layer into a molding barrel with a rubber film and vibration compacted to prevent the coarse and fine particles from separating. The vibration compaction frequency is 30 Hz, the amplitude is 0.8 mm, and the duration is 5 min. The interlayer contact surfaces were chiseled to reduce the impact of the interlayer effect on the shear test. Through the above procedures, the specimens were prepared. The specimen gradation curves are shown in Figure 7.
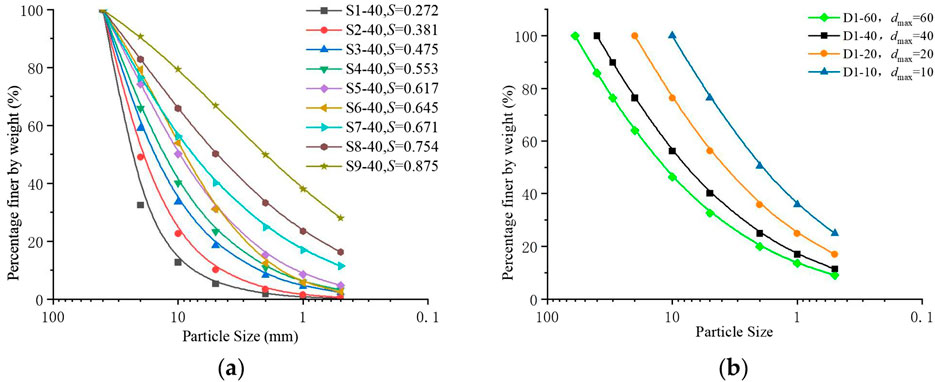
Figure 7. Experimental coarse aggregate gradation curve. (a) The gradation area is different and (b) The maximum particle size is different.
4 Test results and analysis
4.1 Relationship between breakage indexes and gradation area
The triaxial test outcomes for specimens with varying gradation areas (S1-40 to S9-40) provided insights into the relationship between particle breakage indexes Bw and Bg and the gradation area S under three different confining pressures. These relationships are illustrated as scatter points in Figure 8. The fitting curves in Figure 8 reflect the influence trend of the change in the proportion of coarse and fine particles on the degree of particle breakage when the gradation area varies. Notably, as the gradation area S increases, both Bw and Bg indexes exhibit a gradual decline. Upon further expansion of the gradation area, the variation in these breakage indexes tends to stabilize. This phenomenon can be attributed to the following explanation: with the maximum particle diameter constant, an enlarged gradation area increases the proportion of fine particles (d < 5 mm) from 0.5% to 66.8%, simultaneously reducing the relative content of larger particles. Given that finer particles are less prone to breakage compared to coarser ones, specimens with larger gradation areas show lower breakage indexes.
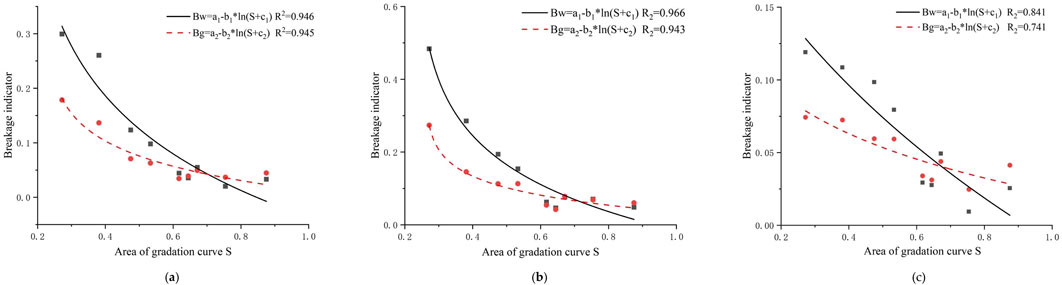
Figure 8. Relationship between area of gradation curve and breakage indicator. (a–c) correspond to confining pressure 0.4 MPa, 0.8 MPa, 1.2 MPa.
Additionally, when the gradation area ranges between 0.2 and 0.6, significant reductions in particle breakage indexes are observed with increasing gradation area. Beyond a gradation area of 0.6, although the breakage indexes continue to decrease as the gradation area grows, the rate of decrease noticeably diminishes. This suggests that once the content of fine particles reaches a certain threshold, further increments in fine particles minimally impact particle breakage, indicating that the primary cause of particle breakage is the fracture of coarser particles. This is consistent with the conclusions of Cai et al. (2016).
Analysis of the gradation area S and the particle breakage indexes Bw and Bg indicates that the effect of S on Bw and Bg can be quantitatively expressed by the following equation:
where a1, b1, c1, a2, b2, and c2 are the fitting parameters of Bw and Bg
Specimens sharing the same maximum particle diameter were analyzed using Equation 8, and their fitting curves are displayed in Figure 8, with the corresponding results detailed in Table 3. Observations from Figure 8 reveal that these fitting curves align closely with the data points. The fitted particle breakage indexes Bw and Bg show determination coefficients exceeding 0.74 when compared to the measured values. Consequently, Equation 8 is shown to be capable of quantitatively capturing the impact of the gradation area S on the particle breakage indexes Bw and Bg in coarse-grained soil with considerable precision.
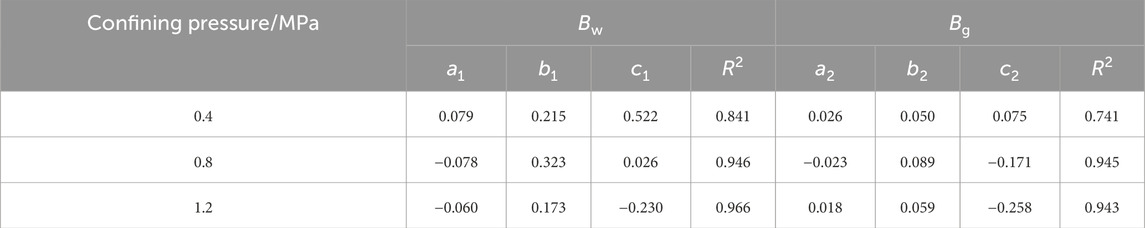
Table 3. Fitting results of Equation 8 for gravel soils.
4.2 Relationship between breakage indexes and maximum particle diameter
Based on the triaxial test results of specimens with different maximum particle diameters (D1-60 to D1-10), the relationships of the particle breakage indexes Bw and Bg with the maximum particle diameter Dmax under three confining pressures were summarized. The results are presented as scatter points in Figure 9. The fitting curves in Figure 9 embody the comprehensive effect of stress concentration and the change in particle content on the degree of particle breakage when the maximum particle diameter increases. With the same gradation area S, the increase in the maximum particle diameter Dmax causes the particle breakage indexes Bw and Bg of the specimens to gradually increase, and further increasing the maximum particle diameter increases the magnitude of the changes in the particle breakage indexes Bw and Bg. The reason is as follows. With larger maximum particle diameters, the large coarse-grained soil particles form more pores among them. As a result, the stress concentration increases the stress on the particles, causing large particles to break up more easily. Therefore, the particle breakage indexes increase with the increase of the maximum particle diameter.
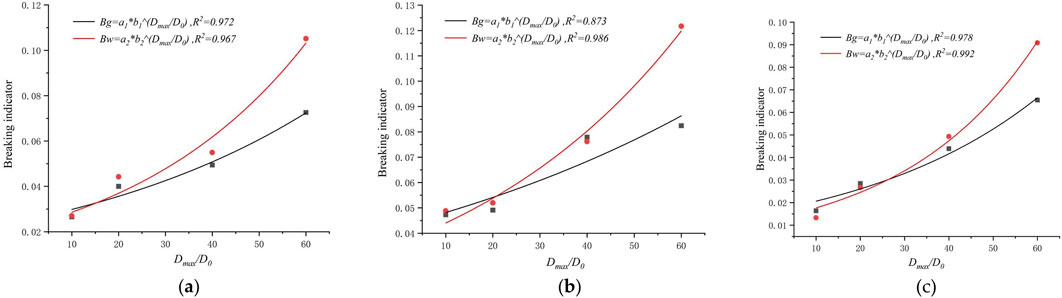
Figure 9. Relationship between maximum particle and breakage indicator. (a–c) Correspond to confining pressure 0.4 MPa, 0.8 MPa, 1.2 MPa.
When the maximum particle size increases, the number of inter-particle contact points decreases, yet the contact force intensifies. Among large-sized particles, point-contacts or edge-contacts prevail, giving rise to more pronounced stress concentration, which renders particles more susceptible to breakage. Additionally, the increase in the number of pores among large particles allows small particles to fill in. Under loading conditions, the relative displacement and friction between large and small particles are exacerbated, and the contact mode undergoes continuous alterations, further contributing to particle breakage. Concurrently, it was observed that when the ratio of the maximum particle diameter to the initial particle size D0 exceeds 40, there is a substantial increase in the particle breakage index correlating with the rise of this ratio. The reason is as follows. With the gradation area remaining unchanged, larger maximum particle diameters mean higher large particle contents. As a result, the number of broken particles in the specimen increases under certain confining pressure, leading to significant magnitudes of increases in the particle breakage indexes.
Further analysis of the relationship between Dmax and the breakage indexes Bw and Bg can be expressed with Equation 9:
where D0 = 5 mm; a1, b1, a2, and b2 are the fitting parameters of Bw and Bg
The association between the maximum particle diameter and the breakage indexes Bw and Bg for specimens with identical gradation areas was determined using Equation 9. The corresponding fitting curves are showcased in Figure 9, with statistical results detailed in Table 4. Analysis of these curves indicates a strong correlation between the breakage indexes Bw and Bg, as predicted by Equation 9, and the measured values, with determination coefficients all exceeding 0.87. This suggests that Equation 9 is highly effective in accurately delineating the relationship between the maximum particle diameter Dmax in coarse-grained soil and the breakage indexes Bw and Bg.
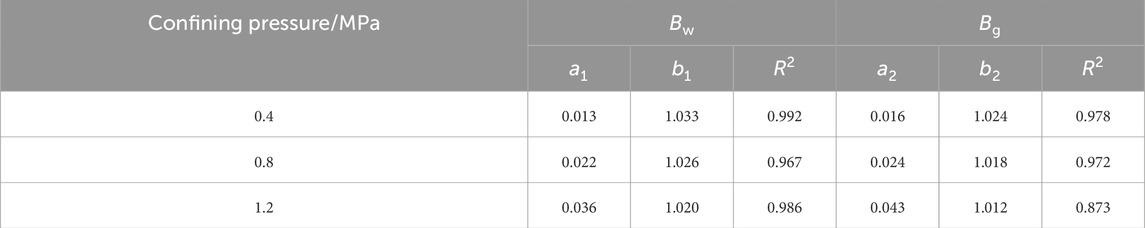
Table 4. Fitting results of Equation 8 for gravel soils.
4.3 Particle breakage mechanism analysis
Coarse-grained soil comprises a heterogeneous mix of soil particles, diverse in size and shape. When subjected to loading, the larger particles interact, forming the soil’s structural skeleton, while the smaller particles, through a cementing action, occupy the spaces between these larger particles. This intermingling of coarse and fine particles results in a structure that enhances the soil’s resistance to deformation. The mechanical response mechanism of particle breakage in coarse-grained soil is depicted in Figure 10.
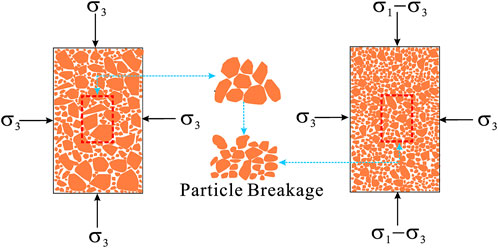
Figure 10. The coarse-grained soil particle breakage mechanical response mechanism.
According to Figure 10, the coarse-grained soil particle breakage response mechanism in the triaxial compression tests is divided into two aspects. For one thing, the coarse particles have certain gaps or contact surfaces among them, and external forces can cause friction and collisions between them. Position and spatial changes of the soil particles, such as mutual extrusion, rolling, and rotation, cause coarse particle breakage. With the continuous increase of the load in the test, the mutual extrusion and biting between the soil particles increase continuously. In addition, the significant edges and angles of the soil particles sharply increase the stress concentration between soil particles. When the inter-particle stress exceeds the strength threshold of soil particles, they will experience fracture or breakage, significantly influencing the soil’s physical and mechanical properties crucial in geotechnical engineering. With continuous breakage, the edges and angles of coarse particles are gradually flattened and rounded, gradually weakening the biting and extrusion between the soil particles. For another, the maximum particle diameter and confining pressure of coarse-grained soil are key factors affecting soil particle breakage. Larger soil particles have rougher surfaces and more significant edges and angles. The stress concentration between such particles in contact is easily induced by the external load. The significantly increased particle contact force intensifies the biting and tumbling of the particles, which gradually break and sustain grinding failure in a series of movements. Secondly, the confining pressure borne by the soil also limits the free movement of the particles. With the increase of confining pressure, the pores between the particles are gradually compacted and closed, the free particle movements caused by external load disturbance are more difficult to occur, and the particles mostly exhibit extrusion, biting, and frictional rotation. Meanwhile, with the increasing contact force between the particles, the particles break continuously as the stress between them increases sharply and exceeds their ultimate strength.
5 Establishment of particle breakage empirical formula
According to the analysis of the coarse-grained soil triaxial compression test results, the effects of soil mass gradation area and maximum particle diameter on the particle breakage can be quantitatively described with Equations 8, 9, respectively. Based on Equations 8, 9, the coupling effect of maximum particle size and grading structure on breakage indexes of coarse-grained soils can also be quantitatively described by the following equation:
Where a1, a2, b1, b2, c1, c2,d1 and d2 are the fitting parameters of Bw and Bg.
Using Equation 10, the test data of 39 groups were fitted. As shown in Figure 11, the coefficient of determinations of Bw are more than 0.710 and The coefficient of determinations of Bg are more than 0.754, which is within the acceptable range.
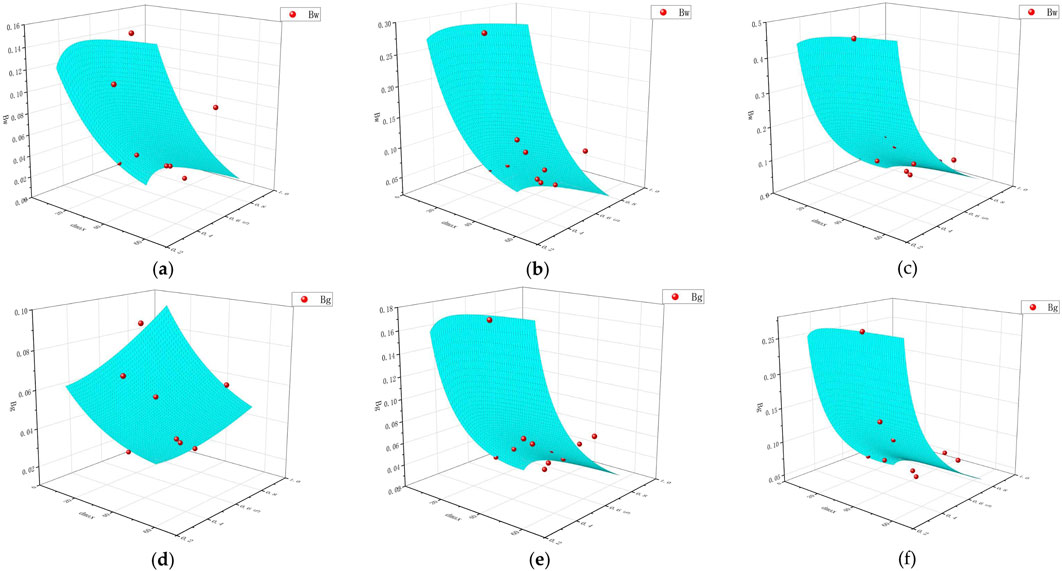
Figure 11. The fitting effects of breakage indicator.(a–c) correspond to Bw with confining pressure 0.4 MPa, 0.8 MPa, 1.2 MPa. (e,f) and (d) correspond to Bw with confining pressure 0.4 MPa, 0.8 MPa, 1.2 MPa.
In order to verify the reliability of the empirical formulas for predicting the breakage indexes of coarse-grained soils under arbitrary gradations, the test results of 13 groups of graded coarse-grained soil samples from reference (Qin et al., 2023) were fitted. As shown in Figure 12, the fitting value of Bw derived from Equation 10 has a deviation of less than 2% from the corresponding experimental points, with a maximum error of 3.369% and the coefficient of determinations are more than 0.763, which is within the acceptable range. Thus, the impact of the scaling effect on the breakage indexes of coarse-grained soils can be quantitatively described using Equation 10.
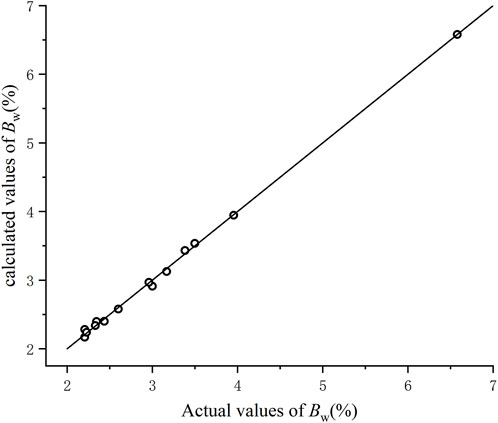
Figure 12. Actual and calculated values of breakage indicators (%).
Using Equation 10 to reflect the impact of the scale effect on the particle breakage indexes has important application value. The breakage indexes of original-gradation coarse-grained soil on site can be derived using Equation 9 after determining its parameters through triaxial consolidation drained tests on scaled soil materials using the similar gradation method. In turn, the influence of scale effect on the breakage indexes of coarse-grained soil particles can be eliminated, and the safety and reliability of geotechnical engineering designs can be improved.
6 Summary and conclusions
In this study, 13 groups of specimens with varying gradations were designed based on the continuous gradation equation for coarse-grained soil. Each group was subjected to three distinct confining pressures, resulting in a total of 39 specimens for comprehensive analysis of relevant soil properties. Employing a large-scale triaxial testing machine for coarse-grained soil, the study investigated the breakage patterns of coarse-grained soil particles across different gradation structures and maximum particle diameters, all prepared at the same relative density. Subsequently, a formula to quantify the degree of particle breakage was proposed. The key findings of the study are as follows.
(1) With constant confining pressure and maximum particle diameter, the breakage indexes Bw and Bg of the coarse-grained soil were larger under larger gradation areas, and the particle breakage of the soil specimen was more significant, exhibiting logarithmical relationships.
(2) With constant confining pressure and gradation area S, the breakage indexes of the coarse-grained soil were larger under larger maximum particle diameters, and the two showed an exponential relationship.
(3) Utilizing the continuous gradation equation, this research delved into the correlation between particle breakage indexes and factors like gradation area and maximum particle diameter. Based on the research results, a prediction model of particle breakage index for coarse-grained soil samples scaled by similar grading method is proposed. The effectiveness of the prediction model is verified by previous research results.
(4) Building on these findings, a technique was proposed for estimating the particle breakage indexes of in-situ coarse-grained soil under specific confining pressures, based on indoor test data from specimens scaled via the similar gradation method.
It is noteworthy that this study is solely focused on coarse-grained soil materials composed of granite. The applicability of the research findings to soils composed of other minerals remains to be verified through further investigations.
Data availability statement
The original contributions presented in the study are included in the article/supplementary material, further inquiries can be directed to the corresponding authors.
Author contributions
XL: Formal Analysis, Visualization, Writing – review and editing. JD: Visualization, Writing – review and editing, Investigation. XS: Writing – review and editing, Investigation, Visualization. CW: Writing – original draft. YL: Data curation, Methodology, Formal analysis, Writing – original draft. HJ: Writing – review and editing. MJ: Writing – review and editing.
Funding
The author(s) declare that financial support was received for the research and/or publication of this article. This work is supported by the Special Basic Cooperative Research Programs of Yunnan Provincial Undergraduate Universities’ Association (No. 202301BA070001-012, No. 202101BA070001-137).
Conflict of interest
The authors declare that the research was conducted in the absence of any commercial or financial relationships that could be construed as a potential conflict of interest.
Generative AI statement
The author(s) declare that no Generative AI was used in the creation of this manuscript.
Publisher’s note
All claims expressed in this article are solely those of the authors and do not necessarily represent those of their affiliated organizations, or those of the publisher, the editors and the reviewers. Any product that may be evaluated in this article, or claim that may be made by its manufacturer, is not guaranteed or endorsed by the publisher.
References
Biarez, J., and Hicher, P. Y. (1997). Influence de la granulométrie et de son évolution par ruptures de grains sur le comportement mécanique de matériaux granulaires. Fr. J. Civ. Eng. 1 (4), 607–631. doi:10.1080/12795119.1997.9692147
Bo, S. T., and Cui, Y. H. (1997). The mechanical properties of rockfill. J. Hydroelectr. Eng. 16 (3), 21–30.
Cai, Z., Li, X., Guan, Y., and Huang, Y. (2016). Particle breakage rules of rockfill materials. Chin. J. Geotechnical Eng. 38 (5), 923–929. doi:10.11779/CJGE201605019
Einav, I. (2007). Breakage mechanics-part I: theory. J. Mech. Phys. Solids 55 (6), 1274–1297. doi:10.1016/j.jmps.2006.11.003
Guo, Q. G. (2003). Engineering properties and application of coarse-grained soil. Zhengzhou: China Water Power Press.
Guo, W. L., Zhu, J. G., Qian, B., and Zhang, D. (2019). Particle breakage evolution model of coarse-grained soil and its experimental verification. Rock Soil Mech. 40 (3), 1023–1029. doi:10.16285/j.rsm.2017.2005
Hardin, B. O. (1985). Crushing of soil particles. J. Geotechnical Eng. 111 (10), 1177–1192. doi:10.1061/(ASCE)0733-9410(1985)111:10(1177)
Lade, P. V., Yamamuro, J. A., and Bopp, P. A. (1996). Significance of particle crushing in granular materials. J. Geotechnical Eng. 122 (4), 309–316. doi:10.1061/(ASCE)0733-9410(1996)122:4(309)
Lee, K. L., and Farhoomand, I. (1976). Compressibility and crushing of granular soil in anisotropic triaxial compression. Can. Geotechnical J. 4 (1), 68–86. doi:10.1139/t67-012
Li, X., Liu, J., and Sun, Z. (2022). Impacts of organic matter and loading methods on one-dimensional compression behavior of calcareous sand. Mar. Georesources & Geotechnol. 40 (9), 1046–1059. doi:10.1080/1064119X.2021.1959686
Ling, H., Yin, Z. Z., Zhu, J. G., and Cai, Z. Y. (2011). Experimental study on scale effect of rockfill strength. J. Hohai Univ. Sci. 39 (5), 540–544. doi:10.3876/j.issn.1000-1980.2011.05.012
Liu, X. Q., Zhang, J. G., and Liu, M. L. (2020). GB/T 50123-2019 “Geotechnical test methods standard” related test methods exploration. Tianjin Constr. Sci. Technol. 30 (05), 1–4.
Marsal, R. J. (1967). Large-scale testing of rockfills materials. J. soil Mech. Found. Eng. ASCE 93 (2), 27–44.
Nakata, Y., Hyde, A. F. L., and Hyodo, M. (1999). A probabilistic approach to sand particle crushing in the triaxial test. Géotechnique 49 (5), 567–583. doi:10.1680/geot.1999.49.5.567
Qin, Y., Ma, A. J., Yang, S. B., Qiu, Z. F., and Deng, W. J. (2023). Compression experimental study on the influence of scale effect on particle breakage of rockfill. J. Changjiang River Sci. Res. Institule 40 (12), 126–132. doi:10.11988/ckyyb.2022699
Shi, J. W., Chen, Y. H., Kong, G. Q., Lu, H., Chen, G., and Shi, C. (2024). Deformation mechanisms of an existing pipeline due to progressively passive instability of tunnel face: physical and numerical investigations. Tunn. Undergr. Space Technol. 150, 105822. doi:10.1016/j.tust.2024.105822
Shi, J. W., Wang, J. P., Chen, Y. H., Shi, C., Lu, H., Ma, S. K., et al. (2023). Physical modeling of the influence of tunnel active face instability on existing pipelines. Tunn. Undergr. Space Technol. 140, 105281, doi:10.1016/j.tust.2023.105281
Shi, J. W., Zhong, X. C., Lu, H., Ni, X. D., and Shi, C. (2025). Influence of joint stiffness on three-dimensional deformation mechanisms of pipelines under tunnel active face instability. Can. Geotechnical J. 62, 1–18. doi:10.1139/cgj-2024-0092
Wang, Y. M., Zhu, S., Ren, J. M., Peng, P., and Xu, X. Y. (2013). Research on scale effect of coarse-grained materials. Rock Soil Mech. 34 (06), 1799–1806+1823. doi:10.16285/j.rsm.2013.06.036
Wood, D. M., and Maeda, K. (2008). Changing grading of soil: effect on critical states. Acta Geotech. 3 (1), 3–14. doi:10.1007/s11440-007-0041-0
Wu, E. L., Zhu, J. G., Guo, W. L., and Chen, G. (2019). Experimental study on effect of scaling on compact density of coarse-grained soils. Chin. J. Geotechnical Eng. 41 (9), 1767–1772. doi:10.11779/CJGE201909023
Wu, E. L., Zhu, J. G., Guo, W. L., and Lu, Y. Y. (2020c). Experimental study of compaction characteristics of coarse-grained soil based on gradation equation. Rock Soil Mech. 41 (1), 214–220. doi:10.16285/j.rsm.2018.2358
Wu, J. Y., Jing, H. W., Gao, Y., Meng, Q. B., Yin, Q., and Du, Y. (2022). Effects of carbon nanotube dosage and aggregate size distribution on mechanical property and microstructure of cemented rockfill. Cem. Concr. Compos. 127, 104408. doi:10.1016/j.cemconcomp.2022.104408
Wu, J. Y., Jing, H. W., Yin, Q., Yu, L. Y., Meng, B., and Li, S. C. (2020a). Strength prediction model considering material, ultrasonic and stress of cemented waste rock backfill for recycling gangue. J. Clean. Prod. 276, 123189. doi:10.1016/j.jclepro.2020.123189
Wu, J. Y., Wong, H. S., Zhang, H., Yin, Q., Jing, H. W., and Ma, D. (2024). Improvement of cemented rockfill by premixing low-alkalinity activator and fly ash for recycling gangue and partially replacing cement. Cem. Concr. Compos. 145, 105345. doi:10.1016/j.cemconcomp.2023.105345
Wu, J. Y., Yang, S., Williamson, M., Wong, H. S., Bhudia, T., Pu, H., et al. (2025). Microscopic mechanism of cellulose nanofibers modified cemented gangue backfill materials. Adv. Compos. Hybrid Mater. 8, 177. doi:10.1007/s42114-025-01270-9
Wu, L. Q., Ye, F., and Lin, W. Q. (2020b). Experimental study on scale effect of mechanical properties of rockfill materials. Chin. J. Geotechnical Eng. 42 (S2), 141–145. doi:10.11779/CJGE2020S2025
Xu, Z., Sun, D., and Zhang, G. (2017). Study on stress-strain behavior of rockfill using large-scale triaxial tests. Rock Soil Mech. 38 (6), 1565–1572. doi:10.16285/j.rsm.2017.06.004
Keywords: coarse-grained soil, consolidation drained test, scale effect, particle gradation, particle breakage
Citation: Li X, Du J, Shen X, Wang C, Liu Y, Jin H and Jiang M (2025) The influence pattern of scale effect on coarse-grained soil particle breakage: an experimental study. Front. Mater. 12:1593845. doi: 10.3389/fmats.2025.1593845
Received: 30 March 2025; Accepted: 29 April 2025;
Published: 14 May 2025.
Edited by:
Jiangyu Wu, China University of Mining and Technology, ChinaReviewed by:
Mohammad M. Karimi, Tarbiat Modares University, IranShaoyun Pu, Shaoxing University, China
Chuanfeng Fang, Hunan University of Science and Technology, China
Copyright © 2025 Li, Du, Shen, Wang, Liu, Jin and Jiang. This is an open-access article distributed under the terms of the Creative Commons Attribution License (CC BY). The use, distribution or reproduction in other forums is permitted, provided the original author(s) and the copyright owner(s) are credited and that the original publication in this journal is cited, in accordance with accepted academic practice. No use, distribution or reproduction is permitted which does not comply with these terms.
*Correspondence: Chenghan Wang, MjIxMDM5MTExN0BzdC5neHUuZWR1LmNu; Yubo Liu, eXVib2xpdTIwQDE2My5jb20=