- 1Materials Engineering Division, CSIR-National Metallurgical Laboratory, Jamshedpur, India
- 2Department of Mechanical Engineering, Saintgits College of Engineering (Autonomous), Kottayam, Kerala, India
- 3Division of Mechanical Engineering Graduate School of Science and Engineering, Kagoshima University, Kagoshima, Japan
Creep is a critical mechanical property essential for materials intended for components and structures that operate under sustained loads at elevated temperatures over extended periods. Traditionally, the creep behavior of materials is evaluated through uniaxial creep tests performed on standardized specimens following internationally recognized testing procedures. However, these conventional tests require a substantial amount of material to generate comprehensive data for understanding creep behavior and for developing design databases. The Impression Creep (IC) test presents an alternative, minimally invasive approach for characterizing the creep properties of metallic materials. In this method, a constant compressive load is applied to a flat specimen using a flat-ended cylindrical or rectangular punch, and the penetration depth over time is recorded to assess the material’s creep deformation response. The IC method offers several advantages over standard techniques, including the ability to extract a large volume of data from a single specimen, thereby minimizing specimen preparation efforts and sample-to-sample variability. Moreover, as the test induces only a localized indentation without fracturing the specimen, it is considered nearly non-destructive. Significant research efforts are ongoing to optimize aspects such as specimen and machine design, testing protocols, data interpretation methods, and constitutive modeling, while also striving to establish correlations between IC-derived parameters and those obtained from conventional creep tests. This paper presents a comprehensive review of past research on IC testing, identifies existing knowledge gaps, and highlights key challenges based on the authors’ extensive experimental and modeling investigations alongside a critical analysis of the broader literature.
1 Introduction
The nuclear industry has been at the forefront of innovations in miniaturized mechanical testing techniques. Evaluating the mechanical properties of irradiated materials has long been, and remains, a significant challenge. The quantity of material available for testing is often limited, and minimizing the sample size is necessary to prevent contamination of testing equipment and personnel. Nevertheless, the specimens must accurately represent the material’s properties. Producing irradiated materials in the size, shape, and quantity required for standard mechanical testing is constrained by multiple factors. As a result, several small specimen testing techniques have been developed over the years to assess mechanical properties such as hardness, tensile strength, toughness, creep, fatigue, and fracture behavior. The earliest advancements were associated with miniaturized disk bend tests aimed at evaluating irradiation embrittlement in materials (Manahan et al., 1981; Manahan, 1983; Corwin and Lucas, 1986). Subsequently, numerous innovative small specimen testing methods have been devised for the evaluation of additional mechanical properties (Mao and Takahashi, 1987; Komazaki et al., 2000; Hurst et al., 2007; Hyde and Sun, 2010; Parker and James, 1994; Shou et al., 2014; Chu and Li, 1977; Sastry, 2005a; Holmström et al., 2018). Among these are the Impression Creep (IC), Small Punch Creep (SPC), and Ball Indentation (BI) test methods, which are particularly useful for assessing creep, tensile and fracture properties (Mathew et al., 2016). This paper presents a review of the research and development activities related to IC testing, focusing on its application to the evaluation of creep deformation properties in materials.
1.1 Creep deformation of materials
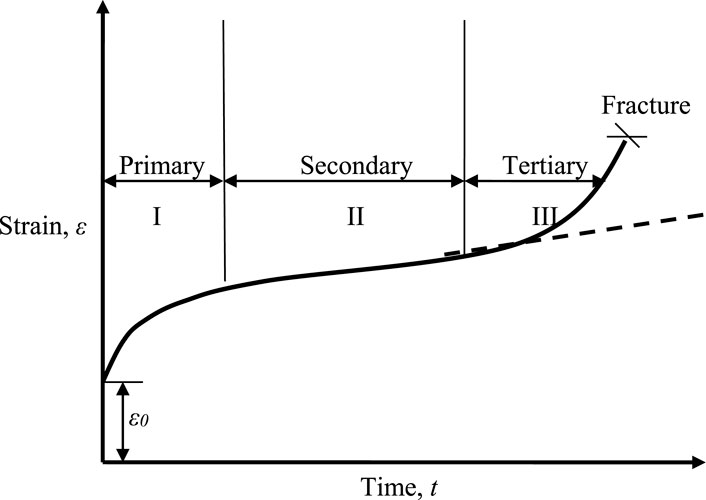
Creep refers to the gradual plastic deformation of materials under constant stress at high temperatures over time. It is a key factor limiting the lifespan of components operating at high temperatures under load. The extent of creep deformation is influenced by intrinsic factors like crystal structure, grain size, and defect concentration, as well as extrinsic factors such as load, temperature, and structure geometry. High stress and temperature accelerate plastic deformation by providing the necessary activation energy for defect movement. A typical creep curve is shown in Figure 1 (Garofalo, 1965). It consists of three stages: primary, secondary, and tertiary. Upon loading, an immediate strain occurs, comprising elastic, anelastic, and plastic components. Primary creep features a decreasing strain rate, which stabilizes in the secondary stage, marked by a nearly constant strain rate. This steady-state creep stage exhibits the lowest strain rate. The final stage, tertiary creep, involves rapid deformation leading to material failure.
At the microstructural level, creep results from strain hardening, recovery, and damage evolution. Plastic deformation causes strain hardening by increasing dislocation density. Recovery mechanisms counteract this by allowing further deformation without increasing stress. In the primary stage, strain hardening dominates, while in the secondary stage, hardening and recovery balance each other, leading to a constant creep rate. Tertiary creep begins when stress increases due to cross-sectional area reduction from necking or void formation, often accompanied by metallurgical changes such as precipitate coarsening and recrystallization, ultimately leading to failure.
1.2 Constitutive equations for creep deformation
Garofalo (1965) proposed the following well-known creep equation to relate creep strain (ε) with time (t),
where εo is the loading strain, εt is the limit for transient creep and r is the rate of exhaustion of the transient creep which is a function of the ratio of initial creep strain-rate (
where εL is a constant equal to the smallest strain deviation from steady state at the onset of tertiary creep, p is a constant and tot is the time required for the onset of tertiary creep. Garofalo’s equation has been derived by considering changes in the sub-structure of the material during creep deformation. It assumes that the transient creep follows a first-order kinetic reaction rate theory with a rate constant
The steady state creep deformation rate (
where K is a constant and n is stress exponent. Under a constant applied stress (
where K1 is another constant and Qc is the activation energy for creep rate controlling process, R is the universal gas constant. The activation energy term signifies that creep deformation is a first order reaction rate process. The magnitude of the activation energy is dependent upon the rate controlling physical mechanism governing the deformation process.
The most important microstructural parameter that plays a major role in controlling the creep properties of materials is the grain size. The dependence of the steady state creep rate on grain size is governed by the following equation:
where K2 is a creep constant whose value depends on the creep deformation mechanisms, d is the grain size and p is the grain size exponent. Thus, at a given stress and temperature, finer grain-size materials are expected to creep faster than coarser grained materials. However, dislocation-based creep deformation mechanisms are not grain size dependent.
1.3 Creep deformation mechanisms
It is possible to identify the rate-controlling mechanism of creep deformation in terms of the values of stress exponent (n), activation energy (Qc), and grain size exponent (p). Table 1 describes various mechanisms of creep and their relation to the creep parameters n, Qc, and p. In addition to these three parameters, the relevant mechanism of creep can be identified by the creep constant A given by K2 in Equation 5. Each mechanism of creep represents a distinct value of A.

Table 1. Identification of the particular mechanism of creep from parameters, n, p, Qc and A (Equation 5).
Creep mechanisms can be broadly classified as Diffusion creep and Dislocation creep. Coble creep and Nabarro-Herring (N-H) creep are diffusion-based deformation processes. Dislocation climb, Harper-Dorn (H-D), and viscous glide are dislocation-based creep deformation processes. Grain boundary sliding (GBS) appears to proceed by a combination of diffusion and dislocation-based processes.
In Table 1, Qgb, QL,and Qs are activation energies for grain boundary diffusion, lattice diffusion, and solute diffusion, respectively. As Table 1 suggests, n = 1 (Newtonian viscous) implies that the deformation mechanism could be Coble, N-H, or H-D creep. A knowledge of p or the Qc value would help to identify the right creep mechanism. For example, n = 1 and Qc= QL would suggest the mechanism of creep to be either N-H or H-D. However, if p = 2, it would establish that the mechanism of deformation is N-H. On the other hand, if the steady state strain rate is independent of the grain size (p = 0), the creep mechanism is H-D. Figure 2 shows a typical deformation mechanism map describing the various deformation mechanisms in a plot of normalized stress versus homologous temperature.
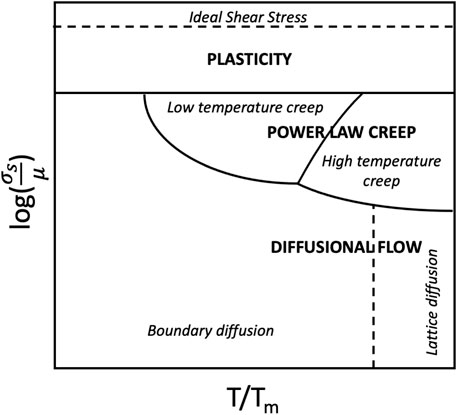
Figure 2. A schematic illustration of creep deformation mechanism map. (https://en.wikipedia.org/wiki/Deformation_mechanism?utm_source=chatgpt.com).
The activation energy for creep deformation depends on the rate-controlling mechanism of creep. The activation energy changes with the underlying creep mechanism, as shown in Table 1. In the case of Coble creep, the activation energy for creep is equal to that for grain boundary diffusion. For N-H creep, the activation energy is equal to that for lattice diffusion. Usually, the activation energy of deformation is constant if a single thermally activated process is rate-controlling. Arrhenius plot (plot of log of steady-state strain rate of deformation vs. reciprocal of absolute temperature) is a straight line in such a case. However, in some cases, more than one mechanism of creep, each with different activation energies, could be controlling the creep rate. The Arrhenius plot in such a case is curved in the temperature range where the activity of the mechanisms is comparable.
1.4 Creep fracture mechanisms
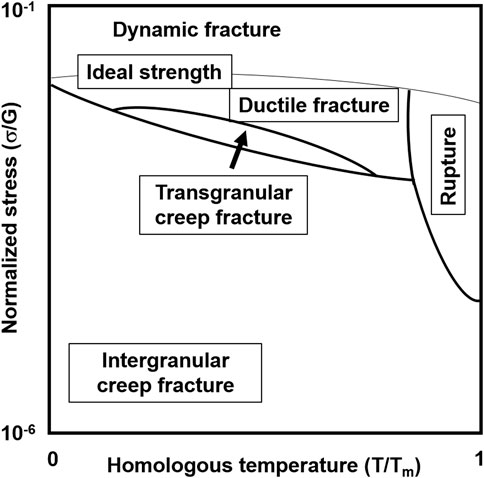
Creep fracture occurs when prolonged stress at elevated temperatures leads to the formation and growth of cavities and cracks, primarily along grain boundaries, culminating in material failure. Understanding these processes is essential for designing structures that can withstand such conditions and for developing materials resistant to creep. Creep damage mechanics (CDM) models this behavior, focusing on how cavities nucleate, grow, and coalesce under stress. High local stresses, often exceeding the applied stress, facilitate cavity formation at grain boundary triple points due to sliding, at particle interfaces, and on transverse grain boundaries through dislocation pile-up. Once formed, these cavities grow by absorbing vacancies, and the growth mechanisms vary based on stress levels and cavity spacing. The fracture mechanism map originally proposed by Ashby (1981) is a plot of normalized tensile stress against homologous temperature. It illustrates domains of different creep fracture modes such as dynamic, ductile, transgranular, and intergranular creep fractures (Figure 3). Typically, intergranular creep fracture dominates under low-stress conditions, while higher stresses may lead to transgranular or mixed-mode failures.
1.5 Conventional method of creep test
Most widely employed conventional method of creep testing involves testing the creep specimen under uniaxial tensile loading conditions. The test specimens are of standard geometry and tests are generally conducted as per the ASTM E139 standard procedure (ASTM E-139-06, 2006). A schematic of tensile creep test specimen is shown in Figure 4. In a conventional creep test, a constant tensile load is applied to the specimen in its axial direction and the elongation of the specimen is measured using an extensometer. The result of the creep test is the change in the strain obtained from the specimen elongation with elapsed creep time (Figure 1).
2 Impression creep test method
2.1 Evolution of impression creep test
The concept of studying the creep behavior of materials from impression tests has its origin in the indentation hardness test. Hardness, in a broad sense, is the resistance of a material to plastic deformation. The indentation hardness test is the most widely used hardness test for metallic materials (Fischer-Cripps, 2000; Tabor, 1970). In an indentation hardness test, an indenter of spherical, pyramidal, or conical shape is forced on the surface of the material to be tested under a specific load for a definite but short time, and the size of the impression is measured after unloading. The indentation hardness is expressed as the ratio of the applied load to the area of the indentation. The first indentation hardness test was introduced by J. A. Brinell using a spherical indenter (Wahlberg, 1901) and subsequently by Smith and Sandland (1922) and Rockwell and Rockwell (1919) using square-based pyramidal and conical indenters, respectively named as the Vickers hardness test and Rockwell hardness test.While indentation tests have been traditionally used for evaluating the hardness of materials, it is also attractive for characterizing other mechanical properties, such as tensile and creep properties of materials. The well-known relationship of hardness (H, or mean contact pressure Pm) with uniaxial flow stress Y of the material with a proportionality constant C, known as the constraint factor, was proposed by Prandtl (1921) and Tabor (1948), which is given as Equation 6.
In view of this correlation, several researchers attempted to extend the idea of indentation test to study time-independent (tensile) as well as time-dependent (creep) material properties. This has led to the development of automated ball indentation (ABI) technique (Haggag et al., 1990; Murty and Mathew, 2004) and indentation or impression creep test technique for measuring tensile and creep properties of materials.
The indentation test method for studying the creep deformation behavior of materials was first attempted in the 1960s by Mulhearn and Tabor (1960) and subsequently by others from long-time indentation hardness test (Sargent and Ashby, 1992; Merchant et al., 1973; Sherby and Armstrong, 1971; Hooper and Brookes, 1984; Cseh et al., 1997; Cseh et al., 1998; Fujiwara and Otsuka, 2001; Viswanathan et al., 1996; Lucas and Oliver, 1999). In this test, a constant compressive load is applied on the surface of the flat specimen through a suitable indenter (spherical or pyramidal shape), for a period which largely exceeds the duration of a standard hardness test. The variation of the indentation diameter (in the case of ball indenter), and diagonal length (in the case of square-based pyramidal indenter), is measured as a function of time. Although these investigations achieved success to some extent, the major drawback in the methodology was that there is continuous decrease in the stress with the time of indentation because of increase in the contact area arising from the geometry of the indenter employed in the test method. As a result, no steady state could be attained. In order to obtain a constant stress and thereby a steady-state of indentation, the indenter shape was changed from a pyramidal or spherical shape to a cylindrical indenter with a flat end. It was Larsen-Badse (1967) who first suggested the use of indenters with a uniform cross section. Following this, Chu and Li (1977) introduced the impression creep test using cylindrical indenters with flat end in the mid-1970s. There are two nomenclatures, namely, indentation creep and impression creep, widely used in the literature. The difference lies in the geometry of the indenter employed in the test. Indentation creep refers to creep tests using spherical or pyramidal indenters, whereas impression creep refers to tests using an indenter with a uniform cross-section (cylindrical or square shape).
2.2 Applications, advantages, and limitations
Standard creep tests require a significant volume of material and many specimens for creep testing at various temperatures and stresses. Each creep test takes quite a long time, depending on the test temperature and stress. The standard test method is, therefore, material-intensive and time-consuming. Furthermore, during the development of new materials, often only a limited quantity of materials is available. The IC test has several advantages and a wide range of applications when compared with standard uniaxial creep tests. These include i) a large number of creep data can be obtained from a single standard creep specimen and this reduces both the effort for sample preparation, and possible sample to sample variations in properties, ii) IC tests are considered as nearly non-destructive tests by virtue of the small size of the specimens required and non-invasive nature of the tests, iii) attractive for condition monitoring, remnant life assessment and life extension studies while it is undesirable to remove substantial material required for conventional creep tests from an operating component, iv) can be used for screening of creep properties of small heats of alloys quickly for optimizing the chemical composition, heat treatment conditions and mechanical properties in materials development programs, v) appropriate for characterization of creep properties of narrow microstructural regions of weld joints vi) suitable to study creep properties of anisotropic materials and vi) study the effect of grain size on creep properties. Despite these advantages, the IC technique has limitations too, such as i) IC loading is compressive unlike conventional creep tests which are carried out under tensile loading, ii) test duration is short, and so the synergistic effects due to microstructural changes occurring during long creep tests in engineering alloys cannot be evaluated, iii) interpretation of data is difficult due to complex multi-axial state of stress that develops in the specimen and iv) lack of a common international codes of practice.
2.3 IC test method
Impression creep process is essentially the time-dependent penetration of a flat punch into a test specimen under a constant compressive load at elevated temperature. The penetration of the punch into the specimen is controlled by the time-dependent deformation of the material under the punch, which can be regarded as time-dependent plastic deformation of the material beneath the punch. Thus, the IC technique essentially determines the creep behavior of materials in the vicinity of the indentation. The IC technique was pioneered by Li and his co-workers as early as 1971 (Yang and Li, 2013; Li and Chu, 1979). Several researchers have employed this technique to understand the creep deformation of materials. A state-of-the-art review on IC technique has been published by Yang and Li (2013).
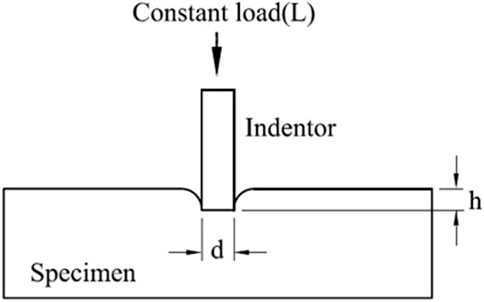
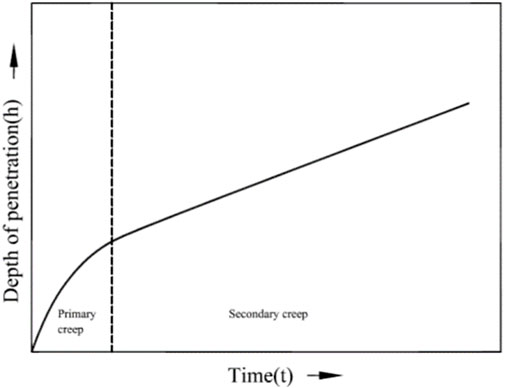
In an IC test, a constant compressive load is applied to flat test specimen through a flat-ended cylindrical indenter at high temperature. The IC testing is schematically illustrated in Figure 5. Here, L, d and h are the applied load, diameter of the punch and depth of penetration, respectively. During the test, the displacement of the indenter is measured as a function of the elapsed test time. Initially, the penetration rate decreases with time and then reaches a steady state after an initial transient period. During steady state creep, the depth of penetration increases linearly with test time. A plot of depth of penetration with elapsed test time provides the IC curve. The IC curves appear similar to the conventional creep curves, but exhibit only the first two characteristic stages of creep curve, namely, the primary creep and the steady state creep. A schematic of the IC curve is shown in Figure 6. It should be noted that in IC curve, the tertiary creep stage is absent. This is because the loading is compressive in nature and as a consequence, creep cracks and necking of specimen do not occur in IC test.
2.4 IC test fixture and methodology
In general, the test setup used for IC test is of lever arm type loading frame, similar to the one used for uniaxial creep tests. One such dedicated system used by the authors is shown in Figures 7a–c (Mathew et al., 2013; Naveena et al., 2013). Figure 7a shows the IC test system along with its control unit and vacuum system. Figure 7b shows the fixture for the indenter and test specimen inside the furnace, which is enclosed by a vacuum chamber. The vacuum protects the indenter and test specimen from severe oxidation, thereby avoiding its influence on the IC test results. The incorporation of a load cell ensures that any frictional effect is mitigated, allowing full test load to be applied on the specimen. Brett et al. (2018) conducted IC tests in electro-mechanical test frames. Gallacher et al. (2018) compared the IC test results obtained from their deadweight loaded IC test system with those determined from the electric-mechanical test system on a Grade 91 forging and found that the results generated from both test frames were in agreement.
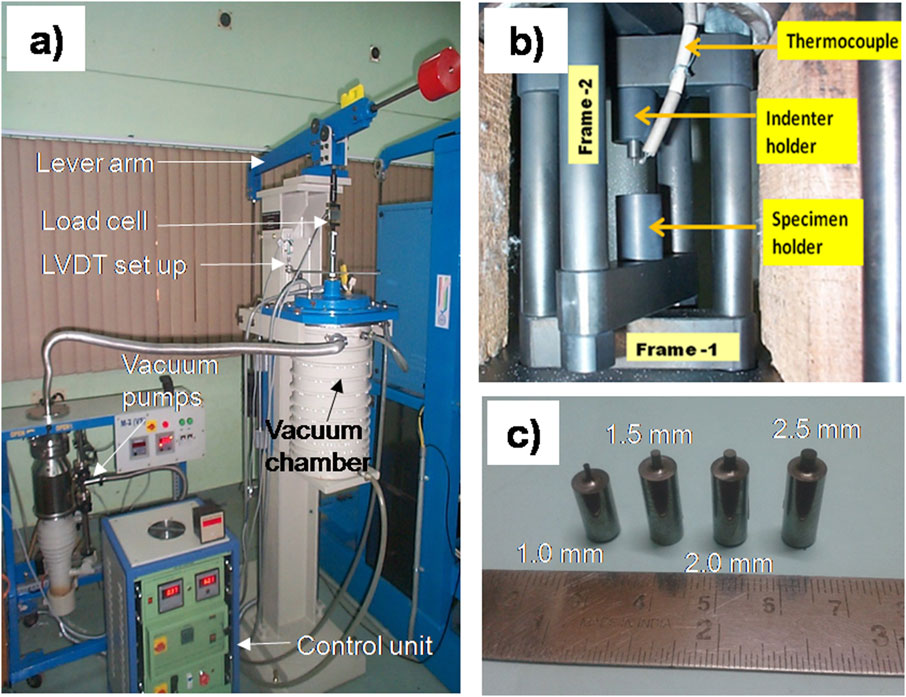
Figure 7. (a) A typical lever-arm type IC test system, (b) the fixture for assembling indenter and test specimen inside the furnace, and (c) tungsten carbide indenters of different diameters (Mathew et al., 2013; Naveena et al., 2013).
Two different geometries of indenter have been used to conduct IC tests. One is the flat-ended cylindrical indenter, and the other is a rectangular indenter. IC tests are mostly conducted using flat-ended cylindrical indenters. The diameter of the indenter varies generally in the range of 1.0–2.5 mm (Figure 7c). The smaller diameter indenter would be preferred over a larger one as the former requires a lower capacity loading system. Further, these indenters are also suitable for testing narrow heat affected zones in welded joints. Use of a larger diameter indenter, typically 1.5 mm and above, results in reduced stress levels. In this case, to carry out IC tests at high stress levels a system with higher load capacity is required. It is worth noting that the indenter diameter should be also large enough to cover a significant number of grains in the material, ensuring a representative measurement of its bulk properties. Studies concerning the effect of punch diameter on the IC test results are not available in open literature so far.
There are a few research groups that utilize rectangular indenters (Gallacher et al., 2018; Hyde et al., 1995; Brett, 2018). A typical rectangular indenter, along with its geometrical parameters, is shown schematically in Figure 8. Hyde et al. (1996), Sun et al. (2008) used a rectangular indenter to characterize creep properties of both base materials and heat-affected zones in welded joints. The width of the rectangular indenter was 1.00 mm (Hyde et al., 1996). Rectangular indenter was chosen to ensure a larger contact area between the indenter and specimen compared to the microstructural feature (e.g., grain size) to obtain characteristic bulk properties of materials. However, this purpose can also be achieved with the flat-ended cylindrical indenter by using a suitable diameter of the punch according to the microstructural features, such as grain size or the width of heat-affected zones in weld joints. The flat-ended cylindrical indenters having different diameters ranging from 0.1 mm to 2 mm have been employed for IC tests (Park et al., 2007; Chiang and Li, 1994; Bretta and Bridges, 2025). With respect to the indenter geometry, there is no common consensus on the use of a particular indenter shape, a cylindrical or rectangular geometry. Standardizing indenter geometry would improve the comparability of IC test results and should be explored in greater detail. Khoubrou et al. (Khoubrou et al., 2022) studied the effect of indenter diameter on the IC test results in AZ91 magnesium alloy. The steady-state impression velocity increased with increasing punch diameter at the same stress level.
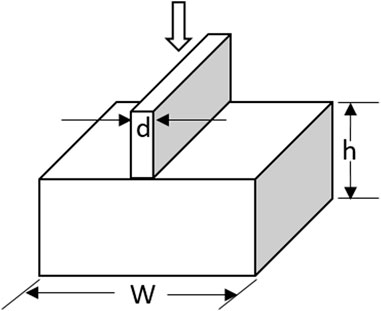
Figure 8. Rectangular indenter and specimen geometrical parameters, adapted from the reference (Hyde et al., 1995).
IC test requires a flat specimen of either rectangular or cylindrical shape. It is important that the specimen surface should be flat and have sufficient thickness to accommodate the impression and associated plastic zone well within the specimen. The thickness of the specimen should be decided based on the size of the plastic zone associated with the indentation. The width or the diameter of the test specimen could vary depending on the number of IC tests to be carried out on a single specimen.
A critical issue in IC testing is the maximum allowable indentation depth. Finite element analysis by Li et al. (2021) suggested that both conversion coefficients and steady-state creep rates can be significantly affected by indentation depth. A more comprehensive investigation across a wide range of materials is necessary to establish appropriate depth limits. The maximum indentation depth should be fixed to avoid the frictional effect on the test result. As indentation depth increases, the frictional effect between the specimen and the indenter on the stress also rises, potentially affecting the test results. Further, as also pointed out by other researchers (Brett and Bridges, 2025), the indenter misalignment is another issue in IC testing. Misalignment of the indenter can result in a small contact area between the indenter and specimen, leading to high concentrations of plastic strain, which would have a significant effect on the steady state creep rate result. Furthermore, detecting misalignment during the assembly of indenter and specimen is particularly difficult. So the problem of misalignment may be solved if the indenter is fixed trough a thread system rather than just placing the indenter in its slot.
3 Impression creep deformation
3.1 Plastic deformation under the punch
During an IC test, the material underneath the indenter experiences a complex stress state. Figure 9a shows an Electron Back Scatter Diffraction (EBSD) image of the region under the indentation showing the microstructural changes in a type 316LN Stainless Steel (SS) after the IC test. Three distinct regions can be observed. Equiaxed grains with no appreciable change in grain shape are observed just beneath the indentation, which suggests that this region may be subjected to hydrostatic stress. The materials surrounding this region have experienced an extensive shear deformation, predominantly along (111) planes.The region further away indicates equiaxed grains of almost the same size as at the start of the test, indicating the absence of plastic deformation in this region and the localized nature of creep deformation in IC test. Finite element (FE) analysis (using ABAQUS software) of the deformation under the indenter showed that the Von Mises stress was maximum in the region that showed shear deformation (Figure 9b). In the region immediately under the punch, the Von Mises stress was above the yield stress of the material. There is severe plastic deformation at the circumference of the indentation due to high stress concentration beneath the sharp circumference of the indenter. The plastic deformation spreads from the circumference into the bulk of the material through a hemispherically shaped plastic deformation zone.
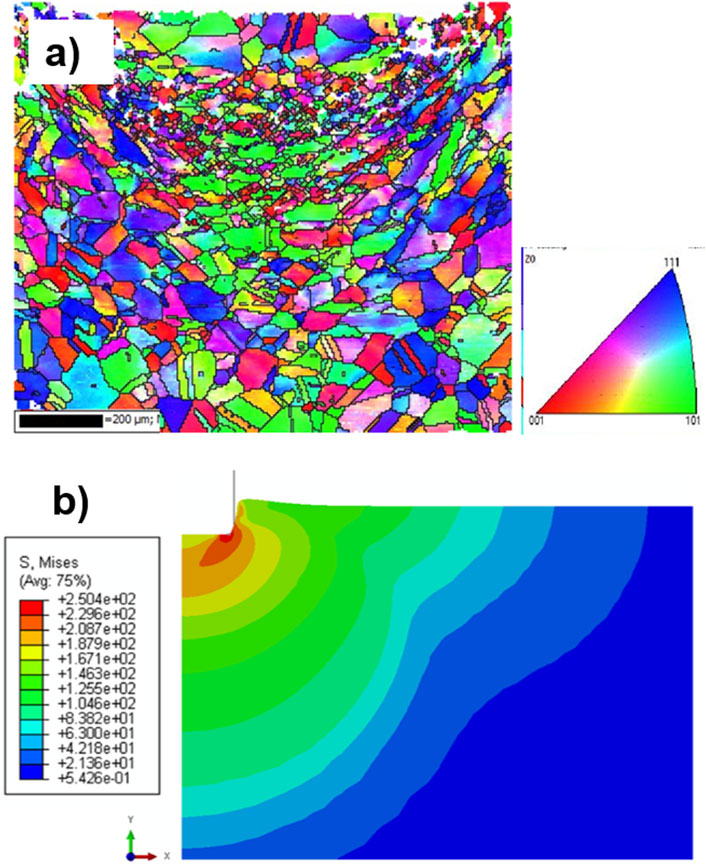
Figure 9. (a) EBSD image of the region under the indentation showing the microstructural changes in the vicinity of the impression (Naveena et al., 2015)and (b) Von-Mises stress distribution around the indentation in 316LN SS (Naveena and Mathew, 2015).
Dorner et al. (2003) studied deformation under the indentation in TiAl alloy after IC test. They observed deformation patterns under the punch after the IC test similar to that shown in Figure 10.
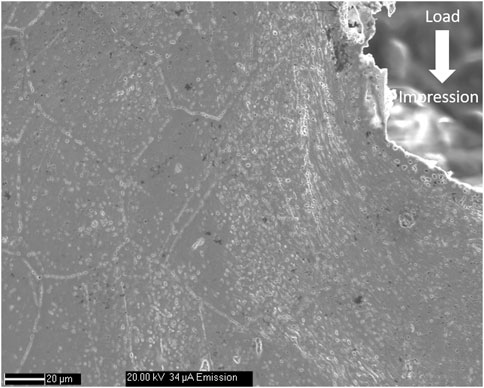
Figure 10. Scanning electron micrograph of the deformation around the impression. (Naveena, 2014).
Butt et al. (1996) examined the plastic zone in SiC particle-MoSi2 composite specimen after IC test. They observed a hydrostatic zone below the indentation. This zone was observed to be surrounded by the deviatoric stress region. Similar observation of hydrostatic zone immediately under the indentation was also reported by Mahmudi and co-workers in cast Mg alloy (Kabirian and Mahmudi, 2009).
3.2 Size of the plastic deformation zone
Analysis of the size of the plastic deformation zone around the indentation is important in IC testing, particularly when the IC behaviour of narrow microstructural regions across weld joints is evaluated. The size of the plastic zone was studied by both experimental and finite element analysis in 316LN SS (Naveena et al., 2015; Naveena and Mathew, 2015). The experimental method of analysis involved measurement of a series of microhardness around the impression on the sectioned surface to estimate the size of the plastic deformation zone. The estimated size of the plastic zone was about the diameter of the indenter. The experimental methods for such measurements are reported in detail (Naveena et al., 2015). Based on this estimation, the centre-to-centre distance that should be maintained between the adjacent indentations was estimated to be at least five times the diameter of the indenter. The FEM analysis of plastic deformation under the punch in316LN SS revealed that the size of the plastic zone is about 1.2–1.5 mm, depending on the load applied. With increasing load, the plastic zone size increased slightly, with a maximum size of 1.5 mm (Naveena and Mathew, 2015). Studies on the dislocation structure under the punch in LiF single crystal by etch-pits method revealed that the depth of the plastic zone was about the diameter of the punch (Yu and Li, 1977). The plastic zone size in a fine-grained Al alloy was also of the order of the diameter of the indenter (Juhasz et al., 1987).
3.3 Creep deformation and pile-up mechanism
Figure 11 shows the evolution of Von Mises stress during IC deformation in 316LN SS. The Von Mises stress along the edge of indentation was initially high (389 MPa) and then gradually decreased to 250 MPa after 1,000 h of creep. The stress redistribution occurs within the plastic zone during the IC test, similar to the stress redistribution that occurs around the notch in creep specimens during tensile creep (Hayhurst and Henderson, 1977; Eggeler and Wiesner, 1993; Goyal et al., 2013). The size of the plastic zone does not change significantly during IC deformation because of the conservation of volume of material during plastic deformation (Honeycombe, 1984). Another interesting aspect of IC deformation is how the material is displaced sideways and upwards when the indenter advances into the specimen, leading to a pile-up of material on the specimen surface. A detailed study of the pile-up phenomenon using FE modeling has been reported previously (Naveena and Mathew, 2015). Figure 12 shows the evolution of material pile-up during IC deformation (applied load = 597 N). The pile-up height increases with increasing the depth of indentation during creep. The extent of material pile-up along the specimen surface together with the size of the plastic zone can be used to estimate the minimum distance that has to be maintained between the two adjacent impressions. The material flow mechanism described by the authors from their finite element studies (Naveena and Mathew, 2015) are in agreement with the recent studies of material flow pattern determined by mathematical modeling of the deformation zone in IC test (Rezvani and Ebrahimi, 2025).

Figure 11. Evolution of the Von Mises stress in the specimen during creep deformation; the distribution shown is along the axis of symmetry (Naveena and Mathew, 2015).
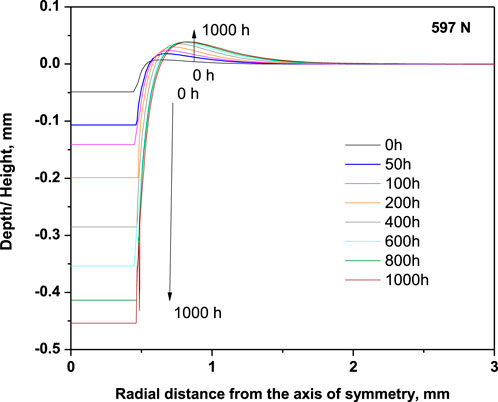
Figure 12. The evolution of material pile-up on the surface of specimen during IC deformation (Naveena and Mathew, 2015).
4 Correlation between impression creep and standard creep
4.1 Correlation relationships
There are two important parameters involved in an IC test. One is the punching stress, and the other is the impression velocity. Under constant load (L) applied to the specimen through a flat-ended cylindrical indenter of diameter d, the mean pressure under the indenter is called as impression stress and is given by Equation 7.
Under the impression stress, the indenter advances into the specimen to a depth h over a creep time t. The rate at which the indenter advances into the specimen is called as impression velocity or impression rate and is given by Equation 8.
The steady state impression rate is determined from the impression ratevs time plot. The steady state impression rate is normalized to the diameter of the indenter d and is correlated to the steady state creep rate
For materials obeying power law creep, the steady state impression rate varies proportionally with the diameter of the indenter and obeys the same stress dependence as in the case of conventional uniaxial creep test. Therefore, Equation 11 is obeyed IC test,
where nimp is the Norton power law exponent in IC test. The plot of steady state impression rate versus impression stress on a double logarithmic scale gives a straight line with a slope equivalent to
A similar methodology which we generally use in uniaxial creep testfor determining apparent activation energy for creep can be used in IC test. The steady state impression rates are plotted against the reciprocal of the absolute temperature on a semi-logarithmic scale. The Arrhenius rate equation for IC test can be stated as Equation 13,
where,
4.2 Correlation factors
The IC parameters are converted to equivalent uniaxial creep parameters using Equations 9, 10. The
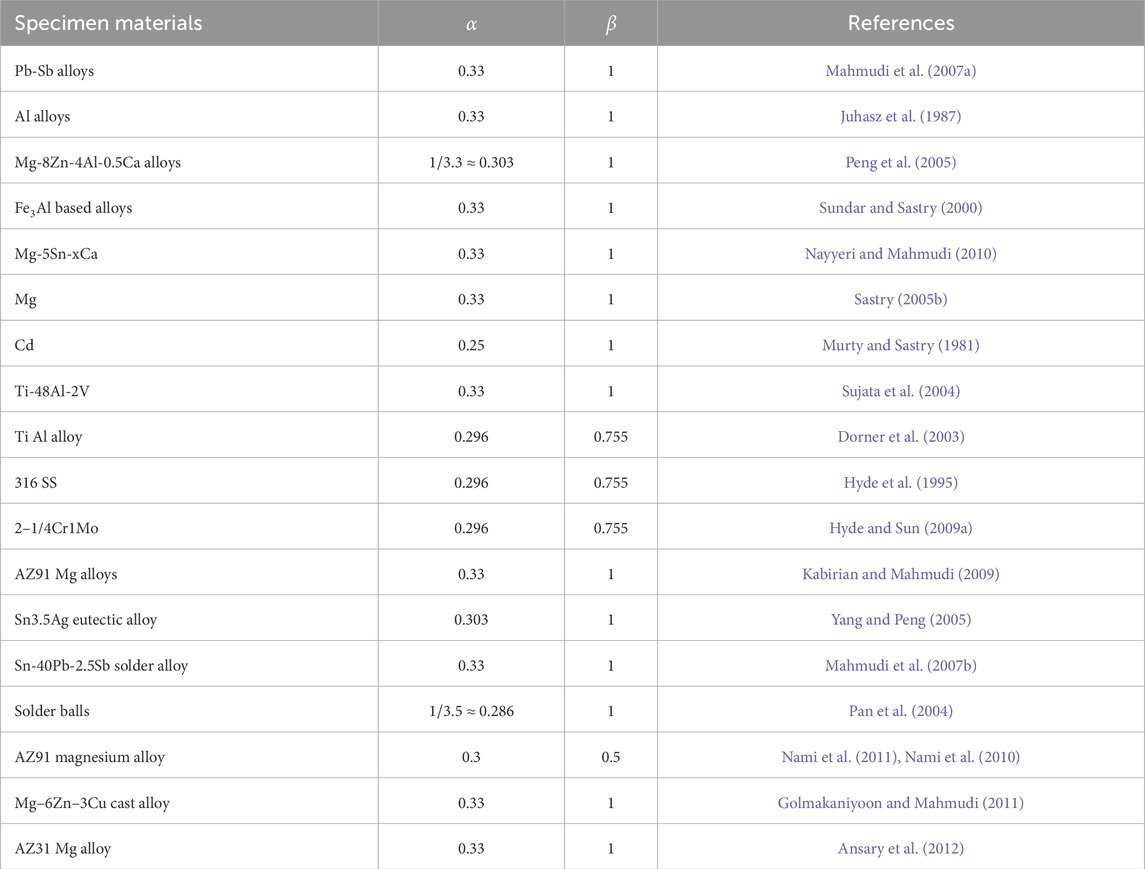
Table 2. Correlation factors for comparison of impression creep test results with corresponding uniaxial creep test results for various materials.
5 Application to material research and development
The IC technique has been used to develop an optimized nitrogen composition in 316LN SS by studying several laboratory heats containing different nitrogen levels (Naveena et al., 2012; Mathew et al., 2012). Figure 13 shows the variation of steady state impression velocity (same as steady-state impression rate) with nitrogen content at different load levels at a temperature of 923 K in 316LN SS. Steady state impression rate decreased with increasing nitrogen content. This trend correlated well with the uniaxial creep test results (Mathew, 2010). The improvement in creep strength with increase in nitrogen content was attributed to the decrease in stacking fault energy and increase in solid solution strengthening of the steel with increasing nitrogen content (Mathew et al., 2004). The IC test results correlated well with the uniaxial creep test results for the correlation factors of α = 0.33 and
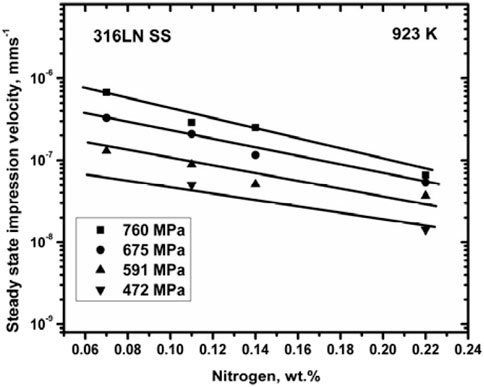
Figure 13. Variation of steady state impression velocity with nitrogen content in 316LN SS for various stress levels (Naveena et al., 2013).
Hyde et al. (1995) carried out IC tests on 316 SS at 873 K using flat-ended cylindrical inventors made of zirconia, having diameters 1.5 mm and 3 mm (Hyde, 1988). The IC test results were reported to be in close agreement with the uniaxial tensile creep tests results for correlation factors
IC test is uniquely suitable to characterize creep properties of narrow microstructural zones in weld joints. While conducting IC tests on the narrow microstructural regions like heat-affected zones in the weld joint, care must be taken to precisely place the indenter on the desired microstructural zone for IC testing. Authors have utilized the IC technique to characterize the gradient in creep behavior across the 316LN SS weld joint (Naveena et al., 2014; Vijayanand et al., 2015). In this study, to identify the region of the heat-affected zone, the weld metal and the base metal, and to determine the exact locations for IC tests in these zones, the weld joint was etched electrolytically with 60% nitric acid in 40% distilled water. The analysis of the microstructure of the weld metal, heat-affected zone, and the base metal in the weld joint was carried out. A replica of this weld joint with marked test locations was taken on a thin transparent sheet. Once the replica was taken, the weld joint surface was again polished up to 1 μm finish using diamond paste for IC tests. While conducting IC tests, the replica of the weld joint with all the marked locations on it was used for marking the exact locations on the polished specimen surface so that the indenter is placed precisely on the respective locations. A similar methodology can be adopted for any weld joint. The IC behavior from weld metal, the heat-affected zone, and the base metal of a single block of 316LN SS weld joint is shown in Figure 14 (Naveena et al., 2014; Naveena, 2014). The microstructure of the base metal consisted of equiaxed austenite grains, and the heat-affected zone had coarse austenite grains. Microstructure of the weld metal consisted of a mixture of austenite and δ-ferrite. The details of the microstructure and the IC test results are reported previously (Naveena et al., 2014). The higher steady state impression rate of weld metal compared to the base metal, and the lowest steady state impression velocity exhibited by the heat-affected zone, were correlated to the microstructure and morphology of the three distinct regions in the weld joint. These results were consistent with the uniaxial creep behavior of the respective microstructural zones. Further, a good correlation between the IC and uniaxial creep data was obtained using the same correlation factors that have been used for base materials, thus validating the correlation factors for converting steady state impression rate and the impression stress into equivalent uniaxial steady state creep rate and uniaxial tensile stress, in the case of weld metal as well. This indicated that the correlation factors may not be so sensitive to changes in the microstructure of the steel.
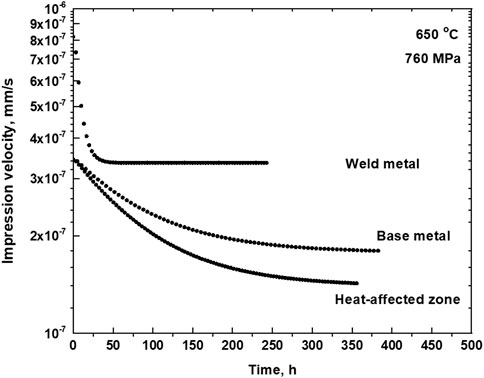
Figure 14. Variation of impression velocity with test time showing the steady state impression velocity in the weld metal, the base metal, and the heat-affected zone at 760 MPa (Naveena et al., 2014).
Gibbs et al. (1985) employed the IC technique to determine the local creep properties across a dissimilar weld joint of 316 stainless steel and 2.25Cr-1Mo steel. A flat-ended cylindrical indenter made of molybdenum, which had a diameter of 1 mm was used. The technique was useful for evaluating the creep strength of the heat-affected zones in the weld joint. Wang (1994) conducted IC tests on a multi-pass ASTM A36 weldment for evaluation of the activation energy and stress exponent for the interface region of the solidified weld metal and the reheat affected zone. Hyde and Sun (2009b) performed IC tests on the heat-affected zoneof P91 weld joint at 923 K and on three different ex-service 1/2CrMoV steam pipe samples at 873 K, in the stress range 70–93 MPa, using a rectangular indenter of width 1 mm. They performed creep tests on CrMoV weldments at 913 K using uniaxial, notched, impression, and cross weld creep test specimens to determine the material constants in creep constitutive equations for the parent, weld metal,and HAZ material to input the data in FE modeling (Hyde et al., 1999). IC test results were consistent with uniaxial creep test results. The authors also pointed out that the effect of oxidation on the IC test results was more significant than that on the uniaxial creep test results. Sun and Hyde (1999) discussed the application of the IC technique to weldments when the direct determination of creep properties by conventional uniaxial tests is not possible.
Lisin et al. (1990) employed the IC technique to evaluate the position-dependent creep behavior across the interface of a roll-bonded Cu-brass laminate. The IC technique was useful to assess the effect of aging on the creep strength of AISI 316L stainless steel welds (Prasannaa and Udupa, 2011). The technique was demonstrated to be useful for comparing the parent metal and weld metal behavior at different levels of aging.
6 Summary
Impression creep (IC) is a small-scale indentation method for high-temperature creep testing, in which a flat-ended punch under a constant load at elevated temperature indents a specimen while the penetration depth is recorded over time. This nearly non-destructive technique provides extensive creep data from a single small specimen. IC has been applied to creep life monitoring of in-service components, accelerated alloy development, and for evaluating localized creep behavior in weldments and anisotropic materials.
Despite its advantages, IC has inherent limitations. The multiaxial compressive stress state beneath the indenter differs from uniaxial tensile loading, complicating data interpretation. The short test duration precludes capturing long-term creep stages such as tertiary deformation. Additionally, the absence of standardized protocols has led to inconsistent practices. Consequently, current research emphasizes developing standardized IC test guidelines, employing multiscale modeling to interpret the complex multiaxial stress fields, and extending IC techniques beyond metals to non-metallic materials.
Author contributions
Naveena: Writing – original draft. MM: Writing – review and editing. S-IK: Writing – review and editing.
Funding
The author(s) declare that no financial support was received for the research and/or publication of this article.
Acknowledgments
The first author wishes to thank the Director, CSIR-National Metallurgical Laboratory for his kind permission to publish this paper.
Conflict of interest
The authors declare that the research was conducted in the absence of any commercial or financial relationships that could be construed as a potential conflict of interest.
Generative AI statement
The author(s) declare that no Generative AI was used in the creation of this manuscript.
Publisher’s note
All claims expressed in this article are solely those of the authors and do not necessarily represent those of their affiliated organizations, or those of the publisher, the editors and the reviewers. Any product that may be evaluated in this article, or claim that may be made by its manufacturer, is not guaranteed or endorsed by the publisher.
References
Ansary, Sh, Mahmudi, R., and Esfandyarpour, M. J. (2012). Creep of AZ31 Mg alloy: a comparison of impression and tensile behavior. Mater Sci. Eng. A 556, 9–14. doi:10.1016/j.msea.2012.06.052
ASTM E-139-06 (2006). Standard test method for conducting creep, creep-rupture, and stress-rupture tests of metallic materials. PA, United States: ASTM International.
Atkins, A. G., and Tabor, D. (1965). Plastic indentation in metals with cones. J. Mech. Phys. Solids 13, 149–164. doi:10.1016/0022-5096(65)90018-9
Brett, S. J., Dyson, C. N. C., Shingledecker, P. J., Rantala, J., Eaton-Mckay, J., and Sun, W. (2018). Impression creep test of a P91 steel: a round robin programme. Materials at High Temperatures 35, 529–534. doi:10.1080/09603409.2017.1410330
Brett, S. J., and Bridges, A. (2025). Limitations to the impression creep test. Mater High. Temp. 42, 78–87. doi:10.1080/09603409.2025.2461364
Brett, S. J., Dyson, C. N. C., Purdy, D., et al. (2018). Impression creep test of a P91 steel: a round robin programme.
Bretta, S. J., and Bridges, A. (2025). An investigation into stepped stress impression creep testing. Mat. High. Temp. 42, 122–128. doi:10.1080/09603409.2025.2468068
Butt, D. P., Korzekwa, D. A., Maloy, S. A., Kung, H., and Petrovic, J. J. (1996). Impression creep behavior of SiC particle-MoSi2 composites. J. Mater Res. 11 (6), 1528–1536. doi:10.1557/jmr.1996.0191
Cacciapuoti, B., Sun, W., McCartney, D. G., Morris, A., Lockyer, S., Ab Razak, N., et al. (2017). An evaluation of the capability of data conversion of impression creep test. Mater High. Temp. 34 (5-6), 415–424. doi:10.1080/09603409.2017.1346747
Chiang, D., and Li, J. C. M. (1994). Impression creep of lead. J. Mater Res. 9, 903–908. doi:10.1557/jmr.1994.0903
Chu, S. N., and Li, J. C. M. (1977). Impression creep; a new creep test. J. Mater Sci. 12, 2200–2208. doi:10.1007/bf00552241
Chu, S. N. G., and Li, J. C. M. (1979). Impression creep of μ-tin single crystals. Mater. Sci. Eng. 39, 1–10. doi:10.1016/0025-5416(79)90164-2
Corwin, W. R., and Lucas, G. E. (1986). The use of small-scale specimens for testing irradiated material: a symposium sponsored by ASTM Committee E-10 on Nuclear Technology and Applications, Albuquerque, NM; 1983 Sept 23. PA, United States: ASTM. Available online at: https://inis.iaea.org/search/search.aspx?orig_q=RN:18065732.
Cseh, G., Chinh, N. Q., and Juhasz, A. (1998). J. Mater Sci. 17, 1207–1209. doi:10.1023/a:1006593727372
Cseh, G., Chinh, N. Q., Tasnadi, P., and Juhasz, A. (1997). J. Mater Sci. 32, 5107–5111. doi:10.1023/a:1018665300227
Dorner, D., Roller, K., Skrotzki, B., Stockhert, B., and Eggeler, G. (2003). Creep of a TiAl alloy: a comparison of indentation and tensile testing. Mater Sci. Eng. A 357, 346–354. doi:10.1016/s0921-5093(03)00205-3
Eggeler, G., and Wiesner, C. (1993). A numerical study of parameters controlling stress redistribution in circular notched specimens during creep. J. Strain Anal. 28, 13–22. doi:10.1243/03093247v281013
Evans, W. J., and Wilshire, B. (1970). The high temperature creep and fracture behavior of 70-30 alpha brass. Metall. Trans. 1, 2133–2139. doi:10.1007/bf02643426
Fujiwara, M., and Otsuka, M. (2001). Indentation creep of β-Sn and Sn–Pb eutectic alloy. J. Mater Sci. Eng. A 319-321, 929–933. doi:10.1016/s0921-5093(01)01079-6
Gallacher, T., Eaton-McKay, J., Brett, S., Jacques, S., Austin, C., and Wisbey, A. (2018). Commercialisation of impression creep testing. Ubiquity Proc. 1 (S1), 19. doi:10.5334/uproc.19
Gibbs, W. S., Wang, S. H., Matlock, D. K., and Olson, D. L. (1985). High temperature impression creep testing of weldments. Weld. Res. Suppl., 153–158.
Golmakaniyoon, S., and Mahmudi, R. (2011). Microstructure and creep behavior of the rare-earth doped Mg–6Zn–3Cu cast alloy. Mater Sci. Eng. A 528, 1668–1677. doi:10.1016/j.msea.2010.10.095
Goyal, S., Laha, K., Das, C. R., Panneerselvi, S., and Mathew, M. D. (2013). Finite element analysis of effect of triaxial state of stress on creep cavitation and rupture behaviour of 2.25Cr–1Mo steel. Int. J. Mech. Sci. 75, 233–243. doi:10.1016/j.ijmecsci.2013.07.005
Haggag, F. M., Nanstad, R. K., Hutton, J. T., Thomas, D. L., and Swain, R. L. (1990). American Society for Testing and Materials, 188–208.
Hayhurst, D. R., and Henderson, J. T. (1977). Creep stress redistribution in notched bars. Int. J. Mech. Sci. 19, 133–146. doi:10.1016/0020-7403(77)90073-x
Holmström, S., Li, Y., Dymacek, P., Vacchieri, E., Jeffs, S., Lancaster, R., et al. (2018). Creep strength and minimum strain rate estimation from small punch creep tests. Mater Sci. Eng. A 731, 161–172. doi:10.1016/j.msea.2018.06.005
Honeycombe, R. W. K. (1984). Plastic deformation of metals. Somerset, United Kingdom: Butter and Tanner Limited.
Hooper, R. M., and Brookes, C. A. (1984). Incubation periods and indentation creep in lead. J. Mater Sci. 19, 4057–4060. doi:10.1007/bf00980771
Hurst, R., Bicego, V., and Foulds, J. R. (2007). “Small punch testing for creep – progress in Europe,” in 8th international conference on creep and fatigue at elevated temperatures. Paper No.: PVP2007-26693.
Hyde, T. H. (1988). Creep crack growth in 316 stainless steel at 600°C. High. Temp. Technol. 6 (2), 51–61. doi:10.1080/02619180.1988.11753380
Hyde, T. H., and Sun, W. (2009a). A novel, high-sensitivity, small specimen creep test. J. Strain Anal. Eng. Des. 44, 171–185. doi:10.1243/03093247jsa502
Hyde, T. H., and Sun, W. (2010). Some considerations on specimen types for small sample creep tests. Mater High. Temp. 27, 157–165. doi:10.3184/096034010x12801645220736
Hyde, T. H., Sun, W., and Becker, A. A. (1996). Analysis of the impression creep test method using a rectangular indenter for determining the creep properties in welds. Int. J. Mech. Sci. 38, 1089–1102. doi:10.1016/0020-7403(95)00112-3
Hyde, T. H., Sun, W., and Williams, J. A. (1999). Creep behaviour of parent, weld and HAZ materials of new, service-aged and repaired 1/2Cr1/2Mo1/4V: 2 1/4Cr1Mo pipe welds at 640°C. Mater High. Temp. 16, 117–129. doi:10.3184/096034099783641173
Hyde, T. H., Yehia, K. A., and Becker, A. A. (1993). Interpretation of impression creep data using a reference stress approach. Int. J. Mech. Sci. 35, 451–462. doi:10.1016/0020-7403(93)90035-s
Hyde, T. H., Yehia, K. A., and Becker, A. A. (1995). Application of the reference stress method for interpreting impression creep test data. Mater High. Temp. 13, 133–138. doi:10.1080/09603409.1995.11689511
Johnson, K. L. (1970). The correlation of indentation experiments. J. Mech. Phys. Solids 18, 115–126. doi:10.1016/0022-5096(70)90029-3
Juhasz, A., Chinh, N. Q., Tasnadi, P., Szaszvari, P., and Kovacs, I. (1987). Mater Sci. Forum 13-14, 421–428.
Kabirian, F., and Mahmudi, R. (2009). Impression creep behavior of a cast AZ91 magnesium alloy. Metall. Mater Trans. A 40, 116–127. doi:10.1007/s11661-008-9699-7
Khoubrou, I., Nami, B., and Miresmaeili, S. M. (2022). Influence of punch diameter on impression creep behaviour of AZ91 magnesium alloy. Mater Sci. Technol. 38 (7), 425–435. doi:10.1080/02670836.2022.2045550
Komazaki, S., Hashida, T., Shoji, T., and Suzuki, K. (2000). Development of small punch tests for creep property measurement of tungsten-alloyed 9%Cr ferritic steels. J. Test. Eval. 28, 249–256. doi:10.1520/jte12102j
Li, J. C. M. (2002). Impression creep and other localized tests. Mater Sci. Eng. A 322 (1–2), 23–42. doi:10.1016/S0921-5093(01)01116-9
Li, J. C. M., and Chu, S. N. G. (1979). Impression fatigue. Scr Mater 13, 1021–1026. doi:10.1016/0036-9748(79)90196-0
Li, S., Purdy, D., Brett, S. J., Deng, D., Shibli, A., and Sun, W. (2021). Effect of indentation depth in impression creep test: conversion relationships and correction functions. Mater High. Temp. 38 (5), 358–367. doi:10.1080/09603409.2021.1971359
Lucas, B. N., and Oliver, W. C. (1999). Indentation power-law creep of high-purity indium. Metall. Mater Trans. A 30, 601–610. doi:10.1007/s11661-999-0051-7
Mahmudi, R., Bazzaz, A. R., and Banaie-Fard, H. R. (2007b). Investigation of stress exponent in the room-temperature creep of Sn–40Pb–2Sb solder alloy. J. Alloys Compd. 429, 192–197. doi:10.1016/j.jallcom.2006.04.040
Mahmudi, R., Geranmayeh, A. R., and Razaee-Bazzaz, A. R. (2007a). Impression creep behavior of cast Pb–Sb alloys. J. Alloys Compd. 427 (1–2), 124–129. doi:10.1016/j.jallcom.2006.03.033
Manahan, M. P. (1983). A new post-irradiation mechanical behavior test–The miniaturized disk bend test. Nucl. Technol. 63 (2), 295–315. doi:10.13182/nt83-a33289
Manahan, M. P., Argon, A. S., and Harling, O. K. (1981). The development of a miniaturized disk bend test for the determination of postirradiation mechanical properties. J. Nucl. Mater 104, 1545–1550. doi:10.1016/0022-3115(82)90820-0
Mao, X., and Takahashi, H. (1987). Development of a further-miniaturized specimen of 3 mm diameter for tem disk (ø 3 mm) small punch tests. J. Nucl. Mater 150, 42–52. doi:10.1016/0022-3115(87)90092-4
Mathew, M. D. (2010). Evolution of creep resistant 316 stainless steel for sodium cooled fast reactor applications. Trans. Indian Inst. Met. 63, 151–158. doi:10.1007/s12666-010-0021-1
Mathew, M. D., Laha, K., and Ganesan, V. (2012). Improving creep strength of 316L stainless steel by alloying with nitrogen. Mater Sci. Eng. A 535, 76–83. doi:10.1016/j.msea.2011.12.044
Mathew, M. D., Naveena, K. J. G., and Ganesh Kumar, J. (2016). Characterisation of mechanical properties of materials using innovative small specimen testing methods. Trans. Indian Inst. Met. 69 (10), 1871–1887. doi:10.1007/s12666-016-0847-2
Mathew, M. D., Naveena, V. V. D., and Vijayanand, D. (2013). Impression creep behavior of 316LN stainless steel. J. Mater Eng. Perform. 22 (2), 492–497. doi:10.1007/s11665-012-0290-4
Mathew, M. D., and Srinivasan, V. S. (2004). “Mechanical behavior of nitrogen-bearing steels,” in Monograph on high nitrogen steels and stainless steels. Editors U. KamachiMudali, and B. Raj (New Delhi: Narosa Publications), 182.
Merchant, H. D., Murty, G. S., Bahadur, S. N., Dwivedi, L. T., and Mehrotra, Y. (1973). Hardness-temperature relationships in metals. J. Mater Sci. 8, 437–442. doi:10.1007/bf00550166
Mulhearn, T. O., and Tabor, D. (1960). Creep and hardness of metals: a physical study. J. Inst. Met. 89, 7–12.
Murty, G. S., and Sastry, D. H. (1981). Creep behaviour of Pb–Sn–Sb alloys. Trans. Indian Inst. Met. 34, 195–201.
Murty, K. L., and Mathew, M. D. (2004). Nondestructive monitoring of structural materials using automated ball indentation (ABI) technique. Nucl. Eng. Des. 228, 81–96. doi:10.1016/j.nucengdes.2003.06.006
Nami, B., Razavi, H., Mirdamadi, S., Shabestari, S. G., and Miresmaeili, S. M. (2010). Effect of Ca and rare earth elements on impression creep properties of AZ91 magnesium alloy. Metall. Mater Trans. A 41, 1973–1982. doi:10.1007/s11661-010-0238-y
Nami, B., Razavi, H., Miresmaeili, S. M., and MirdamadiSh, S. S. G. (2011). Impression creep properties of a semi-solid processed magnesium–aluminum alloy containing calcium and rare earth elements. Scr Mater 65, 221–224. doi:10.1016/j.scriptamat.2011.04.011
Naveena (2014). Understanding creep deformation behavior of 316LN stainless steel and its weld joint using impression creep technique (Ph.D. thesis).
Naveena, K. J. G., and Mathew, M. D. (2015). Finite element analysis of plastic deformation during impression creep. J. Mater Eng. Perform. 24 (4), 1741–1753. doi:10.1007/s11665-014-1225-z
Naveena, S. V., Parameswaran, P., and Mathew, M. D. (2015). Impression creep deformation behavior of 316LN stainless steel. Mater High. Temp. 32 (6), 583–591.
Naveena, V. V. D., Ganesan, V., Laha, K., and Mathew, M. D. (2012). Impression creep behavior of 316LN stainless steel weld joints. Mater Sci. Eng. A 552, 112–118. doi:10.1016/j.msea.2012.05.017
Naveena, V. V. D., Ganesan, V., Laha, K., and Mathew, M. D. (2013). Application of impression creep technique for development of creep resistant austenitic stainless steel. Procedia Eng. 55, 585–590. doi:10.1016/j.proeng.2013.03.299
Naveena, V. V. D., Ganesan, V., and Mathew, M. D. (2014). Evaluation of creep deformation behavior of different microstructural zones of 316LN SS weld joint using impression creep testing technique. Mater Sci. Technol. 30 (10), 1223–1228. doi:10.1179/1743284713Y.0000000
Nayyeri, G., and Mahmudi, R. (2010). The microstructure and impression creep behavior of cast, Mg–5Sn–xCa alloys. Mater Sci. Eng. A 527, 2087–2098. doi:10.1016/j.msea.2009.11.053
Pan, D., Marks, R. A., Dutta, I., Mahajan, R., and Jadhav, S. G. (2004). Miniaturized impression creep testing of ball grid array solder balls attached to microelectronic packaging substrates. Rev. Sci. Instrum. 75, 5244–5252. doi:10.1063/1.1821626
Park, C., Long, X., Haberman, S., Ma, S., Dutta, I., Mahajan, R., et al. (2007). A comparison of impression and compression creep behavior of polycrystalline Sn. J. Mater Sci. 42, 5182–5187. doi:10.1007/s10853-006-0542-5
Parker, J. D., and James, J. D. (1994). Creep behavior of miniature disc specimens of low alloy steel. ASME PVP 279, 167–172. doi:10.1016/j.msea.2005.08.031
Peng, L., Yang, F., Nie, J., and Li, J. C. M. (2005). Impression creep of a Mg-8Zn-4Al-0.5Ca alloy. Mater Sci. Eng. A 410, 42–45. doi:10.1016/j.msea.2005.08.031
Prandtl, L. Z. (1921). Hauptaufsätze: Über die Eindringungsfestigkeit (Härte) plastischer Baustoffe und die Festigkeit von Schneiden. Angew. Math. Mech. 1, 15–20. doi:10.1002/zamm.19210010102
Prasannaa, H. U., and Udupa, K. R. (2011). Probing the deterioration of 316L stainless steel welds due to ageing and creep by indentation creep tests. Nucl. Eng. Des. 241, 4938–4943. doi:10.1016/j.nucengdes.2011.09.012
Ren, J. (2024). FEA study: sensitivity of initial deformation in impression creep testing to indenter and specimen alignment. (Private communication between LJMU and Wood).
Rezvani, A., and Ebrahimi, R. (2025). Mathematical modeling of the deformation zone under an impression creep indenter using upper-bound theory. J. Mater Eng. Perform. doi:10.1007/s11665-024-10616-1
Sargent, P. M., and Ashby, M. F. (1992). Indentation creep. Mater Sci. Technol. 8, 594–601. doi:10.1179/mst.1992.8.7.594
Sastry, D. H. (2005a). Impression creep technique - an overview. Mater Sci. Eng. A 409 (1-2), 67–75. doi:10.1016/j.msea.2005.05.110
Sastry, D. H. (2005b). Impression creep technique - an overview. Mater Sci. Eng. A 409, 67–75. doi:10.1016/j.msea.2005.05.110
Sherby, O. D., and Armstrong, P. E. (1971). Prediction of activation energies for creep and self-diffusion from hot hardness data. Metall. Mater Trans. B 2, 3479–3484. doi:10.1007/bf02811630
Shou, B., Xu, T., Guan, K., and Quin, Y. (2014). Development of small punch test in China. Proc. Int. Conf. Small Specim. Test. Tech., 48–54.
Smith, R. L., and Sandland, G. E. (1922). An Accurate Method of Determining the Hardness of Metals, with Particular Reference to Those of a High Degree of Hardness. Proc. Inst. Mech. Eng. 1, 623–641. doi:10.1243/PIME_PROC_1922_102_033_02
Sujata, M., Sastry, D. H., and Ramachandra, C. (2004). Microstructural characterization and creep behaviour of as-cast titanium aluminide Ti–48Al–2V. Intermetallics 12, 691–697. doi:10.1016/j.intermet.2004.02.007
Sun, W., and Hyde, T. H. (1999). Creep analysis and failure prediction of welds. Acta Metall. Sin. 12, 68–76.
Sun, W., Hyde, T. H., and Brett, S. J. (2008). Interpretation of small ring creep test data. J. Mater Des. Appl. 222 (3), 175–181. doi:10.1177/1464420708094091
Sundar, R. S., and Sastry, D. H. (2000). Creep behaviour of Fe3Al-based alloys in DO3 phase field. Intermet. (Barking). 8, 1061–1065. doi:10.1016/s0966-9795(00)00038-8
Tabor, D. (1948). A simple theory of static and dynamic hardness. Proc. R. Soc. Lond. A 192, 247–274. doi:10.1098/rspa.1948.0008
Tabor, D. (1970). The hardness of solids. British Journal of Applied Physics 1, 145–179. doi:10.1088/0034-6683/1/3/301
Vijayanand, V. D., Ganesan, V., Kumar, J. G., Parameswaran, P., and Naveena, L. K. (2015). Assessment of creep strain distribution across base metal of 316LN austenitic stainless steel weld joint by an EBSD based parameter. Metall. Mater Trans. A 46 (11), 5456–5466. doi:10.1007/s11661-015-3094-y
Viswanathan, U. K., Kutty, T. R. G., Keswani, R., and Ganguly, C. (1996). Evaluation of hot hardness and creep of a 350 grade commercial maraging steel. J. Mater Sci. 31, 2705–2709. doi:10.1007/bf00687304
Wahlberg, A. (1901). Brinell’s method of determining hardness. J. Iron Steel Inst. Lond. 59, 243–298.
Wang, S. H. (1994). Impression creep behavior in weldments. J. Mar. Sci. Technol. 2 (1), 17–24. doi:10.51400/2709-6998.2484
Yang, F., and Li, J. C. M. (2013). Impression test - a review. Mater Sci. Eng. R. 7498, 233–253. doi:10.1016/j.mser.2013.06.002
Yang, F., and Peng, L. (2005). Impression creep of Sn3.5Ag eutectic alloy. Mater Sci. Eng. A 409, 87–92. doi:10.1016/j.msea.2005.05.111
Yu, E. C., and Li, J. C. M. (1977). Impression creep of LiF single crystals. Philos. Mag. 36 (4), 811–825. doi:10.1080/14786437708239760
Keywords: impression creep, deformation, fracture, small-scale test, indentation
Citation: Naveena , Mathew MD and Komazaki S-I (2025) Review of impression creep test: a small-scale testing method for evaluation of creep properties of materials. Front. Mater. 12:1599729. doi: 10.3389/fmats.2025.1599729
Received: 25 March 2025; Accepted: 12 May 2025;
Published: 30 May 2025.
Edited by:
Facundo Almeraya-Calderón, Autonomous University of Nuevo León, MexicoReviewed by:
Citlalli Gaona-Tiburcio, Autonomous University of Nuevo León, MexicoQiang Guo, University of Wyoming, United States
Ricardo Galvan-Martinez, Universidad Veracruzana, Mexico
Copyright © 2025 Naveena, Mathew and Komazaki. This is an open-access article distributed under the terms of the Creative Commons Attribution License (CC BY). The use, distribution or reproduction in other forums is permitted, provided the original author(s) and the copyright owner(s) are credited and that the original publication in this journal is cited, in accordance with accepted academic practice. No use, distribution or reproduction is permitted which does not comply with these terms.
*Correspondence: M. D. Mathew, ZGVhbi5yZXNlYXJjaEBzYWludGdpdHMub3Jn, bWRtYXRoZXdAZ21haWwuY29t
 Naveena1
 M. D. Mathew
 Shin-Ichi Komazaki