 Peng Zeng1,2
 Yonglin Ren1
 Kui Zhao1,2*Xianda Yang1
 Zhen Huang1,2Yanda Li1Liangfeng Xiong1,2Cong Gong1,2
- 1School of Resources and Environmental Engineering, Jiangxi University of Science and Technology, Ganzhou, Jiangxi, China
- 2Jiangxi Provincial Key Laboratory of Safe and Efficient Mining of Rare Metal Resource, Ganzhou, Jiangxi, China
In rock engineering problems, varying durations of freeze-thaw cycles (FTC) can influence the physical and mechanical properties of rocks, potentially inducing engineering hazards. This study investigated these effects through FTC tests and uniaxial compression acoustic emission (AE) tests on red sandstone by analyzing the impacts of freeze–thaw duration and cycle count on the physical and mechanical properties and AE characteristics of the sandstone. Additionally, damage evolution was quantitatively analyzed using AE cumulative counts. The results show that peak stress, elastic modulus, and longitudinal wave velocity reduction rate positively correlate with freeze–thaw duration and cycle count. However, a negative correlation is observed with porosity. The ib value obtained by AE generally shows the change rule of “progressive increase–gradual decline–subsequent resurgence–sharp plummet.” The maximum value of the rising stage (ib1), the minimum value of the falling stage (ib2), and the maximum value of the rising stage (ib3) are positively correlated with the FTC time but negatively correlated with cycle count. Furthermore, the proportion of AE cumulative counts rate in the growth stage of rock failure increases exponentially with the duration and number of FTCs. As FTCs progress, the micro–cracks inside the rock gradually shift from tensile cracks to shear cracks, with a faster transition observed under longer freeze–thaw durations. The damage variable exhibits mutation or gradual mutation, increasing progressively with freeze–thaw duration and cycle count. This study elucidates the damage mechanisms of red sandstone induced by FTC duration, revealing the crack mode transition and associated AE characteristics. These results provide valuable insights for stability analysis, control, and design considerations in rock engineering projects within freeze–thaw environments.
1 Introduction
Freeze–thaw cycles (FTCs) often lead to severe geological disasters, significantly threatening the safety of human life and property. The physical and mechanical properties of a rock and its damage evolution are influenced by the number and duration of FTCs and the temperature variations in the rock. Therefore, understanding the physical and mechanical behavior of rock under different FTCs is of great practical significance for the stability analysis, control, and design of rock engineering in freeze–thaw zones.
The study of freeze–thaw damage in rock has attracted immense interest in rock mechanics and engineering research (Meng et al., 2024; Huang et al., 2022; Liu et al., 2023; Sun et al., 2024; Jia et al., 2023a; Jia et al., 2023b; Zhu et al., 2023; Song et al., 2022). Hou et al. (2022) studied the deterioration mechanism of anhydrite rock in freeze–thaw weathering. Jamshidi (2021) proposed a new rock mechanics prediction parameter (PMPP) to predict the strength of granite rock after FTCs. Liu et al. (2025) studied the effect of FTCs on the microstructure and macroscopic mechanical properties of sandstone. Song et al. (2023), Yang et al. (2021) proposed a phase change coupling expansion method of water ice particles based on the discrete element method, quantitatively characterized the frost heave evaluation index of pore water particles, and established the functional relationship between the evaluation index and the number of FTCs. Jin et al. (2024) observed the macroscopic morphology of slate and comprehensively analyzed the deterioration law of related mechanical properties under freeze–thaw action. Lv et al. (2023) proposed the calculation method of macroscopic damage variable based on the weighing method and established the model of mesoscopic damage variable under load using statistical damage mechanics theory. He et al. (2024) integrated mercury intrusion porosimetry (MIP) with micro-computed tomography (micro-CT) techniques to systematically investigate the microstructural evolution of cementitious specimens subjected to varying numbers of freeze-thaw cycles. Wu et al. (2024) study explores an approach to strengthen cemented rockfill by using well-graded gangue, and by partially replacing Portland cement with fly ash and a premixed low-alkalinity activator. Wu et al. (2025) reported a waste-to-wealth pathway that improves cemented gangue backfill materials by cellulose nanofibers to recycle mining wastes and partially replace cement. These studies can be summarized into four methods: microscopic, mesoscopic, macro-scopic, and an integrated macro-micro method (Zhang and Wang, 2022). However, research on rock damage characteristics under different FTCs remains limited, particularly where the cycle durations exceed 4 h.
Acoustic emission (AE) is a critical phenomenon observed during material damage and failure. It plays a vital role in evaluating material damage and failure mechanisms by capturing the characteristics of AE signals. Over the past decades, domestic and foreign researchers have extensively conducted AE characteristics, including compression, tension, shear, and fracture (Wang et al., 2020; Yang et al., 2021; Wang et al., 2019; Yang et al., 2021; Meng et al., 2020). Advancements in science and technology have also led to significant progress in AE numerical simulation and localization research (An et al., 2021; Yu et al., 2021). Theoretical and laboratory tests can provide a scientific basis for AE monitoring and predicting rock mass. Dong et al. (2022) conducted AE tests on unstable fracture of granite and provided parameters for rock instability assessment and early warning based on multiple AE indicators. The integrated machine learning model was used to construct the plastic stage identification method of rock mass crack propagation state. The study of Song et al. (2023) showed that the change in FTCs manifested an increase of ringing count in the initial loading stage, and the number and distribution of AE three-dimensional event points were closely related to the fracture dip angle. However, accurate theoretical research has not been conducted so far on the AE characteristics of rocks with different FTCs.
This study focused on red sandstone as the research subject. First, FTC tests with different FTC times were conducted. Subsequently, uniaxial compression acoustic emission tests were performed on red sandstone after different FTCs. The variation characteristics of longitudinal wave velocity, porosity, stress-strain curve, peak stress, and elastic modulus of red sandstone under different FTCs were examined. Additionally, the characteristics of AE ib value, energy rate, and ringing count in rock failure after each FTC were analyzed. The variation law of the internal microstructure of red sandstone as a function of the variation characteristics of AE RA-AF value has been discussed. Finally, the damage evolution characteristics of red sandstone under different FTCs have been quantitatively analyzed based on AE cumulative ringing counts. These results would provide a reference for the analysis, control, and design of rock engineering stability in the freeze–thaw zones.
2 Experimental design and scheme
2.1 Selection and preparation of specimens
Red sandstone specimens from southeast Sichuan, without visible joints and fissures on the surface, were selected for this experiment. The surface of the specimens was dark red. The water drill method was used for sampling. After cutting and end face grinding, the standard cylinder specimens with a diameter of 50 mm and a height of 100 mm were processed. The specimens had no obvious appearance defects, and then the ultrasonic wave velocity instrument was used to screen out the specimens with similar wave velocity for subsequent FTCs. The prepared specimens and their composition are shown in Figure 1. As shown in Figure 2, the study area exhibits short time frozen ground, with red sandstone formations predominantly distributed throughout the region.
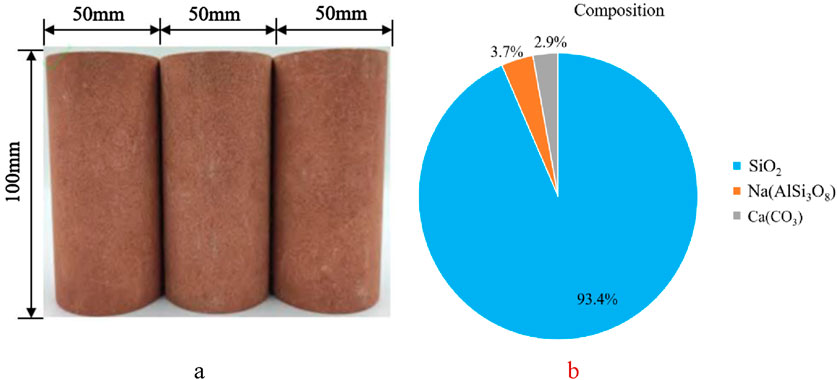
Figure 1. Processed specimens and their composition. (a) Processed specimens. (b) Components.
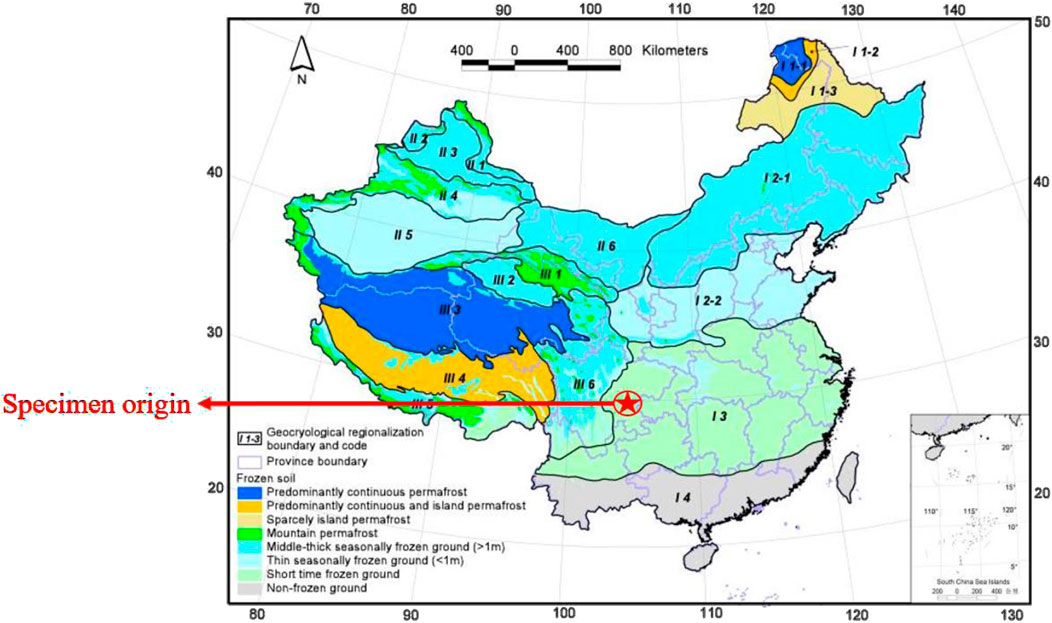
Figure 2. Geocryological regionalization and classification map of the frozen soil in China (1:10, 000, 000) (Nan, 2024).
2.2 Main equipment for testing
(1) ZK-270 vacuum saturation device: It was used for water saturation of rock specimen; subsequently, FTC test was carried out.
(2) DB-TH-22-D temperature and humidity test chamber: It was used for FTC tests of the rock specimens. The humidity control range was 0%–100%, and the temperature control range was –70°C–180°C.
(3) RMT-150C rock mechanics test system: It tested the mechanical failure test of rock after freeze–thaw damage.
(4) RSM-SY6(C) non-metallic ultrasonic detector: It acquired the wave velocity of rock specimens, filtered the specimens with poor homogeneity, and collected the wave velocity variation characteristics of rock specimens under different FTCs.
(5) NM-60 magnetic resonance rock microstructure instrument: It tested and analyzed the characteristics of rock porosity and microstructure changes under different FTCs.
(6) PCI-II acoustic emission system: It collected and tested the AE signal during rock failure after rock freeze–thaw damage. The system was matched with R6α type AE sensor. The sampling frequency of the AE system was 1MSPS, the pregain was 40 dB, the threshold value was 40 dB, and the sampling length was 1k.
2.3 Design of relevant parameters of freeze-thaw test
FTC temperature, FTC times, and number of FTC times are three important factors in the FTC test.
(1) FTC temperature: Based on the regional meteorological data, the maximum temperature in winter can reach 15°C–17°C. Due to the influence of altitude and the environmental conditions, the temperature difference between morning and evening varies greatly, and the minimum temperature can reach –5– (−)10°C. In winter months, the temperatures can be below 0°C for several hours. Combined with the relevant freeze–thaw test procedures and literature suggestions at home and abroad, the minimum freezing temperature of this test was determined to be −10°C and the melting temperature was 20°C.
(2) The number of FTCs: Based on previous experience, 0, 10, 20, 30, and 40 FTCs were selected for this test.
(3) FTC time: Previous studies have shown that freezing and thawing times typically range from 4 to 12 h for frozen soil and permafrost rock seasonally. Shen et al. (2016) found that for rock porosity greater than 10%, poorly cemented mediumhard and soft rock freeze completely within 2 h and thaw in 4 h. Conversely, dense, hard rocks with less than 10% porosity and no significant opening pores freeze in 1 h and thaw in 1 h. After testing, the average porosity of red sandstone in this study was 9.69%. Combined with the Shen et al. (2016), two groups of different FTCs were finally determined: one group where frozen and thawed for 1 h and second group for 2 h.
2.4 Testing procedures
(1) The mass and wave velocity of the specimen before the FTC were measured.
(2) A vacuum saturation device forced the specimens to be saturated with water for 48 h.
(3) NM-60 magnetic resonance rock microstructure instrument measured the porosity of the specimen, and the porosity of the specimen without a FTC was obtained.
(4) FTC test: The saturated specimens were put into the temperature and humidity test chamber for a FTC test. The temperature control range of the test chamber was –10°C–20°C. The FTCs were 0, 10, 20, 30, and 40 times, respectively. Two kinds of FTC times were set with both freezing and thawing times of 1 and 2h. To prevent the error caused by the water loss of the specimen, each group of specimens was saturated after 5 FTCs, and the longitudinal wave velocity and porosity were counted.
(5) After the FTC test, the test of specimen quality, wave velocity, and porosity, followed by the uniaxial compression acoustic emission test were carried out. The RMT-150C test system adopted displacement control mode, with loading rate of 0.002 mm/s.
The test system is shown in Figure 3.
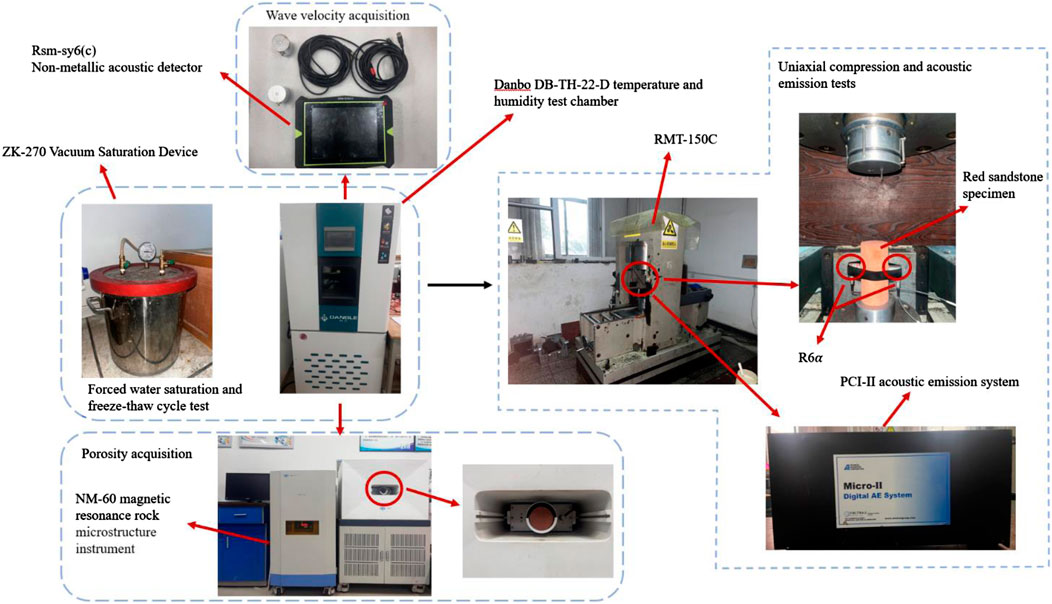
Figure 3. Diagram of the test system.
3 The variation law of physical and mechanical properties
3.1 Longitudinal wave velocity
The average longitudinal wave velocity of water-saturated red sandstone specimens obtained under different FTCs and freeze–thaw times is shown in Figure 4. With the increase in FTC count, the longitudinal wave velocity of rock frozen and thawed for 1h decreased from 2,721 to 2027 m/s, that is, a reduction of 25.5%. Moreover, the longitudinal wave velocity of rock frozen and thawed for 2 h decreased from 2,675 to 1915 m/s, that is, a reduction of 28.4%. The reduction in longitudinal wave velocity indicates the development of microdefects, such as micropores and microcracks, within the rock (Fang et al., 2017). The specimens frozen and thawed for 2 h experienced a longer FTC time, and the development of micropores and microcracks in the rock was more sufficient, which in turn showed a more noticeable decrease in longitudinal wave velocity.
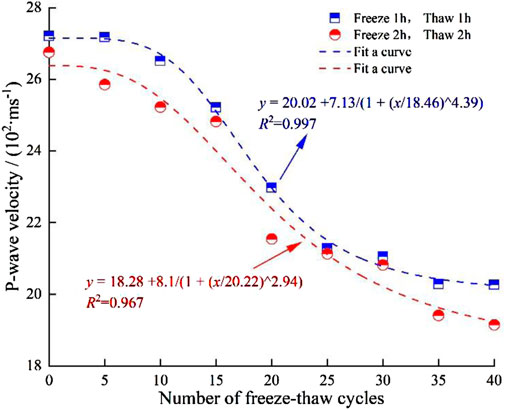
Figure 4. Longitudinal wave velocity of red sandstone change with freeze-thaw cycles.
3.2 Porosity
The change rule of porosity after every 10 FTCs is shown in Figure 5. To facilitate the analysis, the concept of growth contribution rate is introduced, which is defined as the ratio of incremental porosity to total porosity increase. For example, after the 10th FTC, the contribution rate of porosity growth of rock = (10th porosity – 0th porosity)/(40th porosity – 0th porosity). The porosity of the specimens frozen and dissolved for 1h increased by 1.1% between 10 and 20 cycles, with a growth contribution rate of 68.6%. The porosity of the specimens frozen and thawed for 2h increased rapidly in 10–20 cycles; the porosity increased by 1.55% and the contribution rate of growth was 70.7%. This increase is attributed to frost-heaving forces generated as water within rock pores undergoes phase transitions during FTCs. The frost-heaving force leads to the expansion and development of microcracks inside the rock, thus increasing the porosity of the rock.
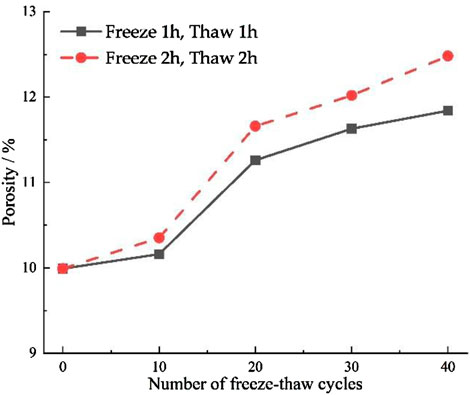
Figure 5. Characteristics of porosity evolution of red sandstone with different freeze-thaw cycles.
3.3 Stress-strain curve, peak stress and elastic modulus
The rock stress–strain curve was obtained after the uniaxial compression test of red sandstone subjected to different FTC times and durations (Figure 6). Figure 6 illustrates the compaction, elasticity, plasticity, and post-peak failure of the rock compression failure process after freeze–thaw. As the FTCs increased, the compaction stage extended under the same number of cycles. The rock compaction stage of freezing and thawing for 2h also increased compared with freezing and thawing for 1h. The curve shows a gentle trend as a whole.
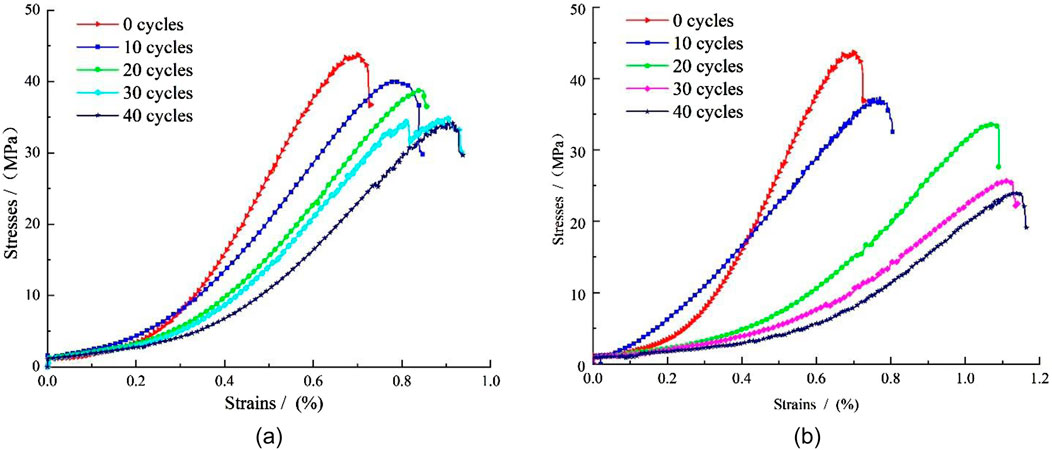
Figure 6. Stress-strain curves of red sandstone with freeze-thaw cycles under uniaxial compression. (a) Freeze for 1 hour, thaw for 1 hour. (b) Freeze for 2 hours, thaw for 2 hours.
Figure 7 presents the variation in peak stress and elastic modulus with the number of FTCs. In the first 10 cycles, the pore structure inside the rock developed rapidly, and the corresponding peak stress and elastic modulus decreased rapidly, marking the initial damage stage. From the 10th to 40th cycle, the development rate of pore structure in the rock stabilized, corresponding to the stable damage stage. During the FTC of rock, the peak stress gradually decreased with the increased cycle count. Under the same number of cycles, the peak stress reduction owing to different freeze–thaw durations was different. The peak stress of rock without a FTC was 43.85 MPa. Under the condition of freezing and thawing for 1h, after 10, 20, 30, and 40 FTCs, the peak stresses of rock were 40.09, 38.75, 34.91, and 34.17MPa, respectively, and the reduction rates were 8.57%, 11.63%, 20.39%, and 22.08% respectively. Under the condition of freezing thawing for 2h, after 10, 20, 30, and 40 FTCs, the peak stresses of rock were 37.17, 33.55, 25.66, and 23.91 MPa, respectively, and the reduction rates were 15.23%, 23.49%, 41.48%, and 45.47% respectively.

Figure 7. Characteristics of peak stress and elastic modulus of red sandstone under different freeze-thaw cycles.
These reductions result from frost-heaving forces that induce microcrack formation and expansion, exacerbating rock damage. Longer freeze-thaw cycles create greater temperature gradients within the rock, influencing the proportion of unfrozen water and, consequently, the severity of frost-induced damage.
The elastic modulus of the rock decreased gradually with the increase in FTCs. The elastic modulus of rock without an FTC was 10.88 GPa. Under the condition of freezing and thawing for 1 h, after 10, 20, 30, and 40 FTCs, the elastic moduli of rock were 7.68, 7.22, 6.87, and 6.34GPa, respectively, and the reduction rates were 29.41%, 33.64%, 36.86%, and 41.73%, respectively. Under the condition of freezing and thawing for 2h, after 10, 20, 30 and 40 FTCs, the elastic moduli of rock were 5.84, 5.23, 4.94, and 3.97 GPa, respectively, and the reduction rates were 46.32%, 51.93%, 54.60%, and 63.51% respectively. As an important parameter reflecting the elastic deformation resistance of materials, the reduction of elastic modulus can also reflect the deterioration of rock with the increase of FTC time and times to a certain extent. The above results are consistent with the results reported by Zhu et al. (2021).
4 AE characteristics of red sandstone failure process
4.1 AE ib value and energy
The improved b value (ib value), developed as an enhanced version of the conventional b value (Gong et al., 2014), demonstrates improved reliability through statistical characterization of amplitude distributions (Jung et al., 2021), with its variations exhibiting heightened sensitivity to internal crack propagation dynamics in materials. Research shows that (Zeng et al., 2024), with the increase of ib value, the formation and expansion of microcracks become more significant. Conversely, with the decrease in ib value, the development of largescale cracks is more prominent. When the ib value stabilizes, it indicates that the largescale cracks inside the material gradually decrease, and it is unlikely that largescale damage will occur again. The calculation formula is shown in Equation 1:
Among them:
Figure 8 shows the relationship curve of stress, AE ib value, and energy rate with time after different FTCs of red sandstone under different FTCs. Figure 8 shows that the AE ib value exhibited a “progressive increase–gradual decline–subsequent resurgence–sharp plummet” trend before the rock reached the peak stress, with the “sharp plummet” phenomenon appearing at or before the peak stress. This “sharp plummet” in AE ib value can be regarded as a precursor to the instability and failure of red sandstone. For analysis, the maximum value of the rising stage, minimum value of the falling stage, and maximum value of the rising stage were recorded as AE ib1, ib2, and ib3. Figure 9 shows the statistical variation of AE ib1, ib2, and ib3. Under the same FTC time, with the increase of FTCs, AE ib1, ib2, and ib3 in the rock failure process showed a downward trend. Under the same number of FTCs, AE ib1, ib2, and ib3 of rock specimens frozen thawed for 2h were higher than those frozen and thawed for 1h. This phenomenon demonstrates that the progressive increase in both the number and duration of FTCs promotes accelerated development of micro-pores and micro-cracks within rock specimens, leading to structural loosening of the internal architecture and consequently manifesting as a marked reduction in peak stress.
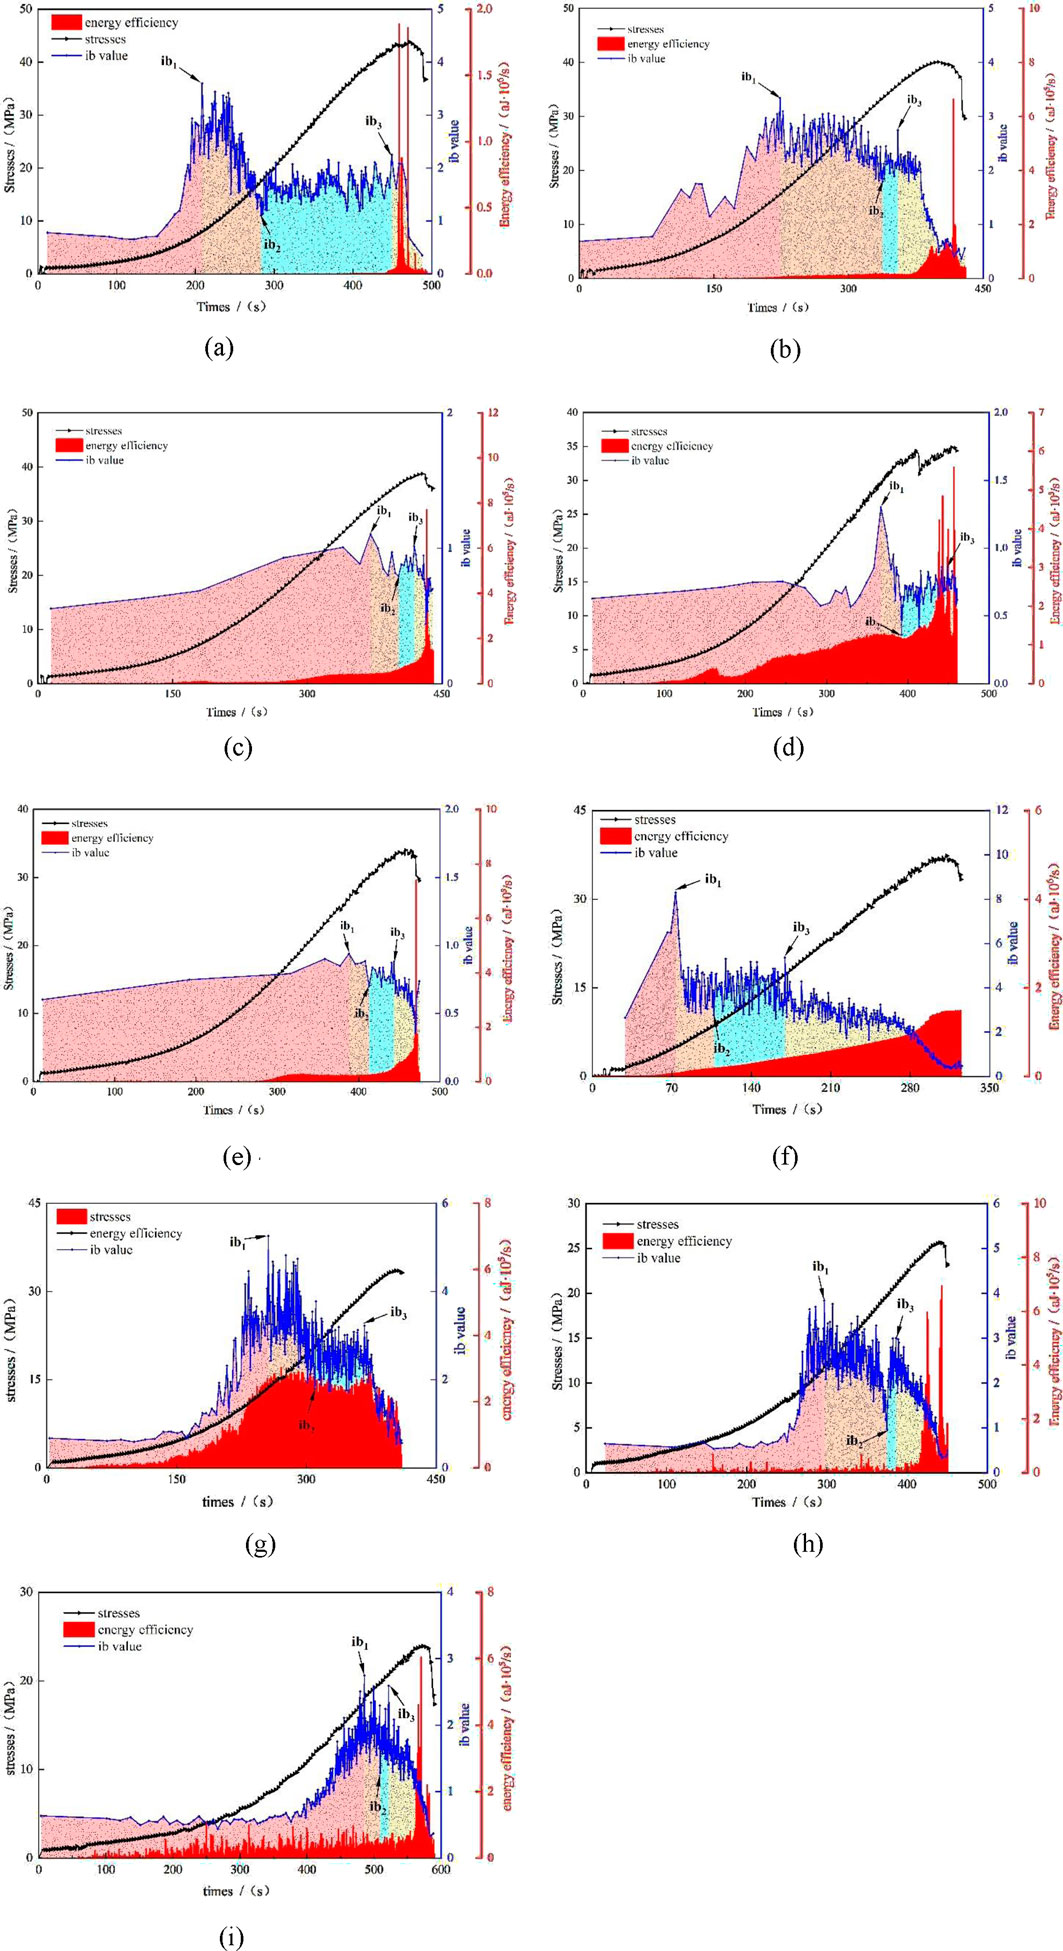
Figure 8. Stress, AE ib value and energy rate change with time. (a) 0 cycle. (b) 10 cycle(Freezing 1 h, thawing 1 h). (c) 20 cycle(Freezing 1 h, thawing 1 h). (d) 30 cycle(Freezing 1h, thawing 1 h). (e) 40 cycle(Freezing 1 h, thawing 1 h). (f) 10 cycle(Freezing 2 h, thawing 2 h). (g) 20 cycle(Freezing 2 h, thawing 2 h). (h) 30 cycle(Freezing 2 h, thawing 2 h). (i) 40 cycle(Freezing 2 h, thawing 2 h).
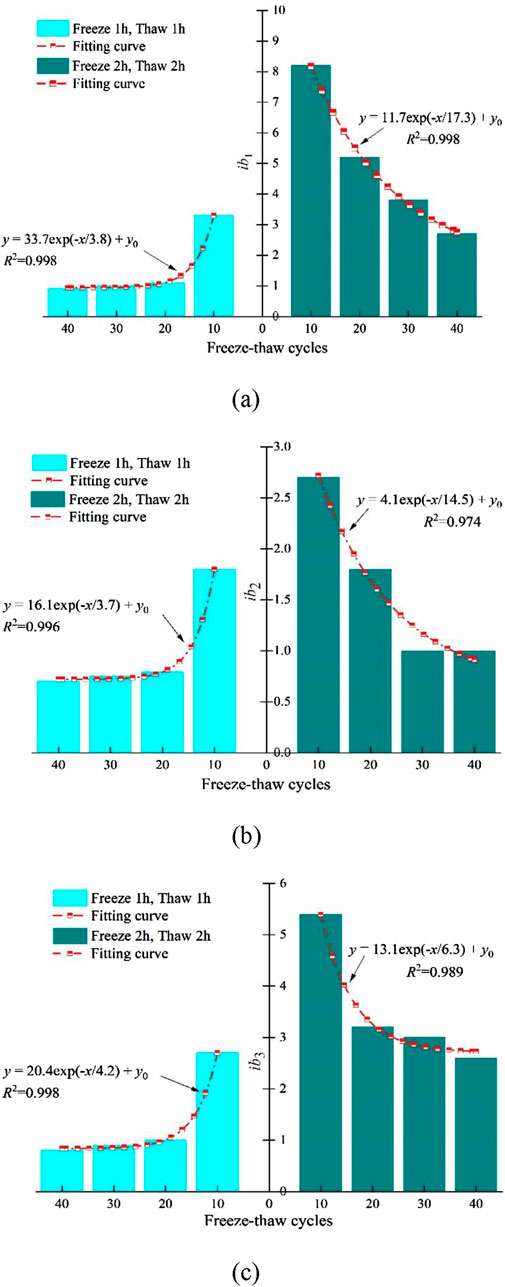
Figure 9. Variation of AE ib value. (a) ib1. (b) ib2. (c) ib3.
The release of AE energy correlates with rock internal fracture and rock failure. Analysis of 8 diagrams reveals that AE events were mostly low-energy events in the loading stage before the peak stress. During this process, the AE ib value showed the law of “rising–falling–rising again.” This behavior arises because, in the first rise stage of the AE ib value, the cracks formed inside the specimen are mainly tiny cracks caused by external loads. Subsequently, as the AE ib value declines, the AE ib value is reduced by the development of large-scale cracks. These large-scale cracks are formed by the coalescence of microcracks generated during the FTC and small cracks generated during the loading process. As the AE ib value rises again, the cracks inside the rock specimen are mainly new small cracks caused by external loads. Until the peak stress is reached, the rock specimen is destroyed. At this time, the high-energy AE event increases significantly (Zhang et al., 2019) while the AE ib value decreases sharply. This phenomenon arises because numerous micro-cracks within the rock specimen undergo rapid propagation and ultimately coalesce into visually discernible macro-scopic cracks, accompanied by substantial AE energy release that culminates in specimen failure.
4.2 AE counts
AE counts represent the number of times the AE signal exceeds the preset threshold. Liu et al. (1997) conducted a long-term study using acoustic emission technology to study the damage and fracture process of materials. They identified the ringing count as a key parameter describing the characteristics of the AE signal, which can better reflect the characteristics of material performance changes. This is because the ringing count is proportional to the strain energy released by the movement of dislocations in the material, the peeling and fracture of inclusions and second-phase particles, and crack propagation (Liu et al., 1997). Figure 10 shows the relationship between the acoustic ringing count rate and the stress of the red sandstone specimen under different FTCs after different FTCs. The evolution curve of AE counts rate with time can be divided into three stages: quiet, growth, and steep increase. At the same time, the AE signal characteristics in the rock loading process showed good consistency with the stress–time curve.
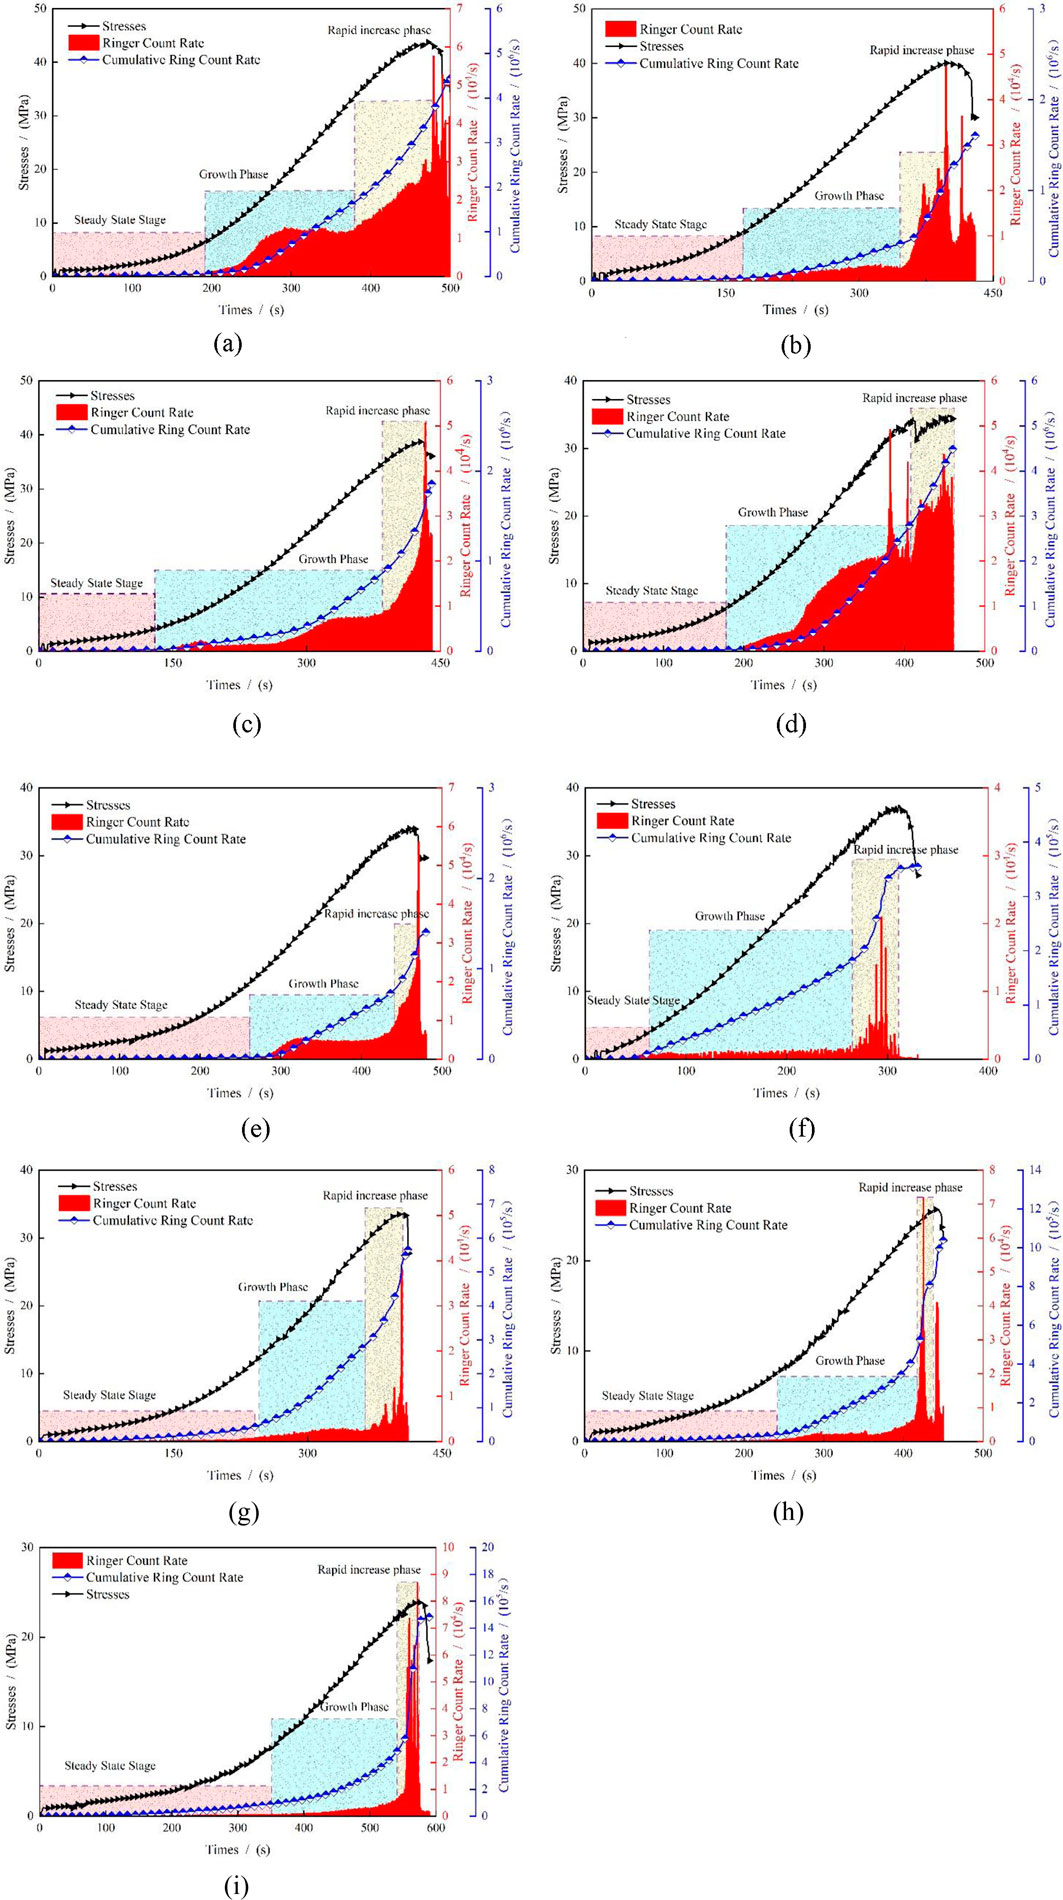
Figure 10. AE count rate, AE accumulate counts and stress change with time. (a) 0 cycle. (b) 10 cycles(Freezing 1 h, thawing 1 h). (c) 20 cycles(Freezing 1 h, thawing 1 h). (d) 30 cycles(Freezing 1 h, thawing 1 h). (e) 40 cycles(Freezing 1 h, thawing 1 h). (f) 10 cycles(Freezing 2 h, thawing 2 h). (g) 20 cycles(Freezing 2 h, thawing 2 h). (h) 30 cycles(Freezing 2 h, thawing 2 h). (i) 40 cycles(Freezing 2 h, thawing 2 h).
The AE count rate was very low at the quiet stage owing to the fact that the AE signal generated in this stage mainly included the axial load generated during the uniaxial compression process. The micro-pores and micro-cracks generated during the FTC were gradually compacted, and the internal structure of the specimen gradually tended to be complete. There was no condition to produce many AE signals in this stage. In the growth stage, the AE count rate was higher than that in the quiet stage, and the AE count rate in this stage accounted for the largest proportion of the cumulative AE counts. This was because in this stage, owing to the axial load, new cracks began to appear inside the rock specimen. During this stage, the degree of internal defect development of the species was enhanced, and the degree of deterioration was getting higher and higher. In the steep increase stage, the AE count rate in this stage was doubled compared with that in the growth stage. This was because the specimen is about to reach the peak stress in this stage, the fracture network development in the specimen was completed, and the internal local cracks were penetrated. The corresponding AE count rate was significantly enhanced.
Additionally, the proportion of cumulative AE count rate in the growth phase was counted in Figure 11. For specimens frozen and thawed for 1 h, and those frozen and thawed for 2 h, the cumulative AE count rate increased with the number of freeze-thaw cycles. The increase was more pronounced for specimens subjected to shorter freeze–thaw durations (1 h) than for those with longer durations (2 h). The elevated proportion of AE count rate during the growth phase is attributed to their capacity to characterize the evolutionary progression of internal structural defects within rock specimens, with increased values corresponding to enhanced micro-crack nucleation induced by compressive failure mechanisms during this deformation stage (Zhao et al., 2020). Owing to the different duration of FTCs, the damage produced by the species frozen and thawed for 1 h during the FTC was less than that of the specimens frozen and thawed for 2h. As the internal structure of the specimen frozen and melted for 1 h was relatively complete and the degree of deterioration was relatively low compared with that of the specimen frozen and melted for 2h, the proportion of the cumulative AE counts rate growth stage generated by the specimen frozen and melted for 1 h during the uniaxial compression failure process would be higher than that of the specimen frozen and melted for 2 h. This phenomenon demonstrates that the extended duration of FTCs further intensifies the degradation processes within the rock matrix.
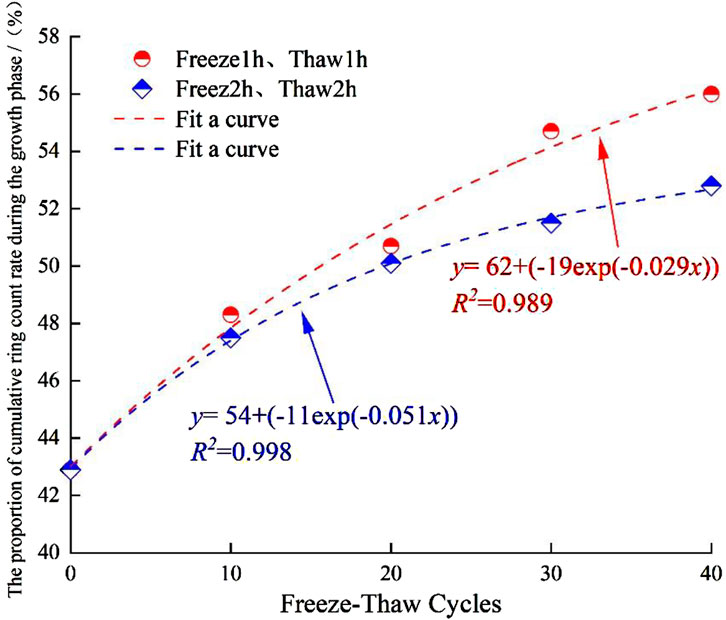
Figure 11. Proportion of AE cumulative counts rate change with freeze-thaw cycles during the growth phase.
4.3 AE microcrack characteristics
The variation characteristics of AE RA (the ratio of rise time to amplitude)–AF (the ratio of ringing count to duration) can determine the type of microcracks generated inside the rock during loading (Zhang et al., 2020). High RA and low AF values correspond to shear cracks, while low RA and high AF values correspond to tensile cracks. Through systematic application of the RA-AF technique coupled with Gaussian mixture modeling (Chen et al., 2023), the temporal progression of micro-crack typology distribution in red sandstone specimens was quantitatively delineated across incremental FTCs, with analytical outcomes graphically presented in Figure 12. The statistical chart of variation in micro-crack typology is shown in Figure 13.
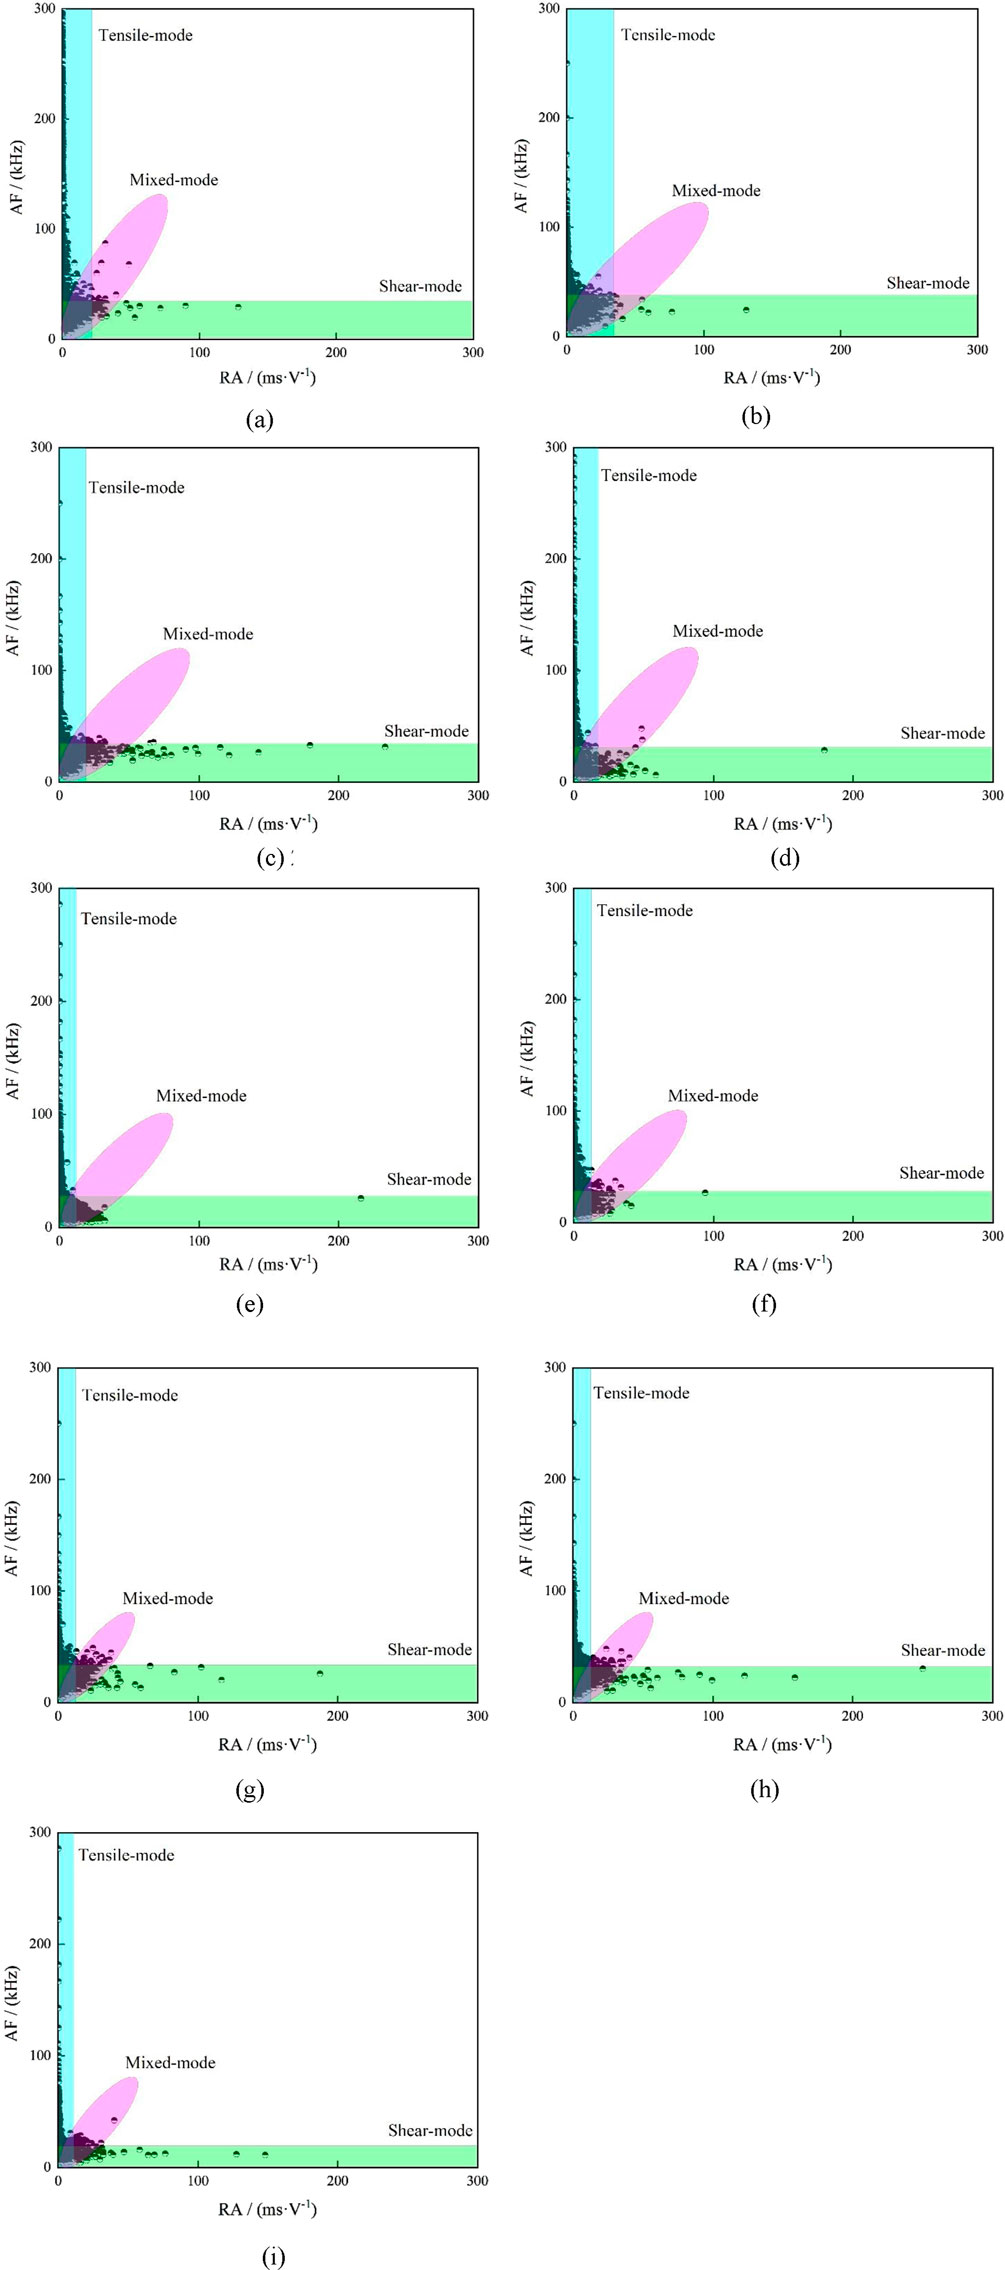
Figure 12. Types and distribution of microcracks of red sandstone. (a) 0 cycle. (b) 10 cycles(Freezing 1 h, thawing 1 h). (c) 20 cycles(Freezing 1 h, thawing 1 h). (d) 30 cycles(Freezing 1 h, thawing 1 h). (e) 40 cycles(Freezing 1 h, thawing 1 h). (f) 10 cycles(Freezing 2 h, thawing 2 h). (g) 20 cycles(Freezing 2 h, thawing 2 h). (h) 30 cycles(Freezing 2 h, thawing 2h). (i) 40 cycles(Freezing 2 h, thawing 2 h).
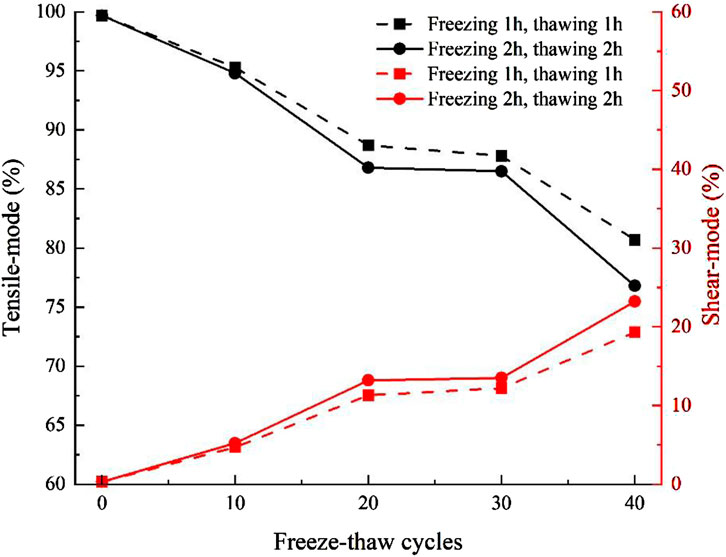
Figure 13. Statistical chart of variation in micro-crack typology.
In the uniaxial compression process of red sandstone specimens without FTCs, the internal microcracks were mainly in the tensile mode, and the proportion of microcracks was 99.7%. The proportion of microcracks in the tensile mode of red sandstone specimens frozen and melted for 1 h after 10, 20, 30, and 40 cycles were 95.3%, 88.7%, 87.8%, and 80.7%, respectively. The proportion of microcracks in the tensile mode of red sandstone specimens frozen and thawed for 2 h after 10, 20, 30, and 40 cycles were 94.8%, 86.8%, 86.5%, and 76.8%, respectively. By longitudinally comparing the types of internal microcracks during the failure process of red sandstone specimens, it could be observed that with the increase of FTCs, the proportion of microcracks in the tensile mode gradually de-creased, while the proportion of microcracks in the shear mode gradually increased until 40 FTCs. The tensile mode still dominated the type of internal microcracks in the specimen. By comparing the red sandstone specimens under different FTCs, it was observed that the proportion of micro-crack shear mode in the specimens frozen and thawed for 2 h was slightly higher than that in those frozen and thawed for 1 h. This phenomenon indicates that the FTC can affect the internal micro-crack mode of the red sandstone specimen, and the more FTCs there are and the longer the FTC time, the more pronounced the effect.
5 Freeze-thaw progressive damage characteristics of red sandstone
Damage refers to the deterioration process of materials or structures caused by mesostructural defects (such as micro-cracks, micro-voids, etc.). When the rock material is subjected to load or ambient temperature changes, owing to the generation of a large number of internal micro-damages, the initiation, expansion, and connection of microcracks or micro-pores, the mechanical properties of the rock material are degraded. The release of elastic strain energy, an AE phenomenon, accompanies this process. Therefore, there must be an inevitable relationship between rock damage and the AE count rate used to quantify the progressive damage characteristics of red sandstone specimens after different FTCs under different FTCs.
The failure in which the rock directly loses its bearing capacity at a strain of less than 1% and the stress peaks under uniaxial stress state is called brittle failure. If the strain is between 1% and 2%, the stress fluctuates after reaching the peak value, causing direct failure called brittle–ductile failure. The failure of rock with a complete stress–strain curve and strain above 1%–5% is called ductile failure. In (Wu et al., 2015), the variation law of cumulative ringing count with time was determined. Rock failure is divided into three types: brittle failure, brittle–ductile failure, and ductile failure. Moreover, an exponential function can express the function relationship between AE cumulative ringing count N and time t of brittle or brittle–ductile failure of rock. From Figures 9, 10, it can be determined that the red sandstone specimen without a FTC, under the condition of freezing and thawing for 1h, was a brittle failure for 10, 20, and 30 cycles, and a brittle–ductile failure for 40 cycles. Under the condition of freezing and thawing for 2 h, 10 cycles and 20 cycles were brittle failure, and 30 cycles and 40 cycles were brittle–ductile failure.
Under the condition of displacement control, the strain of rock increases linearly with time. The relationship between strain ε and time t is as follows:
In the formula,
The
Where
In addition, there is no ductile failure in all specimens in this test, so the failure mode is no longer discussed.
Based on the material damage process, Lemaitre et al. proposed the continuum damage mechanics and established the damage model, as shown in Equation 6:
It is assumed that the strength of rock micro-element obeys Weibull distribution function (Wu et al., 2015), that is:
In the formula, the constant
The simultaneous Equations 7, 8 can be obtained:
By establishing the constitutive model of rock damage under uniaxial compression, the calculation method of and are determined in reference (Yang et al., 2005) as showing in Equation 10:
In the formula,
Applying the test data in Formula 5, the parameter values of the damage variable function of red sandstone with different FTCs under different FTCs satisfying the Weibull distribution can be obtained (Table 1). Furthermore, the relationship between AE cumulative ringing count and damage variables of red sandstone with different FTCs under different FTC times can be obtained (Figures 14, 15).
Table 1. The parameter values of damage variable evolution function of red sandstone with different freeze-thaw cycles.
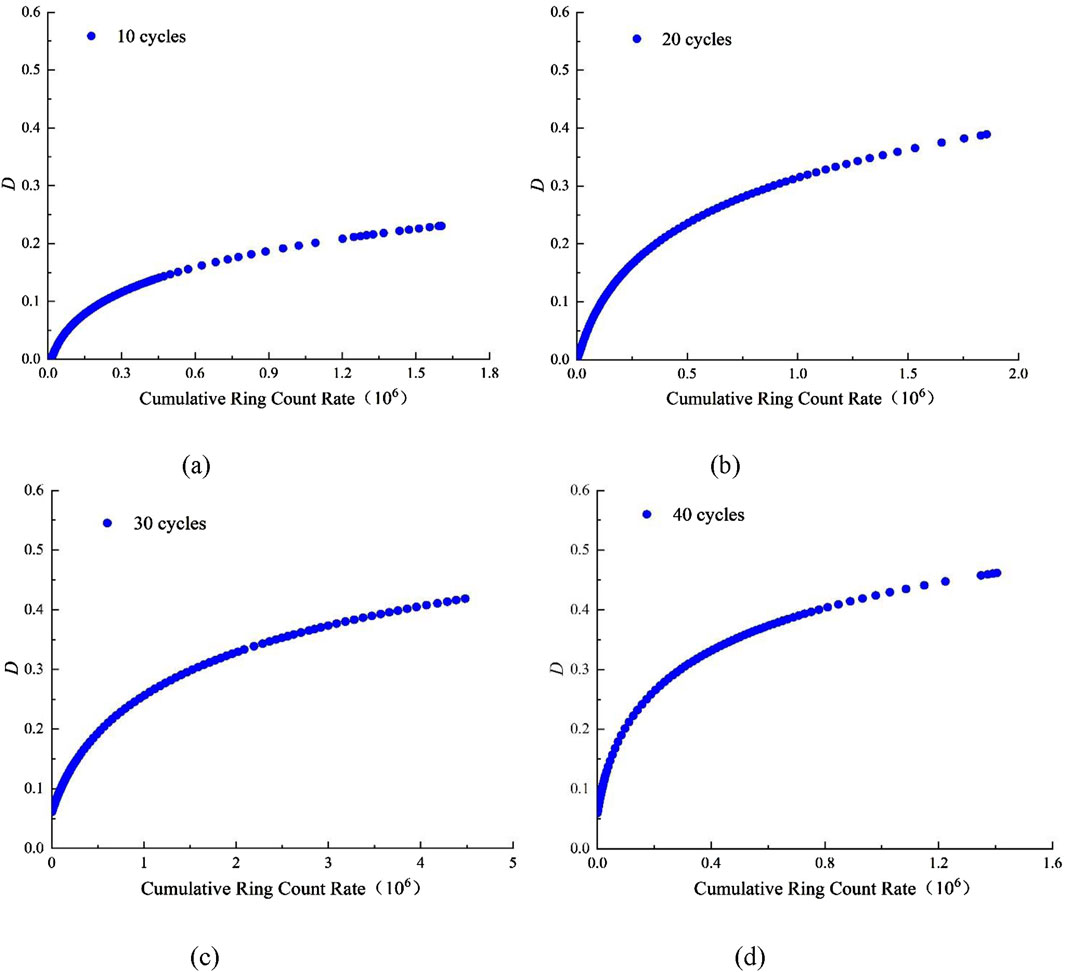
Figure 14. Relationship between AE cumulative counts and damage variables (Freezing 1 h, thawing 1 h). (a) 10 cycles. (b) 20 cycles. (c) 30 cycles. (d) 40 cycles.
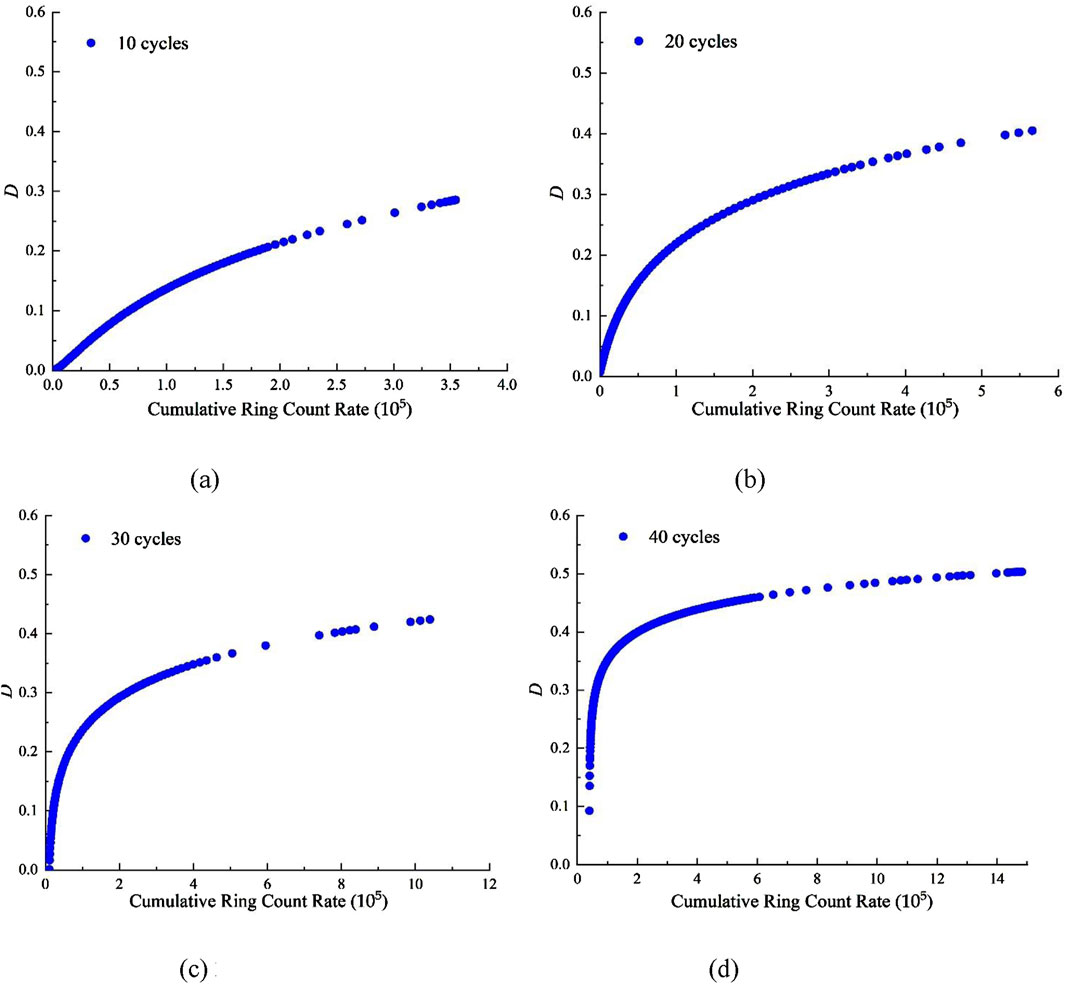
Figure 15. Relationship between AE cumulative counts and damage variables (Freezing 2 h, thawing 2 h). (a) 10 cycles. (b) 20 cycles. (c) 30 cycles. (d) 40 cycles.
Figures 14, 15 show that the cumulative ringing count positively correlates with the damage variable in the uniaxial compression process of freeze–thaw red sandstone. With the gradual increase of axial load, the micro-pores and micro-cracks inside the red sandstone specimens gradually developed and penetrated, accompanied by the generation of a large number of AE signals. The development and penetration of these micropores and micro-cracks aggravated the deterioration process of red sandstone. After 10, 20, 30, and 40 FTCs, the final damage variable values of red sandstone, frozen and thawed for 1 h, were 0.23, 0.39, 0.42, and 0.46, respectively. The final damage variable values of red sandstone frozen and melted for 2 h under the same FTCs were 0.29, 0.41, 0.42, and 0.50, respectively. It was observed that with the increase in the number of FTCs, the final damage variable value exhibited an increasing trend. Under the same number of FTCs, the rock frozen and thawed for 2 h exhibited a higher final damage variable value than the rock frozen and thawed for 1 h, further verifying that the increase of FTC time aggravated the progressive damage inside the red sandstone to a certain extent. The cumulative ringing count–damage variable curve effectively reflects the progressive damage characteristics of red sandstone under different FTCs and the same number of FTCs and provides theoretical support for the deterioration of mechanical parameters in previous studies.
6 Discussion
Current theoretical frameworks addressing rock FTC damage encompass volumetric expansion theory, hydrostatic pressure theory, capillary theory, and subcondensation ice theory (Jia et al., 2024). However, the freeze-thaw deterioration process in rock materials demonstrates significant complexity, wherein the dominant damage mechanism may vary across different environmental and material conditions. This mechanistic variability suggests that no singular theoretical framework can comprehensively account for the intrinsic damage mechanisms observed in practical scenarios. This study employs a multidisciplinary theoretical framework to elucidate the observed phenomena. The experimental protocol initiated with forced water saturation of red sandstone specimens followed by FTC testing. During the freezing phase, phase transition of interstitial water from liquid to solid state propagated inward from specimen surfaces. This cryogenic phase transformation generated expansive forces through ice crystallization, resulting in nucleation and propagation of microstructural defects. Concomitantly, terminal regions of pre-existing micropores exhibited hydraulic fracturing characteristics (Jia et al., 2016), a phenomenon attributed to elevated hydraulic pressures within confined microstructural spaces caused by differential phase transformation rates between peripheral ice layers and internal aqueous phases. The thawing phase induces phase transformation from ice to aqueous phase, while residual deformation space generated by cryogenic expansion remains irrecoverable, resulting in permanent structural deterioration. Experimental investigations have demonstrated (Qiao et al., 2020) that ice-phase ablation within fissures triggers abrupt volumetric contraction of pore fillings, producing pronounced hydraulic rebound effects in fractured rock masses. Notably, the resultant expansion forces during this phase significantly exceed those generated during the freezing process. Furthermore, the water-ice phase transition exhibits non-uniform propagation velocity and intensity across specimen cross-sections under varying FTC durations. This spatial-temporal heterogeneity in phase transformation kinetics leads to progressive amplification of damage differentials in red sandstone through successive FTC iterations. Consequently, specimens undergoing extended-duration FTC regimens exhibit premature bearing capacity degradation compared to those subjected to shorter FTC exposures, attributable to accelerated cyclic stress accumulation mechanisms.
Contemporary analysis of geotechnical challenges in southern China reveals a prevailing tendency within conventional analytical paradigms to predominantly attribute rock engineering failures to pluvial climatic conditions (Yang et al., 2016). This perspective notably overlooks the widespread distribution of short time frozen ground within the region, as quantitatively delineated in Figure 2. The 2008 cryogenic disaster exemplifies this oversight, where sustained cryogenic precipitation events precipitated widespread geological instabilities across southern provinces. Significantly, critical infrastructure projects such as the South-North Water Transfer Scheme encounter multifaceted engineering challenges including: altered mechanical behavior of argillaceous formations; stability optimization of expansive rock canal slopes; bearing capacity degradation in alluvial foundations; and subsidence management in mining-affected corridors (Zhou et al., 2002). These geotechnical systems remain vulnerable to cyclic freeze-thaw actions of varying durations, particularly given the project’s trans-regional climatic exposure. Furthermore, operational parameters such as soft rock slope reinforcement efficacy and structural integrity of fluvial crossings demonstrate particular sensitivity to FTC-induced material deterioration. These case studies collectively underscore the critical need for differentiated assessment of FTC-induced geotechnical risks based on temporal phase-transition characteristics.
7 Conclusion
(1) With the increase of FTCs, the longitudinal wave velocity, peak stress, and elastic modulus of red sandstone had different degrees of reduction. The reduction rate of red sandstone after freezing and thawing for 2 h was higher than that of red sandstone after freezing and thawing for 1 h. An increased porosity was observed in specimens with extended freeze–thaw exposure.
(2) During the failure process of red sandstone, the AE ib value showed a change rule of “rise–fall–rise–sudden drop” as a whole. The sudden drop of AE ib value can be used as a precursor to the instability and failure of red sandstone after freeze–thaw. Moreover, the maximum value in the rising stage, the minimum value in the falling stage, and the maximum value in the rising stage were was ib1, ib2, and ib3, respectively. All values decreased with the increase in the number of FTCs. Moreover, with increasing FTCs, the reductions got smaller with every stage. Under the same number of FTCs, AE ib1, ib2, and ib3 of red sandstone frozen and thawed for 2 h were greater than those of red sandstone frozen and thawed for 1 h.
(3) The AE counts rate of red sandstone after freezing and thawing in the process of uniaxial compression failure can be divided into the quiet, growth, and steep increase stages. With the increase of FTC times and FTC time, the proportion of AE counts rate in the cumulative AE counts rate increased exponentially, and the growth rate of red sand-stone frozen and thawed for 1 h was higher than that of red sandstone frozen and thawed for 2 h.
(4) With the increase of FTCs, the proportion of shear mode in the internal crack type of red sandstone increased gradually and the proportion of tensile mode decreased gradually. However, the crack of tensile mode still dominated. Under the same number of FTCs, the longer was the FTC time, the faster was the crack type change.
(5) Red sandstone is a brittle and brittle–ductile failure at 0–40 FTCs. With the increase of FTCs and FTC test time, the failure type gradually changed from brittle to brittle–ductile failure. The damage variable shows either sudden or gradual changes, and the damage variable value increased with the increase of FTC times and FTC time.
Data availability statement
The raw data supporting the conclusions of this article will be made available by the authors, without undue reservation.
Author contributions
PZ: Conceptualization, Project administration, Resources, Supervision, Validation, Writing – review and editing. YR: Conceptualization, Formal Analysis, Methodology, Project administration, Validation, Visualization, Writing – original draft. KZ: Supervision, Writing – review and editing. XY: Investigation, Methodology, Writing – review and editing. ZH: Methodology, Supervision, Writing – review and editing. YL: Data curation, Visualization, Writing – review and editing. LX: Conceptualization, Supervision, Writing – review and editing. CG: Investigation, Writing – review and editing.
Funding
The author(s) declare that financial support was received for the research and/or publication of this article. This work was supported by the National Natural Science Foundation of China (No. 52464007; No. 52164004; No. 52104086; No. 52304085), and the China Postdoctoral Science Foundation (No. 2024T170672).
Acknowledgments
Special thanks to Shiyun Liu, and Quankun Xie for their help during the experiment.
Conflict of interest
The authors declare that the research was conducted in the absence of any commercial or financial relationships that could be construed as a potential conflict of interest.
Generative AI statement
The author(s) declare that no Generative AI was used in the creation of this manuscript.
Publisher’s note
All claims expressed in this article are solely those of the authors and do not necessarily represent those of their affiliated organizations, or those of the publisher, the editors and the reviewers. Any product that may be evaluated in this article, or claim that may be made by its manufacturer, is not guaranteed or endorsed by the publisher.
References
An, D. C., Zhang, S., Zhang, X. L., Yu, B. X., and Wang, H. Y. (2021). Experimental study on incubation and acoustic emission characteristics of rock fracture process zones. Chin. J. Rock Mech. Eng. 40 (02), 290–301. doi:10.13722/j.cnki.jrme.2020.0752
Chen, Z. G., Zhang, G. Y., He, R., Tian, Z. S., Fu, C. Q., and Jin, X. yu. (2023). Acoustic emission analysis of crack type identification of corroded concrete columns under eccentric loading: a comparative analysis of RA-AF method and Gaussian mixture model. Case Stud. Constr. Mater. 18, e02021–e05095. doi:10.1016/j.cscm.2023.e02021
Dong, L. J., Zhang, Y. H., Sun, D. Y., Chen, Y. C., and Tang, Z. (2022). Stage characteristics of acoustic emission and identification of unstable crack state for granite fractures. Chin. J. Rock Mech. Eng. 41 (01), 120–131. doi:10.13722/j.cnki.jrme.2021.0637
Fang, Y., Qiao, L., Chen, X., Yan, S. J., Zhai, G. L., and Liang, Y. W. (2017). Experimental study of freezing-thawing cycles on sandstone in yungang grottos. Rock Soil Mech. doi:10.16285/j.rsm.2014.09.003
Gong, C., Li, C. H., and Zhao, K. (2014). Experimental study on B-value characteristics of acoustic emission of cemented filling body under loading and unloading test. J. Min. and Saf. Eng. 31 (05), 788–794. doi:10.13545/j.issn1673-3363.2014.05.020
He, R., Tommy, N., and Lu, N. (2024). Unraveling microstructural evolution in air-entrained mortar and paste: insights from MIP and micro-CT tomography amid cyclic freezing-thawing damage. J. Build. Eng. 94, 2352–7102. doi:10.1016/j.jobe.2024.109922
Hou, C., Jin, X., He, J., and Li, H. (2022). Experimental studies on the pore structure and mechanical properties of anhydrite rock under freeze-thaw cycles. J. Rock Mech. Geotechnical Eng. 14, 781–797. doi:10.1016/j.jrmge.2021.10.005
Huang, C., Zhu, C., Ma, Y., and Aluthgun Hewage, S. (2022). Investigating mechanical behaviors of rocks under freeze–thaw cycles using discrete element method. Rock Mech. Rock Eng. 55, 7517–7534. doi:10.1007/s00603-022-03027-y
Jamshidi, A. (2021). Predicting the strength of granitic stones after freeze–thaw cycles: considering the petrographic characteristics and a new approach using petro-mechanical parameter. Rock Mech. Rock Eng. 54, 2829–2841. doi:10.1007/s00603-021-02458-3
Jia, C. J., Pang, R. F., Yu, J., Lei, M. F., and Li, Z. (2024). Investigation on freeze-thaw damage mechanism of porous rock with discrete element method. Rock Soil Mech. 45 (02), 588–600. doi:10.16285/j.rsm.2023.0230
Jia, G. L., Xiang, W., Tan, L., Zhang, W. L., Zeng, W., and Cao, S. (2016). Theoretical analysis and experimental verifications of frost damage mechanism of sandstone. Chin. J. Rock Mech. Eng. 35 (05), 879–895. doi:10.13722/j.cnki.jrme.2015.1300
Jia, P., Lu, J., Mao, S., Guo, Z., and Wang, Y. (2023a). Dynamic impact compression characteristics and damage mechanism of freeze-thaw sandstones with different saturation levels. Chin. J. Rock Mech. Eng. 42 (12), 2908–2918. doi:10.13722/j.cnki.jrme.2023.0242
Jia, P., Mao, S., Sun, Z., Qian, Y., and Lu, J. (2023b). Energy evolution and piecewise constitutive model of freeze-thaw damaged sandstone. J. Central South Univ. Sci. Technol. 54 (3), 908–919. doi:10.11817/j.issn.1672-7207.2023.03.010
Jin, J. J., Wang, D. G., Lu, J. G., Xu, P. C., and Li, J. H. (2024). Study on degradation of mechanical and apparent properties of slate under freeze-thaw cycles. J. Glaciol. Geocryol. 46 (4), 1301–1311. doi:10.7522/j.issn.1000-0240.2024.0103
Jung, D., Yu, W.-R., and Na, W. (2021). Investigation of ib-values for determining fracture modes in fiber-reinforced composite materials by acoustic emission. Materials 14 (13), 3641. doi:10.3390/ma14133641
Liu, H., Yang, G., Shen, Y., Ye, W., Xi, J., Jin, L., et al. (2023). CT visual quantitative characterization of meso-damage evolution of sandstone under freeze-thaw-loading synergistic effect. Chin. J. Rock Mech. Eng. 42 (05), 1136–1149. doi:10.13722/j.cnki.jrme.2022.0574
Liu, M. M., Ding, Y. N., Liu, Y., Zhang, Y. J., and Cheng, Y. G. (2025). Macro-mesoscopic correlation investigation on damage evolution of sandstone subjected to freeze–thaw cycles. Rock Mech. Rock Eng. 58, 887–903. doi:10.1007/s00603-024-04201-0
Liu, X. W., Lin, J. Z., and Yuan, Z. Y. (1997). Study on evaluation of material fatigue damage using acoustic emission technology. Chin. J. Appl. Mech. (04), 74–81.
Lv, S. Q., Zhu, J. B., Wang, B., and Zhu, Y. S. (2023). Study on macro-meso damage model of sandstone with open cracks under the coupling action of freeze-thaw and load. Chin. J. Rock Mech. Eng. 42 (5), 1124–1135. doi:10.13722/j.cnki.jrme.2022.0672
Meng, X., Zhang, H., Yuan, C., Li, Y., Chen, S., Chen, J., et al. (2024). Macro-meso physical and mechanical deterioration properties and damage prediction model of rock under freeze–thaw cycles. Bull. Eng. Geol. Environ. 83, 452. doi:10.1007/s10064-024-03948-8
Meng, Z. P., Zhang, P., Tian, Y. D., Wang, Y. H., Li, S. N., and Li, C. (2020). Experimental analysis of stress-strain, permeability and acoustic emission of coal reservoir under different confining pressures. J. China Coal Soc. 45 (7), 25442551. doi:10.13225/j.cnki.jccs.DZ20.0479
Nan, Z. T. (2024). Geocryological regionalization and classification map of the frozen soil in China (1:10,000,000). Natl. Cryosphore Pesort Oata Conter. doi:10.12072/ncdc.westdc.db3876.2023
Qiao, C., Li, C. H., Wang, Y., and Yan, B. Q. (2020). Experimental study on failure of central rock bridge under freeze-thaw cycle. Chin. J. Rock Mech. Eng. 39 (06), 1094–1103. doi:10.13722/j.cnki.jrme.2019.0982
Shen, Y. J., Yang, G. S., Rong, T. L., Liu, H., and Lv, W. Y. (2016). Proposed Scheme for freeze-thaw cycle tests on rock. Chin. J. Geotechnical Eng. doi:10.11779/CJGE201610005
Song, Y., Ma, H., Liu, J., Li, X., Zheng, J., Fu, H., et al. (2022). Experimental investigation on the damage characteristics of freeze-thaw limestone by the uniaxial compression and acoustic emission monitoring tests. Chin. J. Rock Mech. Eng. 41 (S1), 2603–2614. doi:10.13722/j.cnki.jrme.2021.0307
Song, Y. J., Cheng, K. Y., and Meng, F. D. (2023). Research on acoustic emission characteristics of fractured rock damage under freeze-thaw action. J. Min. and Saf. Eng. 8, 408–419. doi:10.13545/j.cnki.jmse.2022.0139
Song, Y. J., Sun, Y. W., Li, C. J., Yang, H. M., Zhang, L. T., and Xie, L.-J. (2023). Meso-fracture evolution characteristics of freeze-thawed sandstone based on discrete element method simulation. Rock Soil Mech. 44 (12), 3602–3616. doi:10.16285/j.rsm.2023.0448
Sun, K., Jia, J., Pan, B., Wang, J., and Liu, G. (2024). Freeze-thaw deterioration mechanism and damage constitutive model of tunnel surrounding rock in cold region based on pore evolution. Tunn. Undergr. Space Technol. 37 (11), 52–63. doi:10.19721/j.cnki.1001-7372.2024.11.004
Wang, C. S., Zhou, H. W., Wang, R., Wang, Z. H., He, S. S., and Liu, J.-F. (2019). Failure characteristics of beishan granite under unloading confining pressures. Chin. J. Geotechnical Eng. 41 (2), 329–336. doi:10.11779/CJGE201902011
Wang, X. R., Li, N., Wang, E. Y., and Liu, X. F. (2020). Microcracking mechanisms of sandstone from acoustic emission source inversion. Chin. J. Geophys. 63 (7), 2627–2643. doi:10.6038/cjg2020N0315
Wu, J. Y., Wong, H. S., Zhang, H., Yin, Q., Jing, H. W., and Ma, D. (2024). Improvement of cemented rockfill by premixing low-alkalinity activator and fly ash for recycling gangue and partially replacing cement. Cem. Concr. Compos. 145, 105345–109465. doi:10.1016/j.cemconcomp.2023.105345
Wu, J. Y., Yang, S., Williamson, M., Wong, H. S., Bhudia, T., Pu, H., et al. (2025). Microscopic mechanism of cellulose nanofibers modified cemented gangue backfill materials. Adv. Compos. Hybrid. Mater 8, 177. doi:10.1007/s42114-025-01270-9
Wu, X. Z., Liu, J. W., Liu, X. X., Zhao, K., and Zhang, Y. B. (2015). Study on the coupled relationship between AE accumulative ring-down count and damage constitutive model of rock. J. Min. and Saf. Eng. 32 (01), 28–34+41. doi:10.13545/j.cnki.jmse.2015.01.005
Yang, D. H., Zhao, Y. X., Teng, T., Zhang, C., and Yang, J. H. (2021). Critical characteristics of acoustic emission and kaiser point identification during sandstone fracture instability. J. BASIC Sci. Eng. 29 (01), 218–230. doi:10.16058/j.issn.1005-0930.2021.01.019
Yang, M. H., Zhao, M. H., and Cao, W. G. (2005). Determination method of parameters for statistical damage-softening constitutive model of rock. SHUILI XUEBAO 36 (3), 345–349. doi:10.13243/j.cnki.slxb.2005.03.015
Yang, S. Q., Zhang, P. C., Teng, S. Y., Tian, W. L., and Huang, Y. H. (2021). Experimental study of tensile strength and crack evolution characteristics of Brazilian discs containing three pre-existing fissures. Journal of China University of Mining and Technology. doi:10.13247/j.cnki.jcumt.001234
Yang, X., Zhou, C. Y., Liu, Z., Su, D. L., and Du, Z. H. (2016). Model tests for failure mechanism of typical soft rock slopes of red beds under rainfall in South China. Chin. J. Rock Mech. Eng. 35 (03), 549–557. doi:10.13722/j.cnki.jrme.2015.0371
Yu, L. Q., Yao, Q. L., Xu, Q., Wang, W. N., Niu, Z. J., Liu, W. D., et al. (2021). Experimental and numerical simulation study on crack propagation of fractured fine sandstone under the influence of loading rate. J. China Coal Soc. 46 (11), 3488–3501. doi:10.13225/j.cnki.jccs.2020.1529
Zeng, P., Cao, W., Zhao, K., Gong, C., Song, L., Liu, G. Z., et al. (2024). Strength evolution and acoustic emission characteristics of cemented tailings backfill mixed with mineral processing wastewater. J. China Coal Soc. 49 (S1), 167–181. doi:10.13225/j.cnki.jccs.2023.0498
Zhang, G. K., Li, H. B., Wang, M. Y., Li, J., and Deng, S. X. (2019). Comparative study on damage characterization and damage evolution of rock under uniaxial compression. Chin. J. Geotechnical Eng. 41 (6), 1074–1082. doi:10.11779/CJGE201906011
Zhang, H. M., and Wang, Y. F. (2022). Multi-scale analysis of damage evolution of freezing-thawing red sandstones. Rock Soil Mech. 43 (08), 2103–2114. doi:10.16285/j.rsm.2021.1726
Zhang, Y. B., Sun, L., Yao, X. L., Liang, P., Tian, B. Z., Liu, X. X., et al. (2020). Experimental study of time-frequency characteristics of acoustic emission key signals during granite fracture. Rock Soil Mech. 41 (01), 157–165. doi:10.16285/j.rsm.2018.1411
Zhao, K., Xie, W. J., Zeng, P., Gong, C., Zhuo, Y. l., Yu, X. J., et al. (2020). Experimental study on AE characteristics of cemented tailings backfill failure process with different concentration. J. Appl. Acoust. 39 (04), 543–549. doi:10.11684/j.issn.1000-310X.2020.04.007
Zhou, H. M., Cai, B., and Zhang, Q. H. (2002). Rock mechanics and engineering problems of the main canal of the South-to-North Water diversion project. J. Changjiang River Sci. Res. Inst. 1001-5485 (S1), 114–116+122.
Zhu, T., Li, A., Huang, D., Zong, X., and Ma, F. (2023). Deformation and damage characteristics of sandstone under the combined action of stress and freeze-thaw cycles. Chin. J. Rock Mech. Eng. 42 (02), 342–351. doi:10.13722/j.cnki.jrme.2022.0217
Keywords: rock Mechanics, freeze-thaw cycle, acoustic emission (AE), damage, mechanical properties
Citation: Zeng P, Ren Y, Zhao K, Yang X, Huang Z, Li Y, Xiong L and Gong C (2025) Experimental investigation on the damage mechanical proper-ties of red sandstone under freeze-thaw cycles. Front. Mater. 12:1604521. doi: 10.3389/fmats.2025.1604521
Received: 02 April 2025; Accepted: 29 April 2025;
Published: 30 May 2025.
Edited by:
Jiangyu Wu, China University of Mining and Technology, ChinaReviewed by:
Chuanqing Fu, Zhejiang University of Technology, ChinaJishi Geng, Xi’an University of Science and Technology, China
Jianjun Hu, Shenzhen University, China
Copyright © 2025 Zeng, Ren, Zhao, Yang, Huang, Li, Xiong and Gong. This is an open-access article distributed under the terms of the Creative Commons Attribution License (CC BY). The use, distribution or reproduction in other forums is permitted, provided the original author(s) and the copyright owner(s) are credited and that the original publication in this journal is cited, in accordance with accepted academic practice. No use, distribution or reproduction is permitted which does not comply with these terms.
*Correspondence: Kui Zhao, eWdsbV96a0AxNjMuY29t