 I. Simonovski
 K.-F. Nilsson1
- 1European Commission DG-JRC, JRC Directorate G – Nuclear Safety and Security G.I.4 Reactor Safety and Components, Petten, Netherlands
- 2SCK CEN, Belgian Nuclear Research Centre, NET – Nuclear Energy Technology, FMA - Fuel Materials, Mol, Belgium
Additive manufacturing represents a cutting-edge technology that offers significant reductions in both manufacturing time and cost. However, any new technology or material must go through a qualification process before it can be used in the nuclear industry. This article reports on a pre-qualification process of 316L stainless steel manufactured using the laser powder bed fusion (LPBF) additive manufacturing process. The study compares LPBF 316L, aged, and non-aged materials from two different manufacturers. A small punch creep test campaign at 650 °C was performed at different loads. These tests are particularly advantageous because they require only a small amount of material, making them ideal when material availability is limited. Additionally, standard uniaxial creep tests were performed at the same temperature for comparative reference. A good correlation for the time to rupture–equivalent stress between the two test types was observed, with the equivalent stress calculated using the Small Punch Test EN 10371:2021 standard. A significant finding is that the small punch creep deflection rate curves for LPBF-manufactured 316L exhibit multiple minima, unlike the single minimum observed in forged 316L. This is believed to result from micro-cracking and has important implications for determining the equivalent stress creep properties, which are based on the single minimum value in the EN 10371:2021 standard. The multiple minima finding suggests that the approach used to determine equivalent stress and strain rate in small punch creep tests in the EN 10371:2021 standard must be re-evaluated to accommodate this complexity.
1 Introduction
Additive manufacturing (AM) represents a cutting-edge technology that potentially offers significant reductions in both manufacturing time and cost. Due to completely different principles of manufacturing, both the AM feed stock material and build process must be qualified, especially for application in the nuclear industry. The Procedure for the Acquisition of New Material Data (PTAN) of the RCC-MRx code for design and construction rules (AFCEN, 2017) and Section 3, Division 5 of ASME Boiler and Pressure Vessel Code (BPVC) (ASME, 2013) are two examples of procedures for the qualification of new materials. The qualification process includes defining a material property file, which, among others, includes physical and material properties from a wide range of tests and laboratories to establish material confidence limits in view of variation of properties. These can be due to material taken from a thick or thin plate, heat-to-heat variability, different cooling rates from AM melt, and later reheating by following passes of the heat source, etc.
The EU-funded research project NUclear COmponents Based on Additive Manufacturing (NUCOBAM) recently ended (2020–2024) (NUCOBAM, 2024). It examined the qualification of AM 316L stainless steel to demonstrate the compatibility of AM 316L in a light water reactor (LWR)-irradiated environment (Konstantinović et al., 2025). A more comprehensive program is currently being considered in ASME (Messner, 2023). In this work, laser powder bed fusion (LPBF) was used because no excessive ferrite phase builds up during rapid cooling.
The nuclear community (scientists, reactor designs, and regulators) is currently debating whether traditional material qualification tests, which assume that material properties derived from standard tests reduce uncertainty through extensive testing, are sufficient or if component-level tests are necessary (Messner, 2023; Torres and Gordon, 2021; Lalé and Viguier, 2024; ASM Handbook, 2017). In NUCOBAM, the process involved qualification of 316L feedstock powder first, followed by qualification of the AM build process and platforms, and qualification of the AM build material through a number of mechanical tests. Finally, a valve body and debris filter were manufactured for component testing. In this work, we focus on the recently standardized (EN, ASME, and RCC-MRx) small punch test (CEN EN, 2024; ASTM, 2024; RCC-MRx, 2022). This test uses small disks for test pieces (8 mm diameter, 0.5 ± 0.005 mm thickness), which is a crucial advantage when only a small amount of test material is available (Figure 1). Specifically, the small punch creep (SPC) tests were carried out to estimate creep properties, followed by validating these properties by performing a small number of standard uniaxial creep (UC) tests.
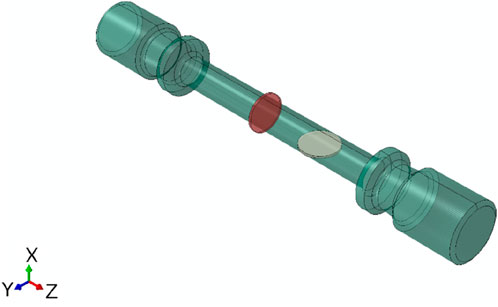
Figure 1. Uniaxial creep test piece (green) in relation to the small punch test piece given in two orientations (red and grey). The LPBF build direction is the Z-axis.
The article is structured as follows. We first describe the feedstock material, followed by a description of the methods used. Next, we discuss the specificities of the analysis of the SPC test results of AM 316L material and the transferability of these results to UC. Conclusions are given at the end.
2 Materials
A 316L stainless steel feedstock powder was used to manufacture bars for material tests using the laser powder bed fusion (LPBF) additive manufacturing process in accordance with the ASTM F3184 (ASTM F3184-16 Standard Specification for Additive Manufacturing Stainless Steel Alloy, 2024). The basis for the feedstock powder chemical composition requirements was taken from ASTM F3184, with additional requirements imposed for the weight % of N, O, Cu, Co, Ta, B, and Cu. The chemical composition of the feedstock powder is comparable to the 316L(N) forged plate but lower in the C (0.02 vs. 0.024) and Mn (0.8 vs 1.794) content and higher in Si (1 vs. 0.689). Table 1 provides the chemical composition, while the measured particle size distribution is given in Table 2.
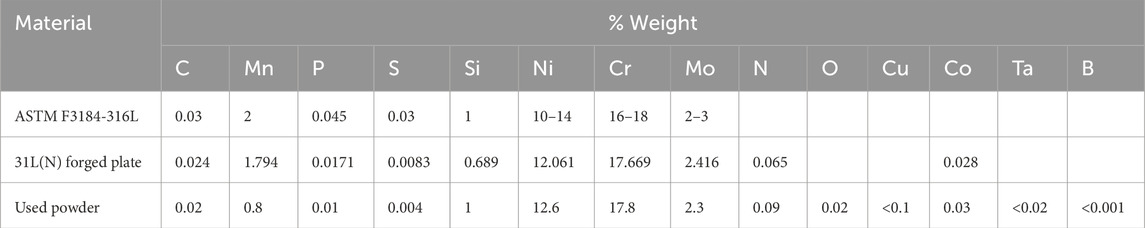
Table 1. Chemical composition of powder feedstock 316L stainless steel.

Table 2. Measured size properties of powder feedstock 316L stainless steel.
The powder feedstock was then used to manufacture bars on a build platform (Figure 2). In this article, we use bars manufactured using a Renishaw AM250 single laser machine at the Advanced Manufacturing Centre (AMRC), University of Sheffield, and Commissariat à l'énergie atomique et aux énergies alternatives (CEA), using an SLM Solutions SLM280HL single laser, both using argon as an inert gas. The bars used in this work are in the as-built z-direction, protruding out of the build platform, as shown in Figure 2.
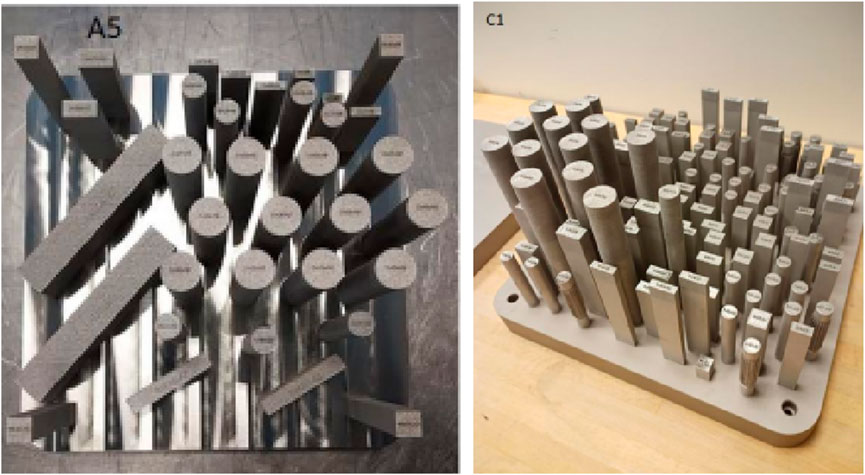
Figure 2. Build platforms: AMRC (left) and CEA (right).
A heat treatment consisting of soaking at 1,066 ± 14 °C with a holding time of 1 h 15 min ±15 min was applied to the AMRC build platform, while for the CEA, the bars were cut from the build platform prior to application of the same thermal treatment. The holding time counter initiated when a lower temperature limit, 1052 °C = 1066 °C–14 °C, was attained. An argon atmosphere was used, with the prescribed heating rate of 4 °C/min and a cooling rate of at least 10 °C/min. We refer to this heat treatment as HT2 to distinguish it from other heat treatments applied within NUCOBAM.
In addition to HT2, some bars were aged for 10,000 h at 450 °C. The following combinations of materials were used in the current article: a) AMRC, HT2; b) AMRC, HT2 aged; and c) CEA, HT2, aged. To simplify labeling, these will be referred to as AMRC NA (not aged), AMRC Aged, and CEA Aged. These materials were then used to manufacture all small punch and uniaxial creep test pieces.
Four bars from the internal AMRC qualification process were used for three UC tests (at initial stress of 250 MPa, 270 MPa, and 290 MPa) due to an insufficient amount of originally shipped material. The heat treatment of these bars was performed at the JRC, following the same HT2 procedure.
3 Methods
3.1 Small punch creep tests
A two-stage approach was taken for estimating creep properties. In the first stage, a small punch creep (SPC) test campaign was performed at 650 °C. The SPC test involves pressing a 2.5-mm-diameter punch (a high precision silicon nitride Si3N4 bearing ball) into a test piece at a constant force (Figure 3). The test piece is a disk with a diameter of 8 mm and a thickness of 0.5 ± 0.005 mm. The test piece is clamped between the upper and lower dies. The lower die has a 4-mm-diameter receiving hole with a 0.2 mm/45° chamfer. The deflection of the test piece is measured from below the test piece with a ceramic rod touching the test piece and extending to a linear variable differential transformer (LVDT) gauge. The LVDT has a negligible spring counter force. The result of an SPC test is a deflection versus time curve, resulting in a given time to rupture, tr.
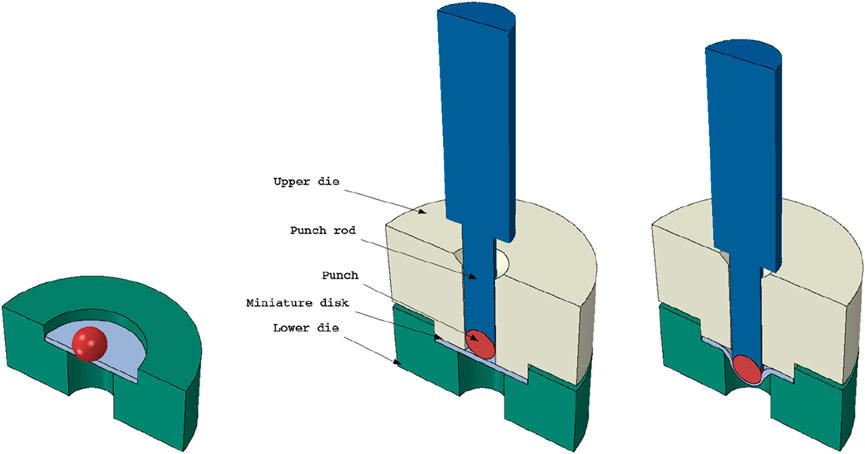
Figure 3. Illustration of the small punch test.
Small punch creep (SPC) tests were done at 650 °C with the test piece in an argon environment to prevent test piece corrosion. Force levels from 240 N to 500 N were used by the application of dead weights. The test matrix is given in Table 3. This test matrix was then used to estimate the equivalent load conditions of uniaxial creep tests as described below.
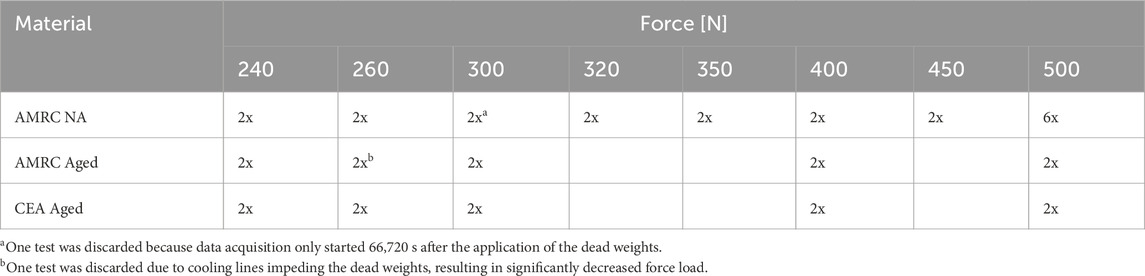
Table 3. SPC test matrix at 650 °C.
From the SPC deflection versus time curve, one can estimate the equivalent initial stress,
In Equation 1, F stands for the force applied in the SPC test, and
3.1.1 Estimation of equivalent stress
Accurate deflection measurements and estimation of deflection rate are essential for calculating equivalent stress, Equation 1, and creep assessment in general. Temperature control precision, susceptibility of the laboratory environment to external vibrations, and systematic noise are only a few of the influencing parameters. A typical recorded deflection during an SPC test in our laboratory is given in Figure 4. A sampling rate of 1 Hz is used to capture the initial load application. Because our data acquisition software can only sample at a constant rate, a 1 Hz sampling rate is maintained for the duration of the test.
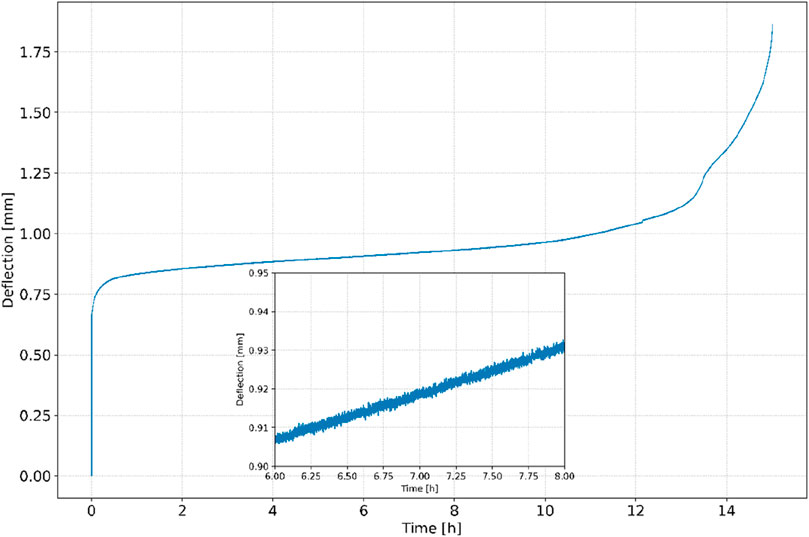
Figure 4. A typical deflection in an SPC test. Insert: zoom in on the measured deflection (noise).
The deflection signal contains approximately ±1 to ±2 µm noise (Figure 4 insert). It is well known that differentiating a signal increases the noise. It is clear that such a signal cannot be used for evaluating equivalent stress, Equation 1, where the deflection at a minimum deflection rate must be identified.
We tackle the issue by first down sampling the deflection signal to 214 = 16,384 points using a linear interpolation. This significantly reduces the number of points for processing the signal, decreasing computational time for noise filtering and calculation of deflection rate. A large number of points can result in a prohibitively large amount of required memory. A larger number of points can be used for longer experiments. In the second step, we deal with the noise. One way is to split the signal into segments and calculate the linear regression line for each segment. We investigated the impact of 50, 100, 200, and 300 segments. Using 200 segments was determined to be the optimal number in terms of minimizing noise while still retaining sufficient local detail (important for, e.g., determining the crack initiation). The deflection rate is then the inclination of the regression line. This decreases noise in the calculated deflection rate, but significant local peaks remain; see the black solid line in Figure 5. If a Whittaker noise filter (Eilers, 2003) is applied prior to calculating the regression lines, the noise in the calculated deflection rate improves further. However, there are still a number of local variations; see the red solid line in Figure 5. We also tried several methods for calculating a derivative, available in the Python “derivative” library. The best performing method was using a “spline” derivative; see the solid green line in Figure 5. The combination of a Whittaker noise filter and the spline derivative method consistently resulted in very good noise removal, preservation of significant local variations in the deflection curve (see the red circle), and few artificial peaks in the calculated deflection rate. This combination is therefore used in all further results in this article.
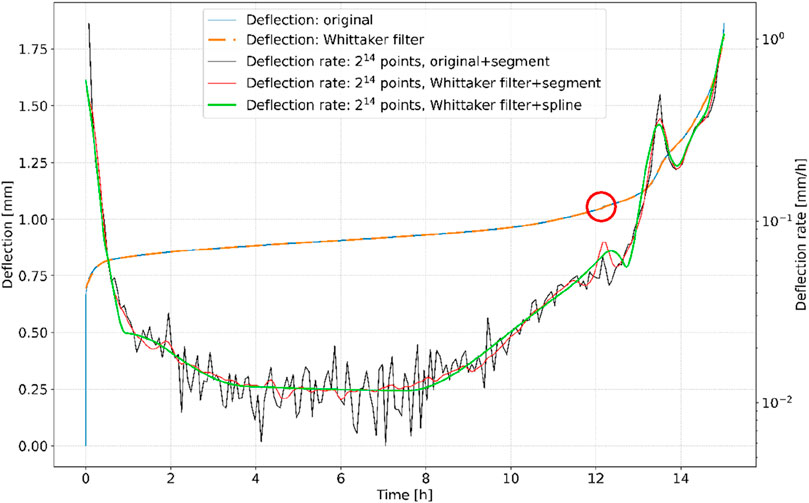
Figure 5. Deflection rate calculation methods.
3.2 Uniaxial creep tests
In the second stage, reference uniaxial creep tests were performed at 650 °C. The equivalent stress
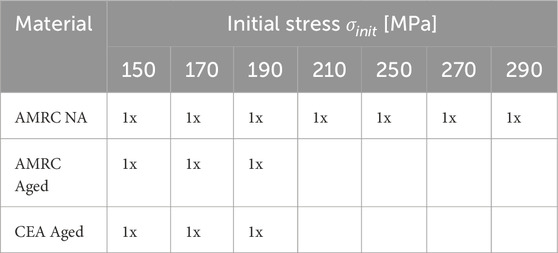
Table 4. UC test matrix at 650 °C.
4 Results and discussion
Figure 6 shows the SPC initial deflections, u0, defined as a deflection 5 s after the application of the full force load. These deflections are the result of an elastic–plastic response of a test piece. Because the calculation of the equivalent stress
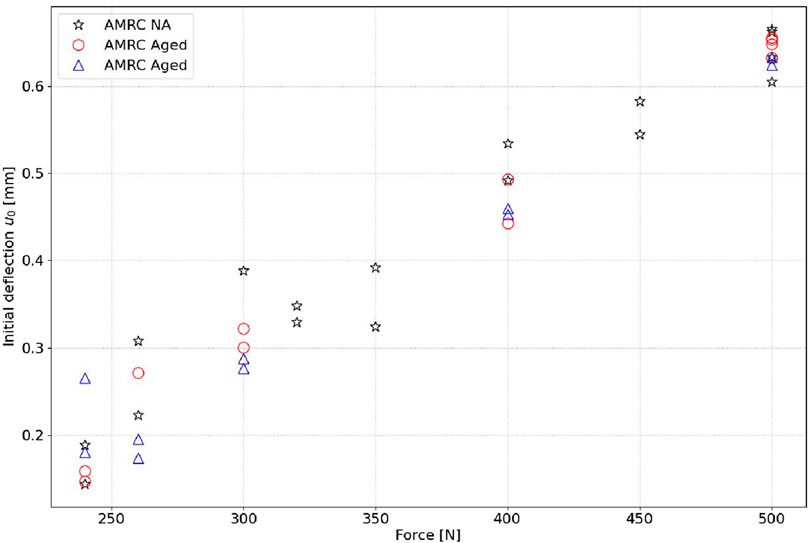
Figure 6. Measured initial elastic–plastic deflection u0.
Figures 7–14 show measured deflections during SPC tests at load rates from 500 N to 240 N (Jorge and Myriam, 2025). The symbols indicate the time at which the minimum deflection rate was estimated, using the procedure described above. In general, the aged material exhibits shorter creep life. In addition, the minimum deflection rate occurs earlier for the aged material; see Table 5. The exception is the AMRC NA FK-13 test at 260 N, where the minimum deflection rate occurs earlier than in both CEA Aged tests (GB-08, GB-09). In general, the CEA Aged creep lives are somewhat shorter than AMRC Aged lives at loads from 500 N to 300 N. At 260 N and 240 N loads, there is no significant difference between the two.
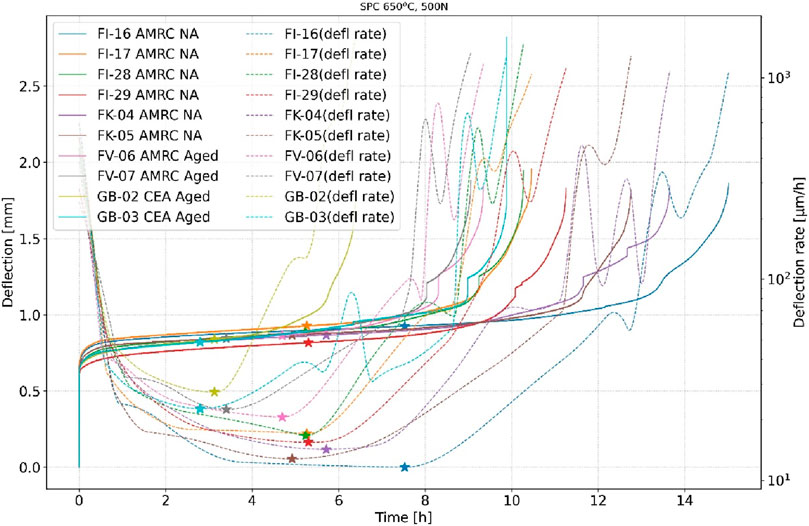
Figure 7. Measured deflection and calculated deflection rates at the 500 N load level.
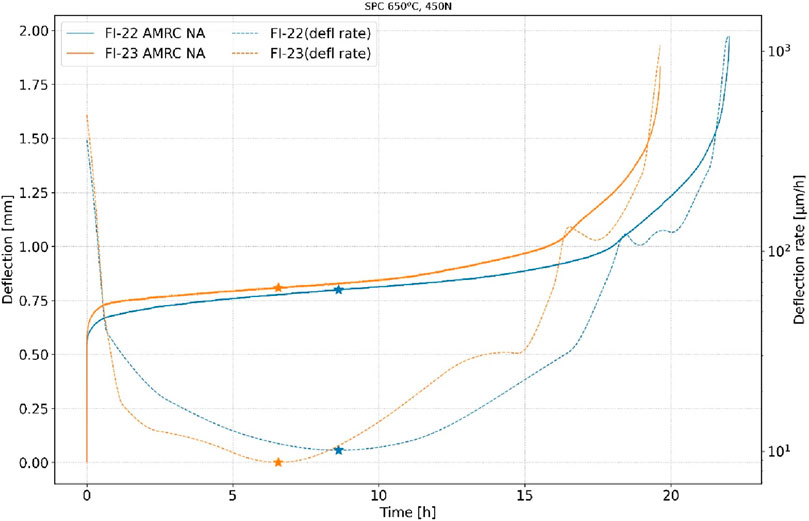
Figure 8. Measured deflection and calculated deflection rates at the 450 N load level.
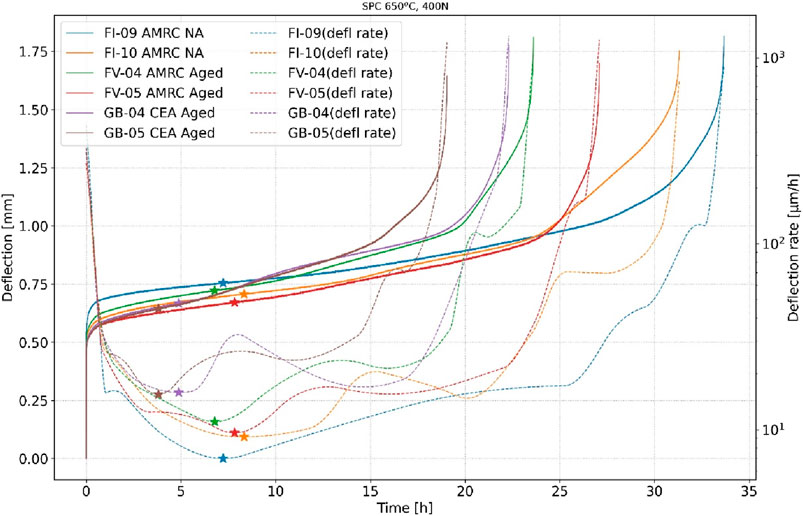
Figure 9. Measured deflection and calculated deflection rates at the 400 N load level.
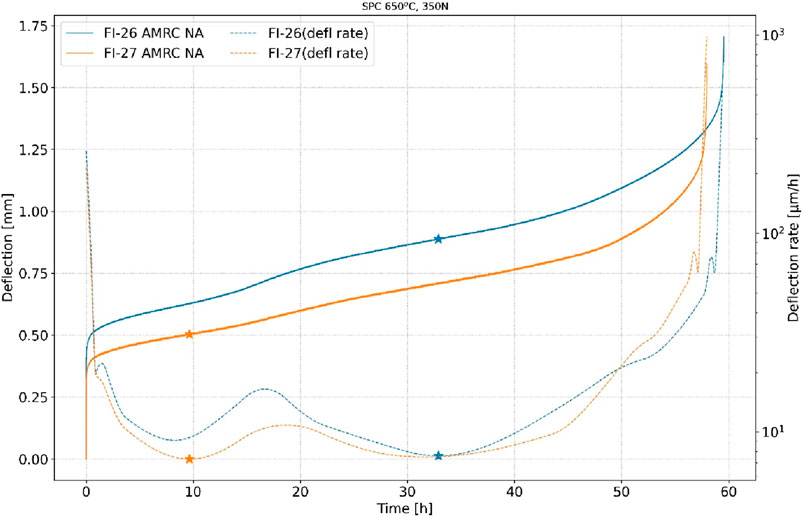
Figure 10. Measured deflection and calculated deflection rates at the 350 N load level.
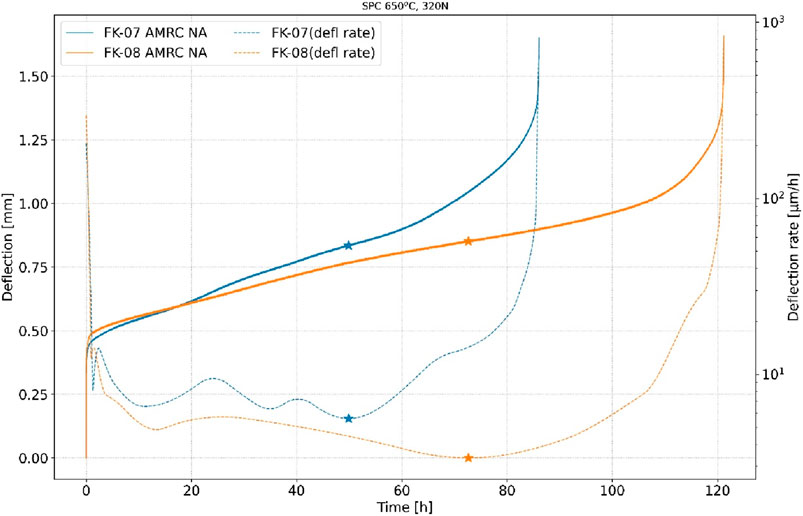
Figure 11. Measured deflection and calculated deflection rates at the 320 N load level.
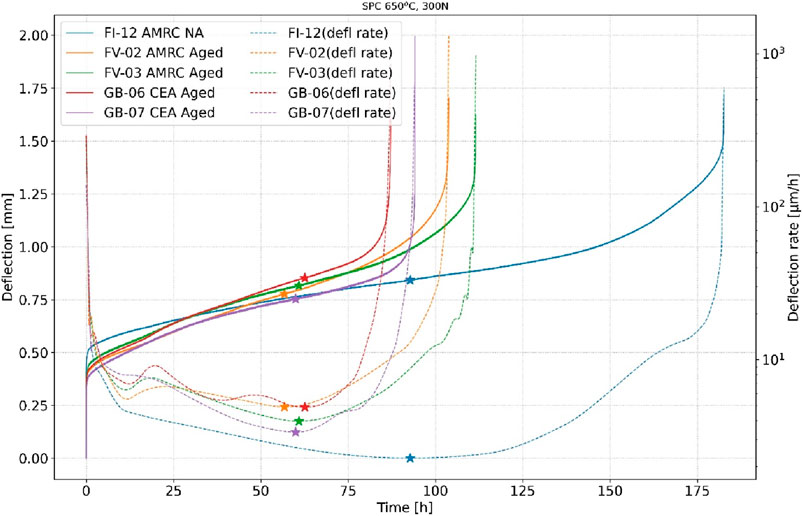
Figure 12. Measured deflection and calculated deflection rates at the 300 N load level.
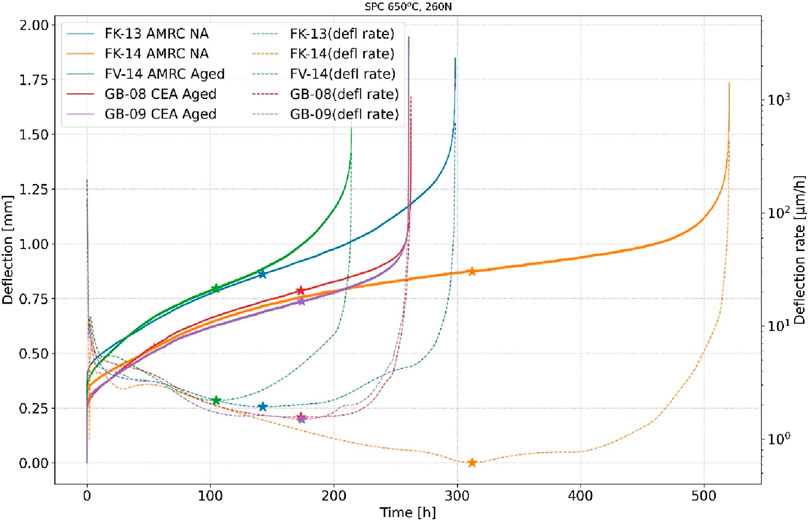
Figure 13. Measured deflection and calculated deflection rates at the 260 N load level.
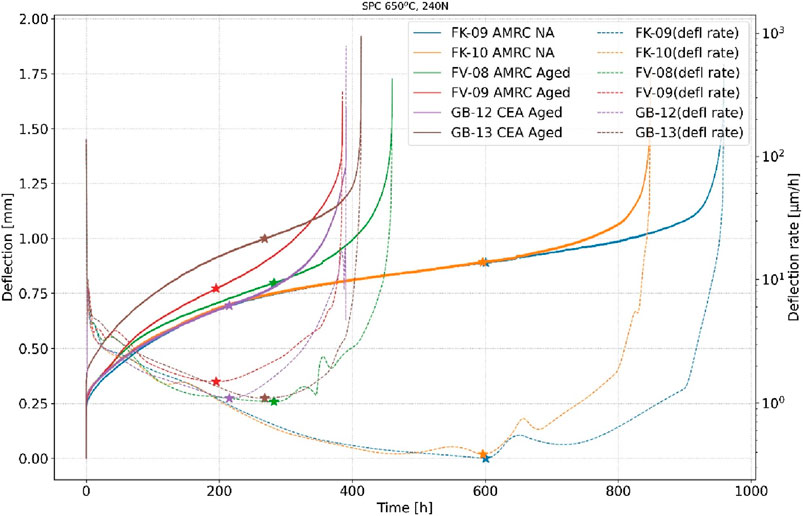
Figure 14. Measured deflection and calculated deflection rates at the 240 N load level.
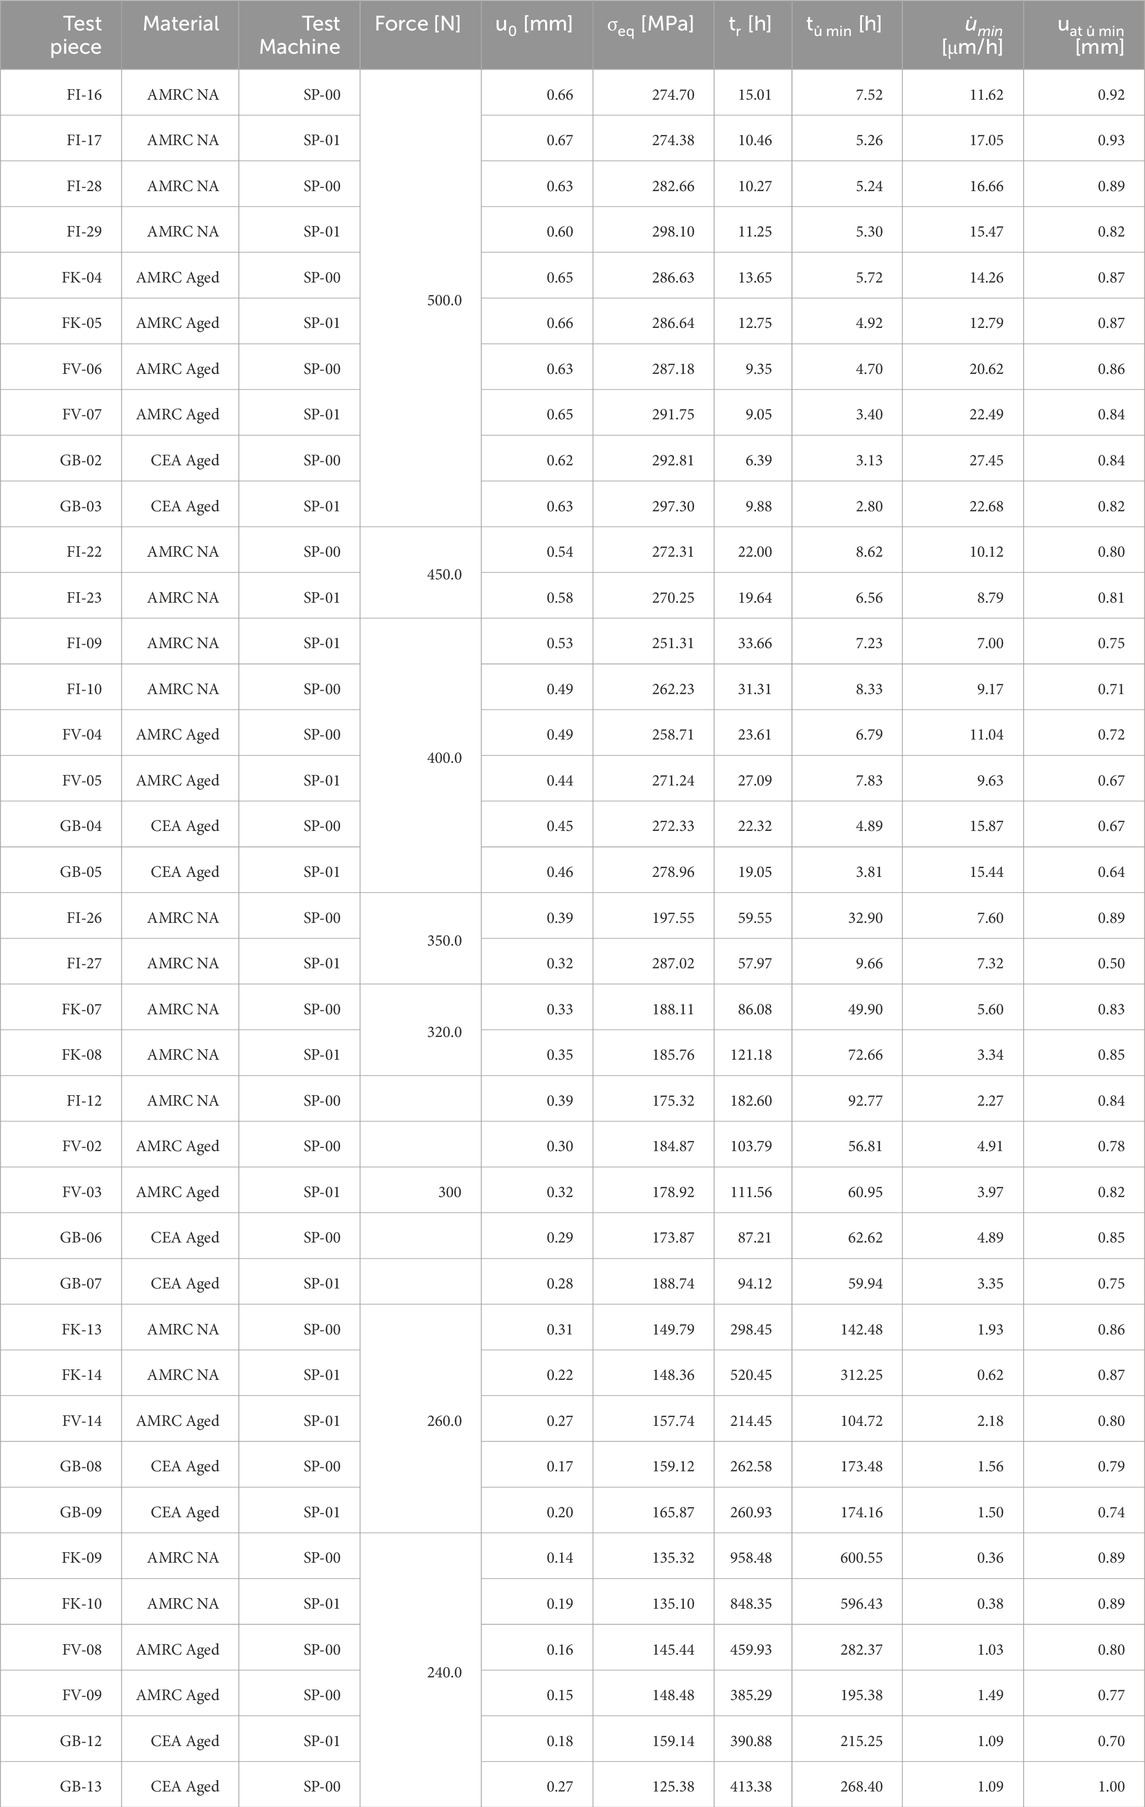
Table 5. SPC test results.
In Figure 9, we can see that all the deflection rate curves at 400 N force load exhibit two minima, with the first one having a significantly lower deflection rate than the second one. The two minima are even more apparent at decreased force load, 350 N, but are now almost evenly matched in terms of deflection rate. Calculation of the equivalent initial stress
Another question that emerges is what causes the first minimum. In this work, we conjecture that a significant crack develops and manifests in the first minimum. It is well known that the region of maximal stress/strain in small punch tests continuously moves radially outwards during the test. We therefore conjecture that if the material is ductile enough, the crack that results in the first minimum in the deflection rate curve arrests as the zone of maximal stress/strain redistributes radially outwards. At a certain point, a second crack initializes and starts to propagate, resulting in the second minimum, shortly before the rupture of the test piece. At the 240 N load, one can see a significant local increase in the deflection at approximately 0.9 mm for the FK-10 AMRC NA and FV-08 AMRC tests (the orange and green curves in Figure 14). We assume these sudden deflection increases are due to a final/secondary crack initialization. To evaluate these conjectures, we performed an interrupted SPC test with AMRC NA material. Because no more test pieces conformant with the strict 0.5 ± 0.005 mm requirement of the EN 10371:2021 were available, we used a test piece with a thickness of 0.4661 mm, labeled FI-07. The EN 10371:2021 standard provides a formula for estimating the ultimate tensile stress,
Based on the SPC tests at 350 N, we decided to interrupt the SPC test for the first time 12 h after application of the force load of 326 N. We defined the interruption as stopping the furnace heating by setting the target furnace temperature to 22 °C, triggering the cool down. During the cool-down, the force load remained at 326 N. Following the cool-down, we removed the dead weights, removed the test piece from the test machine, and performed a scanning electron microscope (SEM) analysis of the test piece. Two crack fronts are visible, as shown in Figures 15, 16. The first crack front with a diameter of 1.28 mm is fully developed after 12 h. The second front, with a diameter of 1.46 mm, has only started developing.
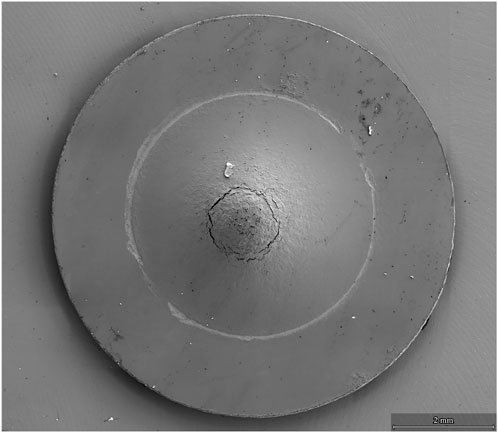
Figure 15. SPC interrupted test, FI-07 test piece, 326 N load level. Crack fronts 12 h after the start of the SPC test.
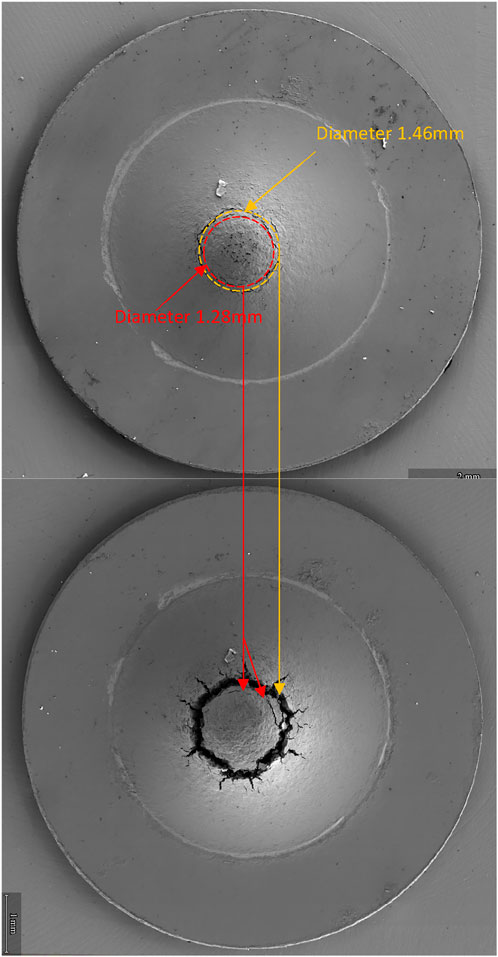
Figure 16. SPC interrupted test, FI-07 test piece, 326 N load level. Crack fronts 12 h (top) and 28 h 48 min (bottom) after the start of the SPC test.
Next, we put the FI-07 test piece back into the test machine, added the same dead weights to reapply a 326 N force load, and heated the test piece back to 650 °C. After reaching the target temperature, we waited for 16 h and 48 min (cumulative time 12 h + 16 h + 48 min) and then initiated the second interruption, using the same procedure as for the first interruption. A second SEM analysis was performed (see the lower part of Figure 16). The analysis showed the arrest of the first crack front and full development of the second, much larger crack front that only started forming after the first interruption. We did not continue the SPC tests beyond this point, 16 h and 48 min (cumulative time 12 h + 16 h + 48 min). The deflection versus time curve and the calculated deflection rates indeed show two minima (Figure 17), although these minima are less pronounced than the ones at 350 N (Figure 10). Nevertheless, this confirms our conjecture that cracks formed during the SPC test. More interrupted tests are required to confirm that crack initiation results in a local minimum in the deflection rate.
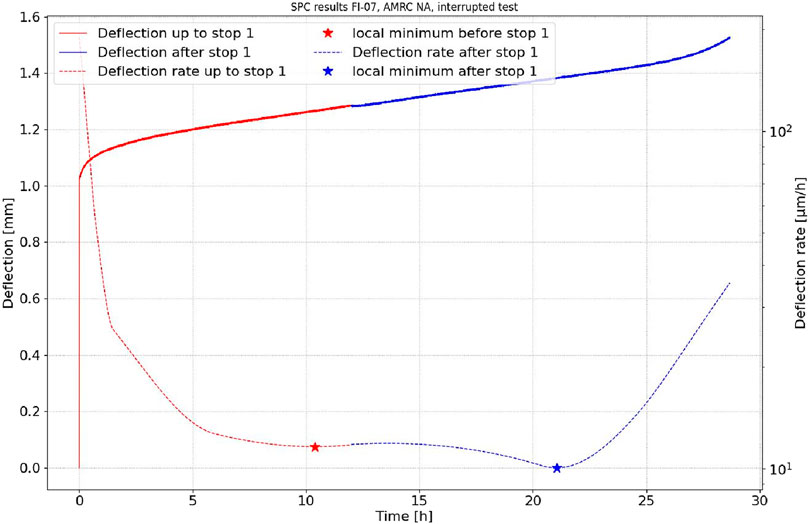
Figure 17. Interrupted AMRC NA test. Deflection was measured and deflection rates were calculated at the 326 N load level.
Figure 18 shows the time to rupture versus the applied force for the SPC test data for the three materials and the regression lines. This confirms again that the aged materials have consistently reduced creep life compared to the non-aged material.
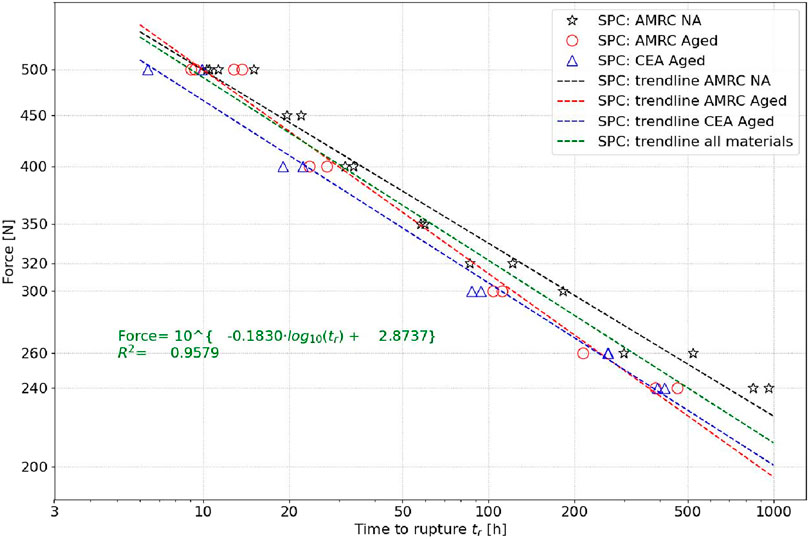
Figure 18. SPC: measured time to rupture versus force.
Nuclear design codes, and in particular evaluation of material properties, are primarily based on standard uniaxial tests. Uniaxial tests were conducted to assess the SPC test data and to assess the transferability. To this end, we calculated the equivalent stress
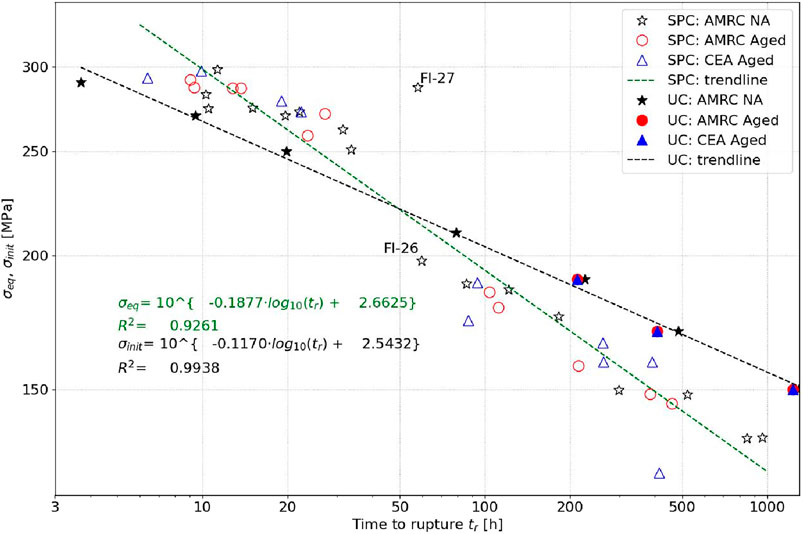
Figure 19. SPC and UC: measured time to rupture versus
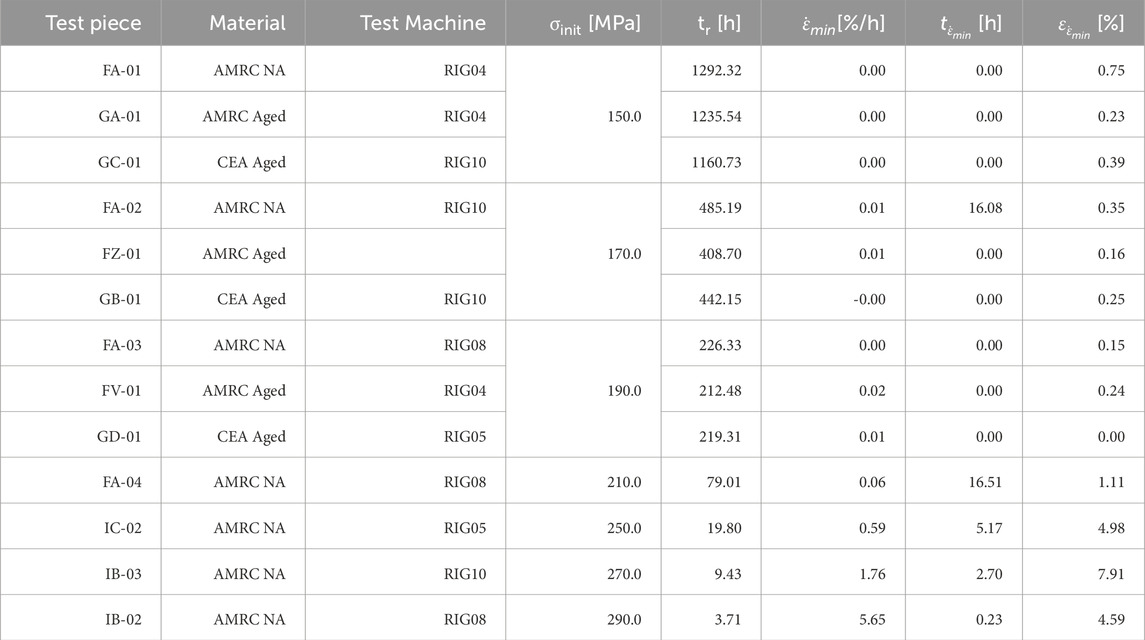
Table 6. UC test results.
We can observe that UC tests for the three materials overlap perfectly and are distributed along the regression line with an R2 = 0.9938, Figure 19. In contrast to SPC tests, there is practically no difference between the three materials in UC tests. Furthermore, the scatter in the UC results between three different materials is much smaller than in the SPC results. We can also see that the transferability of SPC results to UC, by evaluating
Several explanations are possible for the SPC trendline having a different slope than the UC trendline. First, Equation 1 is based on one minimum in the SPC deflection rate, whereas here, we can have two minima, as shown in Figure 10. In this work, we always select the one with the lowest deflection rate value to use in Equation 1. However, as shown in Figures 15–17, the first minimum is probably the one where the initial crack has already formed. If the second minimum is used, the measured deflection is not solely due to creep but is significantly affected by the crack propagation. Second, the orientation of the SPC test pieces in relation to the uniaxial test piece is the one shown in red in Figure 1. This was driven by the limited amount of material, as more disc slices for SPC test pieces can be extracted from a bar in the red orientation than in the gray SPC orientation. In the SPC test, most of the stress acts in the radial direction of the SPC test piece. With the red SPC test piece orientation, the red SPC test piece has stress perpendicular to the stress in the uniaxial test piece. We are therefore testing a different material direction in the SPC tests. In fact, we should have used the gray SPC test piece orientation, but as mentioned, this was not possible due to the limited amount of available material. The SPC test piece orientation in relation to the test build can have a significant impact on the time to rupture in LPBF. For Inconel 718, Zhang et al. (2025) report significantly shorter rupture times for the SPC test piece in the build direction (red color in Figure 1) compared to the one perpendicular to the build direction (gray color in Figure 1). In this case, only aged heat treatment was applied. However, when they applied the solution and aged heat treatments, the differences in rupture times decreased significantly. This behavior is at least in part driven by a different microstructure (Zhang et al., 2025) of the two directions. Third, and probably the most important, Equation 1 has been developed based on 97 UC tests and 159 SPC tests with both new and service-exposed materials, mainly low-alloy steels and 9Cr steels, such as 14MoV63, X20CrMoV121, P91, P92, Eurofer97, and stainless steel 316L (CEN EN, 2024). However, this data set had a large share of P92 steel. Equation 1 coefficients 1.916 and 0.6579 are probably not the best for AM 316L material.
4.1 Microstructural analysis
The fracture surfaces of AMRC NA, AMRC Aged, and CEA Aged UC test pieces, at a load level of
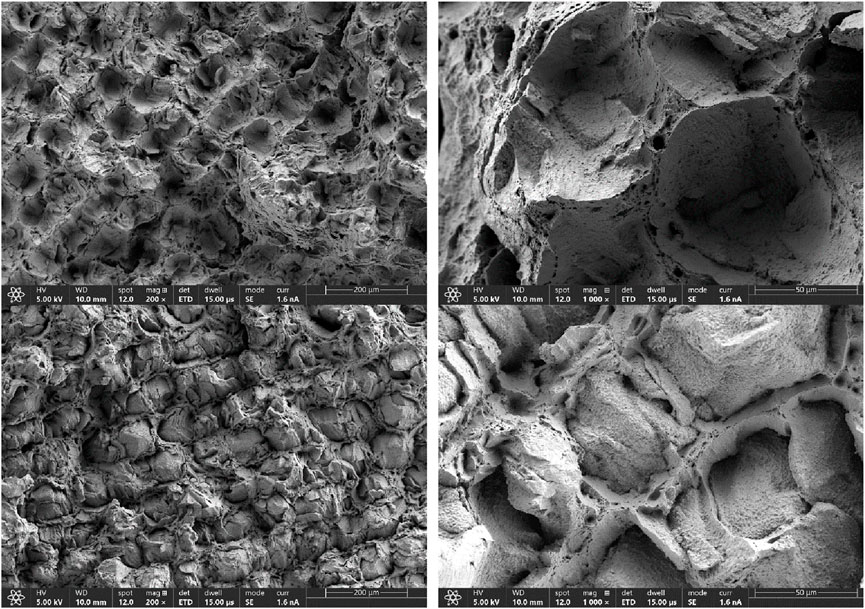
Figure 20. SEM picture of both UC fracture surfaces in the XY orientation. AMRC NA, test piece FA-01,
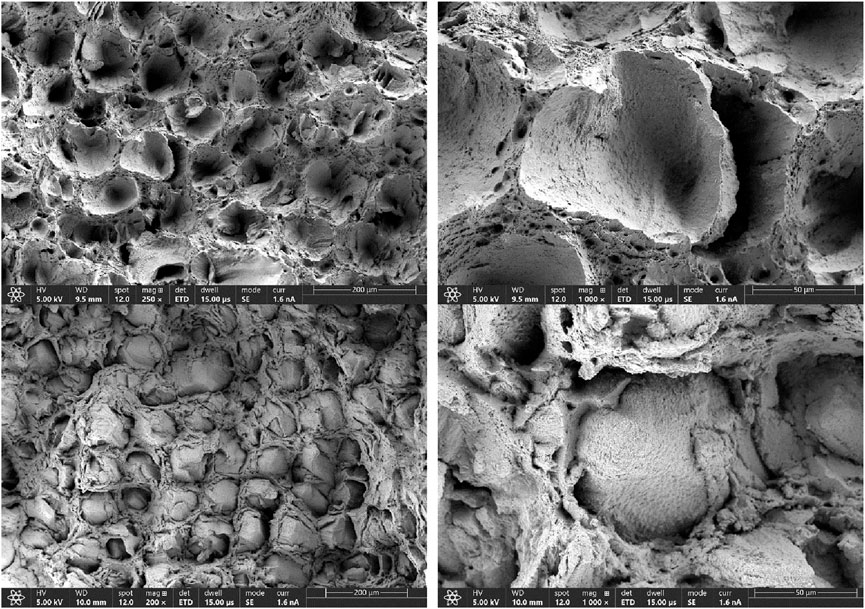
Figure 21. SEM picture of both UC fracture surfaces in XY orientation. CEA Aged, test piece GC-01,
5 Conclusion
In this article, we provide a significant set of small punch creep (SPC) and uniaxial creep (UC) data of additively manufactured (AM) 316L stainless steel at 650 °C. We show that SPC tests of this material result in double minima for deflection rates at relatively short rupture times (tens of hours). For a specific case, we show that these two minima are related to crack initiation and propagation. The measured SPC deflection is then not only due to the creep of the test piece but also due to its cracking. This could potentially be an issue for SPC testing of non-ductile materials. Further work is necessary to confirm additionally that the multiple crack initiations in SPC tests result in multiple deflection rate minima, to determine which minimum should be used for estimating
Data availability statement
The datasets presented in this study can be found in online repositories. The names of the repository/repositories and accession number(s) can be found below: NUCOBAM SPC, 650C catalogue, https://doi.org/10.5290/76, NUCOBAM UC, 650C catalogue, https://doi.org/10.5290/77.
Author contributions
IS: Conceptualization, Data curation, Formal Analysis, Investigation, Methodology, Project administration, Resources, Software, Supervision, Validation, Visualization, Writing – original draft, Writing – review and editing. KN: Formal Analysis, Methodology, Writing – original draft, Writing – review and editing. SH: Conceptualization, Methodology, Writing – review and editing. MK: Investigation, Writing – review and editing. AG-J: Investigation, Writing – review and editing.
Funding
The author(s) declare that financial support was received for the research and/or publication of this article. This project has received funding from the European research and training programme 2014–2018 under grant agreement No. 945313 (NUCOBAM project).
Conflict of interest
The authors declare that the research was conducted in the absence of any commercial or financial relationships that could be construed as a potential conflict of interest.
Generative AI statement
The author(s) declare that no Generative AI was used in the creation of this manuscript.
Any alternative text (alt text) provided alongside figures in this article has been generated by Frontiers with the support of artificial intelligence and reasonable efforts have been made to ensure accuracy, including review by the authors wherever possible. If you identify any issues, please contact us.
Publisher’s note
All claims expressed in this article are solely those of the authors and do not necessarily represent those of their affiliated organizations, or those of the publisher, the editors and the reviewers. Any product that may be evaluated in this article, or claim that may be made by its manufacturer, is not guaranteed or endorsed by the publisher.
References
ASM Handbook (2017). Volume 24A, additive manufacturing design and applications, 2023, novel, chapter: test methods, 270–284.
ASTM F3184-16 Standard Specification for Additive Manufacturing Stainless Steel Alloy (2024). UNS S31603 with powder bed fusion
Jorge, E. M., and Myriam, B. (2025). NUCOBAM European project: nuclear components based on additive manufacturing 650C catalogue. Nucl. components Based Addit. Manuf.
Konstantinović, M. J., Bardel, D., Van Renterghem, W., Van Dyck, S., Badinier, G., Ettaieb, K., et al. (2025). Mechanical properties of neutron irradiated 316L stainless steel additively manufactured by laser powder bed fusion: effect of post-manufacturing heat treatments. J. Nucl. Mater. 607, 155662. doi:10.1016/j.jnucmat.2025.155662
Lalé, M., and Viguier, B. (2024). Mechanical properties assessment of additively manufactured Ti64 alloy using small punch tests. Mater. A. T. High. Temp. 41 (1), 187–194. doi:10.1080/09603409.2023.2295601
Messner, M. (2023). ASME code qualification plan for LPBF 316 SS. Argonne National Laboratory. Available online at: https://www.anl.gov/argonne-scientific-publications/pub/184225.
NUCOBAM (2024). NUclear COmponents based on additive manufacturing, EU-funded project grant 945313, Available online at: https://nucobam.eu/.
RCC-MRx (2022). Design and construction rules for mechanical components of nuclear installations: high temperature, research and fusion reactors. 2022 edition. AFCEN.
Torres, J., and Gordon, A. P. (2021). Mechanics of the small punch test: a review and qualification of additive manufacturing materials. J. Mater. Sci. 56, 10707–10744. doi:10.1007/s10853-021-05929-8
Keywords: additive manufacturing, 316L stainless steel, small punch, uniaxial creep testing, laser powder bed fusion, LPBF, small punch creep, uniaxial creep
Citation: Simonovski I, Nilsson K-F, Holmström S, Kus M and García-Junceda A (2025) Pre-qualification of additively manufactured 316L stainless steel using small punch and uniaxial creep testing. Front. Mater. 12:1609564. doi: 10.3389/fmats.2025.1609564
Received: 10 April 2025; Accepted: 15 September 2025;
Published: 24 November 2025.
Edited by:
Petr Dymáček, Institute of Physics of Materials (ASCR), CzechiaReviewed by:
Shin-ichi Komazaki, Kagoshima University, JapanJuhani Rantala, VTT Technical Research Centre of Finland Ltd, Finland
Copyright © 2025 Simonovski, Nilsson, Holmström, Kus and García-Junceda. This is an open-access article distributed under the terms of the Creative Commons Attribution License (CC BY). The use, distribution or reproduction in other forums is permitted, provided the original author(s) and the copyright owner(s) are credited and that the original publication in this journal is cited, in accordance with accepted academic practice. No use, distribution or reproduction is permitted which does not comply with these terms.
*Correspondence: I. Simonovski, SWdvci5TaW1vbm92c2tpQGVjLmV1cm9wYS5ldQ==