 Jian Chen1,2
 Xuchao Liu
- 1China National Administration of Coal Geology Guangdong Administration of Coal Geology, Guangzhou, China
- 2School of Earth Sciences and Engineering,Sun Yat-sen University, Zhuhai, China
- 3College of Energy and Mining Engineering, Xi’an University of Science and Technology, Xi’an, China
Solution mining is widely applied in underground salt rock extraction, but it is prone to inducing ground subsidence. Under complex geological conditions, its mechanism is more complicated, posing a significant threat to engineering safety and the ecological environment. The Guangzhou Longgui Nitrate-Salt Mine, due to the direct contact between salt-bearing strata and highly permeable argillaceous conglomerate layers, has seen continuous development of ground subsidence with an accelerating rate caused by long-term solution mining. To clarify the subsidence mechanism and predict future trends, the geological structure, aquifer distribution, and cavity development characteristics of the mining area were analyzed through on-site investigations and geophysical methods (Controlled Source Audio-Frequency Magnetotellurics). The causes of subsidence were systematically explored, and a numerical simulation model was established based on mining data and monitoring results to invert historical subsidence patterns and predict future trends. It was found that the core mechanism of accelerated subsidence is the collapse of upper pillar groups triggered by pillar dissolution, and this process is further exacerbated by the hydraulic connection between adjacent cavities and permeable aquifers. Numerical predictions show that subsidence will continue to intensify. By 2050, the maximum subsidence in Mining Area I will reach 1,553 mm (with a rate of 12.05 mm/year), and that in Mining Area II will reach 2096 mm (with a rate of 44.78 mm/year). After well sealing, cavity group creep and compaction of insoluble residues will gradually slow down the subsidence rate.This study innovatively reveals the coupled mechanism of ground subsidence under the interaction between complex geological conditions and solution mining, providing accurate prediction data and technical support for subsidence prevention and control in Longgui and similar mining areas. It emphasizes the necessity of strengthening monitoring and implementing targeted emergency measures to reduce disaster risks.
1 Introduction
Solution mining of underground salt rock in China has a long history (Wang, 1997; Zhang, 1994; Lai et al., 2025). By analyzing major ground subsidence disasters in domestic and international salt mines over recent decades, studies have revealed that solution mining-induced subsidence typically exhibits the following characteristics: prolonged disaster cycles, large-scale impacts, high destructiveness, sudden onset, susceptibility to recurrence, and frequent accompanying surface brine seepage before or after events (Li, 2024; Li et al., 2024; Le and Tian, 2018; Li et al., 2009; Li et al., 2008; Li et al., 2023; Li et al., 2025). Solution mining exploits the water-soluble nature of salt deposits, where freshwater is injected via boreholes or shafts to dissolve target minerals underground, with the resulting solution extracted to the surface (Bérest, 2017; Cochran et al., 2005; Zhang et al., 2021; Zhang et al., 2019; Zhang et al., 2015). However, due to geological complexity and the uncontrollable nature of dissolution processes, the evolution of solution cavity morphology remains challenging to predict, leading to secondary hazards such as surface brine leakage, differential subsidence, and collapses in some mining areas (Fu et al., 2023; Buffet, 1998; Liang et al., 2003). With prolonged mining activities, large-scale subsidence incidents have increased, and significant progress has been made in understanding the mechanisms of mining-induced ground subsidence (Wang et al., 2007; Andreichuk et al., 2000; Zhou et al., 2025; Qiu et al., 2025; Deng et al., 2024; Li, 2020; Qiu, 2014).
The formation of salt caverns typically progresses through a continuous sequence of events: initial development of mined-out areas, redistribution of in-situ stresses, deformation of the cavern roof, collapse of the roof and overlying strata, and eventual ground subsidence. Following the creation of mined-out areas, prolonged dissolution and softening of salt pillars can further destabilize roof structures and interlayers, leading to their collapse. The collapsed mudstone, when softened by water infiltration, loses its ability to support overlying rock masses, potentially triggering successive collapses. This upward propagation of collapse doming accelerates subsidence rates. As mining operations continue, underground dissolution cavities expand progressively, and interconnected cavity systems across multiple well areas evolve into complex three-dimensional networks. These structural transformations induce dual disaster mechanisms. On one hand, mining-induced fracture areas establish mechanical linkages between surface and subsurface cavities, causing differential settlement of building foundations, collapse of municipal infrastructure, and severe risks to urban safety. On the other hand, high-pressure brine migrates upward through permeable fracture networks, significantly increasing groundwater salinity and generating surface salinization patches, which degrade vegetation and diminish soil productivity, as illustrated in Figure 1.
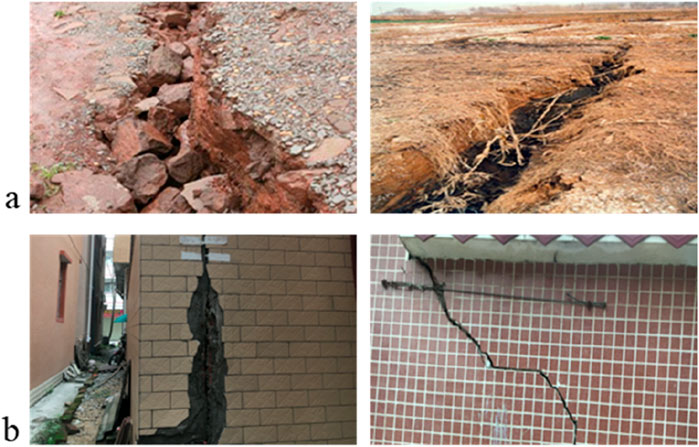
Figure 1. Typical Ground Subsidence Hazards (a) Ground subsidence, (b) Building cracks).
Extensive research has been conducted by scholars on the stability and failure mechanisms of cavern roofs, as well as the mechanisms of surface subsidence disasters induced by mining activities. Liu et al. (1999) analyzed factors influencing stability by studying the settlement and deformation patterns of overlying strata in salt caverns, revealing the response characteristics and stability failure mechanisms during mining. Jones and Blom (2014) demonstrated the effective use of radar interferometry for predicting and monitoring ground collapse events, providing a critical tool for geohazard prevention. Li et al. (2017) employed viscoelastic and Mogi models to investigate surface subsidence caused by underground salt cavern storage facilities, successfully applying these models to case studies for subsidence assessment and prediction. Ren Song et al. (Ren et al., 2007; Zhang et al., 2025) developed a three-dimensional probabilistic integration prediction model for layered subsidence transfer under complex mining conditions, specifically tailored to analyze surface subsidence induced by solution mining in salt rock. This model enables detailed evaluation of stratified impacts from different mining activities on surface deformation. Dong et al. (2024) applied the Pearson correlation coefficient method to assess the correlation of ground subsidence factors and validated the reliability of this approach.
This study conducts a mechanistic analysis of solution mining-induced ground subsidence and investigates control strategies in the Longgui Nitrate-Salt Mine. During active mining operations, pronounced ground subsidence with accelerated deformation rates has been documented, predominantly manifesting as structural damage to shallow-founded infrastructure, including ground fissures, road fractures, and wall cracks. Monitoring data reveal persistently high subsidence rates and cumulative displacement values within the mining area. By compiling geological, hydrogeological, and mining datasets, combined with safety assessment protocols, this work systematically evaluates brine extraction wellbore integrity, characterizes sealing conditions, and examines the spatial independence of interconnected salt caverns. Additionally, hydraulic interactions between cavern systems and overlying aquifers are delineated to establish a predictive framework for subsidence dynamics. Previous studies have mostly focused on ground subsidence mechanisms under single factors or specific scenarios. This study comprehensively considers the interactions between various complex geological conditions and mining factors, and employs advanced simulation and monitoring technologies to analyze the subsidence mechanism more comprehensively and in-depth. The findings provide critical insights for subsidence hazard mitigation at the Longgui Salt Mine and serve as a methodological reference for geohazard prevention in analogous solution mining environments.
2 Engineering geology of the mining area
The Longgui Nitrate-Salt Mine is located in Yongtaizhuang and Gaoqiaozhuang, Taihe Town, Baiyun District, Guangzhou, approximately 18 km south of Yuexiu Park, as shown in Figure 2. The Liuxi River flows northeast to southwest into the Pearl River to the west of the mining area. The Guangcong Highway and Guanghua Highway are situated on the east and west sides of the mining area, 2.1 km and 1.5 km from its center, respectively, with multiple village roads connecting them. The Guangzhou North Second Ring Expressway and Beitai Highway cross the central part of the mining area. The salt-bearing strata generally extend northeastward, with a length of 5.95 km, a width of 2.25 km, and an area of approximately 9 km2. The total thickness of the mineralized intervals ranges from 50 to 150 m, with the salt layer roof consisting of salt-dissolution mud conglomerate aquifer areas at varying stratigraphic levels. The mining area is divided into three mining areas I, II, and III. The mine employs solution mining to extract rock salt and associated glauberite deposits at elevations between 470 m and 575 m below ground surface. The salt deposits cover an area of about 2.35 km2. After 20 years of mining, underground cavities with a total volume of 9.09 million cubic meters (9.09 × 10⁶ m3) have formed in the mining area (Zhang et al., 2025).
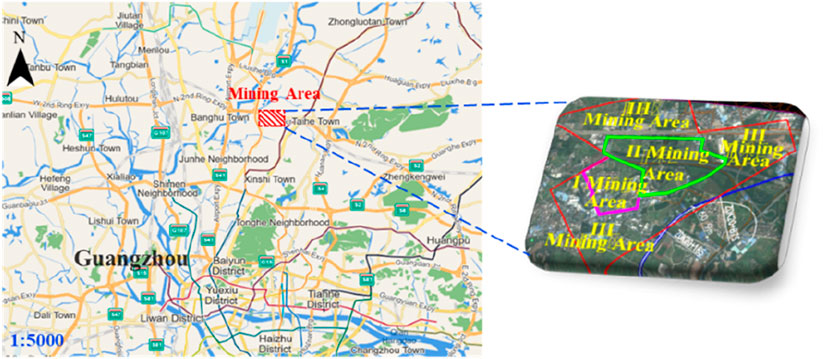
Figure 2. Location map of the longgui nitrate-salt mine area.
The Longgui Nitrate-Salt Mine exhibits complex geological conditions, characterized by multiple irregular salt layers. The deposit is a paleo-inland lacustrine sodium sulfate-type rock salt formation, primarily composed of mudstone, siltstone, and their interbeds. The rock salt deposits are concentrated in the southern depression (Southern Mining Area) and extend to the northern depression (Northern Mining Area). The thickest central well in the southern depression reaches 196 m, while the thinnest between the southern and northern depressions is only 9 m. The widely distributed gypsum-glauberite-bearing interval forms a continuous mineralized body spanning both depressions. Rock salt and glauberite layers (collectively termed salt layers) are confined to the central areas of the southern and northern depressions. The upper section of the deposit hosts the main salt layers, followed by gypsum-glauberite-bearing intervals and salt groups in the middle, and lower gypsum-glauberite-bearing intervals. The mine contains eight salt-bearing layers: five rock salt layers and three glauberite layers. The third aquifer in the mining area directly contacts the main mining salt layers, predominantly composed of argillaceous conglomerate with fragmented roof strata. This configuration facilitates hydraulic connectivity, where solution mining activities disrupt natural equilibrium, potentially inducing ground fissures and subsidence. The mining area lies in the southern Longgui Basin, controlled by the Guangcong Fault Area of the Pearl River Delta. The Liuxi River flows northeast to southwest through the western part of the mining area into the Pearl River. The terrain is flat, with well-developed surface water systems, including small reservoirs and ponds that interact hydraulically with the Quaternary aquifer. Tributaries and channels of the Liuxi River crisscross the area, predominantly flowing east to west.
The deposit area lacks significant surface water bodies, and the rock formations exhibit weak water-bearing properties, with four aquifers identified vertically from top to bottom. The first aquifer consists of Quaternary confined pore water with a thickness of 15–31 m. The second aquifer comprises confined pore-fracture water in the upper part of Member two of the Xibu Formation, buried at depths of 1.7–233.64 m and with a thickness of 64–220 m. The third aquifer, located near or directly serving as the roof of the salt layers, forms a confined fracture brine area composed of interbedded mud conglomerate, fractured mudstone, and calcareous mudstone in the upper part of Member three of the Buxin Formation. The fourth aquifer consists of karst-fracture water in the Lower Permian Qixia Formation limestone beneath the basin basement, generally buried below 585 m. Two aquitards separate the aquifers: Aquitard I lies between the lower part of Member two of the Xibu Formation and the upper part of Member three of the Buxin Formation, separating the second and third aquifers, with a thickness of 208.2–452.26 m. Aquitard II extends from the roof of the salt layers in Member three of the Buxin Formation to the base of Member 1, with a thickness of 86.64–291.32 m. Where the third aquifer is absent, the two aquitards merge into a single layer. Figure 3 shows the distribution of Longgui Nitrate-Salt Mine area and distribution of mining wells and ground subsidence monitoring points.
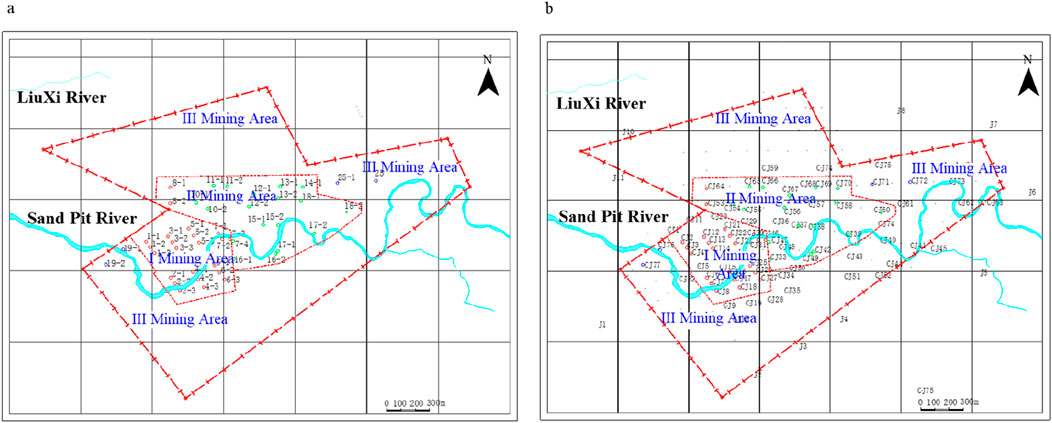
Figure 3. Distribution of longgui nitrate-salt mining area and distribution of mining wells and ground subsidence monitoring points. (a) Zoning of the mining area and distribution of production wells. (b) Distribution of ground subsidence monitoring points in the mining area.
The deposit primarily contains economically valuable minerals such as rock salt and glauberite, accompanied by rare elements including lithium and bromine, with minor glauberite. It comprises multiple ore layers, where the two main salt groups (I and II) are exclusively distributed in the Southern Mining Area, while Salt Group III is more developed in the Northern Mining Area. From bottom to top, the salt layers progressively shift southeastward with gentle dip angles (mostly <5°), though steeper at the flanks (up to 7°). Salt Groups I and II feature concentrated distribution, shallow burial depths, large areal extents, and high ore grades. According to the Geological Exploration Report of the Longgui Salt Mining Area in Guangzhou Suburbs (12th Petroleum Prospecting and Exploration Brigade, Ministry of Geology and Mineral Resources, September 1984) and the Verification Report on Niter-Salt Mineral Resources in the Longgui Mining Area, Guangzhou City, Guangdong Province (Salt Industry Geological Exploration Brigade, China National Salt Industry Corporation, April 2008), the Longgui Nitrate-Salt Mine primarily extracts five salt layers: Salt Layer 1, a sub-parallelogram-shaped layer trending approximately east-west, covers 1.60 km2 with a thickness ranging from 9.43 to 20.69 m (maximum 25.96 m; minimum 4.20 m). Salt Layer 2, located 3–4 m below Layer 1, exhibits a smaller sub-parallelogram area of 1.07 km2 and thickness of 2.67–3.68 m. Salt Layer 3, the largest layer situated 7–10 m below Layer 2, forms a northeast-trending rectangular shape with an eastward protrusion, covering 2.42 km2 and maintaining a consistent thickness of 16.98–23.54 m. Salt Layer 4, found 4–6 m below Layer 3, presents a regular southwest-trending ovoid with an area of 0.86 km2 and thickness varying from 2.43 to 3.76 m (thicker in the northwest, thinner in the southwest). Salt Layer five covers 0.62 km2 with a thickness of 3.06–3.50 m. Horizontal projections of Layers 1–5 in the Southern Mining Area reveal significant overlap, suggesting that complete extraction could create interconnected solution cavities exceeding 50 m in height.
3 Analysis of subsidence causes in the mining area
Multiple geophysical methods, including Controlled Source Audio-Frequency Magnetotellurics (CSAMT), were employed in subsidence-prone areas of the mining area to investigate cavity development. Based on well-logging data, drilling exposures, and CSAMT measurements, the resistivity distribution characteristics of the survey area were analyzed. Detailed interpretation of multiple survey lines delineated planar cavity distributions, identifying dissolution areas and low-resistivity anomalies.
The survey lines were divided into five stratigraphic layers based on resistivity curves from three-directional resistivity logging. Layer 1, above elevation 0 m with resistivity of 30–80 Ω m, corresponds to. Layer 2, between elevations −50 m and 0 m with resistivity of 20–300 Ω m, exhibits near-horizontal bedding and is interpreted as sandstone based on geophysical features and borehole data. Layer 3, spanning elevations −300 m to −50 m with resistivity of several Ω·m to 60 Ω m, reflects interbedded sandstone and mudstone. Layer 4, at elevations −600 m to −160 m with a resistivity of less than 10 Ω m, primarily comprises mudstone hosting nitrate-salt layers near elevation −500 m. Solution mining-induced hydraulic fracturing in this layer creates cavities, which collapse and fill with water-softened mudstone. Residual brine infiltrates upward through fractured mudstone, reducing resistivity above the cavities. If the overlying mudstone remains intact, brine-filled cavities form extensive low-resistivity areas. Layer 5, below elevation −460 m with a resistivity greater than 10 Ω m, consists of mudstone influenced by mining activities, with resistivity increasing with depth. Drilling revealed concealed limestone beneath the mudstone. This layered interpretation framework guided CSAMT data analysis (Figure 4).
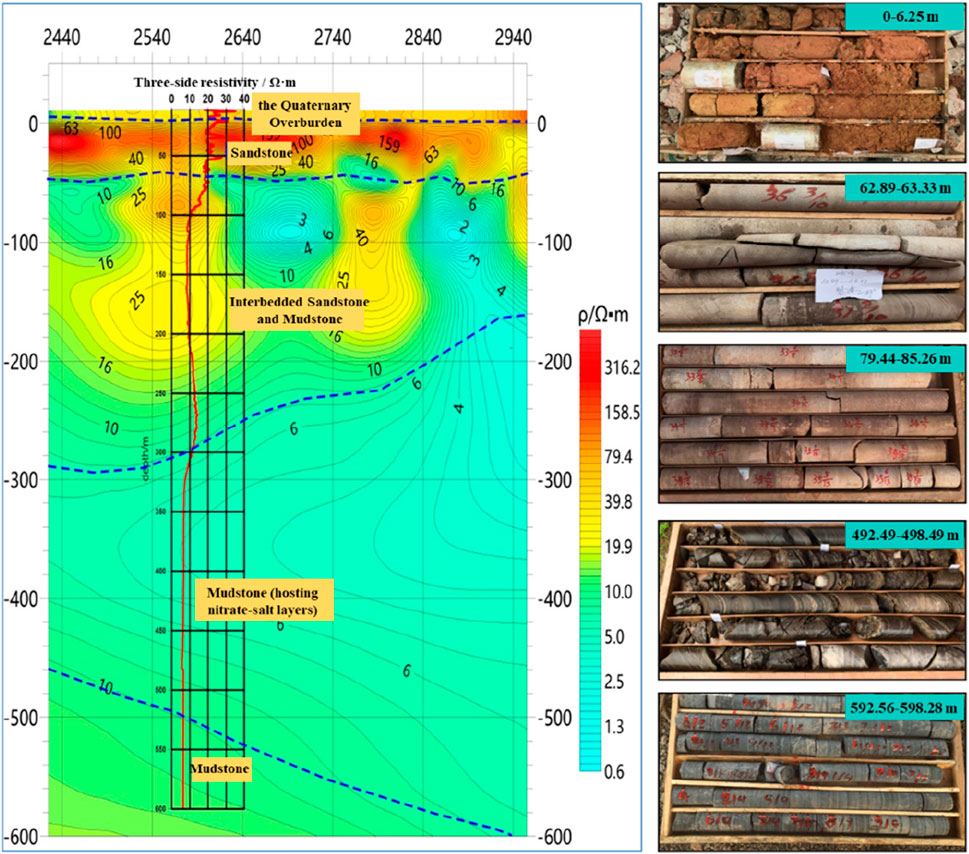
Figure 4. Schematic diagram of CSAMT interpretation Principles and core retrieval conditions.
Drilling data indicate a large-scale fracture area at 460 m depth within the third aquifer, suggesting highly developed macro-fractures and poor rock mass integrity. As solution cavities expand toward the roof, this aquifer becomes a primary pathway for brine migration, likely triggering large-scale collapses.
The salt-bearing strata’s roof in the Longgui Nitrate-Salt Mine directly adjoins the third aquifer, composed of fractured, porous, and permeable argillaceous conglomerate. This fragile roof facilitates hydraulic connectivity, disrupting natural equilibrium during solution mining and inducing ground fissures or subsidence. When cavity clusters extend near the aquifer, lateral hydraulic interactions between adjacent cavities may cause horizontal expansion and pillar dissolution, ultimately leading to cross-well connectivity of upper pillars and accelerated subsidence.
4 Numerical simulation and inversion prediction of subsidence
4.1 Modeling basis
This chapter employs numerical simulations to inversely analyze and predict the impact of salt cavities on ground subsidence in the Longgui Nitrate-Salt Mine. The model boundaries are defined based on wellhead coordinates and the Sealing Well Construction Layout Plan of the Longgui Nitrate-Salt Mine, as shown in Figure 5.
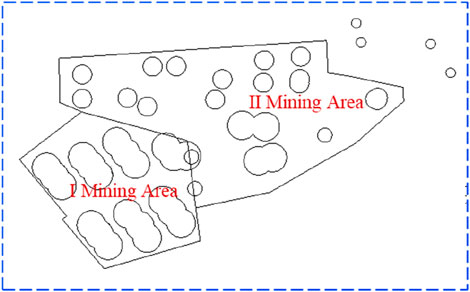
Figure 5. Schematic diagram of numerical model boundary for the longgui nitrate-salt mine.
The mining-induced volume for each well group is calculated as follows:
Based on the comprehensive soluble rate of rock salt near the well group and the extracted mineral mass, the dissolved mass of salt rock and glauberite is determined:
Thus, the mining-induced volume is:
Where
According to the Reserve Verification Report, the average grades of NaCl and Na2SO4 in the salt layers are 60.98% and 14.37%, respectively. Considering the presence of numerous insoluble mudstone interlayers within the salt layers, the comprehensive soluble rates at the locations of each brine extraction well in the mining area must be determined by integrating the Topographic-Geological Map of the Longgui Salt Mining Area in Guangzhou, Guangdong and the Geological Profiles of the Longgui Salt Mining Area. This allows for the accurate estimation of mining-induced volumes based on the extracted mineral quantities from each well. Specifically, the comprehensive soluble rates for Well Groups 1 and 2 are determined using the Line four geological profile of the Longgui Salt Mining Area, while those for Well Groups 7, 10, and 16 are based on the Line two geological profile. For Well Groups 3, 4, 5, 6, and eight located between Lines two and four of the Longgui Salt Mining Area, the comprehensive soluble rates are derived by synthesizing both geological profiles. Well Group 14s soluble rate is determined using the Line 0 geological profile, and Well Groups 11, 12, 13, 15, and 17, situated between Lines 0 and 2, are assessed by integrating both profiles. Taking Well Group 1 as an example, with an initial mining depth of 511.33 m, the Line four geological profile indicates an average minable thickness of 40 m, comprising 23.15 m of soluble salts (75.35% solubility) and 16.85 m of insoluble interlayers (0% solubility). The comprehensive soluble rate for this well group is calculated as 43.6%. The same methodology is applied to subsequent well groups, with the comprehensive soluble rates and corresponding mining-induced volumes summarized in Table 1.
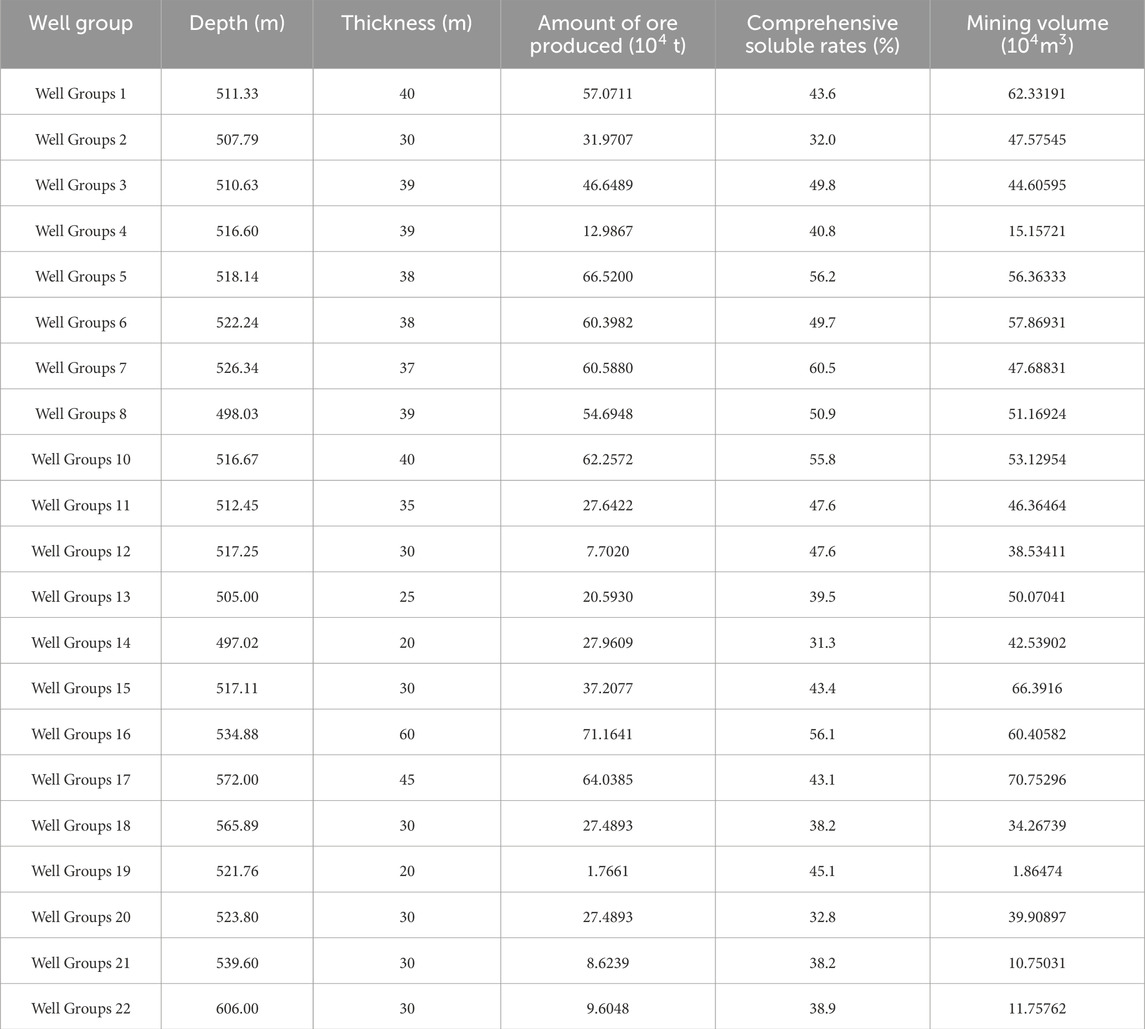
Table 1. Comprehensive soluble rates and mining-induced volumes of well groups.
4.2 Cavity morphology
During the late stage of brine extraction using submersible pumps, salt cavities dissolve upward into the third aquifer of the roof. Without upward dissolution control, the cavities expand laterally into bowl- or cup-shaped geometries, with minimal dissolution at the base due to near-saturation brine concentration. Empirical sonar cavity measurement data indicate that when oil cushion-controlled upward dissolution is applied, cavities exhibit inverted cone-like shapes with extensive lateral expansion at the top and slower dissolution at the bottom. Similarly, the roof of the Longgui Nitrate-Salt Mine restricts upward dissolution, causing cavities to initiate lateral expansion at the mudstone-salt rock interface, forming complex three-dimensional geometries. Based on empirical sonar data, the cavity morphology in this numerical model is defined as inverted conical.
Table 2 presents the elastoplastic calculation parameters in the subsidence calculation inversion process. The classical Mohr-Coulomb strength theory is adopted in this elastoplastic calculation. This model is a kind of shear stress strength theory, which comprehensively reflects the strength characteristics of rocks. It is applicable to the shear failure of both plastic rocks and brittle salt rocks, and also reflects the characteristic that the tensile strength of rocks is much less than the compressive strength. Thus, it is widely used in geotechnical engineering practice.
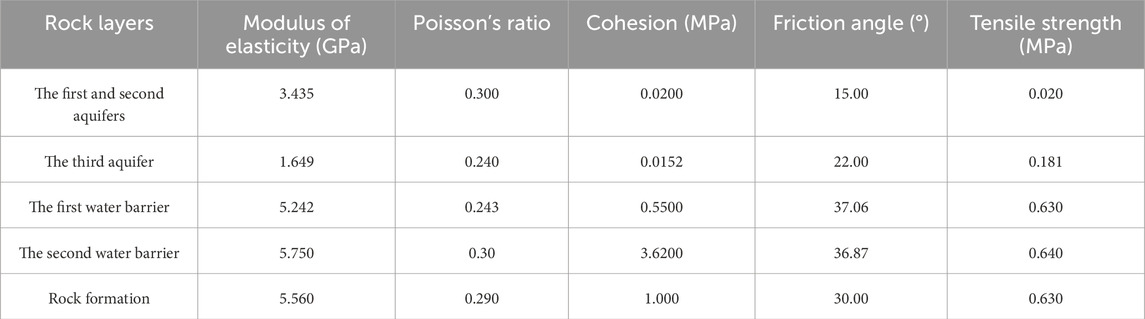
Table 2. Elastoplastic calculation parameters in the subsidence calculation inversion process.
Assuming that the compressive stress is negative, the yield function of the Mohr-Coulomb strength condition is:
In the formula:
The yield function for tensile failure is:
Where
The maximum value of tensile strength should not exceed
Figure 6 is a schematic diagram of the Mohr-Coulomb yield condition.
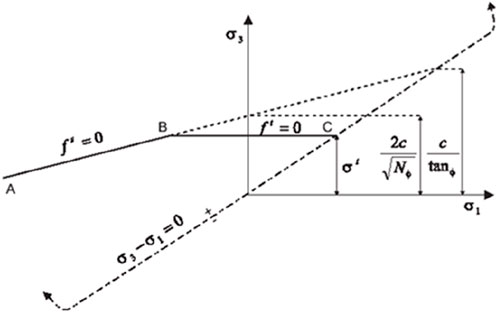
Figure 6. Mohr-coulomb yield condition.
The shear failure potential function adopts the non-associated flow rule:
Where
The tensile failure potential function adopts the associated flow rule:
A three-dimensional finite element model of the salt cavity cluster in the Longgui Nitrate-Salt Mine was established using ANSYS software, incorporating the region’s engineering geological conditions. Tetrahedral elements were employed for the cavities and surrounding strata using ANSYS’s free meshing method, with localized mesh refinement near cavities to enhance deformation analysis accuracy. For non-cavity strata, hexahedral elements were applied via mapped meshing. The model was then imported into FLAC3D for computational analysis. The 3D geological model was simplified based on aquifer and aquitard characteristics, with strata dip angles set to 0° due to near-horizontal bedding. The computational domain is a rectangular prism measuring 2,300 m (length) × 1,400 m (width) × 764 m (height), with the top at elevation 0 m and the bottom at −764 m.
The model adopts an XY horizontal coordinate system and a vertical Z-axis. Boundary conditions include vertical (Z-direction) fixed constraints on the bottom surface and normal-direction fixed constraints on the lateral surfaces, simulating rigid surrounding geological bodies that prohibit normal displacement. Figure 7 illustrates the 3D numerical modeling configuration of the Longgui Nitrate-Salt Mine.
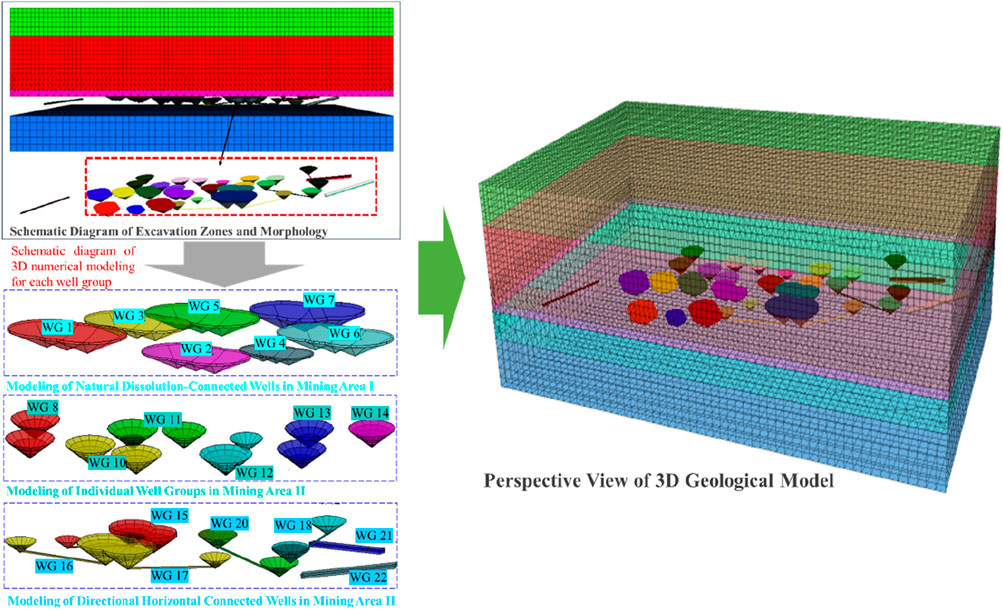
Figure 7. Schematic diagram of 3D numerical modeling in the longgui nitrate-salt mining area.
4.3 Inversion and prediction of subsidence patterns in the mining area
Monitoring data from the Ground Subsidence Investigation and Monitoring Report of the Longgui Nitrate-Salt Mine in Baiyun District, Guangzhou indicate minimal subsidence between 1993 and 2002, with a maximum recorded value of 51 mm. A significant shift occurred after 2003, when large-scale mining commenced in Mining Area II. Subsidence in Mining Area I accelerated markedly, persisting rapidly even after mining ceased in Mining Area I in 2005. The abrupt increase in subsidence rates in Mining Area I during 2003 marked a turning point for intensified subsidence across the entire mining area.
Post-2010, subsidence in Mining Area II began to accelerate sharply. Between 2010 and 2012, subsidence rates at multiple monitoring points increased from 1 to 4 mm/y to 97–127.5 mm/y. By 2014–2015, rates at the central wellhead monitoring points in Mining Area II surged further to 329.9 mm/y and 320.7 mm/y, respectively. This drastic subsidence reflects large-scale cavity deformation. Hydraulic connectivity within the third aquifer caused brine pressure reduction in Mining Area I cavities due to extensive mining in Mining Area II, exacerbating subsidence in Mining Area I. The widespread adoption of submersible pump extraction in Mining Area II further reduced cavity pressures, accelerating subsidence. After roof collapses in Well Groups 15, 16, 17, and adjacent wells in 2011, subsidence in Mining Area II intensified significantly, far exceeding rates in Mining Area I.
Mining operations ceased entirely in 2016. Post-mining subsidence monitoring data (Figure 8) show that while subsidence rates in Mining Area I decreased slightly, the reduction was marginal. In contrast, Mining Area II experienced a pronounced slowdown in subsidence rates, attributed primarily to the discontinuation of submersible pumps, which likely stabilized cavity pressures.
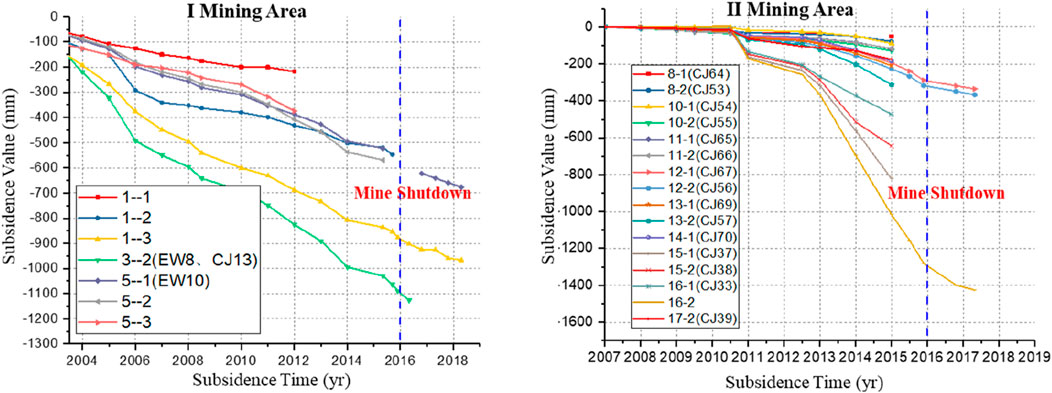
Figure 8. Time-dependent subsidence curves of monitoring points in the mining area (2003–2018).
The time-dependent subsidence curves of numerical simulation monitoring points in Mining Areas I are shown in Figure 9, while the vertical displacement nephograms of the ground surface are presented in Figure 10. After mining cessation, subsidence rates in Mining Area I remained largely unchanged. In Mining Area II, however, significant reductions in subsidence rates were observed near monitoring points 15-1, 15-2, and 16-2 within the subsidence center. From 2016 to 2017, the subsidence rate at monitoring point 1six to two in Mining Area II decreased to 117 mm/y. Although still rapid, this represents a notable decline compared to the pre-cessation rate of 329.9 mm/y. Numerical inversion results further indicate a post-cessation subsidence rate of 113 mm/y at monitoring point 1six to two in Mining Area II, closely aligning with field monitoring data. Comparative analysis of inversion results across well groups demonstrates consistency in subsidence center locations, maximum subsidence magnitudes, and site-specific subsidence trends, validating the rationality of the inversion process.
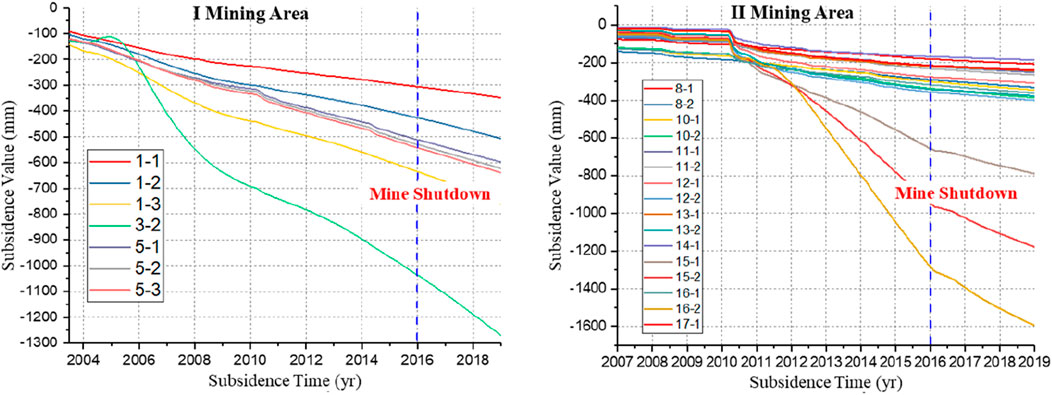
Figure 9. Time-dependent subsidence curves of monitoring points from subsidence inversion (2003–2019).
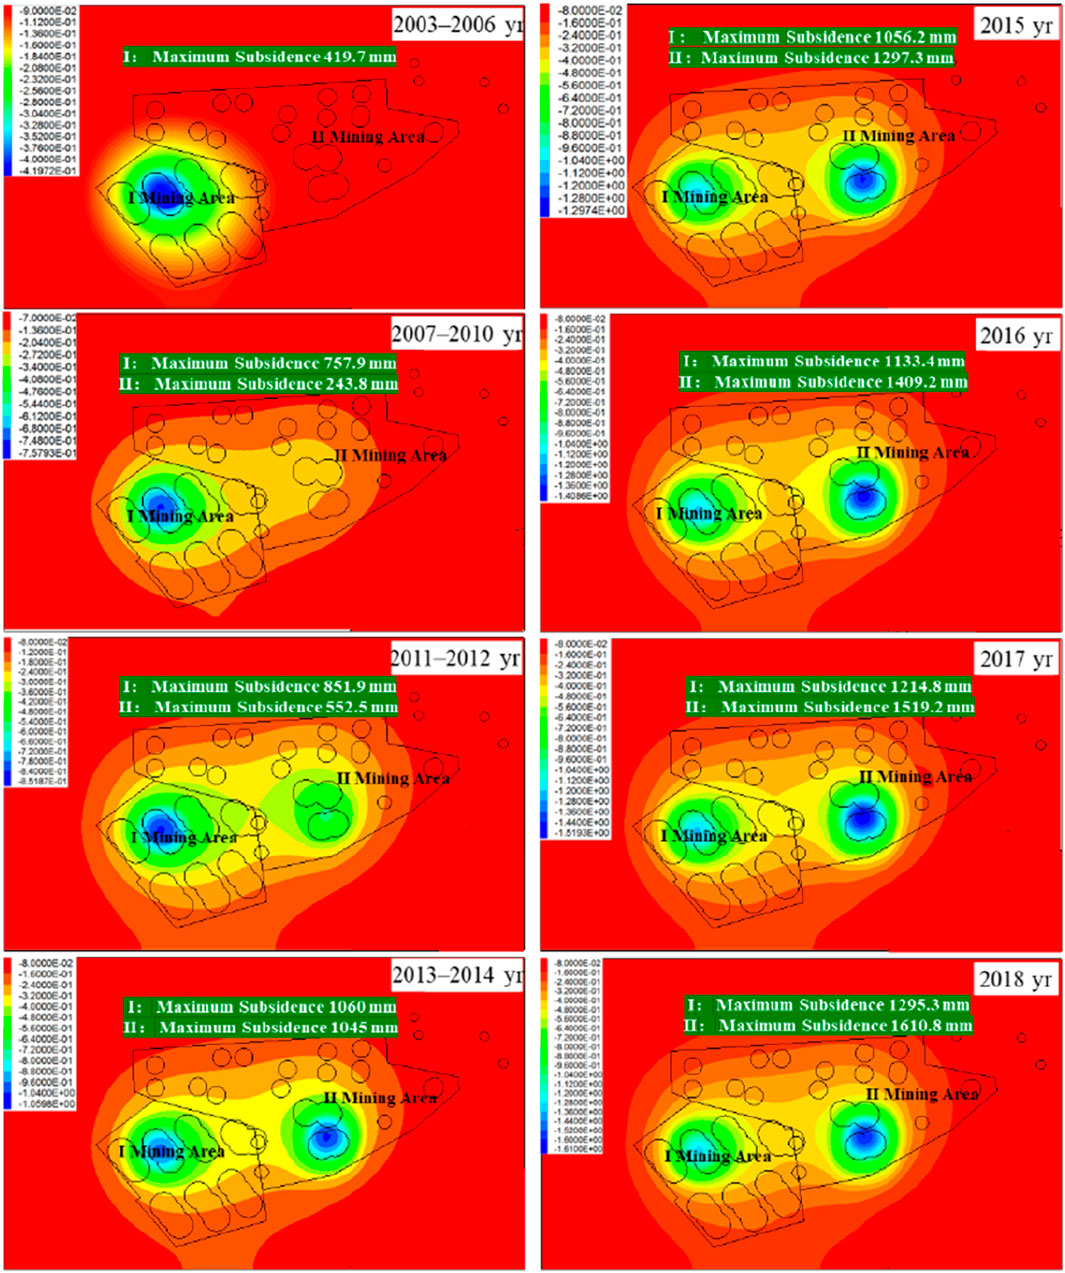
Figure 10. Vertical displacement nephogram of ground surface from subsidence inversion (2003–2018).
5 Prediction of mining area subsidence
5.1 Post-sealing phase
By comparing field subsidence monitoring data with numerical inversion results, post-sealing ground subsidence is primarily attributed to creep-induced contraction of cavity clusters. When the creep contraction volume equals the effective cavity volume (i.e., pure brine-filled space), the solid insoluble residues within the salt cavities begin to compact and gradually provide structural support—a process termed drainage consolidation of insoluble residues. From this stage onward, subsidence rates associated with the cavities further decelerate. A schematic of cavity contraction and residue compaction is illustrated in Figure 11.
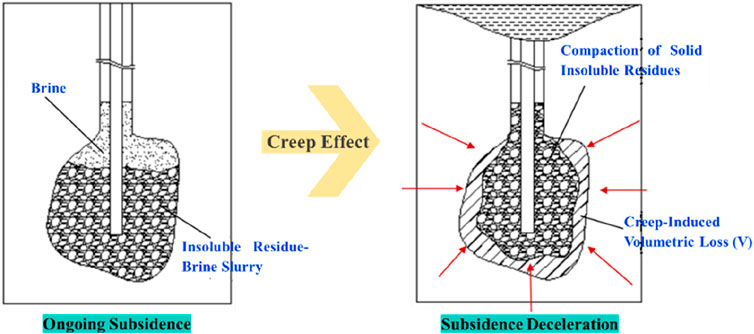
Figure 11. Schematic diagram of cavity compaction process induced by creep-induced contraction.
The compressive deformation of solid insoluble residues during drainage consolidation arises from effective stress. As compaction progresses, the effective density of residues increases, amplifying the effective stress. The pressure acting on residues at depth z within a salt cavity can be calculated based on effective density:
where p is the effective consolidation pressure,
Laboratory experiments reveal a power-law relationship between effective density (
where α、β and γ are deposition parameters dependent on the properties of the insoluble residue layers. The correlation between
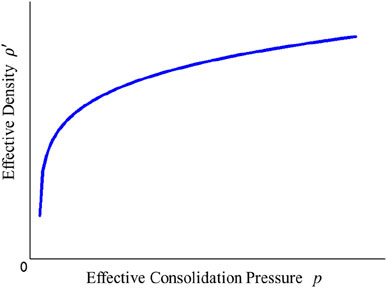
Figure 12. Relationship curve between effective density and effective consolidation pressure of solid insoluble residues.
As cavity compaction advances and residue effective density increases, the effective consolidation pressure progressively rises, enhancing cavity support and significantly reducing cavity shrinkage rates and associated subsidence velocities.
5.2 Subsidence prediction
The contraction of cavities is characterized by monitoring their volumetric shrinkage rates. Well Groups 1–22 are classified into four subsidence mining areas based on subsidence severity. Well Groups 15, 16, and 17 near the subsidence center of Mining Area II are designated as the first subsidence mining area, exhibiting significantly greater and more uniform subsidence compared to other well groups in Mining Area II. Similarly, Well Groups 1, 3, and five near the subsidence center of Mining Area I form the second subsidence mining area, with subsidence magnitudes far exceeding those of Well Groups 2, 4, 6, and 7 in Mining Area I. The collapse and deformation of cavities in these two mining areas result in dual subsidence centers. Due to relatively uniform subsidence in other well groups, the remaining well groups in Mining Area I and II are categorized as the third and fourth subsidence mining areas, respectively. The comprehensive soluble rate for each mining area is calculated as the average of its constituent well groups (Table 3).
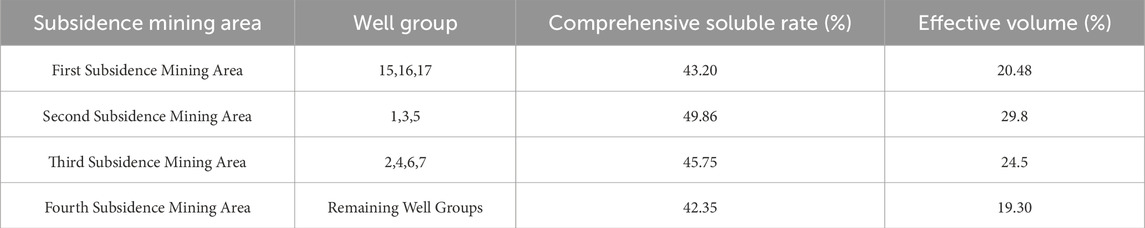
Table 3. Subsidence mining area assignment and basic information of well groups.
The temporal evolution of average volumetric shrinkage rates for each mining area is shown in Figure 13. Taking the end of 2018 as the completion milestone for well sealing, all four mining areas exhibit reduced shrinkage rates post-sealing. Significant volumetric contraction primarily occurred during active mining. The layered extraction method in Mining Area II caused stepwise increases in shrinkage rates for the first and fourth mining areas. By the end of 2050, the shrinkage rates for the four mining areas are projected to reach 22.83%, 19.84%, 14.64%, and 12.99%, respectively. The first and second mining areas display higher shrinkage rates, while the third and fourth remain lower. For the first mining area, cavity shrinkage volume equalled its residual volume (20.48%) by 2028. Beyond this critical compaction threshold, insoluble residues begin to structurally support cavities, sharply reducing the creep rate. The average shrinkage rate of the first mining area drops from 0.505%/y (2019–2027) to 0.108%/y (2028–2050). Other mining areas maintain stable shrinkage rates until 2050: 0.262%/y (second), 0.187%/y (third), and 0.174%/y (fourth). This equilibrium persists until the second mining area reaches its critical compaction threshold of 29.8%.
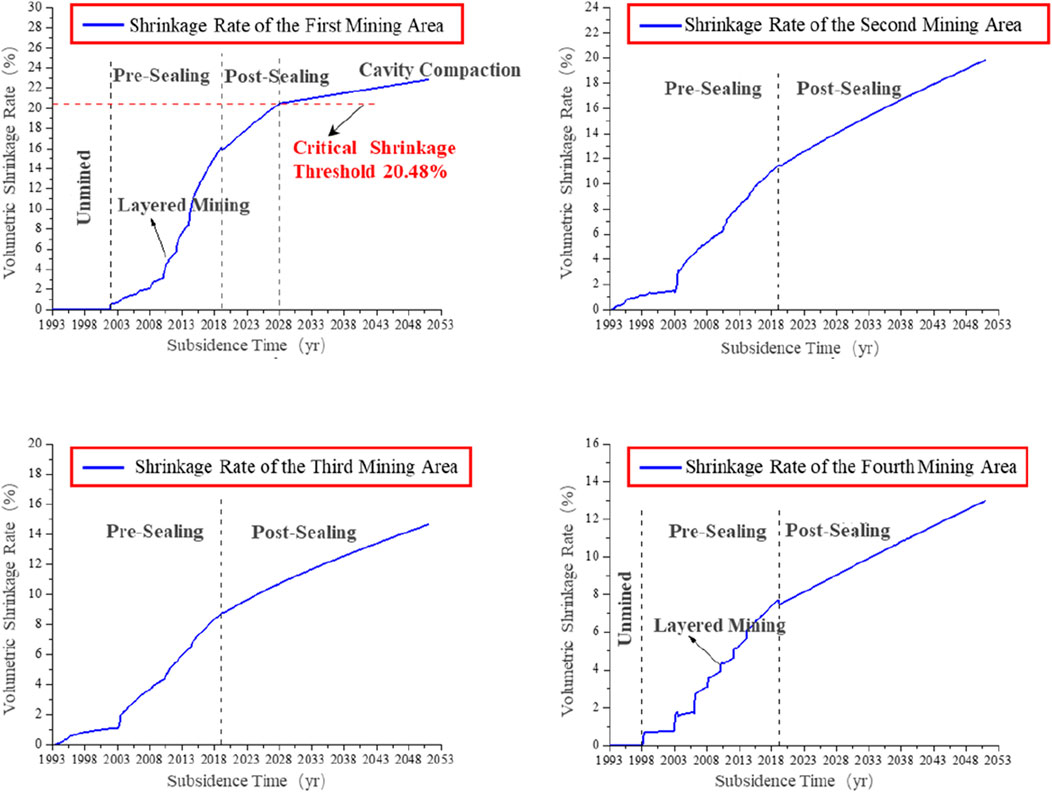
Figure 13. Volumetric Shrinkage Rate vs Subsidence Duration Curves for Subsidence Mining Areas.
Subsidence trends for monitoring points in Mining Areas I and II from 2019 to 2050 are illustrated in Figure 14. Post-sealing subsidence rates in Mining Area I (second and third mining areas) decrease markedly and stabilize at 7.67 mm/y by 2050. Subsidence will persist at this rate until creep fully eliminates effective cavity volumes. For the first mining area (Well Groups 15, 16, 17), effective cavity volume reaches zero by 2028, initiating residue compaction and structural support. Consequently, average subsidence rates at monitoring points 15-1, 15-2, and 16–2 plunge from 37 mm/y (2019–2027) to 6.87 mm/y (2028–2050). Meanwhile, cavities in the fourth mining area continue stable contraction (2.85–7.49 mm/y) due to non-zero effective volumes.
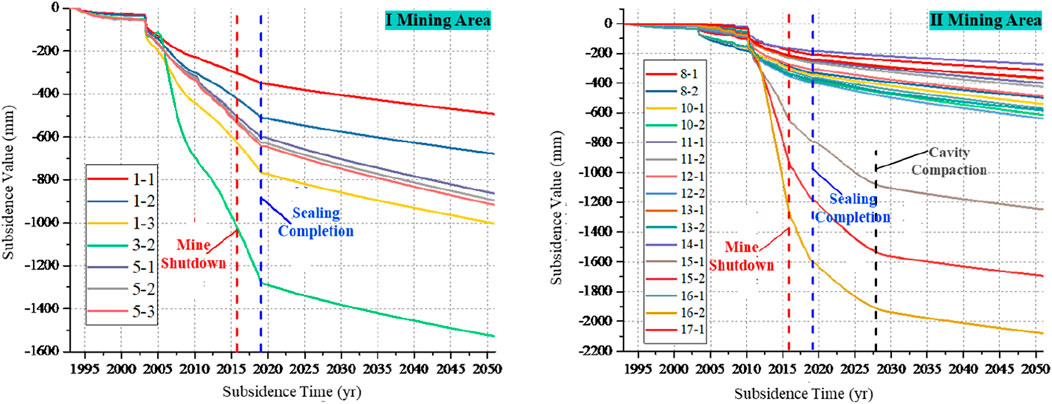
Figure 14. Time-dependent subsidence curves of monitoring points in mining areas I and II.
Vertical ground displacement nephograms for 2019–2050 are presented in Figure 15. From 2019 to 2025, maximum subsidence in Mining Areas I and II reaches 1,367.6 mm and 1,879.5 mm, respectively, representing increases of 72.3 mm and 268.7 mm over 2018 levels, with annual rates of 12.05 mm/y and 44.78 mm/y. Although subsidence rates near Well Groups 15, 16, and 17 (subsidence center of Mining Area II) decline post-sealing, they remain the highest in the mining area until 2028. By 2050, the maximum subsidence is projected to reach 1,553 mm in Mining Area I and 2,096 mm in Mining Area II, with subsidence centers remaining unchanged.
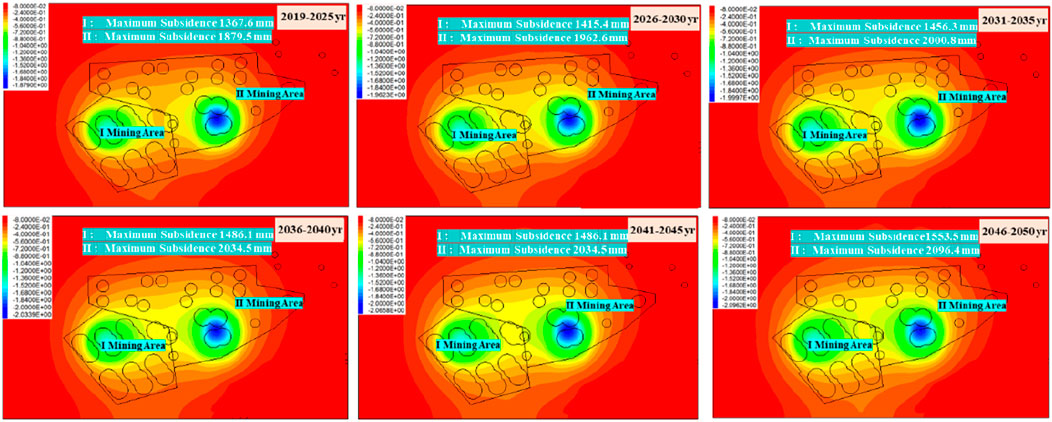
Figure 15. Vertical displacement nephogram of ground surface (2019–2050).
6 Conclusion
1. Analysis of subsidence disasters in domestic salt mines shows most collapses occur at mining depths shallower than 500 m. The Longgui Nitrate-Salt Mine, with mining depths of 470–575 m, is in this high-risk range; its salt-bearing strata roof adjoins the third aquifer, making it prone to ground fissures and subsidence under solution mining. Ground subsidence here mainly stems from hydraulically connected adjacent cavities, where pillar tops, exposed to low-salinity brine over time, dissolve progressively, losing support and ultimately accelerating subsidence.
2. Numerical simulations inversed and predicted subsidence patterns in the mining area. The subsidence centers, maximum displacements, and site-specific subsidence data for Mining Areas I and II align well with inversion results. By 2050, the maximum subsidence is projected to reach 1,553 mm in Mining Area I and 2,096 mm in Mining Area II.
3. Post-sealing, creep-induced cavity contraction reduces subsidence rates once the shrinkage volume equals the effective cavity volume, as compacted insoluble residues begin to provide structural support. Subsidence rates in both Mining Areas I and II decline significantly, dropping from 329.9 mm/y pre-sealing to 117 mm/y, and further decreasing to 6.87 mm/y after 2028.
4. The subsidence predictions in this study represent a plausible extrapolation based on current data. Post-sealing scenarios, including hydraulic disconnection between cavities and Aquifers I/II, and potential large-scale roof collapses, require ongoing monitoring and research.
Data availability statement
The original contributions presented in the study are included in the article/supplementary material, further inquiries can be directed to the corresponding author.
Author contributions
JC: Data curation, Supervision, Project administration, Writing – review and editing. XL: Writing – original draft, Software, Validation, Data curation. JL: Writing – review and editing. PW: Writing – review and editing, Data curation.
Funding
The author(s) declare that no financial support was received for the research and/or publication of this article.
Conflict of interest
The authors declare that the research was conducted in the absence of any commercial or financial relationships that could be construed as a potential conflict of interest.
Generative AI statement
The author(s) declare that no Generative AI was used in the creation of this manuscript.
Any alternative text (alt text) provided alongside figures in this article has been generated by Frontiers with the support of artificial intelligence and reasonable efforts have been made to ensure accuracy, including review by the authors wherever possible. If you identify any issues, please contact us.
Publisher’s note
All claims expressed in this article are solely those of the authors and do not necessarily represent those of their affiliated organizations, or those of the publisher, the editors and the reviewers. Any product that may be evaluated in this article, or claim that may be made by its manufacturer, is not guaranteed or endorsed by the publisher.
References
Andreichuk, V., Eraso, A., and Dominguez, M. C. (2000). A large sinkhole in the verchnekamsky potash basin in the Urals. Mine Water Environ. 19 (1), 2–18. doi:10.1007/bf02687261
Bérest, P. C. (2017). Cases, causes and classifications of craters above salt caverns. Int. J. Rock Mech. Min. Sci. 100, 318–329. doi:10.1016/j.ijrmms.2017.10.025
Buffet, A. (1998). “The collapse of compagnie des salins SG4 and SG5 drillings,” in Proceeding of 1998 SMRI Fall Meeting; Roma, 79–105.
Cochran, M., Hoeffner, K., and Randall, C. (2005). “Hutchinson sinkhole-a mining legacy,” in Proceeding of 2005 SMRI Spring Meeting (New York), 247–278.
Deng, X. W., Ou, J. X., and Qiu, M. (2024). Characteristics and causes of surface subsidence in Longgui nitrate-salt mining area, Guangzhou. Resour. Inf. Eng. 39 (05), 57–59+63. doi:10.19534/j.cnki.zyxxygc.2024.05.022
Dong, L. P., Nie, Q. H., and Sun, X. L. (2024). Analysis of the influence of shield tunneling parameters on surface settlement based on pearson correlation coefficient method. Constr. Technol. 53, 116–123. doi:10.7672/sgjs2024010116
Fu, X. H., Hu, C., and Cheng, W. B. (2023). Analysis of cavity development characteristics in layered salt rock by interconnected well solution mining. China Well Rock Salt 54 (02), 7–9. doi:10.3969/j.issn.1001-0335.2023.02.004
Jones, C. E., and Blom, R. G. (2014). Bayou Corne, Louisiana, sinkhole: precursory deformation measured by radar interferometry. Geology 42 (2), 111–114. doi:10.1130/g34972.1
Lai, X. P., Zhang, S., Cao, J. T., Sun, Y., and Xin, F. (2025). Difference of “whole-process and stages” response law of energy evolution regulated by high energy storage rock modification. Geohazards Mech. 3, 99–109. doi:10.1016/j.ghm.2025.06.001
Le, J. X., and Tian, W. (2018). Analysis of the formation mechanism of surface collapse in yunmeng County salt mining area. Resour. Inf. Eng. 33 (5), 161–162+164. doi:10.19534/j.cnki.zyxxygc.2018.05.075
Li, S. Z. (2020). “Application research of multiple exploration technologies in goaf of Longgui nitrate-salt mine,” in China New Technologies and Products, 5, 128–129. doi:10.16661/j.cnki.1672-3791.2309-5042-4610
Li, L. H. (2024). Mechanism analysis and prevention measures of surface subsidence induced by solution mining in salt mines. Sci. and Technol. Inf. 22 (02), 178–181.
Li, X. F., Tang, S. H., and Fan, Y. Q. (2008). Mechanism analysis and control measures of surface subsidence in solution mining. Industrial Minerals and Process (11), 27–29+44. doi:10.3969/j.issn.1008-7524.2008.11.008
Li, X. F., Xu, B. G., and Tang, S. H. (2009). Mechanism analysis and control countermeasures for surface subsidence caused by drilling solution mining. J. Saf. Sci. Technol. 5 (01), 131–134. doi:10.3969/j.issn.1673-193X.2009.01.026
Li, Y. P., Kong, Q. C., and Shi, X. L. (2017). Viscoelastic model and application for surface subsidence of salt cavern underground storage. Rock Soil Mech. 38 (7), 2049–2058. doi:10.16285/j.rsm.2017.07.027
Li, J., Gao, Y., Yang, T., Zhang, P., Zhao, Y., Deng, W., et al. (2023). Integrated simulation and monitoring to analyze failure mechanism of the anti-dip layered slope with soft and hard rock interbedding. Int. J. Min. Sci. Technol. 33 (9), 1147–1164. doi:10.1016/j.ijmst.2023.06.006
Li, Y. Q., Wang, T. T., Rong, Z. X., Wang, D., Sun, W., Sun, P., et al. (2024). Multi-well combined solution mining for salt cavern energy storages and its displacement optimization. Energy 288, 129792. doi:10.1016/j.energy.2023.129792
Li, J., Yang, T., Deng, W., Du, S., Zhang, Z., Ma, H., et al. (2025). Evaluating failure mechanisms of excavation-induced large-scale landslides in Xinjing open-pit coal mine through integrated UAV imagery and 3D simulation. Landslides 22 (6), 2021–2036. doi:10.1007/s10346-025-02460-8
Liang, W. G., Zhao, Y. S., and Wang, R. F. (2003). Inversion analysis of cavity shapes in salt rock solution mining. Min. Res. Dev. (04), 11–14. doi:10.3969/j.issn.1005-2763.2003.04.004
Liu, X. R., Jiang, D. Y., and Tan, X. H. (1999). Study on overlying rock subsidence and deformation laws in salt solution cavities. Industrial Minerals and Process. (7), 23–27. doi:10.16283/j.cnki.hgkwyjg.1999.07.007
Qiu, M. (2014). Analysis of surface subsidence and disaster conditions in Longgui nitrate-salt mine. Ground Water 36 (06), 209+235. doi:10.3969/j.issn.1004-1184.2014.06.080
Qiu, J. D., Huang, R., Wang, H., Wang, F., and Zhou, C. (2025). Rate-dependent tensile behaviors of jointed rock masses considering geological conditions using a combined BPM-DFN model: strength, fragmentation and failure modes. Soil Dyn. Earthq. Eng. 195. 109393. doi:10.1016/j.soildyn.2025.109393
Ren, S., Jiang, D. Y., and Yang, C. H. (2007). New three-dimensional probability integral prediction model for solution mining subsidence in salt rock. Rock Soil Mech. 28 (1), 133–138. doi:10.3969/j.issn.1000-7598.2007.01.025
Wang, Q. M. (1997). A brief history of solution mining in China's salt deposits. Salt Industry Hist. Res. (02), 30–36.
Wang, G. Y., Qiu, Z. L., and Ni, J. Z. (2007). Prediction and environmental impact analysis of surface subsidence in Jintan salt mining area, Jiangsu Province. Chin. J. Geol. Hazard Control (03), 131–133+135. doi:10.3969/j.issn.1003-8035.2007.03.028
Yang, C. H., Li, Y. P., and Ma, H. L. (2018). Special research report on surface subsidence disaster assessment of longgui nitrate-salt mine. Rock Soil Mech. Chin. Acad. Sci. 10.
Zhang, Z. P. (1994). The influence of shallow bridge solution mining on surface subsidence and its prevention measures. Chem. Eng. Des. Commun. 20 (1), 54–57.
Zhang, G. M., Wu, Y., Wang, L. J., Zhang, K., Daemen, J. J., and Liu, W. (2015). Time-dependent subsidence prediction model and influence factor analysis for underground gas storages in bedded salt formations. Eng. Geol. 187, 156–169. doi:10.1016/j.enggeo.2015.01.003
Zhang, G. M., Wang, Z. S., Wang, L. J., Chen, Y., Wu, Y., Ma, D., et al. (2019). Mechanism of collapse sinkholes induced by solution mining of salt formations and measures for prediction and prevention. Bull. Eng. Geol. Environ. 78 (3), 1401–1415. doi:10.1007/s10064-017-1173-6
Zhang, G. M., Liu, Y. X., and Wang, K. D. (2021). Large-area sudden subsidence model and disaster mechanism in solution mining of salt deposits. J. Min. and Saf. Eng. 38 (06), 1198–1209. doi:10.13545/j.cnki.jmse.2020.0257
Zhang, S., Sun, Y., Cao, J. T., Lai, X. P., and Wu, L. Q. (2025). Research and optimization on the strength recovery mechanism of post peak fragmentation grouting reinforcement in mining rock mass. Front. Mat. 12. doi:10.3389/fmats.2025.1612050
Keywords: solution mining, ground subsidence, salt rock, pillar dissolution, numerical simulation
Citation: Chen J, Liu X, Liu J and Wang P (2025) Study on the mechanism and control of ground subsidence induced by solution mining in Guangzhou Longgui Nitrate-Salt Mine. Front. Mater. 12:1630238. doi: 10.3389/fmats.2025.1630238
Received: 17 May 2025; Accepted: 06 August 2025;
Published: 08 September 2025.
Edited by:
Changtai Zhou, City University of Hong Kong, Hong Kong SAR, ChinaReviewed by:
Hewen Ma, China Coal Technology and Engineering Group Corp., ChinaJinduo Li, Northeastern University, China
Copyright © 2025 Chen, Liu, Liu and Wang. This is an open-access article distributed under the terms of the Creative Commons Attribution License (CC BY). The use, distribution or reproduction in other forums is permitted, provided the original author(s) and the copyright owner(s) are credited and that the original publication in this journal is cited, in accordance with accepted academic practice. No use, distribution or reproduction is permitted which does not comply with these terms.
*Correspondence: Xuchao Liu, MjMyMDMyMjYwNThAc3R1Lnh1c3QuZWR1LmNu