 Jie Shen*
 Dayu Qi
- School of Engineering, Shanghai Ocean University, Shanghai, China
A numerical model of the three-dimensional MAG welding arc for a butt joint with AH36 Steel, incorporating both the welding gap and molten pool structures, was developed. The multi-physical characteristics of the MAG welding arc—including temperature, velocity, and pressure—were analyzed under steady-state conditions for welding gaps ranging from 0 to 2 mm using COMSOL 6.1 software. A detailed comparison of arc morphology under different welding gaps was conducted to explore the mechanism by which variations in the welding gap affect the arc morphology. The results show that the MAG welding arc morphology is basically symmetrically distributed in the direction of the weld cross-section. The arc width and the area of the arc are both consequently larger with increase of welding gap. When the welding current is 150 A and the gap expands from 0 mm to 2 mm, the arc width and area increase by 23.6% and 29.7% respectively. However, in the welding advance direction, the distribution of the arc form is asymmetric due to the presence of a molten pool structure behind the wire. The asymmetry and area of the arc becomes more significant with increase of welding gap. When the welding current is 150 A and the gap increases from 0 mm to 2 mm, the arc area grows by 53.9%, and the arc position drops by 0.29 mm. Finally, the accuracy of the model was validated by a high-speed video camera to capture the arc morphology during welding with varying welding gaps.
1 Introduction
The welding process is one of the most important aspects of the ship manufacturing process. Metal Active Gas Arc Welding (MAG), the most important welding method in shipbuilding, is a highly efficient, economical, and process-adaptable welding technology. The core advantages of this process are manifested in its remarkable enhancement of arc stability, high thermal efficiency, significant reduction in welding spatter, and the formation of a dense weld seam microstructure (Zhao et al., 2018; Feng et al., 2023). In the welding-based manufacturing process of ship hulls, assembly gaps are inevitably present between steel-plate components. The instability and unpredictability of such gap values in the ship-hull welding process can cause mismatches in welding process parameters. These parameter mismatches, in turn, have an adverse effect on weld quality, giving rise to unsatisfactory appearance and defects (Yang et al., 2025).
Mou et al. (2025) demonstrated through adaptive experiments on welding parameters for welding gaps ranging from 0 to 1.5 mm, it was demonstrated that the absence of a gap adaptive system leads to surface defects such as burn-through when the gap exceeds a critical threshold. Ermis and Celikten (2021) systematically measured weld penetration and mechanical properties using robotic MAG welding for welding gaps spanning 0–2 mm. Results indicate that optimal performance is achieved at a joint gap distance of 2 mm between the two welded components. Long et al. (2025) pre-set the sample overlap spacing at 1.5 mm prior to the experiment, demonstrating that spacing exerts a significant influence on welding quality. Pu et al. (2020) found that the presence of a welding gap significantly altered the molten pool fluid dynamics, leading to a decline in weld quality. The reason for this phenomenon is that the presence of a welding gap directly affects the distance between the MAG welding wire and the steel plate part, which in turn causes the position, shape, and stability of the MAG welding arc to change.
The stability of the welding arc, the characteristics of heat input, and the arc morphology directly influence the weld shape, mechanical properties, and the propensity for defect formation (Chen et al., 2008). Li et al. (2025) captured the TIG welding process with a melt pool camera, thereby obtaining images of the welding arc morphology. By investigating the effect of different bevel widths on the laser-arc hybrid welding process, Song et al. (2025) found that narrower notches tend to increase the likelihood of arc interruption and droplet deflection, whereas wider bevel widths contribute to a more stable arc, more consistent droplet transition, and improved weld formation. Kim et al. (2006) observed that changes in the welding gap led to slight variations in arc length, arc constriction, and droplet detachment period. Similarly, Liao et al. (2024) experimentally demonstrated that an increase in the welding gap alters the arc morphology, leading to irregular changes in the shape of the molten pool and ultimately resulting in weld collapse. Cai et al. (2025) investigated the arc morphology at different welding gaps without the influence of an oscillating laser. Their findings indicate that at a 0 mm gap, the arc exhibits stable behavior with a well-defined shape. However, as the gap increases to 2.5 mm, the arc becomes unstable, and its shape becomes irregular.
The finite element method has become the mainstream approach for simulating welding processes (Ni et al., 2024). Similarly, the use of simulation models to investigate the characteristics of arc plasma during the Metal Active Gas Arc Welding (MAG) process has been widely adopted, with simulation models evolving from two-dimensional to more sophisticated three-dimensional structures (Ogino et al., 2016; Wang et al., 2020; Xiao et al., 2020; Villarreal-Medina et al., 2023). Fan et al. (2023) established a three-dimensional arc simulation model for MAG welding, and proved that under the action of an applied alternating magnetic field, the arc plasma is distributed in a “bell shape”, the arc stiffness is enhanced, and the arc temperature is higher than the temperature under the DC magnetic field. Dong et al. (2019) investigated the characteristics of the arc of a narrow-gap TIG welding and found the arc morphology, temperature field, and pressure field were all changed by changing the shape of the anode surface. Ogino et al. (2013) developed a model of a three-dimensional non-axisymmetric arc structure and found that the arc morphology changed significantly when welding on a base metal with a V-shaped bevel compared to a flat plate. However, their study focused solely on arc characteristics in the vertical bevel direction and did not account for changes in arc morphology in other directions. Murphy (2011) considered the effect of the molten pool on the weld arc morphology and incorporated a molten pool structure on a flat plate to observe the changes in the arc morphology in both directions. Zhan et al. (2025) investigated the effect of varying locking depths on the arc characteristics and found that the longitudinal morphology of the arc was elongated in order to be able to cover a deeper locking region when the locking depth was increased from 0 mm to 8 mm.
In summary, while extensive research has been conducted on the influence of base material surface shape and molten pool structure on arc morphology, studies specifically focusing on the effect of the welding gap on arc morphology remain limited. Therefore, a novel three-dimensional steady-state arc simulation model for the MAG welded butt joint of AH36 steel is developed in this paper, integrating both the welding gap and molten pool structures by using COMSOL 6.1 software. This model better reflects the actual engineering conditions. To comprehensively observe the variations in arc morphology with the welding gap, the study analyzes the changes not only in the weld cross-section direction but also in the welding advance direction, aiming to fully reveal the underlying mechanism. Furthermore, the simulation results are experimentally validated using high-speed camera-captured arc images, confirming the reliability of the conclusions.
2 Mathematical modeling of MAG welding arc
2.1 Basic assumptions
In this paper, a three-dimensional physical model integrating the welding arc, molten pool morphology, and base material is established to investigate the variation patterns of MAG welding arc morphology under different welding gaps. Since the three-dimensional arc model is under steady-state conditions, when modeling the molten pool structure, it is designed to have the morphology when the arc is stable. To simplify the model and reduce computation time, the following assumptions are made:
1. The arc is in local thermodynamics equilibrium (LTE). This means that electron and heavy particle temperatures are equal (Zhou et al., 2016);
2. The arc plasma is optically thin, and the reabsorption of arc radiation is ignored.
3. The physical properties of plasma are only functions of temperature.
4. Arc plasma and liquid metal are incompressible fluids, and the fluid flow state is laminar.
5. Both the base metal and the molten pool are assumed to be non-melting solids, and the influence of metal vapor is ignored (Li et al., 2024).
6. Ignore the process of droplet transfer and the flow of metal within the molten pool.
2.2 Governing equations
In this model, the welding arc is treated as a fluid, while the steel is considered a solid. The motion of the arc plasma is calculated using fluid dynamics equations, whereas for the solid, only heat transfer is considered.
Conservation of mass is represented in a three-dimensional coordinate system, as shown in Equation 1.
Conservation of momentum is represented in a three-dimensional coordinate system, as shown in Equations 2–4:
X-direction:
Y-direction:
Z-direction:
As shown in Equation 5, the conservation of energy is represented in a three-dimensional coordinate system:
In the equation:
In the equation:
To solve for the physical quantities of the electromagnetic field during the welding process, the current continuity equation is introduced, and its expression is given by Equation 7:
Ohm’s Law is expressed as Equation 8
Equations 9–12 is the magnetic vector potential equation:
Equation 13 is the electromagnetic force equations:
In the equation:
2.3 Physical model and boundary conditions
Figure 1a shows the experimental state with the actually photographed morphology of the molten pool. By measuring the molten pool structures at the ends of multiple groups of weld seams, the morphologies of the molten pool structures under different gaps were finally obtained, which provides a basis for the establishment of the model. Then, a three-dimensional numerical simulation model of the MAG welding arc, incorporating the welding base material, molten pool, wire, and shielding gas, is established, as shown in Figure 1b. The boundary conditions in the model are defined in Table 1, with their specific locations illustrated in Figure 1b. The base material selected is an AH36 marine steel plate with a thickness of 8 mm, a blunt edge of 1 mm, and a single-sided 25° Y-shaped groove. The molten pool depth is 4.5 mm, the length of the molten pool is 10 mm and the weld reinforcement height is 1.5 mm. The origin O of the coordinate system is at the spatial point where the central line of the welding wire intersects the surface of the base material. The welding wire has a diameter of 0.8 mm and a length of 13 mm. The shielding gas used is a mixture of 80% Ar and 20% CO2, with a height of 12 mm. The welding current is set at 120, 150, 180 A, as illustrated in Figure 1c.
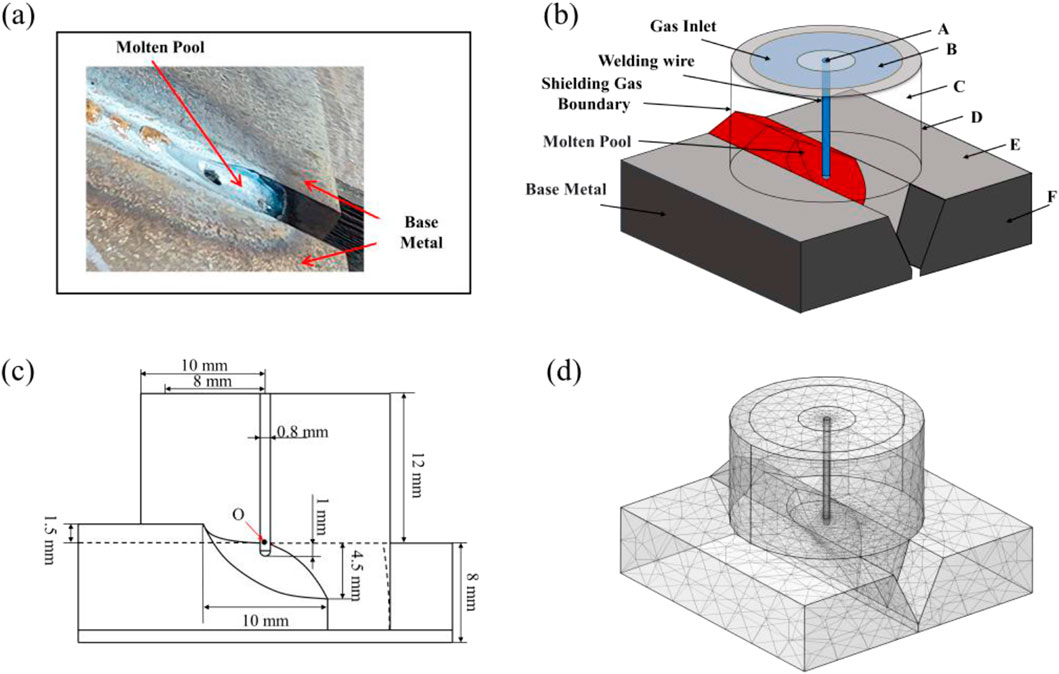
Figure 1. Three-dimensional MAG welding arc numerical modeling and meshing (a) base metal and molten pool; (b) model computational domain; (c) model dimensions; (d) meshing.
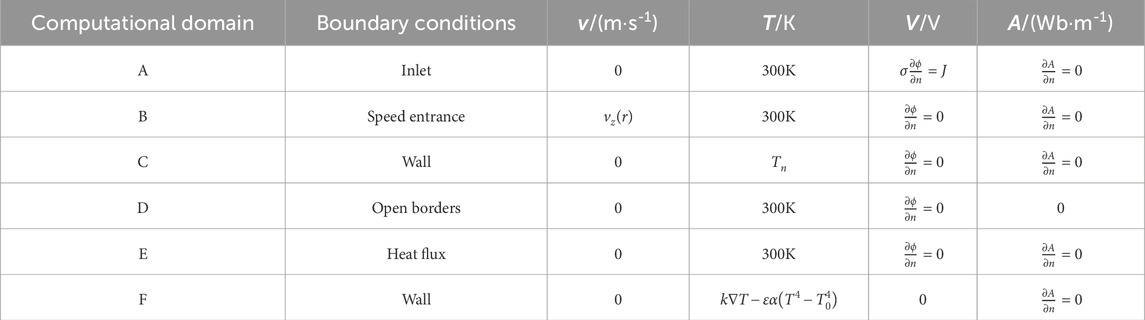
Table 1. Boundary conditions.
Since the cathode and anode are considered as non-melting solids, the interface between the arc region and the electrodes is set as a solid-fluid coupling interface. The heat convection and thermal radiation between the outer surface of the workpiece and the surrounding environment are determined by the following factors, as shown in Equation 14:
In the equation:
The welding current, represented by the current density at the end of the wire, is denoted as
Current density:
Initial temperature:
Velocity of shielding gas inlet (Hu and Tsai, 2007):
In the equation:
Between the arc and the cathode, there exists a non-LTE layer called the electrode sheath, in which the arc plasma no longer satisfies the LTE state (Li et al., 2024). Therefore, the aforementioned equations are not applicable to the calculation of the sheath layer. Thus, the “LTE diffusion approximation method” proposed by Lowke and Tanaka (2006) is employed to modify the heat transfer equation at the electrode sheath. The grid size in the near-electrode region is set to 0.1 mm, and which is approximate to the diffusion distance of electrons in the plasma.
The energy source term of the cathode sheath is determined by Equation 18:
In the equation: the first item represents the cooling effect of electron thermal emission on the cathode surface,
Equations 19–21 correspond to the Richardson-Dushman equation, through which the values of electron current density
In the equation:
The energy source term of anode sheath is determined from Equation 22 as shown:
In the equation: the first item on the right side of the equation represents the heating effect of electron recombination heat transfer on the anode,
Figure 1d presents the meshing of the 3D numerical model of the MAG welding arc with a 0 mm gap. The fluid and solid computational domains were meshed using COMSOL 6.1 software, employing a tetrahedral mesh structure. To optimize computational efficiency, the mesh size in the steel plate and wire regions was constrained between 0.1 mm and 4 mm. Since the welding arc relies on highly ionized plasma for energy conduction, mesh refinement was applied to the arc discharge region, with grid sizes ranging from 0.1 mm to 2.5 mm. The final mesh consisted of 47,680 elements, with 126,883 degrees of freedom.
2.4 Parameters of physical properties of shielding gases and experimental materials
In this model, the shielding gas for MAG welding is a mixture of 80% Ar and 20% CO2. Figure 2 shows the gas physical parameter curves of Ar and CO2 gases at high temperatures respectively (Tanaka et al., 2008; Murphy, 2010), the two gases are linked according to their relative volume fractions using COMSOL 6.1 software. The high-temperature properties of AH36 marine steel plate are shown in Table 2 (Tanaka et al., 2008; Murphy, 2010).
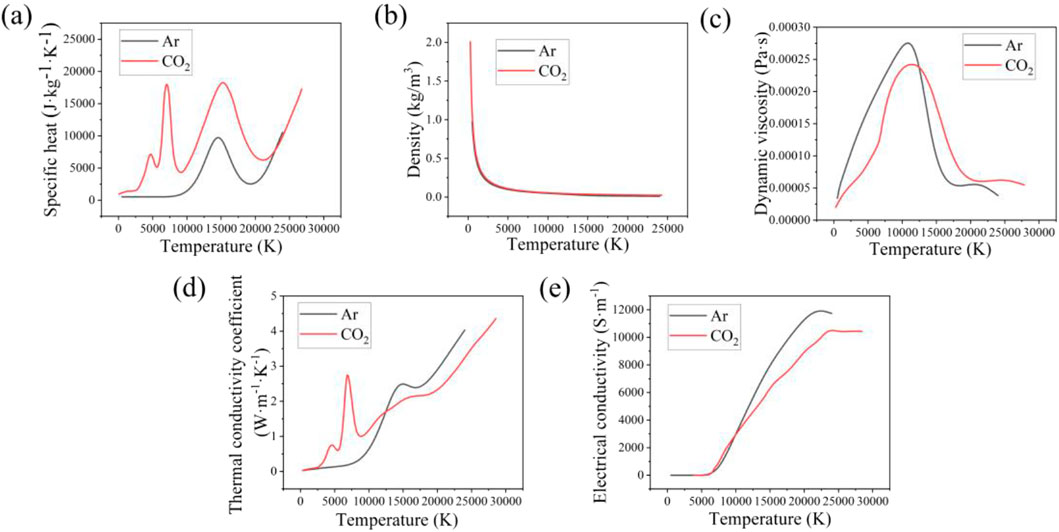
Figure 2. Parameters of physical properties of Ar and CO2 gases (Tanaka et al., 2008; Murphy, 2010) (a) density; (b) specific heat; (c) viscosity; (d) thermal conductivity; (e) electrical conductivity.
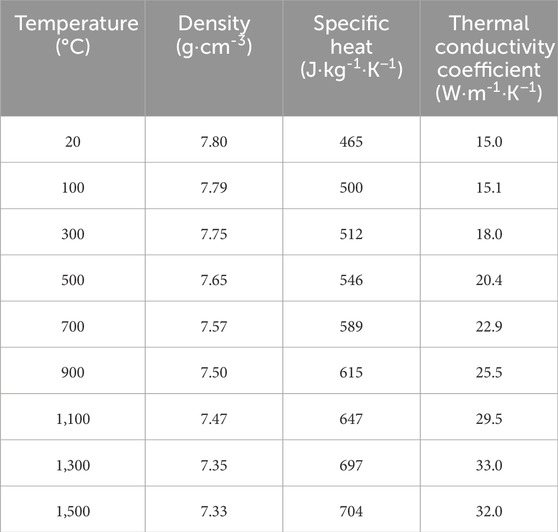
Table 2. AH36 physical property parameters (Liu et al., 2024).
3 Results
During the welding process of MAG welded butt joints, variations in the welding gap alter the geometry of the groove region, consequently affecting the morphology of the welding arc. The model incorporates the weld molten pool structure, which may cause asymmetric changes in arc temperature, pressure, and velocity in different directions, leading to an asymmetric arc physical field. Therefore, the effect of different welding gaps on arc morphology is analyzed from both the weld cross-section direction and the welding advance direction. To visualize the welding arc morphology, the temperature field is used as an indicator, with the arc edge temperature set at 8,000 K (Wang et al., 2018). Based on this, it becomes feasible to determine the width and area of the arc in both the weld cross-section direction and the welding advance direction, as shown in Figure 3.
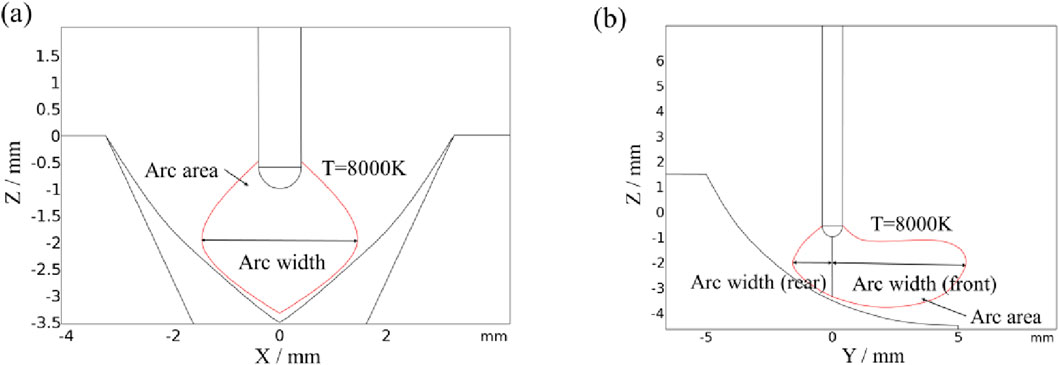
Figure 3. Schematic diagram of welding arc pattern (a) weld cross-section direction; (b) welding advance direction.
3.1 Arc temperature field distributions
Figure 4 shows the arc temperature distribution in the weld cross-section direction for welding gaps ranging from 0 to 2 mm. The arc exhibits a typical “bell-shaped” structure, being narrower at the bottom and wider at the top, with its lower edge distributed along the bevel. The highest temperature is located directly beneath the welding wire. With an increasing welding gap, the arc morphology changes, and the temperature distribution becomes more diffuse. Simultaneously, the heat-affected region at the arc center decreases, and the maximum temperature drops.
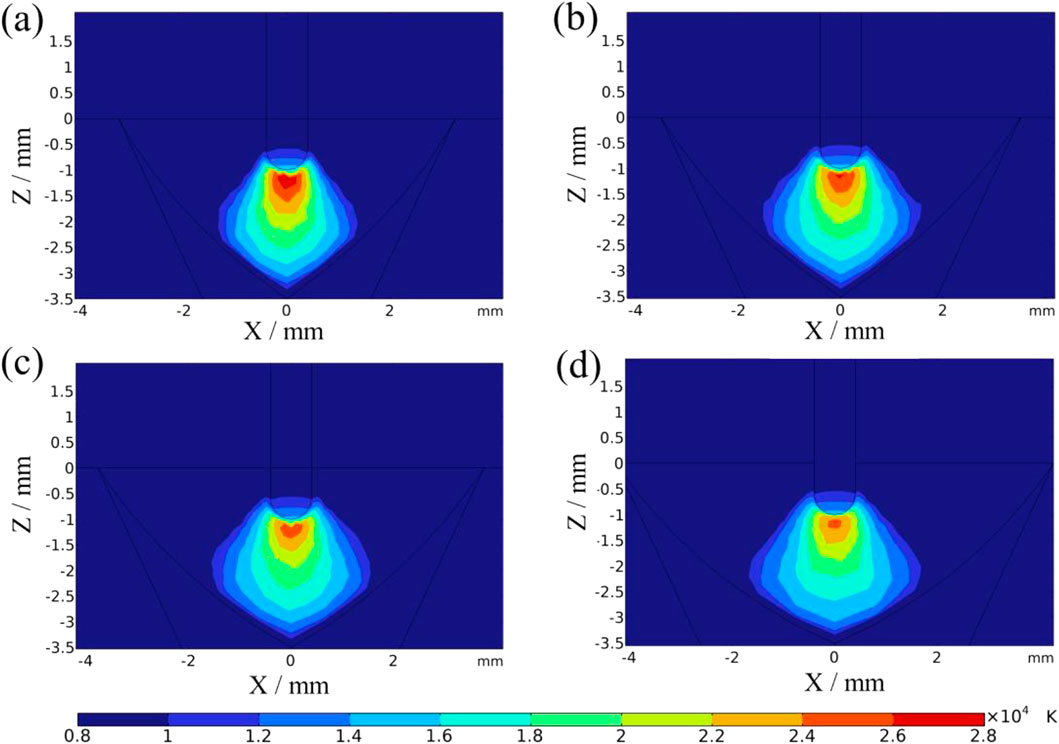
Figure 4. Arc temperature distribution in the direction of weld cross-section with different welding gaps (a) 0 mm; (b) 0.5 mm; (c) 1 mm; (d) 2 mm.
Figure 5 presents the temperature distribution of the arc in the welding advance direction under welding gaps ranging from 0 to 2 mm. As the molten metal in the welding advance direction accumulates behind the wire, the heat conduction path of the welding arc changes. The arc trailing the wire is confined to the edge of the molten pool, rendering it less variable. In contrast, the arc leading the wire is not geometrically restricted and thus can expand outward. As a result, the arc morphology in the welding advance direction becomes asymmetrical.
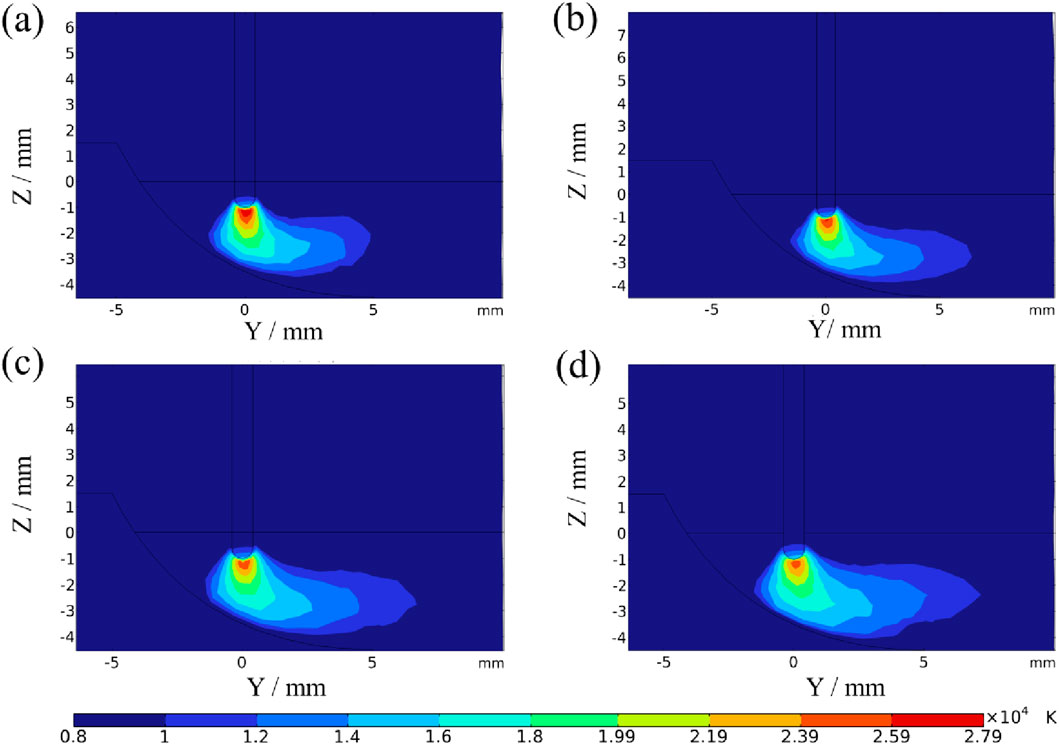
Figure 5. Arc temperature distribution in welding advance direction with different welding gaps (a) 0 mm; (b) 0.5 mm; (c) 1 mm; (d) 2 mm.
3.2 Arc velocity field distributions
To further explain the changes in welding arc morphology in the weld cross-section direction, it is necessary to analyze the distribution of the welding arc flow field. Figure 6 illustrates the arc velocity distribution in the weld cross-section direction for welding gaps ranging from 0 to 2 mm. The high-temperature region of the arc is concentrated at the tip of the welding wire, where the current density is typically highest. This results in a more intense acceleration of electrons and ions, leading to a higher plasma flow velocity directly beneath the wire. Meanwhile, the plasma at the arc edges flows along the groove surface toward the sides. As the plasma climbs upward along the groove, it interacts with the low-temperature shielding gas above, forming a vortex at the bottom of the molten pool. As the welding gap increases from 0 to 2 mm, the flow rate decreases due to the expanded spatial extent of the arc that needs to be affected, to maintain the conservation of fluid mass over time. At the same time, the lower temperature results in reduced ionization of the gas, causing a decrease in the concentration of charged particles. This leads to a reduction in arc conductivity and momentum transfer efficiency. Consequently, the maximum velocity of the welding arc decreases, and the vortex density at the bottom of the molten pool also diminishes.
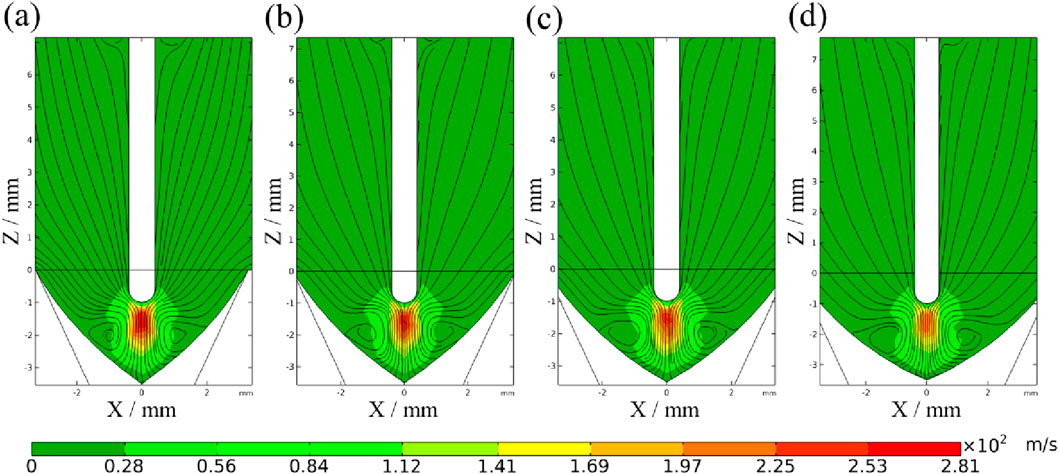
Figure 6. Arc velocity distribution in the direction of weld cross-section with different welding gaps (a) 0 mm; (b) 0.5 mm; (c) 1 mm; (d) 2 mm.
The arc speed and pressure distribution in the welding advance direction further explain the changes in arc morphology. Figure 7 show the arc speed under a 0 to 2 mm welding gap. In the welding advance direction, the accumulation of molten metal creates an asymmetric molten pool structure. Plasma flows upward along the molten pool, forming a vortex on the rear behind the wire. The peak velocity on the molten pool surface shifts toward the front of the wire. However, in the forward direction, the plasma is not constrained by a geometric structure and can diffuse freely, causing the vortex to gradually disappear.
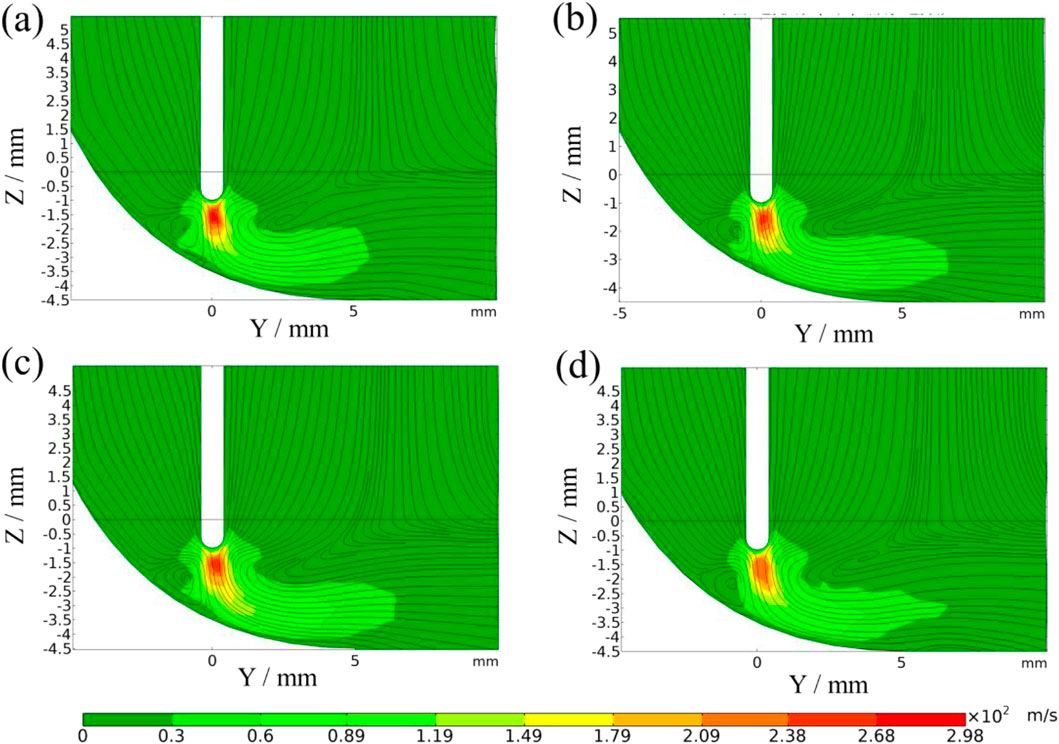
Figure 7. Arc velocity distribution in the welding advance direction with different welding gaps (a) 0 mm; (b) 0.5 mm; (c) 1 mm; (d) 2 mm.
3.3 Arc pressure field distributions
Figure 8 shows the arc pressure distribution in the direction of the weld cross-section under the 0 m∼2 mm welding gap. The arc pressure distribution is characterized by high pressure near the electrode and low pressure away from the electrode. As the end of the wire serves as the arc anode, the current density here is the highest, resulting in intense ionization and expansion of the plasma, forming a local high pressure. Moreover, the high-speed movement of the plasma will generate a large arc pressure when it impacts the surface of the steel, and a high-pressure zone is also formed on the cathode surface. With the increase of the welding gap, the distance from the wire to the groove increases, and the welding arc is stretched. As a result, the current density distribution becomes more decentralized, reducing the electromagnetic contraction force, and thus the arc pressure near the electrode decreases.
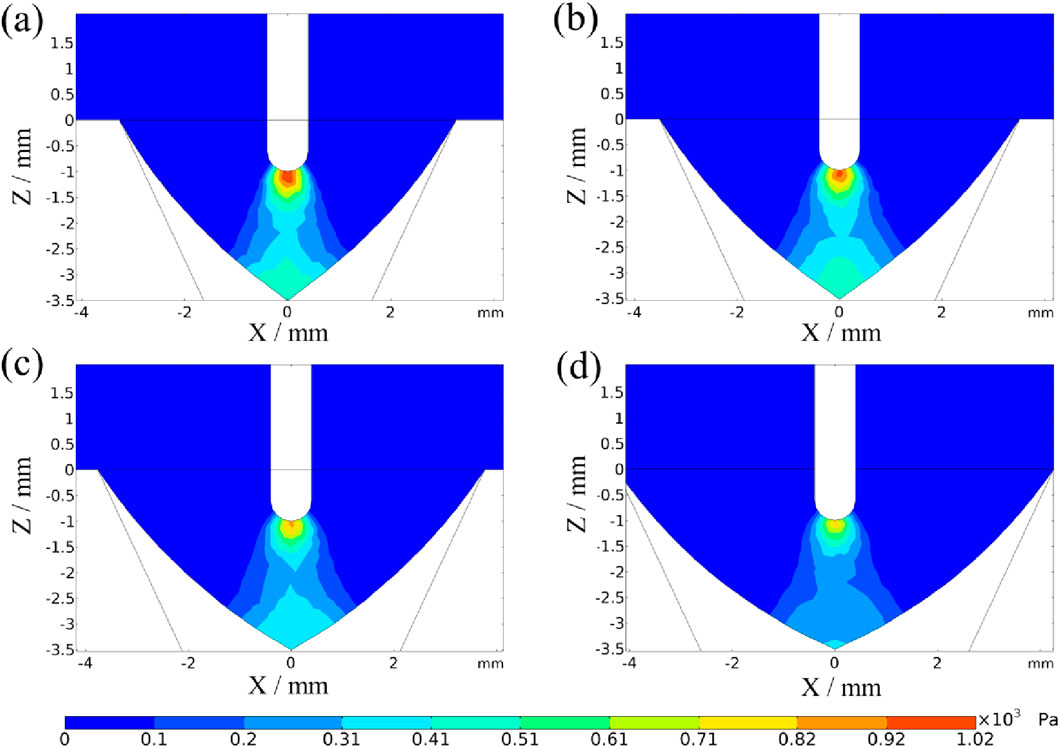
Figure 8. Arc pressure distribution in the direction of weld cross-section with different welding gaps (a) 0 mm; (b) 0.5 mm; (c) 1 mm; (d) 2 mm.
The arc pressure distribution in the welding advance direction further explain the changes in arc morphology. Figure 9 show the pressure distribution under a 0–2 mm welding gap. In the welding advance direction, the arc plasma impacts downward onto the molten pool, with the maximum pressure zone on the molten pool surface shifting toward the front of the wire.
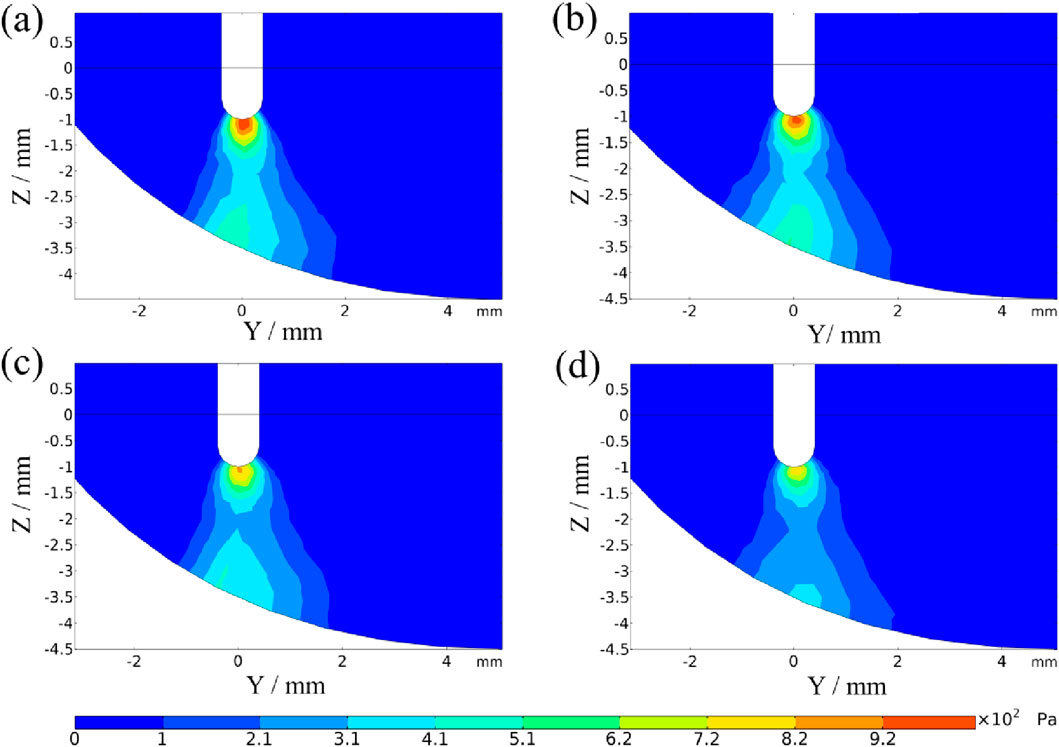
Figure 9. Arc pressure distribution in welding advance direction with different welding gaps (a) 0 mm; (b) 0.5 mm; (c) 1 mm; (d) 2 mm.
4 Discussion
4.1 The influence of welding gap on the distribution of arc morphology
In the weld cross-section direction, due to the increase in the welding gap, the physical constraints imposed by the groove are weakened, reducing the degree of compression of the arc plasma. As a result, the arc is no longer confined to a narrow region but spreads outward, covering a larger area, leading to an increase in both arc width and area. Figure 10 illustrates the variations in arc morphology in the weld cross-section direction under different welding gaps. When the welding gap is 0 mm, the arc width is 2.97 mm, and the arc area is 5.56 mm2. When the welding gap increases to 2 mm, the arc width and area expand to 3.67 mm and 7.21 mm2, respectively. Compared to the 0 mm gap, the arc width and area increase by 23.6% and 29.7%, respectively, at a 2 mm gap.
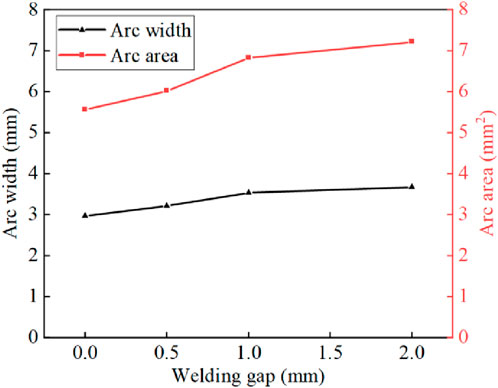
Figure 10. Morphological distribution of the arc under different welding gaps.
Figure 11 illustrates the front and rear widths, areas, and lowest position of the arc root in the welding advance direction under different welding gaps. With an increasing welding gap, the overall arc area expands. The arc width trailing the wire remains essentially invariant, whereas the arc width leading the wire exhibits an increment. This gives rise to a markedly elevated degree of arc asymmetry. Consequently, the arc instability is augmented, thereby exerting an impact on the weld quality. Additionally, the lowest position of the arc root moves downward, bringing it closer to the bottom of the steel plate, which increases the risk of weld penetration. When the welding gap is 0 mm, the front and rear widths of the arc are 1.62 mm and 6.03 mm, respectively. The arc area is 18.1 mm2, and the lowest position of the arc root is −3.85 mm. When the gap increases to 2 mm, the front and rear widths of the arc change to 1.63 mm and 9.87 mm, respectively. The arc area expands to 27.86 mm2 and the lowest position of the arc root shifts to −4.14 mm. The arc area at a 2 mm gap increases by 53.9%, and the arc position decreases by 0.29 mm, when compared to the 0 mm gap.
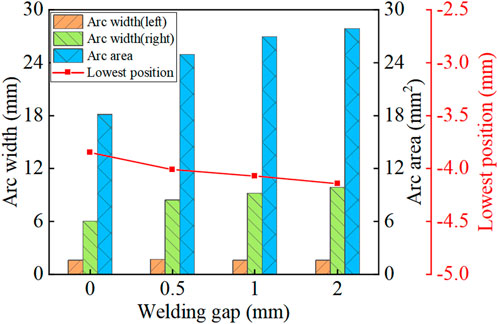
Figure 11. Anterior and posterior width, area, and lowest position of the arc in the welding advance direction with different gaps.
To further explain the mechanism of arc morphology variation with the welding gap, the laws of arc velocity field and pressure field changing with the welding gap are continuously analyzed. Figure 12 illustrates the velocity distribution 0.5 mm below the welding wire in the weld cross-section direction. When the arc velocity decreases, the plasma cannot be effectively concentrated, causing the arc to spread laterally and form a wider arc column. Additionally, at high arc velocity, the plasma flow primarily impacts the molten pool in the axial direction. However, at lower velocity, the energy disperses, and the plasma spreads radially. This results in the formation of a larger arc pattern when the welding gap is increased.
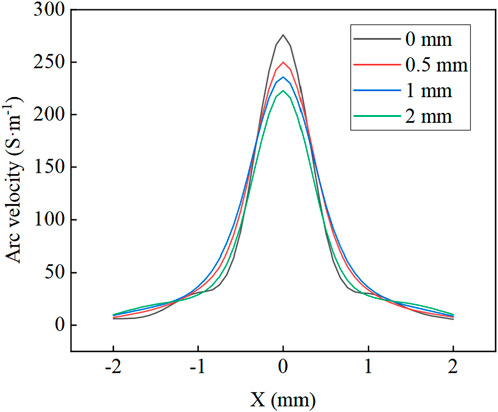
Figure 12. Arc velocity distribution curve at 0.5 mm below the wire with different welding gaps.
Through the analysis of the pressure field distribution in the weld cross-section direction, it is found that the maximum pressure value of the welding arc decreases when the welding gap increases, as shown in Figure 13. When the arc pressure decreases, the plasma cannot be concentrated and compressed in the arc high-pressure zone. This leads to a radial expansion of the plasma, which is distributed over a broader area, consequently inducing a change in the arc morphology.
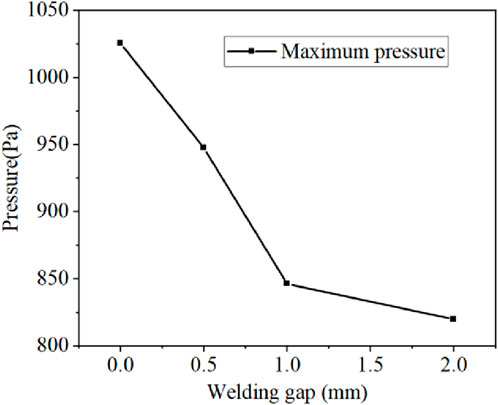
Figure 13. Maximum arc pressure under different welding gaps.
4.2 The influence of welding gap on the distribution of arc morphology under different welding currents
Based on the above analysis, the variation law of the welding arc with the welding gap under the same welding current was derived. To enhance the universality of the research findings, the influence of the welding gap on the welding arc was further analyzed under different welding currents as follows. Figure 14 shows the arc temperature distribution in the direction of the weld cross-section for welding currents of 120, 150, and 180 A, respectively, with gaps ranging from 0 to 2 mm. When the welding gap increases, under the condition of a constant welding current, the arc pattern exhibits a phenomenon where it expands as the welding gap increases. Meanwhile, there is a proportional relationship between the maximum arc temperature and the welding current. Figure 15 shows the trends of the arc morphology in the weld cross-section direction under different welding gaps and welding currents. Since the geometry and volume of the weld groove between the steel plates remain unchanged, the arc is compressed within the same-sized gap, and the arc form can only change within a limited space. Consequently, within the same gap, varying the welding current level did not lead to a significant change in the arc pattern.
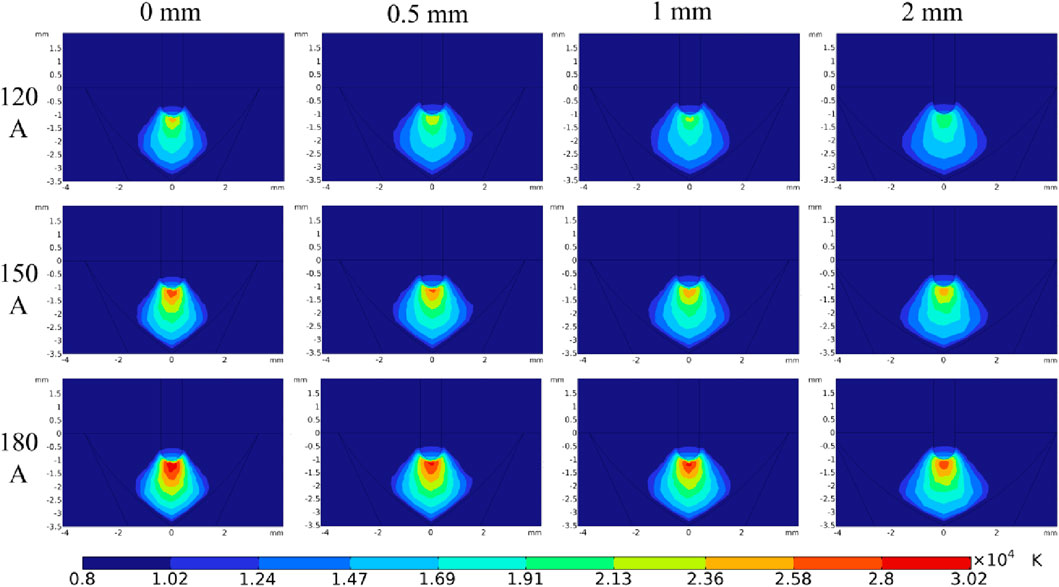
Figure 14. Arc temperature distribution in the direction of weld cross-section with different welding gaps and welding currents.
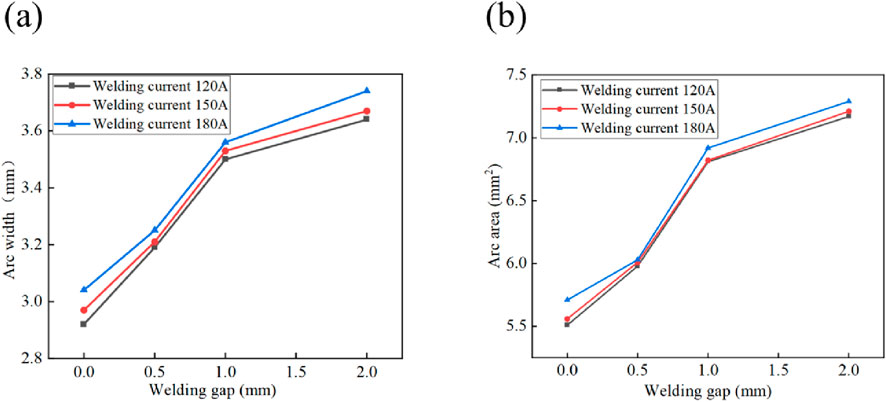
Figure 15. Arc morphology in the direction of the weld cross-section for different welding currents and welding gaps (a) Welding gap, current and maximum arc width; (b) Welding gap, current and arc area.
Figure 16 presents the arc temperature distribution in the welding advance direction for welding currents of 120, 150, and 180 A, under welding gaps ranging from 0 to 2 mm. The results reveal that as the welding gap increases, the arc area and width expand, even under the same welding current. Moreover, when the welding current varies, the maximum temperature of the arc under the same welding gap also changes. Meanwhile, with the increase in welding current, the position of the arc continuously shifts downward. Through the variation of the gap size and welding current, the arc width trailing the wire remains essentially constant, while that leading the wire undergoes significant changes. This causes the degree of arc asymmetry to shift substantially with alterations in the welding gap and welding current. The larger the welding gap and the higher the welding current, the greater the asymmetry in the welding advance direction. Figure 17 illustrates the trend of arc area in the welding advance direction under varying welding gaps and currents. For instance, at a 1 mm gap, the arc area for a welding current of 180 A is 33.43 mm2, whereas for 120 A, it is 22.33 mm2. This means that increasing the welding current from 120 A to 180 A results in a 49.7% increase in arc area.
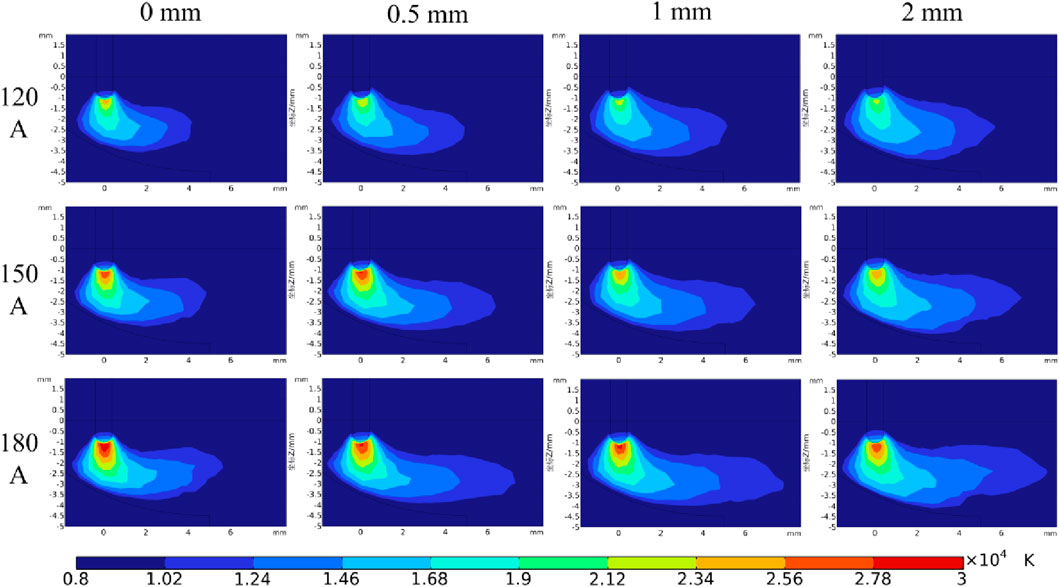
Figure 16. Arc temperature field in welding advance direction with different welding gaps and welding currents.
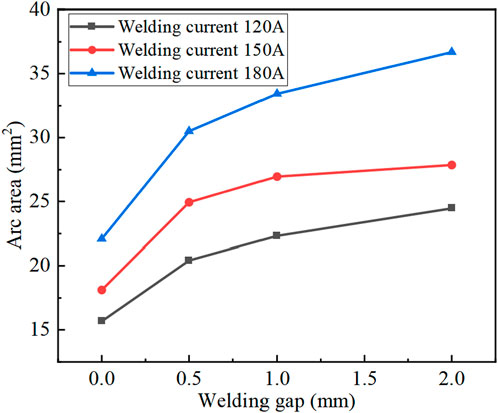
Figure 17. Arc area in welding advance direction for different welding currents and gaps.
5 Experimental validation
To verify the accuracy of the simulation results, MAG welding experiments were conducted on AH36 steel plates with different welding gaps for butt joints. The experimental setup included an LSQ-5 welding power source, a Fanuc M-20iA/12L 6-axis robotic arm controlled by an R-30iB Plus controller, and an AcutEye-1M-2000 high-speed camera system for real-time arc morphology monitoring, which were used to capture the MAG welding arc patterns for comparison with the simulation results. The shielding gas for MAG welding is a mixture of 80% Ar and 20% CO2. The process system built for the experiment is shown in Figure 18.
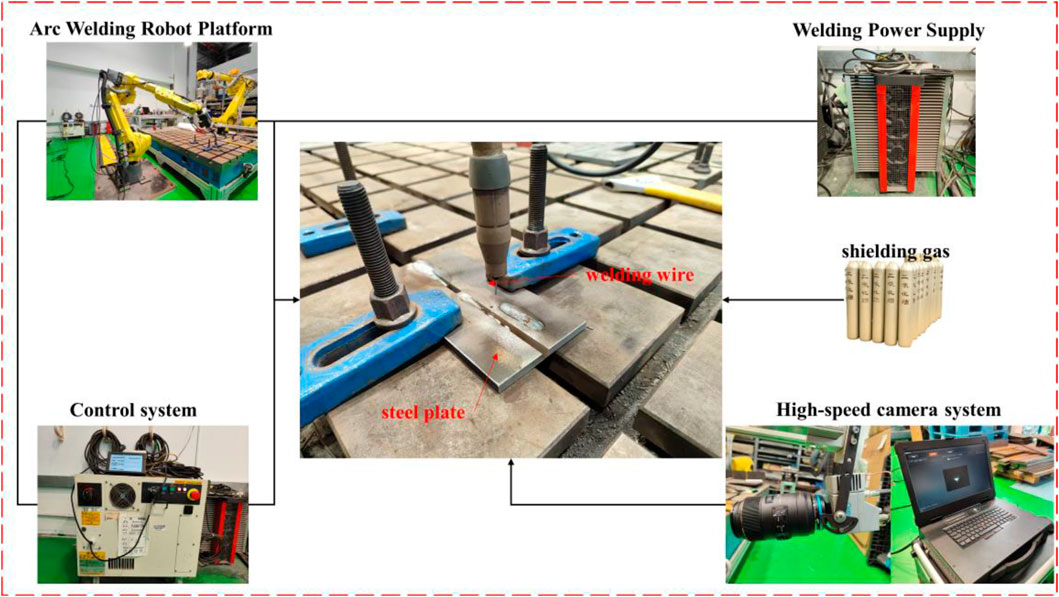
Figure 18. Composition of MAG welding process system.
During the MAG welding process, energy losses occur through thermal radiation, convection, heat conduction, evaporation, and spatter. Considering these loss mechanisms, the welding thermal efficiency is typically in the range of 0.65 to 0.9 (Radaj, 1992). To maintain experimental rigor, the welding current was set to 220 A, while the steel plate dimensions and shielding gas composition were kept identical to those in the arc simulation parameters. Finally, the camera exposure frame rate was set to 4,000 fps. The detailed experimental process parameters are listed in Table 3.
Table 3. Experimental parameters for different welding gaps.
Figure 19 compares the MAG welding arc morphology captured by a high-speed camera with the simulation results for 0, 0.5, and 1 mm welding gaps. The experimental and simulation results exhibit a high degree of consistency, verifying the accuracy of the numerical model. As is shown in the figure, the width of the groove cross-section expands, causing the welding arc to elongate laterally as the welding gap increases. This results in significant changes in both the width and area of the MAG welding arc. Additionally, the molten pool expands accordingly, becoming larger and more widely distributed due to the alteration in arc morphology. Figure 20 presents the arc dimensions captured by the high-speed camera. When the welding gaps are 0, 0.5 and 1 mm respectively, the actual welding arc widths captured by high-speed photography are 2.88, 3.1 and 3.51 mm; the actual welding arc areas are 2.97, 3.21 and 3.53 mm2. Compared to the arc morphology at a 0 mm gap, when the welding gap is increased to 1 mm, the arc width and arc area increase by 21.9% and 23.6%, respectively.
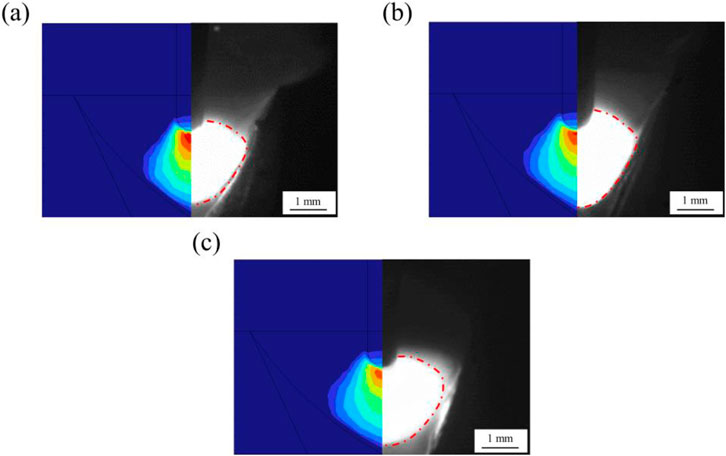
Figure 19. Comparison of arc morphology (a) 0 mm; (b) 0.5 mm; (c) 1 mm.
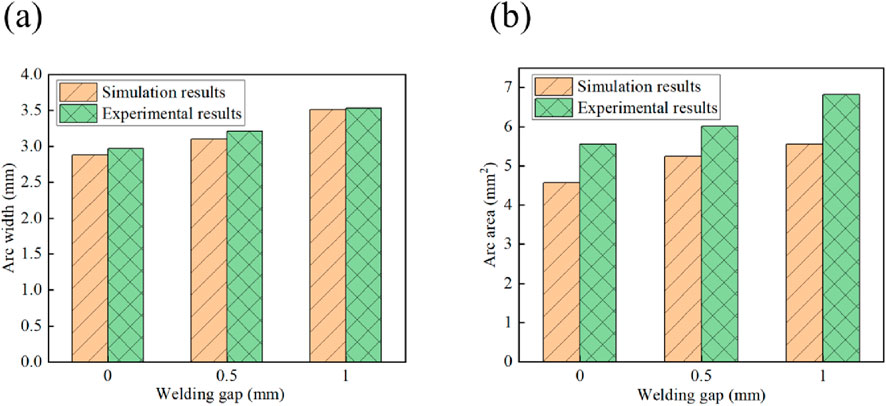
Figure 20. Comparison of arc dimensions (a) Arc width; (b) Arc area.
6 Conclusion
In this study, a three-dimensional numerical model of the welding arc for AH36 steel plates under different welding gaps was established to explore the impacts of welding gaps on arc morphology, temperature, velocity, and pressure fields. The main conclusions are as follows:
1. A three-dimensional arc simulation model for MAG welding, which incorporates both the welding gap structure and the molten pool structure, was developed. The accuracy of this model was verified through experiments.
2. The existence of a welding gap in the weld cross-section direction significantly affects the arc velocity and arc pressure. As the welding gap increases, both the velocity and pressure decrease. This phenomenon causes the plasma to be unable to cluster effectively and reduces the degree of its compression. Consequently, the arc spreads laterally, resulting in a wider arc pattern. When the welding current is 150 A and the gap increases from 0 mm to 2 mm, the arc width and area increase by 23.6% and 29.7% respectively.
3. In the welding advance direction, the arc morphology shows an asymmetric distribution. As the welding gap widens, the difference in arc width front and rear the wire becomes larger, enhancing its asymmetry. Meanwhile, the arc position descends, and the arc area expands. When the welding current is 150 A and the gap increases from 0 mm to 2 mm, the arc area grows by 53.9%, and the arc position drops by 0.29 mm.
Data availability statement
The original contributions presented in the study are included in the article/supplementary material, further inquiries can be directed to the corresponding author.
Author contributions
JS: Writing – review and editing. DQ: Writing – original draft, Writing – review and editing. RL: Writing – review and editing. SD: Writing – review and editing.
Funding
The author(s) declare that financial support was received for the research and/or publication of this article. This research was funded by the research Project of Shanghai Ocean University (D-8006-23-0008).
Conflict of interest
The authors declare that the research was conducted in the absence of any commercial or financial relationships that could be construed as a potential conflict of interest.
Generative AI statement
The author(s) declare that no Generative AI was used in the creation of this manuscript.
Any alternative text (alt text) provided alongside figures in this article has been generated by Frontiers with the support of artificial intelligence and reasonable efforts have been made to ensure accuracy, including review by the authors wherever possible. If you identify any issues, please contact us.
Publisher’s note
All claims expressed in this article are solely those of the authors and do not necessarily represent those of their affiliated organizations, or those of the publisher, the editors and the reviewers. Any product that may be evaluated in this article, or claim that may be made by its manufacturer, is not guaranteed or endorsed by the publisher.
References
Cai, C., Liu, Y., Wang, E., Chen, H., and Chen, Z. (2025). Mechanisms of gap bridging and hump suppression in oscillating laser-arc hybrid welding of thick plate steel under variable gap conditions. J. Mater. Process. Technol. 339, 118819. doi:10.1016/j.jmatprotec.2025.118819
Chen, Y., Miao, Y., Li, L., and Wu, L. (2008). Arc characteristics of laser-TIG double-side welding. Sci. Technol. Weld. Join. 13 (5), 438–444. doi:10.1179/174329308x341861
Dong, B., Cai, X., Ni, Z., Lin, S., Fan, C., and Yang, C. (2019). Numerical simulation of arc characteristics in narrow gap TIG welding. Int. J. Mech. Sci. 161, 105031. doi:10.1016/j.ijmecsci.2019.105031
Ermis, K., and Celikten, E. (2021). The effect of the gap between the materials on the weld penetration and mechanical values in the MAG butt weld joint. J. Eng. Res. Appl. Sci. 10 (1), 1650–1657.
Fan, D., Wang, Y., Li, D., and Huang, J. (2023). Numerical analysis of arc-droplet behavior in thin wire high current MAG welding with magnetic control. China Weld. 32 (4), 29–37. doi:10.12073/j.cw.20230331001
Feng, Z., Yuan, H., Liu, P., Xiang, X., Zeng, X., Li, X., et al. (2023). A rough-fuzzy control method for the penetration state of variable gap MAG welding. Trans. China Weld. Institution 44 (11), 22–35. doi:10.12073/j.hjxb.20230407003
Hu, J., and Tsai, H.-L. (2007). Heat and mass transfer in gas metal arc welding. Part II: the metal. Int. J. Heat Mass Transf. 50 (5-6), 808–820. doi:10.1016/j.ijheatmasstransfer.2006.08.026
Kim, Y.-P., Alam, N., Bang, H.-S., and Bang, H.-S. (2006). Observation of hybrid (Cw nd: YAG laser+ MIG) welding phenomenon in AA 5083 butt joints with different gap condition. Sci. Technol. Weld. Join. 11 (3), 295–307. doi:10.1179/174329306x107674
Li, K., Jia, C., Fang, C., Hu, J., Xu, S., Wang, Y., et al. (2024). Numerical simulation of the unique rotating arc behaviors during narrow-groove GTAW. J. Manuf. Process. 131, 1611–1623. doi:10.1016/j.jmapro.2024.09.109
Li, R., Ma, H., Wang, R., Song, H., Zhou, X., Wang, L., et al. (2025). Application of unsupervised learning methods based on video data for real-time anomaly detection in wire arc additive manufacturing. J. Manuf. Process. 143, 37–55. doi:10.1016/j.jmapro.2025.03.113
Liao, W., Wang, B., Wang, Z., Jiang, L., and Gao, M. (2024). Gap tolerance and molten pool destabilization mechanism in oscillating laser-arc hybrid welding of aluminum alloys. J. Mater. Process. Technol. 334, 118632. doi:10.1016/j.jmatprotec.2024.118632
Liu, W., Zhu, Y., and Sun, A. (2024). Analysis of dynamic stress-strain characteristics of AH36 steel welded joint. Trans. China Weld. Institution 45 (7), 50–58. doi:10.12073/j.hjxb.20230712001
Long, Z., Yongliang, H., Xuemei, D., Xin, L., Limeng, Y., Yuhua, C., et al. (2025). Formation mechanism of waveform interface in Mg/Al electromagnetic pulse welding. Mater. Today Commun. 45, 112401. doi:10.1016/j.mtcomm.2025.112401
Lowke, J., and Tanaka, M. (2006). LTE-diffusion approximation’for arc calculations. J. Phys. D Appl. Phys. 39 (16), 3634–3643. doi:10.1088/0022-3727/39/16/017
Mou, G., Zhang, T., Li, F., Hua, X., Xiang, H., Yang, X., et al. (2025). Research on gap-adaptive high frequency pulse arc welding of stainless-steel thin plate based on machine learning. J. Manuf. Process. 141, 1084–1097. doi:10.1016/j.jmapro.2025.03.045
Murphy, A. B. (2010). The effects of metal vapour in arc welding. J. Phys. D Appl. Phys. 43 (43), 434001. doi:10.1088/0022-3727/43/43/434001
Murphy, A. B. (2011). A self-consistent three-dimensional model of the arc, electrode and weld pool in gas–metal arc welding. J. Phys. D Appl. Phys. 44 (19), 194009. doi:10.1088/0022-3727/44/19/194009
Ni, Z., Li, B., Nazarov, A. A., Ma, J., Yuan, Z., Wang, X., et al. (2024). Simulation of ultrasonic welding of Cu/Cu joints with an interlayer of Cu nanoparticles. Mater. Today Commun. 39, 109330. doi:10.1016/j.mtcomm.2024.109330
Ogino, Y., Nomura, K., and Hirata, Y. (2013). Numerical analysis of arc plasma behaviour in groove welding with 3D TIG arc model. Weld. Int. 27 (11), 867–873. doi:10.1080/09507116.2012.715876
Ogino, Y., Hirata, Y., and Murphy, A. B. (2016). Numerical simulation of GMAW process using Ar and an Ar–CO 2 gas mixture. Weld. World 60, 345–353. doi:10.1007/s40194-015-0287-3
Pu, J., Zhao, Y., Jiang, Y., Zou, J., and Song, S. (2020). Influence of wire feeding speed on the melting behavior and formation of narrow-gap joint by laser welding with filler wire. J. Laser Appl. 32 (3), 032007. doi:10.2351/7.0000043
Song, L., Zhang, P., Li, Z., Zeng, J., Feng, J., Su, X., et al. (2025). Laser-arc hybrid welding of 25 mm high strength steel sections. Opt. and Laser Technol. 182, 112193. doi:10.1016/j.optlastec.2024.112193
Tanaka, Y., Yamachi, N., Matsumoto, S., Kaneko, S., Okabe, S., and Shibuya, M. (2008). Thermodynamic and transport properties of CO2, CO2–O2, and CO2–H2 mixtures at temperatures of 300 to 30,000 K and pressures of 0.1 to 10 MPa. Electr. Eng. Jpn. 163 (4), 18–29. doi:10.1002/eej.20467
Villarreal-Medina, R., Murphy, A. B., Méndez, P. F., and Ramírez-Argáez, M. A. (2023). Heat transfer mechanisms in arcs of various gases at atmospheric pressure. Plasma Chem. Plasma Process. 43 (4), 787–803. doi:10.1007/s11090-023-10328-9
Wang, F., Cressault, Y., Teulet, P., Li, H., Yang, K., and Yu, F. (2018). Use of radiative properties to determine temperature and vapours concentration in MAG welding arc (Ar–CO2–Fe plasmas). J. Phys. D Appl. Phys. 51 (41), 415202. doi:10.1088/1361-6463/aadb86
Wang, L., Chen, J., Wu, C., and Luan, S. (2020). Numerical analysis of arc and droplet behaviors in gas metal arc welding with external compound magnetic field. J. Mater. Process. Technol. 282, 116638. doi:10.1016/j.jmatprotec.2020.116638
Xiao, L., Fan, D., Huang, J., Tashiro, S., and Tanaka, M. (2020). 3D numerical study of external axial magnetic field-controlled high-current GMAW metal transfer behavior. Materials 13 (24), 5792. doi:10.3390/ma13245792
Yang, B., Xu, X., Liu, F., Wang, W., Chen, G., Wang, H., et al. (2025). The role of horizontal gaps on metal flow and heat transfer in bottom-locking welding joints. Int. J. Therm. Sci. 212, 109785. doi:10.1016/j.ijthermalsci.2025.109785
Zhan, J., Ye, X., Liu, Z., Zhong, S., Zhou, Y., Zhang, R., et al. (2025). Numerical investigation of dynamic arc behavior in K-TIG welding enhanced by an external sinusoidal alternating longitudinal magnetic field. Int. J. Therm. Sci. 212, 109744. doi:10.1016/j.ijthermalsci.2025.109744
Zhao, Y., Shi, X., Yan, K., Wang, G., Jia, Z., and He, Y. (2018). Effect of shielding gas on the metal transfer and weld morphology in pulsed current MAG welding of carbon steel. J. Mater. Process. Technol. 262, 382–391. doi:10.1016/j.jmatprotec.2018.07.003
Keywords: MAG welding, welding gap, arc morphology, arc characteristics, numerical simulation
Citation: Shen J, Qi D, Lai R and Du S (2025) Numerical research on the influence of welding gap on arc morphology in MAG welding of AH36 steel. Front. Mater. 12:1634466. doi: 10.3389/fmats.2025.1634466
Received: 24 May 2025; Accepted: 12 August 2025;
Published: 29 August 2025.
Edited by:
Shude Ji, Shenyang Aerospace University, ChinaReviewed by:
Mahmoud Ebrahimi, University of Maragheh, IranPedro Brito, Pontifical Catholic University of Minas Gerais, Brazil
Copyright © 2025 Shen, Qi, Lai and Du. This is an open-access article distributed under the terms of the Creative Commons Attribution License (CC BY). The use, distribution or reproduction in other forums is permitted, provided the original author(s) and the copyright owner(s) are credited and that the original publication in this journal is cited, in accordance with accepted academic practice. No use, distribution or reproduction is permitted which does not comply with these terms.
*Correspondence: Jie Shen, ZW1haWxAdW5pLmVkdQ==, ai1zaGVuQHNob3UuZWR1LmNu