- Department of Chemistry, Harbin University, Harbin, Heilongjiang, China
In this paper, a series of mesoporous CeO2-TiO2 mixed oxides are synthesized through evaporation-induced self-assembly method. These mesoporous CeO2-TiO2 mixed oxides are characterized using XRD, FT-IR, Raman, TEM and N2 adsorption-desorption. The obtained samples exhibit a fully ordered mesoporous structure, when the template is completely removed. The research results show that the mesoporous CeO2-TiO2 mixed oxides possess a high surface area and small particle size. The effects of Ti/Ce molar ratio on the photocatalytic activity are investigated. The results indicate that mesoporous CeO2-TiO2 composite oxides with Ti:Ce = 1:0.1, after calcination at 500°C, exhibit the highest photocatalytic activity.
1 Introduction
As a photocatalyst and hydrophilic material, nanometer TiO2 has the advantages of being non-toxic, cheap and easy to obtain. Its ability to deeply oxidize organic matter has shown good application value in environmental pollution control, self-cleaning, antibacterial and other fields, and it has been highly valued by domestic and foreign academic circles (Li et al., 2013; Wang et al., 2020). Among various nano-TiO2 materials, mesoporous TiO2 has garnered attention due to its 3D interconnected pore network that facilitates the diffusion of reactants and products, as well as its large surface area, which provides more active sites and thus higher photocatalytic activity (Zhou and Fu, 2012). CeO2 is the most active oxide catalyst in the rare earth oxide series, because it has a unique crystal structure, high oxygen storage capacity (OSC), oxygen release capacity and strong oxidation-reduction (Ce3+/Ce4+) capacity. This material has been widely used in the catalytic field (Nam et al., 2023; Malekkiani et al., 2022; Zhao et al., 2016). However, the specific surface area of pure CeO2 and TiO2 nanomaterials is small, and their thermal stability is poor. On the other hand, the low dispersion of the materials also affect the improvement of catalyst activity. The cubic phase CeO2 and TiO2 with three crystal phase structures (brookite, anatase and rutile phase) are prone to crystal phase changes during the use of catalysts, which will affect their performance.
Mesoporous CeO2-TiO2 composite oxides, as a class of high-performance and multifunctional materials, have attracted significant attention in applications such as rocket propellants, photocatalysts, intelligent fluid materials, sensing elements, high-intensity microwave dielectric ceramics, semiconductors, and other functional composites (Zhao et al., 2022; Wang et al., 2013; Rianjanu et al., 2024). Compared with a single pure oxide, oxide complex materials generally have a larger specific surface area, better thermal stability and mechanical strength, and a stronger surface acid-base (Nishikiori et al., 2019). The studies have shown that binary composite oxides, such as TiO2-SnO2, TiO2-WO3 and TiO2-SiO2 all show good catalytic activity, but mesoporous CeO2-TiO2 composite oxides are rarely reported. Compared to binary composite oxides, such as TiO2-SnO2, TiO2-WO3, and TiO2-SiO2, mesoporous CeO2-TiO2 composite oxides have shown superior performance due to the synergistic effects of the redox cycle between Ce3+/Ce4+ and the heterojunction with TiO2. They not only broaden the visible light absorption but also accelerate charge separation, possessing high catalytic activity, resistance to photochemical corrosion, and structural stability. The comprehensive performance is better than that of common binary oxides, like ZnO-TiO2 and WO3-TiO2. Recently, researchers have proposed a “promoter-porous structure-membrane coupling” strategy, which can significantly enhance the visible light activity of mesoporous CeO2-TiO2 composite oxides. So mesoporous CeO2-TiO2 composite oxides have become hotspots in the fields of photocatalytic water purification and solar hydrogen production.
Currently, the synthesis of mesoporous oxide particle materials mostly employs hard template methods. For instance, Feng et al. used polyethylene glycol-block-polypropylene glycol-block-polyethylene glycol (P123) as a template to synthesize a series of mesoporous TiO2 (MT) materials through hydrothermal procedures (Amer et al., 2018). In recent years, researchers have developed a new method for synthesizing mesoporous oxides, namely, solvent evaporation-induced self-assembly (SEISA) method. This method is a class of techniques that drive the spontaneous formation of ordered nanostructures by changing the evaporation rate of solvents. Compared to traditional hard template methods, SEISA has some advantages such as mild reaction conditions and adjustable material structure, which have attracted considerable attention from many researchers. For example, Arunachalam et al. prepared mesoporous titanium dioxide (lsm-TiO2) film electrocatalysts through the evaporation-induced self-assembly (EISA) method, and the porosity, orderliness, surface area, crystallinity, and activity of lsm-TiO2 can be controlled by adjusting the ratio of titanium precursor/surfactant (Liu et al., 2018); Huang et al. used the solvent evaporation-induced method to prepare mesoporous SnO2 (MGS) electrocatalysts (Amer et al., 2024).
In this paper, mesoporous CeO2-TiO2 composite oxides were synthesized via a solvent evaporation-induced self-assembly method under varying conditions. The effects of key factors, including the CeO2/TiO2 molar ratio and calcination temperature, on the structural properties of the composites were systematically investigated. The as-prepared materials were characterized by XRD, FT-IR, Raman spectroscopy, TEM, and N2 adsorption-desorption analysis. Furthermore, their photocatalytic activity under UV light irradiation was evaluated through the photodegradation of Rhodamine B as a model reaction. It is worth noting that this work provides a simple method for the preparation of mesoporous CeO2-TiO2 composite oxides with an adjustable pore size. The results of this study provide new ideas for the development of photocatalytic materials.
2 Experiment
2.1 Main instruments and reagents
X-ray diffractometer (Rigaku Corporation, Japan), Fourier transform infrared spectrometer (NICOLET, United States), Transmission electron microscope (PHILIPS, Netherlands), Raman spectrometer (HORIBA Jobin Yvon, France) Nitrogen adsorption-desorption analyzer (Quantachrome, United States), Ultraviolet Visible Spectrophotometer (Shimadzu).
Tetrabutyl titanate, cerium nitrate and other chemical reagents are analytically pure. Deionized water was used in all experiments.
2.2 Preparation of mesoporous CeO2-TiO2 composite oxides
The solution containing 1 g P123 and 12 mL anhydrous ethanol was added to the mixed solution containing 3.2 mL concentrated hydrochloric acid and 3.4 g of tetrabutyl titanate at room temperature, and the above solution stirred magnetically for 30 min. Then different amounts of Ce(NO3)3·6H2O were added to the mixed solution and magnetically stirred for 4 h to form sol. The obtained sol was aged at 30% relative humidity (RH) at room temperature for 24 h, then roasted at 350°C, 500°C, 600°C, 800°C, 1,000°C for 4 h, and the heating rate was 1°C min−1. Mesoporous CeO2-TiO2 composite oxide powders were prepared at different calcination temperatures. The molar ratios of Ti:Ce were 1:0.05, 1:0.1, 1:0.15, and 1:0.25. They were denoted as samples a, b, c and d, respectively.
2.3 Photocatalytic degradation of RhB by mesoporous CeO2-TiO2 composite oxides
The photocatalytic reaction was carried out in a self-made photocatalytic reactor, which consisted of a magnetic stirrer, a 50 mL beaker, and a water circulation cooling device. The photocatalytic degradation of Rhodamine B was used to evaluate the activity of mesoporous CeO2-TiO2 composite oxides as photocatalysts. Using a 20 W UV lamp as an external light source, 20 mL of 10 mg/L Rhodamine B aqueous solution and 0.1 g photocatalyst were added at room temperature to form a suspension system, which was first left in the dark for 20 min to achieve adsorption-dissociation equilibrium, and then subjected to a light reaction under magnetic agitation for 1 h. The resulting solution was centrifuged and the supernatant was removed. The absorbance of Rhodamine B at λ = 553 nm was measured by UV-VIS spectrophotometer. The degradation rate of Rhodamine B by mesoporous CeO2-TiO2 composite oxide photocatalyst was determined according to the change of absorbance. The calculation formula is expressed as Equation 1:
η ----- Efficiency of photocatalytic degradation of Rhodamine B.
A0 ----- Absorbance of the pre-reaction solution at 553 nm.
A ----- Absorbance of the post-reaction solution.
3 Results and discussion
3.1 Material characterization
3.1.1 X-ray diffraction (XRD) analysis
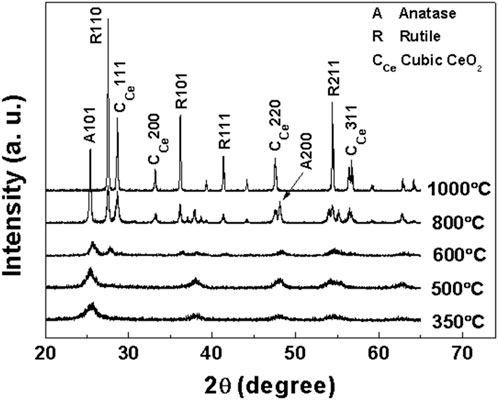
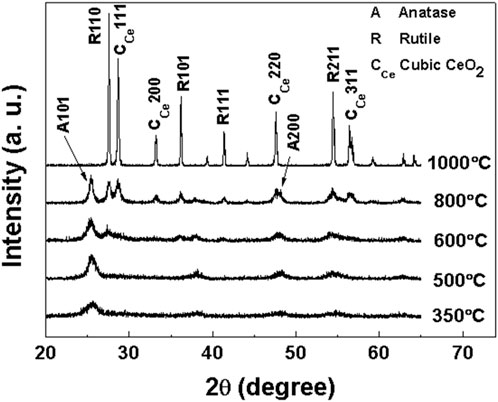
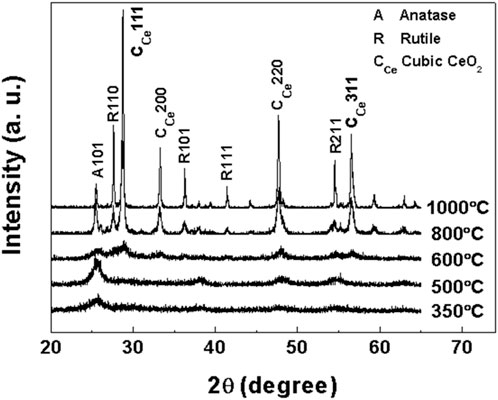
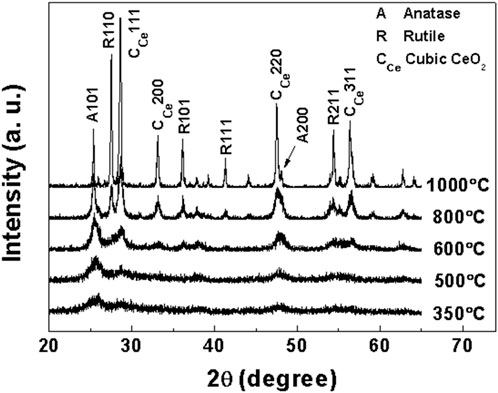
In order to determine the crystal structure of samples a, b, c and d at different calcination temperatures, the obtained samples were characterized by XRD. XRD patterns of samples a, b, c and d after roasting at different temperatures are shown in Figures 1–4, respectively.
As clearly observed from Figure 1, sample a (Ti:Ce = 1/0.05) calcined at 350°C exhibits a characteristic diffraction peak at 2θ = 25.34°, corresponding to the (101) crystal plane of the anatase phase (JCPDS No.020387). The broadened peak profile suggests the formation of small crystallites in the mesoporous TiO2 under this calcination condition. Based on the full width at half maximum of the (101) peak, the crystallite size is calculated to be 10.22 nm using the Scherrer equation: D = 0.89λ/βcosθ. With increasing calcination temperature, in addition to the (101) peak, more characteristic diffraction peaks appeared in the anatase phase, including (004), (200), (105), and (211). The progressive sharpening and intensification of these peaks indicate enhanced crystallinity and crystallite growth at elevated temperatures. At 600°C, the crystallite size of sample a reaches 22.83 nm, significantly larger than that of sample c (18.51 nm) under identical calcination conditions. Phase transformation from anatase to rutile TiO2 is observed at this temperature. The XRD pattern reveals well-defined rutile-phase diffraction peaks at 2θ = 27.46°, 36.11°, 41.31° and 54.42°, corresponding to the (110), (101), (111), and (211) crystal planes (JCPDS No.040551), while residual anatase phase remains detectable. At 800°C, a weak diffraction peak appears at 2θ = 28.56°, attributed to the (111) plane of cubic CeO2 (JCPDS No. 040593). Notably, all diffraction peaks progressively narrow and intensify with rising temperature, consistent with improved crystallinity and grain growth at higher thermal budgets. When the temperature reaches 1,000°C, the anatase-phase diffraction peaks (101), (004), (200), (105), and (211) disappear completely, and the final product comprises coexisting rutile TiO2 and cubic CeO2 phases.
As shown in Figure 2, sample b (Ti:Ce = 1:0.1) calcined at 350°C exhibits a characteristic diffraction peak at 2θ = 25.43°, corresponding to the (101) crystal plane of the anatase phase. Compared with sample a, this peak demonstrates broader profile and lower intensity, indicating smaller crystallites in sample b. The crystallite size is calculated to be 9.14 nm using the Scherrer equation. With increasing calcination temperature, the diffraction peaks sharpen significantly, accompanied by a progressive reduction in the full width at half maximum. The anatase-to-rutile phase transition initiates at 600°C. When the temperature reaches 800°C, distinct diffraction peaks of cubic CeO2 emerge at 2θ = 28.65°, 33.15°, 47.56°, and 56.35°, indexed to the (111), (200), (220), and (311) crystal planes, respectively. The intensity of these cubic-phase CeO2 peaks increases progressively with temperature. At 1,000°C, complete transformation of anatase TiO2 to the rutile phase is achieved. The final product consists of coexisting rutile TiO2 and cubic CeO2 phases, as evidenced by the absence of anatase-phase diffraction peaks.
As depicted in Figure 3, the XRD pattern of sample c (Ti:Ce = 1:0.15) calcined at 350°C reveals a broad diffraction peak at 2θ = 25.43°, corresponding to the (101) crystal plane of the anatase TiO2 phase. The intensity of this anatase-phase diffraction peak progressively increases with elevated calcination temperatures. These observations demonstrate that calcination temperature critically governs the crystallization behavior of the product, where higher thermal treatment enhances crystallinity.
Upon calcination at 600°C, the cubic CeO2 (111) diffraction peak initially emerges in sample c, with its phase formation temperature being notably lower than those required for cubic CeO2 crystallization in samples a and b. When the temperature is elevated to 800°C, partial anatase-to-rutile phase transformation occurs, as evidenced by the appearance of rutile-phase TiO2 diffraction peaks corresponding to the (110), (101), and (211) crystal planes. Even at 1,000°C, residual anatase-phase TiO2 persists in the sample. The sample at this stage comprises three coexisting crystalline phases: anatase, rutile and cubic phase CeO2 (Matussin et al., 2023; Zhao et al., 2012).
It can be clearly seen from Figure 4 that the XRD pattern of sample d (Ti:Ce = 1:0.25) after roasting at 350°C shows a characteristic diffraction peak of anatase phase (101) crystal face with weak strength and wide peak profile, which indicates that sample d still has a small particle size after roasting at 350°C. The cubic phase CeO2 (111) crystal diffraction peak (2θ = 30.24°) appear at 600°C, and its intensity was stronger than that of sample c at the same temperature. At 800°C, anatase transformed into rutile. After roasting at 1,000°C, the diffraction peaks of anatase and rutile TiO2 in sample d are sharper than those in sample c.
3.1.2 Infrared spectrum (FT-IR) analysis
The FT-IR spectra of samples a, b, c and d after roasting at 350°C are shown in Figure 5. The peaks at 3,200–3,600 cm−1 and 1,590 cm−1 are broad bands caused by O–H stretching vibrations, and the broad bands at 550–1,000 cm−1 are the stretching vibrations of Ti–O bonds in titanium dioxide crystals. The stretching vibration peaks attributed to Ce–O bonds appear near 1,384 cm−1, and the intensity of these peaks gradually increase with the increase of Ce content in mesoporous CeO2-TiO2 composite oxides. But the C–H vibration peak of template agent (P123) do not appear in the figure, indicating that P123 template agent have been basically removed after roasting at 350°C, which is consistent with XRD results. The complete removal temperature of the template agent as ionic surface-active agent is over 500°C. But the removal temperature of P123 as template agent is much lower. The removal of template agent at a higher temperature will result in partial mesoporous collapse. Therefore, the lower removal temperature of template agent is conducive to improving the specific surface area of mesoporous CeO2-TiO2 composite oxides.
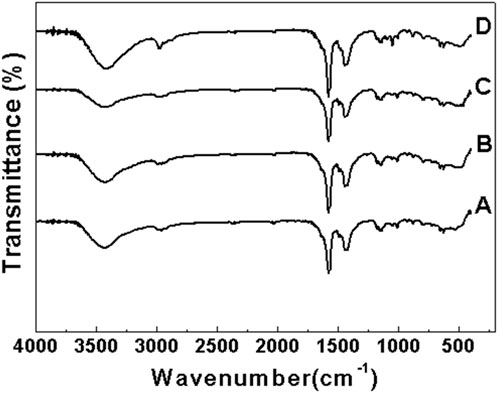
Figure 5. FT-IR spectra of samples a, b, c and d after roasting at 350°C (A) Sample a, (B) Sample b, (C) Sample c, and (D) Sample d.
3.1.3 Raman spectroscopy (Raman) analysis
Figure 6 shows the Raman spectra of samples a, b, c and d after roasting at 350°C. Raman testing is highly sensitive to chemical bonds, molecular spatial configurations, and phase transitions in composite oxides. From the Figure 6, it can be clearly seen that samples a, b, c and d show the characteristic Raman peaks of anatase TiO2 at 196, 396, and 637 cm−1 (Zhang et al., 2016; Cho et al., 2018), there is also an obvious Raman peak at 153 cm−1, which is the characteristic Raman peak of titanite TiO2. At the same time, it can be clearly seen from Figure 6 that with the increase of Ce content in the sample, the crystallization degree of TiO2 decreases in turn, and the characteristic Raman peak of the plate titanium type also decreases gradually. No Raman peaks of CeO2 are observed at this temperature, so samples a, b, c, and d do not form crystal CeO2 at this temperature. All these results are consistent with the XRD characterization results, and the above XRD and Raman characterization results show that CeO2 has a good inhibition effect on the crystal phase transition and grain growth and agglomeration of TiO2.
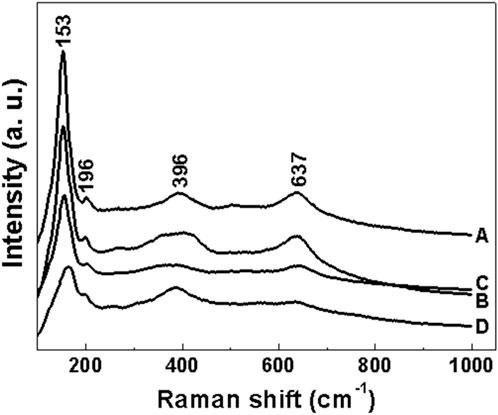
Figure 6. Raman spectra of samples a, b, c and d after roasting at 350°C (A) Sample a (B) Sample b (C) Sample c (D) Sample d.
3.1.4 N2 adsorption-desorption analysis
The N2 adsorption-desorption isotherms of samples a, b, c and d prepared by EISA method after roasting at 350°C and the adsorption pore size distribution of BJH are shown in Figures 7–10.
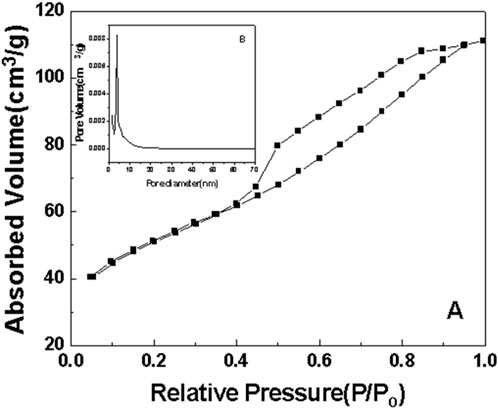
Figure 7. N2 adsorption-desorption curve of sample a after roasting at 350°C (A) N2 adsorption-desorption curve. (B) pore size distribution.
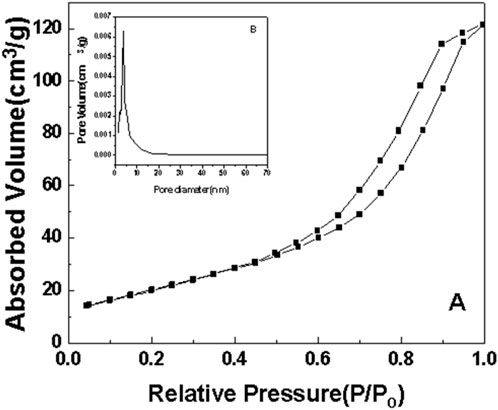
Figure 8. N2 adsorption-desorption curve of sample b after roasting at 350°C. (A) N2 adsorption-desorption curve. (B) pore size distribution.
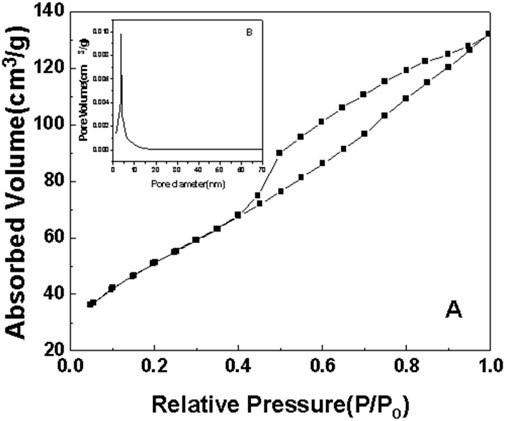
Figure 9. N2 adsorption-desorption curve of sample c after roasting at 350°C. (A) N2 adsorption-desorption curve. (B) pore size distribution.
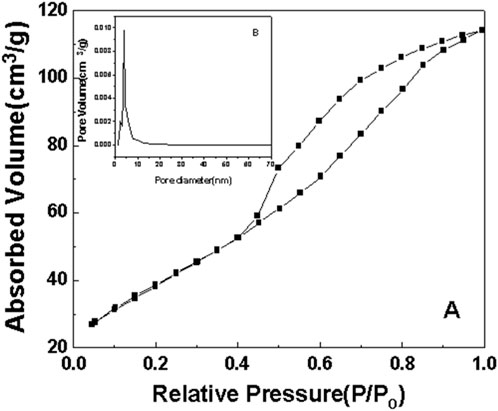
Figure 10. N2 adsorption-desorption curve of sample d after roasting at 350°C. (A) N2 adsorption-desorption curve. (B) pore size distribution.
As can be seen from the surface adsorption isotherms, the adsorption isotherms in Figures 7–10 belong to type IV, indicating that single-molecule adsorption forms at low pressure, and multi-layer adsorption occurs gradually as the pressure increases. When the relative pressure reaches a certain value, the adsorption amount hardly changes. Due to capillary condensation and capillary evaporation not occurring under the same relative pressure, the hysteresis ring appears. The hysteresis ring is caused by the thermodynamic equilibrium of the adsorption and desorption processes. The shape of the pore can be inferred according to the shape of the hysteresis ring. It can be seen from Figures 7, 9, 10 that the hysteresis rings of samples a, c, and d are all H2 types, and narrow triangular hysteresis rings appear in the range of moderate pressure to not too high pressure, and steps appear in the desorption curve, which is considered to be interconnected pores. However, if the H2 lag ring appears at a lower relative pressure limit (N2 is 0.4 at −196°C), it indicates that the pore is a cage pore with uniform height, which accords with the characteristics of the lag ring of porous oxides (Fu and Ren, 2020). It can be seen from Figure 8 that sample b has an obvious H1 type adsorption/desorption lag ring (Nadrah et al., 2025), which is a straight-through channel with both ends of the channel open, uniform pore size and narrow pore size distribution. There is an obvious desorption lag in the relative pressure range of p/p0 = 0.45–0.99, which is related to the capillary condensation of nitrogen in mesoporous channels at 77 K. This channel structure facilitates the diffusion of organic substances such as Rhodamine B on one hand, and increases the material’s specific surface area, exposing more active sites, which is highly beneficial for selective adsorption and enhancing the photocatalytic activity of anatase-type materials.
The illustrations in Figures 7–10 show the pore size distribution of samples a, b, c and d after roasting at 350°C, respectively. It can be seen from the figure that the pore size distribution curve of the samples is a peak. With the increase of CeO2 content, the mesoporous pore size of samples a, b, c and d gradually increases, indicating that a complete and uniform mesoporous structure is formed, and the obtained samples all have a narrow pore size distribution and a high degree of pore order.
It is found from the data in Table 1 that the specific surface area of the first three samples is large, and the total pore volume increases first and then decreases with the increase of temperature. Additionally, sample b has the largest specific surface area. Combined with the comprehensive analysis of the shape and pore size distribution of the adsorption isotherms, the mesoporous CeO2-TiO2 composite oxide results in mesoporous pores in the sample due to the removal of the template agent, which increases the specific surface area and total pore volume. With the further increase of CeO2 content, the SBET of the prepared sample d decreased. This is mainly because although the increase of CeO2 can increase the pore size, the decrease in the crystallinity of the composite oxide exceeded the increase of the specific surface area brought by the increase of the pore size of the synthesized composite oxide. The specific surface area and total pore volume of sample d are lower than that of samples a, b and c. Sample b’s high specific surface area provides it with numerous active sites, thereby exhibiting excellent photocatalytic performance.
3.1.5 Transmission electron microscopy (TEM) analysis
It can be seen from Figure 11 that samples a, b, c and d show relatively good dispersion, and the particle accumulation pores are evenly distributed, all of which are about 3∼6 nm. TEM images of samples a and b clearly show mesoporous CeO2-TiO2 composite oxides have fine pore structure and good ordering. TEM images along the direction perpendicular to the pore show an alternating arrangement of pore and skeleton structure, which increase the specific surface area of the sample. With the increase of Ce content in samples c and d, the structure of the sample gradually become loose, which is conducive to the formation of the pore structure of the sample and forms an orderly wormhole structure. These results show that the mesoporous CeO2-TiO2 composite oxide calcined at 350°C can not only remove the template agent but also have good crystallinity, and realize uniform composite of nanoscale structure.
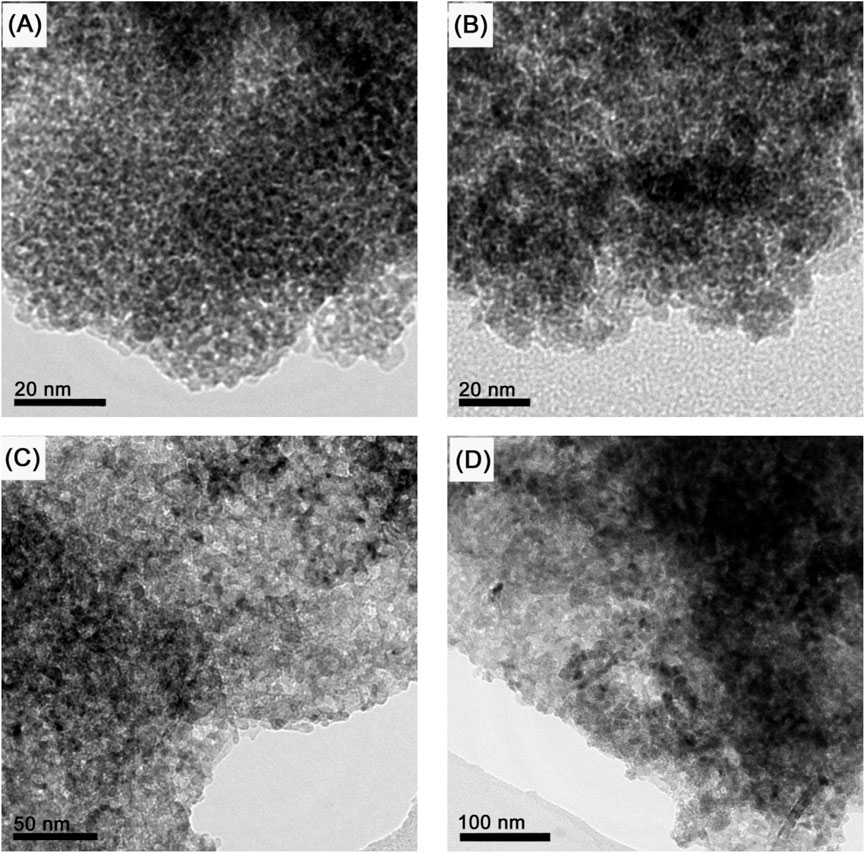
Figure 11. TEM photos of samples a, b, c and d after roasting at 350°C. (A) Sample a (B) Sample b (C) Sample c (D) Sample d.
3.2 Study on photocatalytic performance of mesoporous CeO2-TiO2 composite oxides
Figure 12 shows the photocatalytic degradation rates of Rhodamine B for samples a, b, c and d after roasting at different temperatures. It can be seen from the figure that due to the different molar ratio of Ti:Ce, there are certain differences in the photocatalytic performance of the sample. At the same temperature, the photocatalytic effect of sample b is generally better than that of the other three samples, and its degradation rate can reach 89.7%. Due to the addition of rare earth ions, rare earth oxides are small in size and evenly dispersed among TiO2 crystals. The rare earth ions entering the lattice interact with the TiO2 lattice, causing varying degrees of expansion of the TiO2 lattice. Micro local defects appear in the TiO2 lattice, and lattice field distortion occurs near the defects, providing favorable redox potential wells. It becomes a photogenerated electron trap and prevents the recombination of electrons and hole pairs (Liu et al., 2011; Rosa et al., 2023), thus increasing the degradation rate. However, with the increase of lattice distortion, the distortion point becomes the composite center of electron and hole pairs, so the Ti/Ce molar ratio of CeO2-TiO2 composite oxide has an optimal value (Ti:Ce = 1:0.1). Although the CeO2 content increase in samples c and d, rare earth ions no longer entered the TiO2 lattice but attached to the surface of TiO2 nanoparticles. This results in a reduction of the specific surface area of TiO2, leading to lower photocatalytic degradation efficiency. This also indicate that there should be an optimal value. The sintering temperature has a significant impact on the photocatalytic activity of oxide complexes. As the sintering temperature increases, the photocatalytic efficiency of the samples initially rises and then decreases. Additionally, it was observed from the graph that when Ti:Ce = 1:0.1 (sample b), after sintering at 500°C, sample b achieves a photocatalytic degradation rate of 89.7%, maintaining high photocatalytic activity over a wide temperature range. This is significantly higher than the photocatalytic degradation rate of commercial Degussa P25 TiO2 powder material (80%).
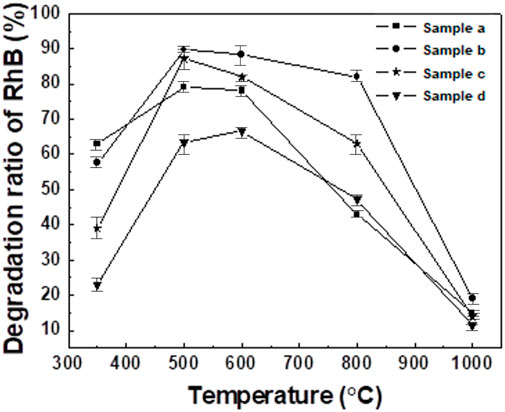
Figure 12. Photocatalytic degradation rate of Rhodamine B of samples a, b, c and d obtained at different calcination temperatures.
3.3 Proposed photocatalytic enhancement mechanism
In CeO2-TiO2 composite oxides, the radius of Ce4+ is 0.097 nm, which is significantly larger than that of Ti4+. Therefore, Ce4+ is difficult to substitute for Ti4+ in the TiO2 lattice, while Ti4+ more easily substitutes for Ce4+, leading to charge imbalance. To compensate for this charge imbalance, the reaction occurs as shown in Equation 2:
Due to the stability of rare earth elements’ 4f orbitals when they are fully empty, half-filled, or fully filled, the potential energy level of electrons in TiO2 is −0.1 eV, whereas the potential energy level for the reduction reaction between Ce4+ and Ce3+ is 1.84 eV. Consequently, the reaction also takes place as shown in Equation 3:
In the sample, Ce ions coexist in both Ce3+ and Ce4+ oxidation states, with Ce4+ continuously capturing electrons. The captured electrons find it difficult to recombine with holes, effectively promoting the separation of photogenerated electrons and holes, thereby enhancing the photocatalytic activity of TiO2. Additionally, Ce3+ can reduce O2 to O2-, and surface adsorbed hydroxide ions can react with excess photogenerated holes to form active hydroxyl radicals as shown in Equations 4, 5:
The generated highly oxidative active hydroxyl radicals and active oxygen ions participate in degradation reactions, further enhancing photocatalytic activity.
4 Conclusion
In this paper, mesoporous CeO2-TiO2 composite oxides with uniform pores were synthesized in non-aqueous media by solvent evaporation-induced self-assembly method. Research results show that the introduction of CeO2 significantly inhibits the crystal phase transition, grain growth, and agglomeration of TiO2, making it highly thermally stable and capable of maintaining the anatase crystal phase over a wide temperature range. With the decrease of Ti/Ce ratio, the particle size of mesoporous CeO2-TiO2 composite oxide decrease significantly, while the specific surface area, pore volume, average pore size and other structural parameters increase significantly. The photocatalytic test results show that the mesoporous CeO2-TiO2 composite oxide have good photocatalytic performance, and the Ti:Ce composite ratio have a certain effect on the degradation rate of Rhodamine B. The catalytic effect is the best when Ti:Ce = 1:0.1, and the degradation rate reached 89.7%.
Data availability statement
The original contributions presented in the study are included in the article/supplementary material, further inquiries can be directed to the corresponding author.
Author contributions
HY: Writing – original draft, Writing – review and editing, Funding acquisition, Methodology. HG: Data curation, Writing – original draft. XL: Formal Analysis, Writing – review and editing. HH: Validation, Writing – review and editing.
Funding
The author(s) declare that financial support was received for the research and/or publication of this article. This work was supported by the Natural Science Foundation of Heilongjiang Province (LH2022E035), Key Research and Development Plan Guided Project of Heilongjiang Province (GZ20230004), Key Project of Natural Science Foundation of Heilongjiang Province (ZD2021E005), National Innovation and Entrepreneurship Training Program for College Students (202410234048).
Conflict of interest
The authors declare that the research was conducted in the absence of any commercial or financial relationships that could be construed as a potential conflict of interest.
Generative AI statement
The author(s) declare that no Generative AI was used in the creation of this manuscript.
Publisher’s note
All claims expressed in this article are solely those of the authors and do not necessarily represent those of their affiliated organizations, or those of the publisher, the editors and the reviewers. Any product that may be evaluated in this article, or claim that may be made by its manufacturer, is not guaranteed or endorsed by the publisher.
References
Amer, M. S., Ghanem, M. A., Al-Mayouf, A. M., and Arunachalam, P. (2018). Low-symmetry mesoporous titanium dioxide (lsm-TiO2) electrocatalyst for efficient and durable oxygen evolution in aqueous alkali. J. Electrochem. Soc. 165 (7), H300–H309. doi:10.1149/2.0061807jes
Amer, M. S., AlOraij, H. A., Huang, K. W., and Al-Mayouf, A. M. (2024). Gray mesoporous SnO2 catalyst for CO2 electroreduction with high partial current density and formate selectivity. Environ. Res. 252 (2), 118897. doi:10.1016/j.envres.2024.118897
Cho, H. W., Liao, K. L., Yang, J. S., and Wu, J. J. (2018). Revelation of rutile phase by raman scattering for enhanced photoelectrochemical performance of hydrothermally-grown anatase TiO2 film. Appl. Surf. Sci. 440, 125–132. doi:10.1016/j.apsusc.2018.01.139
Fu, N., and Ren, X. C. (2020). Synthesis of double-shell hollow TiO2@ZIF-8 nanoparticles with enhanced photocatalytic activities. Front. Chem. 8, 578847. doi:10.3389/fchem.2020.578847
Li, M. H., Zhang, S. J., Lv, L., Wang, M. S., Zhang, W. M., and Pan, B. C. (2013). A thermally stable mesoporous ZrO2-CeO2-TiO2 visible light photocatalyst. Chem. Eng. J. 229, 118–125. doi:10.1016/j.cej.2013.05.106
Liu, H., Wang, M. Y., Wang, Y., Liang, Y. G., Cao, W. R., and Su, Y. (2011). Ionic liquid-templated synthesis of mesoporous CeO2-TiO2 nanoparticles and their enhanced photocatalytic activities under UV or visible light. J. Photochem. Photobiol. A Chem. 223, 157–164. doi:10.1016/j.jphotochem.2011.06.014
Liu, L., Zhang, Y., Dong, S., Zhang, B., Meng, S. X., Xu, J. L., et al. (2018). Template controlled synthesis of mesoporous TiO2 particles for efficient photoanodes in dye sensitized solar cells. J. Electrochem. Soc. 165 (2), F1–F6. doi:10.1149/2.0191802jes
Malekkiani, M., Ravari, F., Magham, A. H. J., Dadmehr, M., Groiss, H., Hosseini, H. A., et al. (2022). Fabrication of graphene-based TiO2@CeO2 and CeO2@TiO2 core-shell heterostructures for enhanced photocatalytic activity and cytotoxicity. ACS Omega 7, 30601–30621. doi:10.1021/acsomega.2c04338
Matussin, S. N., Khan, F., Harunsani, M. H., Kim, Y. M., and Khan, M. M. (2023). Visible-light-induced photocatalytic and photoantibacterial activities of Co-Doped CeO2. ACS Omega 8, 11868–11879. doi:10.1021/acsomega.2c07058
Nadrah, P., Knap, M., Sagar, T. V., Škapin, A. S., and Štangar, U. L. (2025). Effect of ce:ti ratio and cerium salts on the properties of mesoporous Ti-Ce oxides and their photocatalytic activity. Catal. Today 449, 115204. doi:10.1016/j.cattod.2025.115204
Nam, J. W., Pham, V. N., Ha, J. M., Shin, M. J., Lee, H., and Youn, Y. S. (2023). Photocatalysis of Cr- and Fe-doped CeO2 nanoparticles to selective oxidation of 5-hydroxymethylfurfural. Nanomaterials 13 (1), 44. doi:10.3390/nano13010044
Nishikiori, H., Harata, N., Yamaguchi, S., Ishikawa, T., Kondo, H., Kikuchi, A., et al. (2019). Formation of CuO on TiO2 surface using its photocatalytic activity. Catalysts 9, 383. doi:10.3390/catal9040383
Rianjanu, A., Marpaung, K. D. P., Siburian, C., Muhtar, S. A., Khamidy, N. I., Widakdo, J., et al. (2024). Enhancement of photocatalytic activity of CeO2 nanorods through lanthanum doping (La-CeO2) for the degradation of Congo red dyes. Results Eng. 23, 102748. doi:10.1016/j.rineng.2024.102748
Rosa, R. H., Silva, R. S., Nascimento, L. L., Okura, M. H., Patrocinio, A. O. T., and Rossignolo, J. A. (2023). Photocatalytic and antimicrobial activity of TiO2 films deposited on fiber-cement surfaces. Catalysts 13, 861. doi:10.3390/catal13050861
Wang, Y. G., Li, B., Zhang, C. L., Cui, L. F., Kang, S. F., Li, X., et al. (2013). Ordered mesoporous CeO2-TiO2 composites: highly efficient photocatalysts for the reduction of CO2 with H2O under simulated solar irradiation. Appl. Catal. B Environ. 130-131, 277–284. doi:10.1016/j.apcatb.2012.11.019
Wang, K., Zhuo, Y., Chen, J., Gao, D. W., Ren, Y., Wang, C. X., et al. (2020). Crystalline phase regulation of anatase-rutile TiO2 for the enhancement of photocatalytic activity. RSC Adv. 10, 43592–43598. doi:10.1039/D0RA09421H
Zhang, Y., Wu, W., Zhang, K., Liu, C. H., Yu, A. F., Peng, M. Z., et al. (2016). Raman study of 2D anatase TiO2 nanosheets. Phys. Chem. Chem. Phys. 18, 32178–32184. doi:10.1039/C6CP05496J
Zhao, C. Y., Liu, L. J., Zhang, Q. Y., Wang, J., and Li, Y. (2012). Photocatalytic conversion of CO2 and H2O to fuels by nanostructured Ce-TiO2/SBA-15 composites. Catal. Sci. Technol. 2, 2558–2568. doi:10.1039/C2CY20346D
Zhao, J., Wang, Y., Li, Y. X., Yue, X., and Wang, C. Y. (2016). Phase-dependent enhancement for CO2 photocatalytic reduction over CeO2/TiO2 catalysts. Catal. Sci. Technol. 6, 7967–7975. doi:10.1039/C6CY01365A
Zhao, S., Riedel, M., Patarroyo, J., Bastús, N. G., Puntes, V., Yue, Z., et al. (2022). Tailoring of the photocatalytic activity of CeO2 nanoparticles by the presence of plasmonic Ag nanoparticles. Nanoscale 14, 12048–12059. doi:10.1039/D2NR01318E
Keywords: mesoporous CeO2-TiO2 mixed oxides, mesoporous structure, characterize, evaporation-induced self-assembly method, photocatalysis
Citation: Yan H, Gao H, Li X and Hu H (2025) Preparation and photocatalytic activity of mesoporous CeO2-TiO2 mixed oxides. Front. Mater. 12:1639390. doi: 10.3389/fmats.2025.1639390
Received: 02 June 2025; Accepted: 28 July 2025;
Published: 11 August 2025.
Edited by:
Tadeusz Hryniewicz, Koszalin University of Technology, PolandReviewed by:
Mabrook S. Amer, King Saud University, Saudi ArabiaMahendra S. Shinde, M. J. M. Arts, Commerce and Science College, India
Daixiong Yang, Chengdu University, China
Copyright © 2025 Yan, Gao, Li and Hu. This is an open-access article distributed under the terms of the Creative Commons Attribution License (CC BY). The use, distribution or reproduction in other forums is permitted, provided the original author(s) and the copyright owner(s) are credited and that the original publication in this journal is cited, in accordance with accepted academic practice. No use, distribution or reproduction is permitted which does not comply with these terms.
*Correspondence: Huijun Yan, eWFuaHVpanVuMDQ1MUAxNjMuY29t
 Huijun Yan
 Hong Gao