 Zhichao Guan
 Aiqiang Guo2
- 1National Demonstration Center of Experimental Teaching for Ammunition Support and Safety Evaluation Education, Army Engineering University of PLA, Shijiazhuang, Hebei, China
- 2China National Institute of Arms Industry Testing and Research Institute, Huayin, Shaanxi, China
- 3Yunnan Defense Equipment Co., LTD., Qujing, Yunnan, China
The porosity parameter is one of the characteristic parameters of carbon aerogel, and the porosity and pore size distribution affect the infrared interference performance of carbon aerogel. In this study, nine types of carbon aerogel samples were selected to characterize and evaluate their micromorphology, particle size distribution, and porosity parameters. The objective was to obtain the characteristic parameters related to particle size distribution, porosity, and pore size distribution for these nine carbon aerogel samples. The infrared interference performance of nine types of carbon aerogel samples was evaluated in a smoke box. The analysis focused on the influence of porosity and pore size distribution on the interference performance across the infrared bands of 1–3 μm, 3–5 μm, and 8–14 μm. The results indicate that carbon aerogel exhibits a strong extinction effect across the three infrared bands. The increase in porosity leads to a higher infrared extinction coefficient, while an increase in average pore diameter can also enhance the infrared extinction coefficient.
1 Introduction
Carbon aerogel (CA) has the performance characteristics of good thermal insulation, large specific surface area, high porosity and hole size can be controlled at the nanoscale and micron level (Chao et al., 2022; Lang et al., 2024). It has a wide range of applications and can be used as capacitor electrode materials (Ashwini et al., 2023; Israr et al., 2025; Qaisar et al., 2020; Xia et al., 2025), purification materials (Guan et al., 2025; Song et al., 2025; Zhou et al., 2025). It can attenuate electromagnetic waves by relying on the interaction with electric field (Wei et al., 2016; Cai et al., 2024), which has great development potential and is expected to be widely used in the field of electromagnetic wave shielding and absorption (Zhao et al., 2025; Liu et al., 2025; Zeng et al., 2025 Jiang et al., 2025; Wang et al., 2024). Carbon aerogels are prepared by various methods, and all of them have good electromagnetic shielding and absorption effects. Shu et al. (2024) used chemical cross-linking and high-temperature carbonization process to prepare cellulose-derived carbon/RGO composite aerogel, with a minimum reflection loss of 50.42 dB at a thickness of 2.47 mm and a filling rate of 17.5 wt%. Ai et al. (2024) obtained biomass carbon aerogel by phosphorylation and alkali etching of phosphorylated carbonized wood (PCW) and multi-stage porous phosphorylated carbonized wood (HP-PCW), followed by annealing at 660 °C. PCW showed a minimum reflection loss of 59.8 dB, and the effective absorption bandwidth covered the entire X-band. HP-PCW shows a shielding effect of 52 dB in x-band. Wang et al. (2025) used vacuum impregnation-assisted nanorepair (VINR) method to prepare carbon fiber reinforced carbon aerogel (Cf/CA) composite, and the electromagnetic interference shielding performance (EMI SE) was about 2 dB at a thickness of 48.52 mm. Cao et al. (2022) synthesized graphene/carbon fiber composite aerogel (CGA) through solvthermal reaction and freeze-drying, with an effective absorption bandwidth of 8.72 GHz in the range of 2–18 GHz and a high absorption rate of 97.4% in the range of 0.3–1.5 THz. Zhang et al. (2023) used the drop-freeze-drying followed by carbonization approach to prepare three-dimensional ultra-light aerogel spheres from one-dimensional nanocellulose-derived carbon fibers and two-dimensional graphene layers. The aerogel sphere has an effective absorption bandwidth of 6.16 GHz and a minimum reflection loss of −70.44 dB when the packing load is 3 WWT.%. In addition to the aforementioned applications, carbon aerogels also exhibit good infrared interference effects in smoke conditions. Infrared interference refers to the technical measures that artificially alter or block the propagation characteristics of infrared radiation, thereby weakening or disrupting the normal operational capabilities of enemy infrared detection and guidance systems. The core objective is to reduce the detection, identification, and tracking effectiveness of enemy infrared equipment on targets. Zhang et al. (2020) prepared graphene doped carbon aerogel (G-Ca) powder material with a density of only 0.0093 g/cm3 by sol-gel, supercritical drying and high temperature cracking methods. The smoke box test results show that: The infrared and visible light shielding rates of the carbon aerogel doped with 7% graphene were more than 97% and 94% at the initial stage and 20 min after spreading. The smoke box test results of the magnetic Fe3O4/graphene/carbon aerogel prepared by the same method showed that: After 30 min of release, the shielding rate of 3–5 μm and 8–12 μm infrared was 99.55% and 99.35% of the initial value. According to the smoke box test of Jieyang (Yu Z. et al., 2024), the extinction coefficient of carbon aerogel powder in the 3–5 μm band can reach the highest of 2.61 m2 g-1, and the extinction coefficient of 8–14 μm band can reach the highest of 1.38 m2 g-1. Through the experimental study, it is found that with the increase of the porosity of carbon aerogel, the infrared mass extinction coefficient first increases and then decreases. Wu et al. (2018) used high-pressure airflow to spray 6 g of silica modified graphene aerogel (SMGA) into a smoke box with a volume of 6 m3 and an optical path of 3 m at a flow rate of 40 L min-1. SMGA could float in the air for 15 min, and the attenuation rate was greater than 99% for more than 5 min. The above studies show that carbon aerogel has excellent infrared interference performance and the resulting smoke screen floats for a long time. Compared with the research in the field of electromagnetic shielding and absorption, the research on the infrared extinction effect is still in the preliminary exploration stage. The specific influence of the pore parameters of carbon aerogel on the infrared interference performance needs to be further studied. Nine kinds of carbon aerogel materials were selected for scanning electron microscope observation, particle size distribution measurement and pore test to analyze the porosity of carbon aerogel samples. Smoke box test was carried out to obtain the transmittance of 1–3 μm, 3–5 μm and 8–14 μm infrared radiation under the interference of carbon aerogel smoke screen. According to the test results, the influence of porosity and pore size distribution on the infrared interference performance of carbon aerogel was analyzed, so as to provide guidance for improving the infrared interference performance of carbon aerogel and regulating the pore structure of carbon aerogel.
2 Material selection and experiment design
To meet the stability requirements of the sample parameters in the experimental tests, nine types of carbon aerogel materials were selected from domestic companies capable of producing tonnage quantities of carbon aerogels, with each material weighing 1 kg. Materials 1 to 9 correspond to sample 1 to 9, sample 1:7000 mesh G25-1; Sample 2:30 00 mesh G25-1; Sample 3:1500 mesh G25-1; Sample 4:400 mesh MS01; Sample 5:500 mesh G material; Sample 6:400 mesh D material; Sample 7:7000 mesh C7335; Sample 8:400 mesh A material; Sample 9:30 00 Mesh A material. All nine sample materials utilized resorcinol and formaldehyde as raw materials, which formed gels in the presence of an alkaline catalyst. Subsequently, carbon dioxide was employed as the medium for supercritical drying, resulting in the production of organic aerogels. Subsequently, the organic aerogel was pyrolyzed under an inert gas atmosphere at high temperatures to produce carbon aerogel. Consequently, there was no difference in the composition of the nine samples; rather, the variations in pore structure were attributed to the preparation process. Without considering the impact of component factors on interference performance, this analysis primarily focuses on the influence of pore differences on interference performance.
3 Representation and test
3.1 Representation
A trace carbon aerogel sample was adhered to a conductive substrate and coated with gold for 45 s. The microscopic morphology of the carbon aerogel sample was then captured using a scanning electron microscope (TESCAN MIRA LMS, Czech Republic). The acceleration voltage for the morphology analysis was set to 3 kV, utilizing a secondary electron detector (SE) with a magnification range of 2,000 to 150,000. The particle size distribution of the carbon aerogel samples was measured using a laser particle size analyzer (Malvern Mastersizer 2000, United Kingdom). Due to the small particles of carbon aerogel, the agglomeration of particles is easy to occur when the dry method is used, which leads to a large tail peak and a large error in the test results. Therefore, the wet method is used to measure carbon aerogel, and water is used as dispersant. After ultrasonic dispersion, the manual test program was run to test, and the analysis mode was free distribution; According to the results of electron microscope observation and shooting, it is found that the carbon aerogel particles are different in shape, not perfect spherical, and their size cannot be directly expressed by particle size. Therefore, the equivalent particle size is used to describe the particle size of carbon aerogel particles. The automatic surface and porosity analyzer (Micromeritics ASAP2460, Mack, United States) was used to measure the pore parameters of carbon aerogel samples with nitrogen as adsorb. Sample weight 0.12g; The analysis temperature is 77.3 K. The measurement equilibrium interval is 20 s; Analysis free space: 85 cm3; Low pressure dose 15 cm3 g-1; No automatic degassing and thermal correction.
3.2 Infrared interference performance test
The interference performance parameters of carbon aerogel samples in the infrared bands of 1–3 μm, 3–5 μm, and 8–14 μm were tested by a smoke box test system, and the effects of porosity and pore size distribution of carbon aerogel on the infrared interference performance of carbon aerogel were studied. The schematic diagram and test diagram of smoke box test system are shown in Figures 1, 2 respectively. Oval smoke box: volume 33.8 m3, optical path 4.8m, self-built; Fan: Oxx FS1608RC, China; 3∼5μm, 8–14 μm infrared radiation source: 800W electric furnace wire, homemade; 1∼3 μm infrared radiation source: halogen lamp TEQI LIGHT 21V/150W; 1∼3 μm infrared radiometer: EOS, PbSe-020-H, United States; 3∼ 5 μm infrared radiometer: EOS, FYM-PBS-020-H, United States; 8–14 μm infrared radiometer: EOS, FYM-LT020-H, United States.
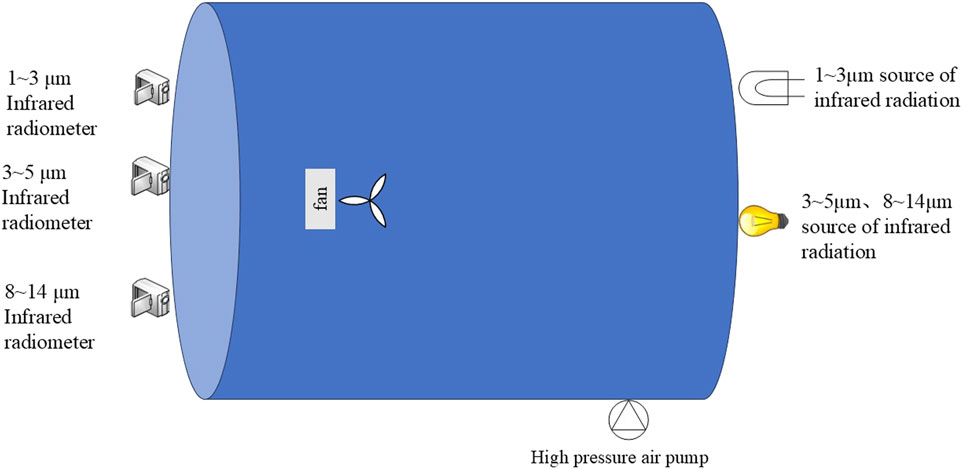
Figure 1. Schematic diagram of smoke box test system.
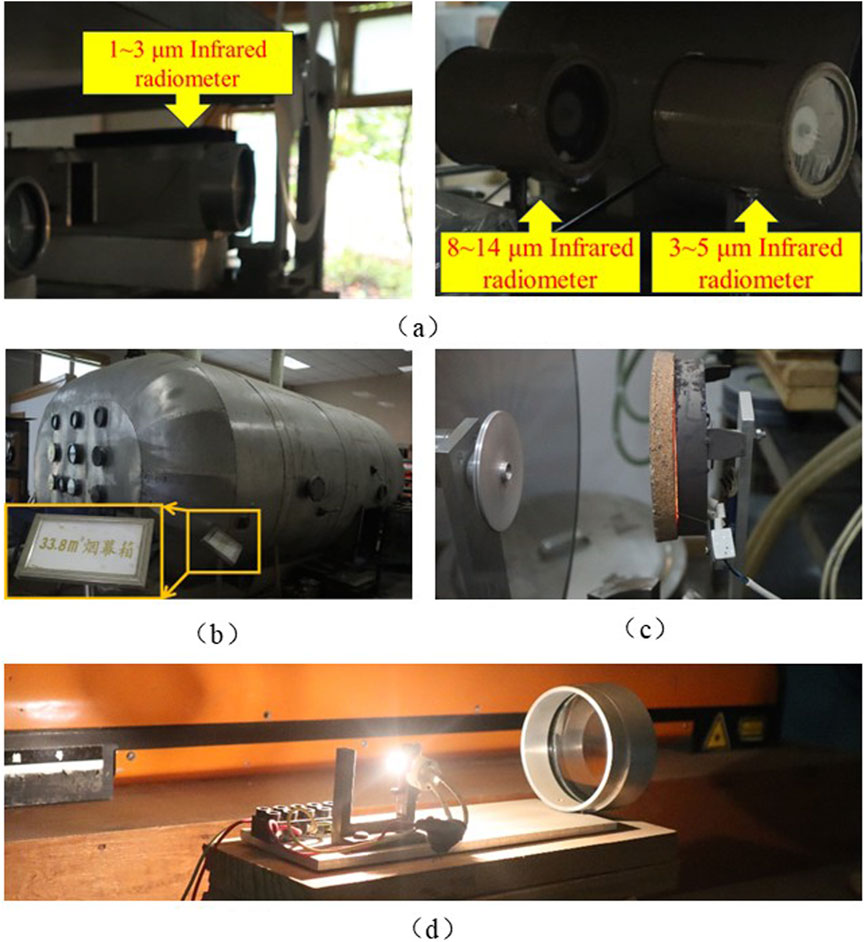
Figure 2. Smoke box test system. (a) Infrared radiometer. (b) 33.8 m3 smoke screen box. (c) 3∼5 μm, 8∼14 μm source of infrared rediation. (d) 1∼3 μm m source of infrared radiation.
Before releasing the carbon aerogel interference material, the light path was obscured and the background signal U0 was measured, unit: V; Smooth light path, measure calibration signal Ud, unit: V. After the smoke screen is released, the infrared signal voltage received by the infrared radiometer becomes weak due to the scattering and absorption of the smoke screen to the infrared radiation. After the smoke concentration in the smoke box is uniform, the output voltage of the infrared radiometer is tested and recorded, and the sampling is continued for more than 300 s to obtain the sampling signal Ut, unit: V. The sampling signal Ut is less than the calibration signal Ud. The infrared transmittance τ is calculated according to the following formula, unit: %. The transmittance - time curve of carbon aerogel sample smoke screen to infrared attenuation is obtained.
The specific operation steps of smoke box test are as follows: ① The product value of smoke screen concentration and smoke box volume of the sample to be tested is 16.9g, so that the sample concentration in the smoke box is 0.5 g/cm3, the temperature in the smoke box is 22°C–25 °C, and the ambient humidity is 61%RH ∼ 69%RH. Infrared radiometers and heat sources of 1 ∼ 3μm, 3 ∼ 5μm and 8–14 μm were arranged in the Windows on both sides of the smoke box. ② Instrument calibration, masking light path, determination of background signal U0; Unblock the light path and determine the calibration signal Ud. ③ After the calibration signal Ud of the radiometer remains stable, the air pump is turned on to feed into the smoke box, and the fan is stirred to make the carbon aerogel sample dispersed evenly to form a smoke screen. The sampling signal is recorded at the sampling frequency of once per second and the real-time transmittance curve is drawn. After the smoke concentration is uniform, the sampling is continued for more than 200 s to obtain the sampling signal Ut. ④ Record the sampling signal Ut, measure the shielding performance of the sample to each band, open the smoke box and exhaust the carbon aerogel samples in the smoke box, record the detailed data of infrared transmitrate with time, the total time is 721 s ⑤ Repeat the experimental steps until all the carbon aerogel samples are tested.
The corresponding mass extinction coefficient (αe) was calculated according to the average infrared transmittance. αe is the core index of infrared interference performance, which can be calculated from infrared transmittance. The calculation formula of αe is as follows:
Where: c is the smoke concentration in the smoke box test system, g/cm3; l is the optical path, m.
4 Test results and analysis
4.1 Microstructure
The microscopic morphology results of samples one to nine observed by electron microscope are shown in Figure 3, where Figures 3a–i correspond to samples one to nine respectively. In Figure 3, the black area is the pore structure, and the gray area is the skeleton structure.
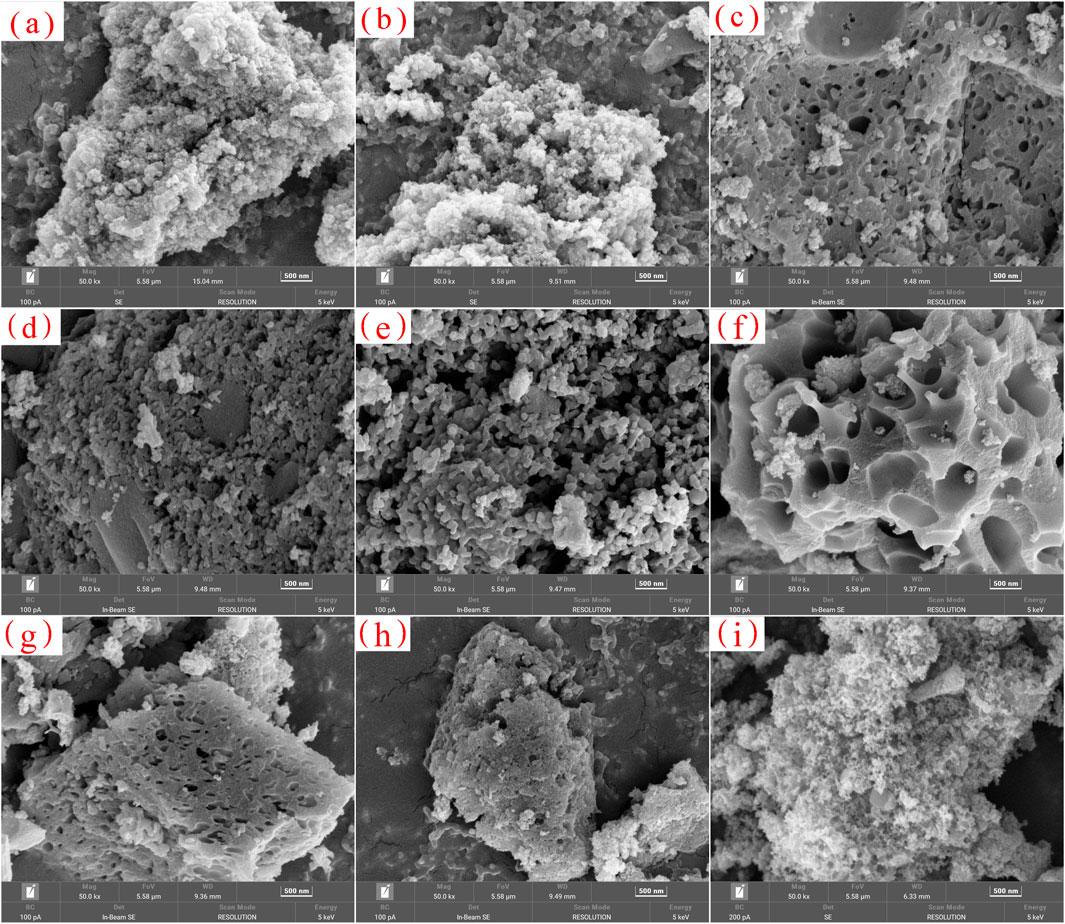
Figure 3. SEM images of samples 1 to 9 (a) Sample 1, (b) Sample 2, (c) Sample 3, (D) Sample 4, (e) sample 5, (f) sample 6, (g) sample 7, (h) sample 8, and (i) sample 9.
Figure 3 reveals that the nine carbon aerogel samples consist of powdered particulates composed of three-dimensional carbon skeletons. These particulates exhibit distinct boundaries and good dispersion. The size of a single particle is about 1–20 μm, and the internal particle has a continuous network structure in the three-dimensional space, with uniform skeleton and developed pore structure. Given the absence of significant differences in particle morphology, the influence of carbon aerogel morphology on infrared interference performance is not considered a significant factor following smoke dispersal and smoke screen formation.
4.2 Size distribution
The particle size distribution of the samples was tested by laser particle size analyzer, and the volume percentage of the nine carbon aerogel samples in the range of 0.01–2000 micron and the particle size values of D10, D50 and D90 of the nine samples were obtained. Table 1 lists the particle size measurement results of nine kinds of carbon aerogel samples. According to the particle size measurement results, the particle size distribution curve is made with the logarithm value as the abscisordinate, as shown in Figure 4.
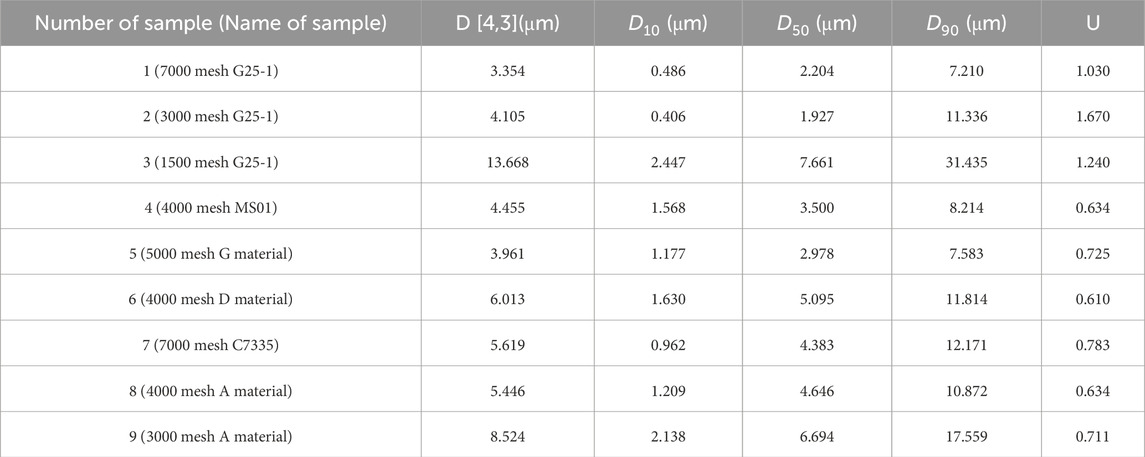
Table 1. Sample size parameter table.
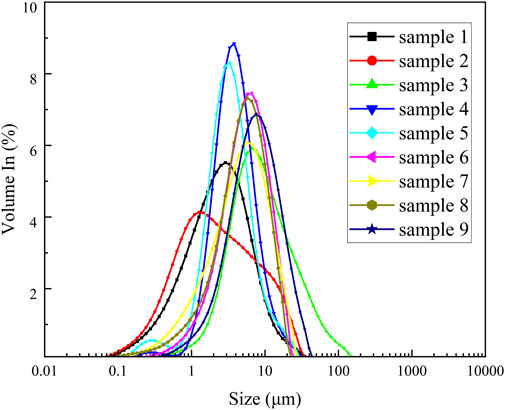
Figure 4. Particle size distribution curve.
It can be seen from Table 1 that the D90 of sample three is 31.435 μm, and the D90 of the other eight samples is less than 20 μm. The particle size measured by laser particle size meter is consistent with the observation results of microscopic morphology.
The particle size distribution of sample 2 has the weakest consistency and the most dispersed distribution. In Figure 4, the particle size distribution curve of sample 2 has an obvious raised shape at 10–30 μm, indicating that the particle size distribution of sample two is wide, and the two results are consistent. Sample 6 has the best consistency in particle size distribution and the most concentrated distribution, which is consistent with the curve of sample six in Figure 4.
4.3 Parameter of porosity
Figure 5 shows the adsorption and desorption isotherms of carbon aerogel samples 1-9. It can be seen from Figure 5 that samples one to nine show obvious rapid adsorption when P/P0 < 0.01, indicating that there is a strong interaction force between carbon aerogel and nitrogen (Yu J. et al., 2024), and the adsorption becomes saturated after reaching a certain relative pressure. This phenomenon is the result of microporous volume filling, indicating that the material contains a large number of micropores. When P/P0 is close to 1, the adsorption and desorption isotherms do not tend to be flat, but have upward adsorption, indicating that there are a small number of macropores in the material. On the other hand, it may also be that the isotherm rises rapidly near the saturated vapor pressure, due to the presence of gaps between the particles and the occurrence of adsorption similar to macropores. By observing Figure 5a, it can be seen that the shapes of absorption and desorption isotherm of samples 1, two and three are similar, indicating that the pore structure is similar, which is consistent with the selected carbon aerogel model, and they are all carbon aerogel G25-1 materials; The adsorption and desorption isotherms of sample eight and nine have similar shapes and pore structures, so they are carbon aerogel A materials. According to the IUPAC classification standard (Xu, 2023), the adsorption and desorption isotherms of sample five belong to Langmuir isotherms, corresponding to the reversible adsorption process of Langmuir monolayer, which is adsorbed by micropores. When P/P0 of samples 1, 2, 4, five and seven is close to 1, the adsorption curve has an upward adsorption amount, indicating that there are a small amount of stacked macropores, indicating that the samples have mesopores or macropores (Yu W. et al., 2024; Xu, 2023), which may be due to the occurrence of capillary condensation, resulting in adsorption lag. The starting point of the hysteresis loop indicates the condensation of the minimum capillary. The end point of the hysteresis loop indicates that the largest hole is filled with condensate. The overall shape of the adsorption-desorption isotherm is retained, and the pore volume increases. Samples 1, 2, 3, four and seven have relatively insignificant hysteresis loops between P/P0 = 0.5 and 0.8, but it can still be indicated that these five carbon aerogel samples are micro-mesoporous composites. There is almost no hysteresis loop in the adsorption and desorption isothermal curve of sample 5. When approaching the saturated vapor pressure, due to the gap between particles, adsorption similar to macropores will occur, and the isotherm will rise rapidly, belonging to type I isotherm, indicating that the pores in sample five are mainly micropores (Yu Z. et al., 2024; Yu J. et al., 2024; Wu et al., 2023).
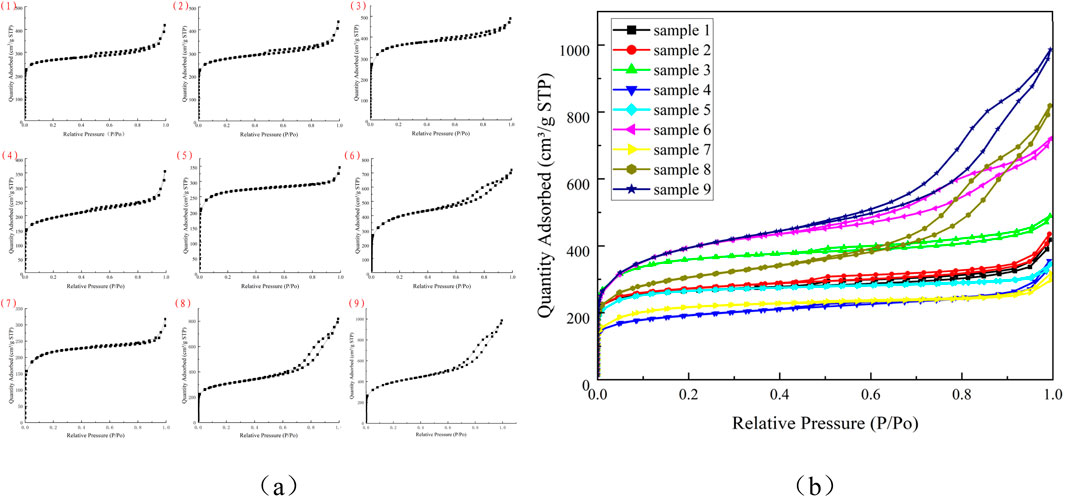
Figure 5. Adsorption and desorption isotherms of samples 1 to 9 (a) Displayed separately for samples 1-9; (b) Displayed uniformly for samples 1-9.
Observe the absorption and desorption curves of samples 6, eight and nine in Figure 5: The amount of nitrogen absorption increased significantly when P/P0 = 0.5, and there was an obvious hysteresis loop between P/P0 = 0.5 and 0.9. The isotherm obtained during desorption did not coincide with the isotherm obtained during adsorption. The desorption isotherm was above the adsorption isotherm, and the hysteresis loop of isotherm did not have an obvious saturated adsorption platform, indicating that the pore structure of the sample was very irregular. According to IUPAC standards, they all show similar IV isotherms with H4 hysteresis loops, indicating that the particles have irregular voids and wide pore size distribution (PSD) curves. The pores of samples 6, eight and nine include micropores and mesopores (Wu et al., 2023; Chao et al., 2022). The pores are mainly composed of arrow slit holes, typical “ink bottle” holes, tubular holes with uneven pore size distribution and densely packed spherical particle gap holes (Yu W. et al., 2024). From a structural point of view, the reason for these different pores is the structural shrinkage due to surface tension during the decomposition of volatile substances in the dense organogels during the pyrolysis of organic aerogels at high temperatures (Gloria et al., 2015). Because the specific surface area of macropores is very small, the contribution of macropores to the total adsorption amount is usually negligible compared to the adsorption amount of mesopores and micropores. Samples 6, 8, and nine had the highest relative positions of the adsorption and desorption isotherms, indicating the maximum porosity of the sample, while samples 1, 2, 4, 5, and seven had the lowest relative positions of the adsorption and desorption isotherms, indicating the lowest porosity of the sample.
The porous structure of materials is usually characterized by analyzing the adsorption isotherms of different gases (N2, CO2, Ar and H2) at different temperatures (Ashwini et al., 2023). Classical (Dubinin-Radushkevich, BJH or t plot) and molecular simulation methods are widely used to determine the apparent surface area, pore volume and pore size distribution. The analysis of pore size distribution is usually done separately, that is, different models are used to analyze pores of different sizes respectively. HK (Horvath-Kawazoe) method, SF (Saito-Foley) method and T-plot method are usually used for micropores. The BJH (Barret-Joyner-Halenda) method is usually used for mesopores, and the mercury injection method is generally used for macropores. In addition, the Density Function Theory (DFT) model method can be used to analyze the pore size distribution of all pores.
The HK method (Horvath and Kawazoe, 1983) is a semi-empirical analysis method to calculate the effective pore size distribution from the nitrogen adsorption isotherms of samples on micropores. This method assumes that the material is a slit hole. The experimental materials and characterization methods meet the three conditions for the HK method to analyze the pore size distribution of microporous materials: 1) the materials are microporous materials, based on the adsorption isotherm of N2 at the temperature of liquid nitrogen; 2) Microporous materials are carbon molecular sieve and activated carbon samples; 3) Assume that the hole type is slit hole. HK method was used to analyze the micropore sizes of samples, and the number density distribution of micropore sizes of samples one to nine was obtained as shown in Figure 6. It can be seen from Figure 6 that the nine kinds of carbon aerogel samples have rich microporous structures, and the pore sizes of the micropores are concentrated around 0.4 nm. The median pore sizes of the nine kinds of samples are obtained by HK method.

Figure 6. The distribution of pore sizes from one to nine micropores of samples was analyzed by HK method.
DFT method is a kind of molecular dynamics method that can truly reflect the thermodynamic properties of fluid in pores of porous materials. It not only provides a microscopic model of adsorption, but also reflects the pore size distribution more accurately than the traditional thermodynamic method. It can relate the molecular properties of adsorb gases to their adsorption properties in pores of different sizes. The Non-Local Density Function Theory (NLDFT) method describes the characteristics of fluids confined to pores at the molecular level and can be used in a variety of adsorbents/adsorbents systems. The NLDFT method for characterizing pore size distribution is applicable to the full range of micropores and mesopores (Terazona, 1985; Terazona et al., 1987). In this test, nitrogen adsorbate and analysis temperature meet the analysis conditions of NLDFT method, and NLDFT method is used to analyze the pore structure of carbon aerogel from micropores to mesopores.
In order to better show the pore distribution in the range of micro-mesopores, the horizontal coordinate is plotted by logarithmic scale, and the pore distribution of micropores and mesopores of nine kinds of samples is shown in Figure 7. Figure 7a is the pore volume distribution, and Figure 7b is the pore density distribution, which are basically the same. The pore size distribution of samples 6, 8, and 9 has a peak at 9–20 nm, indicating that there are mesopores in samples 6, 8, and 9, and the mesopore pore size is concentrated at 9–20 nm, and the micropore pore size of all samples is concentrated between less than 0.8 nm and 1–2 nm. The results of NLDFT analysis are consistent with those of HK analysis.
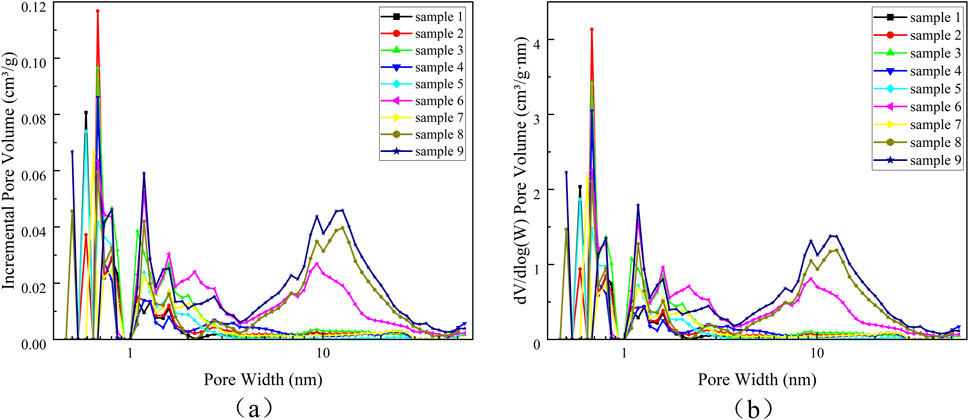
Figure 7. The pore size distribution of micropores and mesopores from 1 to 9 of the samples was analyzed by NLDFT (a) Pore volume distribution; (b) Pore density distribution.
Brunau Emmet-Teller (BET) model was used to calculate the specific surface area and average pore size of carbon aerogel samples. The pore parameters of carbon aerogel samples are summarized in Table 2. It is generally considered that pores less than 2 nm are micropores, pores between 2 and 50 nm are mesopores, and pores larger than 50 nm are macropores. The specific surface area of the nine samples is greater than 700 m2 g-1, the average pore size is less than 10 μm, the total pore volume is about 0.5–1.5 cm3 g-1, and the median pore size is about 0.5 nm. The pore test results show that the carbon aerogel samples have micropores, mesopores and macropores, with rich pore structure. The average pore size value is about one order of magnitude larger than the median pore size value, because the pores of the sample are mainly composed of micropores and mesopores, and the number of macropores is small, which is consistent with the analysis results of NLDFT method. The different methods used to evaluate the pore structure of nine carbon aerogel samples with ultra-high porosity showed good agreement in terms of pore volume, specific surface area and average pore size (Gloria et al., 2015).
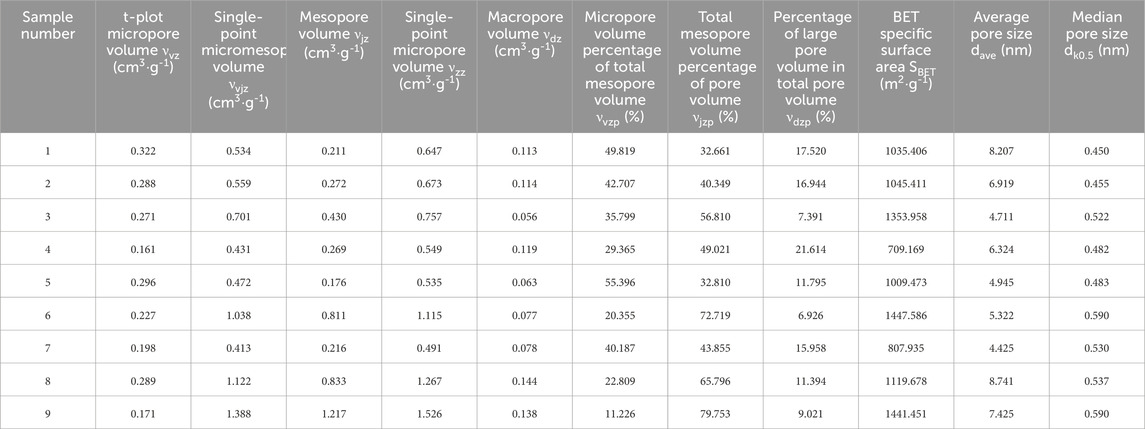
Table 2. Test results of pore parameters of carbon aerogel samples.
The micropore volume νvz is obtained by t-plot analysis, and the total micromesopore volume νvjz and total mesopore volume νzz are obtained by single-point analysis. The total mesopore volume νjz = νvjz-νvz, νdz = νzz-νvjz, and the pore volume per unit mass is called the pore volume or porosity of the material. Make the radar plot νvzp, νjzp, and νdzp, as shown in Figure 8.
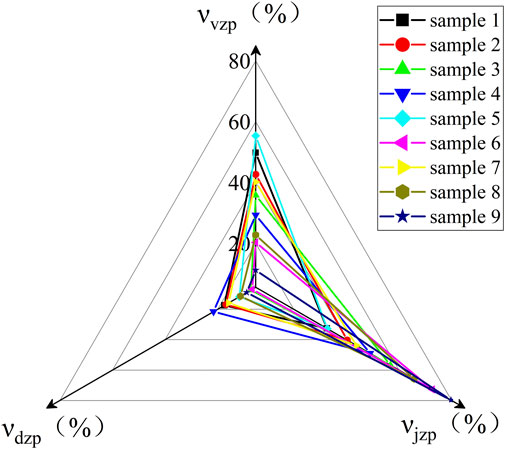
Figure 8. Radar map of micropore, mesopore and macropore porosity.
4.4 Infrared interference performance
Calculate the infrared transmittance according to Equation 1. The infrared interference performance test results are plotted into infrared transmittance curves, as shown in Figures 9–11.
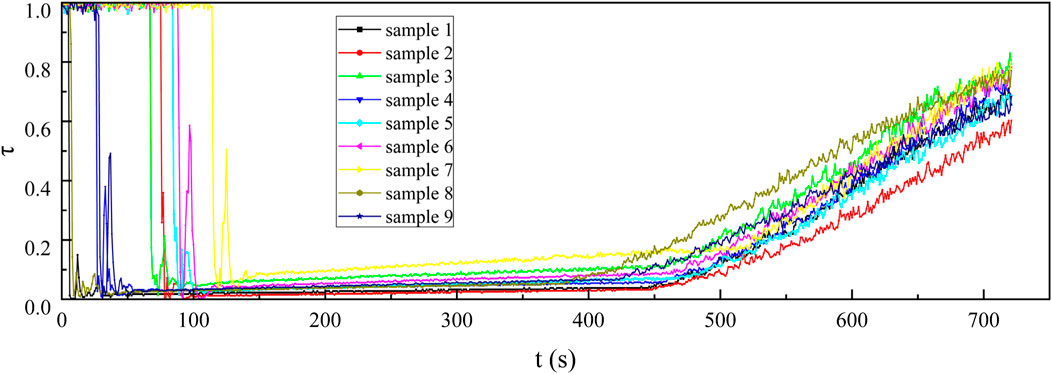
Figure 9. Infrared transmittance curves of 1∼3 μm at the concentration of 0.5 g/cm3 for nine kinds of samples.
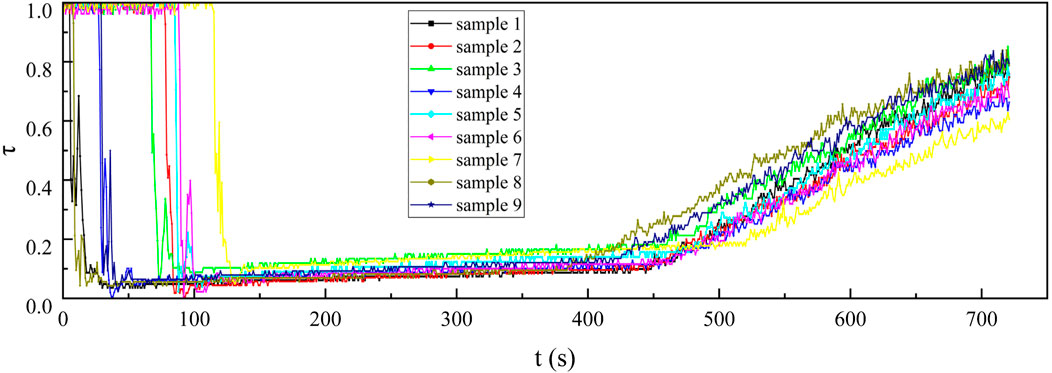
Figure 10. Infrared transmittance curves of 3–5 μm at the concentration of 0.5 g/cm3 for nine kinds of samples.
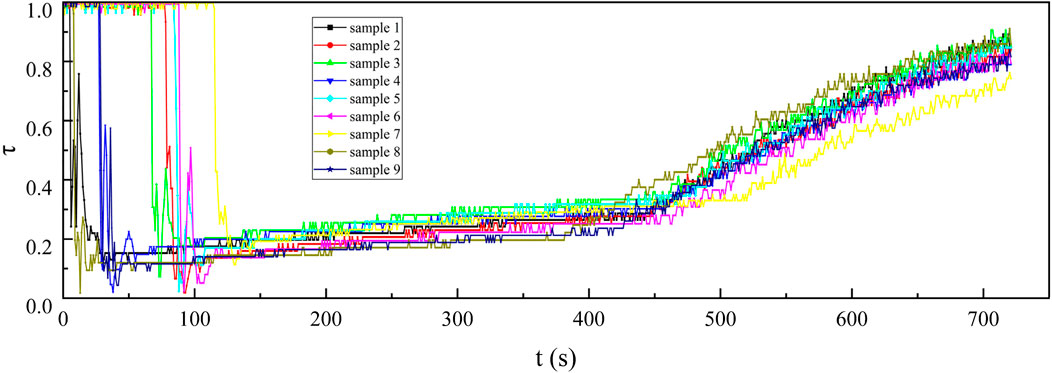
Figure 11. The 8–14 μm infrared transmittance curves of nine kinds of samples at the concentration of 0.5 g/cm3.
From the curves in the 100–400 s sections of Figures 9–11, it can be observed that under the same smoke concentration, the infrared transmittance curves at shorter wavelengths exhibit smaller fluctuations and lower transmittance. This is because the smaller-sized carbon aerogels can produce stronger interference effects through Rayleigh scattering for short-wave infrared. Additionally, the smaller-sized carbon aerogels have more stable floating performance in the confined space of the smoke chamber, resulting in smaller fluctuations in the infrared transmittance curves. The small-sized carbon aerogels primarily interfere with long-wave infrared through absorption, while their scattering effect on long-wave infrared is weak. Therefore, the interference effect of small-sized carbon aerogels on long-wave infrared is significantly reduced. The extinction effect on long-wave infrared mainly comes from the Mie scattering of larger-sized carbon aerogels, which have weaker stability in floating within the smoke chamber. As a result, the transmittance curves for long-wave infrared exhibit larger fluctuations.
Upon opening the smoke box door at approximately 450 s, smoke was released, leading to a steady increase in the infrared transmittance curve. This observation indicates that the smoke curtain formed by the carbon aerogel sample exhibited a uniform concentration, allowing it to move easily with the airflow and demonstrating good suspension stability. After injecting the sample into the smoke chamber for 30 s, continuously test the infrared transmittance for 180 s and use Equation 2 to calculate the infrared mass extinction coefficient. From the 180 recorded infrared mass extinction coefficients, an average value was derived. This average value was subsequently adopted as the representative infrared mass extinction coefficient of the sample across various wavelengths.
The three infrared mass extinction coefficients of nine kinds of samples are shown in Figure 12 as the radar diagram.
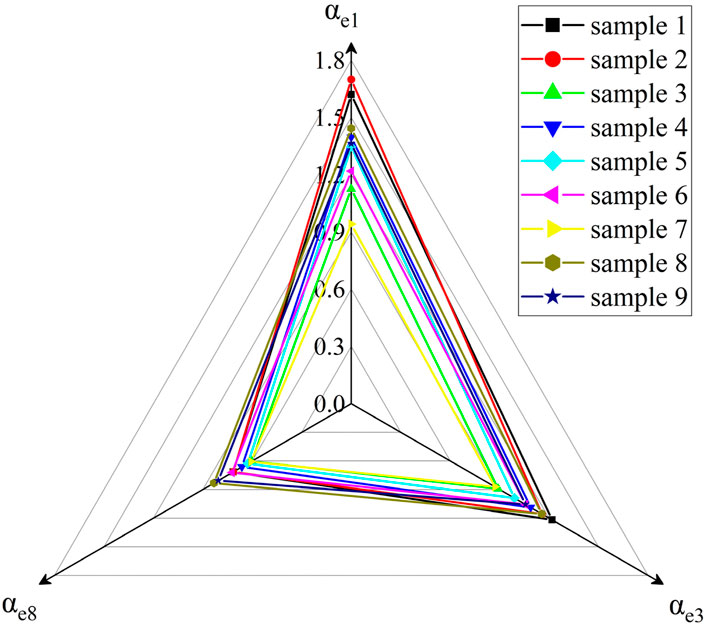
Figure 12. Radar map of infrared mass extinction coefficient.
It can be seen from Figure 12 that the αe8 of all samples is between 0.6 and 0.9, αe3 is between 0.89 and 1.3, and αe1 is between 0.9 and 1.7. The reason is that with the increase of infrared wavelength, the infrared transmittance is reduced by the influence of particle size, and the influence of sample particle size on the infrared mass extinction coefficient decreases. Therefore, the difference of the interference effect of the nine kinds of carbon aerogel samples on the infrared band of 8–14 μm is the smallest, and the difference of the interference effect on the infrared band of 1–3 μm is the largest.
4.5 Analysis of the influence of pore parameters on infrared interference performance
Based on the parameters of the carbon aerogel samples listed in Table 1, Table 2, and Table 3, calculate the Pearson correlation coefficients rαe1, rαe3, and rαe8 between the particle size and porosity parameters and the mass extinction coefficients in three infrared bands.
Table 3. Infrared mass extinction coefficients of nine samples.
According to the results calculated in Table 4, it was found that among the four parameters related to particle size, D [4,3], D10, D50, and D90, only D50 has a strong correlation with αe1, with |r| = 0.62 > 0.6. All four particle size parameters are almost entirely negatively correlated with αe1, αe3, and αe8 (except for the correlation coefficient of D50 with αe8, which is 0.03). This indicates that as the particle size decreases, the infrared mass extinction coefficient for 1–3 μm increases, which is consistent with extinction theory. Smaller particle size carbon aerogels exhibit stronger Rayleigh or Mie scattering effects in the infrared wavelength range.

Table 4. Pearson Correlation Coefficient r of carbon aerogel particle size and pore parameters with infrared extinction coefficient.
Among the five pore volume parameters (νvz, νvjz, νjz, νzz, νdz), νvz shows a weak positive correlation with αe1 and αe3, while it has no correlation with αe8, indicating that the total micropore volume has no effect on long-wave infrared extinction. νdz exhibits a strong positive correlation with αe1, αe3, and αe8, suggesting that as the macropore volume increases, the infrared mass extinction coefficients in all three bands tend to increase. Macropores (typically with a pore diameter >50 nm) may enhance the extinction effect through geometric scattering of light. νvjz, νjz, and νzz have almost no effect on αe1 and αe3. The total micropore volume νvz has a slight effect on αe1 and αe3, but no effect on αe8. This may be because micropores influence the extinction effect on short-wave infrared through surface scattering, while they have no scattering effect on long-wave infrared.
The correlation coefficients of νzz with αe1, αe3, and αe8 are all positive, and the infrared mass extinction coefficient is positively correlated with the total pore volume. This indicates that an increase in porosity is beneficial for enhancing infrared interference performance. The reasons for this can be analyzed as follows: first, the increase in porosity of carbon aerogel reduces the effective dielectric constant of the material, decreasing the reflection of electromagnetic waves at the material’s surface, allowing more electromagnetic waves to enter the material and undergo loss. Second, as the porosity of carbon aerogel increases, the number of sub-wavelength structures that can influence the forced vibrations of electrons in the carbon framework also increases. When electromagnetic waves couple with electron resonance, electrons will vibrate and collide multiple times in narrow spaces, resulting in stronger electromagnetic wave attenuation. Third, as the porosity of carbon aerogel increases, the density of individual carbon aerogel particles decreases. Therefore, when the mass of the samples is the same, the number of particles in the samples increases as the particle density decreases. In the experiments, all samples were injected into the smoke chamber at 16.9 g, which means that during the smoke chamber testing process, the actual number of particles in the samples with higher porosity is slightly higher than that in the samples with lower porosity. Thus, the infrared mass extinction coefficient is positively correlated with porosity.
Comparing the correlation coefficients of νvjz, νjz, νdz with αe1, αe3, and αe8, it is found that the larger the infrared wavelength, the greater the influence of mesopore volume and macropore volume (for example, the total macropore volume νdz has correlation coefficients of 0.59, 0.72, and 0.84 with αe1, αe3, and αe8, respectively). The reason for this is that the closer the wavelength is to the pore size, the higher the scattering efficiency. An increase in total macropore volume is beneficial for enhancing the infrared interference performance of carbon aerogel. Long-wave infrared undergoes multiple reflections and scattering within the macropores, extending the propagation path and thereby improving the wave attenuation capability of carbon aerogel (Yu et al., 2024c).
From Table 4, it is found that dk0.5 has a weaker correlation with αe1, αe3, and αe8 than dave does with αe1, αe3, and αe8. The correlation coefficients of dave with αe1, αe3, and αe8 are all greater than 0.7, and among all the characteristic parameters, dave has the largest correlation coefficients with αe1, αe3, and αe8. This indicates that the average pore diameter is the most significant factor affecting the infrared mass extinction coefficient. An increase in dave can enhance the infrared mass extinction coefficient, which may be due to larger pore diameters enhancing the scattering or absorption of electromagnetic waves within the pores of carbon aerogel, thereby increasing the infrared mass extinction coefficient. Therefore, increasing the average pore diameter of carbon aerogel can improve its infrared mass extinction coefficient. SBET shows almost no correlation with αe1, αe3, and αe8, indicating that in high specific surface area materials, the influence of pore size characteristics on extinction performance is greater than the effect produced by specific surface area.
5 Conclusion
In this study, we selected nine types of carbon aerogel materials from companies capable of producing these materials in tonnage quantities. Our focus was on microscopic morphology observation, particle size distribution measurement, and pore structure analysis. The results revealed that the carbon aerogels exhibit a uniform framework and a well-developed pore structure, with individual particle sizes ranging approximately from 1 to 20 μm. The pore distribution was analyzed in detail using both the HK method and the NLDFT method. The results obtained from these different pore analysis techniques showed a relatively good consistency in terms of pore volume, specific surface area, and average pore diameter. The test results from the smoke box indicate that the smoke screen formed by the carbon aerogel sample exhibits a uniform concentration and good suspension stability. An increase in the porosity of the carbon aerogel particles enhances their infrared interference performance. Notably, when the average pore diameter in carbon aerogel particles increases, it exhibits better infrared interference effects. In summary, carbon aerogel materials have good infrared interference performance and suspension stability. The pore parameters of carbon aerogel affect its infrared quality extinction coefficient, and regulating the microstructure is expected to significantly enhance the infrared quality extinction coefficient. The infrared interference performance of carbon aerogel requires further development and research.
Data availability statement
The original contributions presented in the study are included in the article/supplementary material, further inquiries can be directed to the corresponding author.
Author contributions
ZG: Writing – original draft, Conceptualization, Methodology, Project administration. AG: Data curation, Formal Analysis, Writing – review and editing. TL: Resources, Writing – review and editing. JZ: Methodology, Validation, Writing – review and editing. XG: Funding acquisition, Supervision, Validation, Writing – review and editing, Formal Analysis.
Funding
The author(s) declare that no financial support was received for the research and/or publication of this article.
Acknowledgments
The author thanks Yunnan Defense Equipment Co., Ltd. for its support of the experiment.
Conflict of interest
Author ZJ was employed by Yunnan Defense Equipment Co., LTD.
The remaining authors declare that the research was conducted in the absence of any commercial or financial relationships that could be construed as a potential conflict of interest.
Generative AI statement
The author(s) declare that no Generative AI was used in the creation of this manuscript.
Publisher’s note
All claims expressed in this article are solely those of the authors and do not necessarily represent those of their affiliated organizations, or those of the publisher, the editors and the reviewers. Any product that may be evaluated in this article, or claim that may be made by its manufacturer, is not guaranteed or endorsed by the publisher.
References
Ai, Y., Xing, R., Huang, R., Kong, J., and Su, R. (2024). Biomass-derived fire-retardant porous carbon towards efficient electromagnetic wave absorption and shielding. Carbon 227, 119268. doi:10.1016/j.carbon.2024.119268
Ashwini, V. P. a, Sawant, S. A., Sonkawade, R. G., and Vhatkar, R. S. (2023). Green synthesized carbon aerogel for electric double layer capacitor. J. Energy Storage 72, 108533. doi:10.1016/j.est.2023.108533
Cai, Z., Yang, H., Zhou, H., Lin, Y., Cheng, Y., and Yuan, Q. (2024). Achieving efficient electromagnetic absorption in multifunctional carbon nanotube aerogels by manipulating radialized network structure. Chem. Eng. J. 498, 155629. doi:10.1016/j.cej.2024.155629
Cao, Y., Cheng, Z., Wang, R., Liu, X., Zhang, T., Fan, F., et al. (2022). Multifunctional graphene/carbon fiber aerogels toward compatible electromagnetic wave absorption and shielding in gigahertz and terahertz bands with optimized radar cross section. Carbon 199, 333–346. doi:10.1016/j.carbon.2022.07.077
Chao, G., Wang, D., Wanga, Y., Zhang, X., Chen, S., Wang, Y., et al. (2022). Modulation of hierarchical porosity in metal-doping graphene/carbon hybrid aerogels for capacitive energy storage. J. Energy Storage 55, 105445. doi:10.1016/j.est.2022.105445
Gloria, R., Carlos, M., Marta, H., Jacek, J., and Conchi, O. A. (2015). Effects of CO2 activation of carbon aerogels leading to ultrahigh micro-meso porosity. Microporous Mesoporous Mater. 209, 18–22. doi:10.1016/j.micromeso.2015.01.011
Guan, Y., Zhang, W., Liu, Y., Cao, S., Wang, Z., and Li, Y. (2025). Multifunctional carbon/biomass composite aerogel with a layered structure for efficient solar-driven high-viscous oily seawater purification. Desalination 604, 118730. doi:10.1016/j.desal.2025.118730
Horvath, G., and Kawazoe, K. (1983). Method for the calculation of effective pore size distribution in molecular sieve carbon. J. Chem. Eng. Jpn. 16, 470–475. doi:10.1252/jcej.16.470
Israr, A., Muhammad, S., Kiran, K., Muhammad, Z., Javed Ali, K., Awais, Q., et al. (2025). Double carbon matrix rGO and resorcinol formaldehyde aerogel supported mesoporous K-δMnO2 nano-spheres as anode material for high efficacy hybrid aqueous asymmetric super capacitor. J. EnergyStorage 114, 115831. doi:10.1016/j.est.2025.115831
Jiang, H., Wang, Y., Wang, C., Feng, Y., Yang, D., Sun, Y., et al. (2025). Bamboo-like carbon nanotubes assisted assembly of magnetic-dielectric aerogels to enhance microwave attenuation. Carbon 234, 119973. doi:10.1016/j.carbon.2024.119973
Lang, Y., He, Y., Song, H., Yi, L., Deng, H., and Chen, X. (2024). Progress in the research of carbon aerogel in photothermal conversion. New Carbon Mater. 39 (6), 1075–1087. doi:10.1016/s1872-5805(24)60865-6
Liu, C., Wu, N., Li, B., Wang, Z., Wu, L., Zeng, Z., et al. (2025). Facile manufacturing of carbon nanotube/ZIF-67-derived cobalt composite aerogel with high-efficiency electromagnetic wave absorption. J. Mater. Sci. and Technol. 220, 129–139. doi:10.1016/j.jmst.2024.08.065
Qaisar, A., Mojtaba, M., Abraham, A. O., Michal, M., and Des, G. (2020). Effect of physical activation/surface functional groups on wettability and electrochemical performance of carbon/activated carbon aerogels based electrode materials for electrochemical capacitors. Int. J. Hydrogen Energy 45, 13586–13595. doi:10.1016/j.ijhydene.2018.04.099
Shu, R., Xu, L., and Guan, Y. (2024). Preparation of cellulose derived carbon/reduced graphene oxide composite aerogels for broadband and efficient microwave dissipation. J. Colloid Interface Sci. 675, 401–410. doi:10.1016/j.jcis.2024.07.026
Song, W., Yu, T., Zhang, Y., and Li, L. (2025). A visible light-driven floatable cyclized polyacrylonitrile-based aerogel (CPAN@ZnO-Ag) photocatalyst for sustainable wastewater purification. Sep. Purif. Technol. 362, 131801. doi:10.1016/j.seppur.2025.131801
Terazona, P. (1985). Free-energy density functional for hard spheres. Phys. Rev. 31, 2672e2679. doi:10.1103/PhysRevA.31.2672
Terazona, P., Marconi, U. M. B., and Evans, R. (1987). Phase equilibria of fluid interfaces and confined fluids. Mol. Phys. 60, 573e595. doi:10.1080/00268978700100381
Wang, A., Zhang, Z., Liu, Y., Li, Z., and Leng, J. (2024). Lightweight carbon nanotube/aramid nanofiber aerogel with superior electromagnetic wave absorption, thermal insulation, and flame resistance. Carbon 225, 119105. doi:10.1016/j.carbon.2024.119105
Wang, W., Ren, C., Zheng, J., Huang, H., Wu, C., Jin, X., et al. (2025). Ultra-high strength and flame retardant carbon aerogel composites with efficient electromagnetic interference shielding and superior thermal insulation via nano-repairing route. Compos. Sci. Technol. 259, 110949. doi:10.1016/j.compscitech.2024.110949
Wei, S., Ai, D., Yu, F., Shen, J., Huang, S., Tang, J., et al. (2016). Super Black material from low-density carbon aerogels with subwavelength structures. ACS Nano 10, 9123–9128. doi:10.1021/acsnano.6b02039
Wu, M., Lin, Y., and Chen, J. (2023). Carbon spheres with ultra-hydrophilic surface and ordered pores on the borderline between micropores and mesopores for improving super capacitive performance. J. Energy Storage 69, 107963. doi:10.1016/j.est.2023.107963
Wu, X., Lyu, J., Hong, G., Liu, X. c., and Zhang, X. (2018). Inner surface functionalized graphene aerogel microgranules with static microwave attenuation and dynamic infrared shielding. ACS Langmuir 34 (30), 9004–9014. doi:10.1021/acs.langmuir.8b01410
Xia, A., Chen, J., Li, J., Yu, B., and Tan, G. (2025). Sm-doping and carbon aerogel synergistically improve the electrochemical properties of δ-MnO2 as supercapacitor electrodes. J. Energy Storage 113, 115658. doi:10.1016/j.est.2025.115658
Xu, J. (2023). Three dimensional carbon aerogel for microwave absorption from chitosan. Synth. Met. 295, 117352. doi:10.1016/j.synthmet.2023.117352
Yu, J., Yan, S., Chen, F., Lu, Y., Lin, T., Bao, W., et al. (2024b). Micro-scale “top-down” construction of N/O Co-doped carbon aerogel particles for efficient hydrogen storage at ambient pressure. Surfaces Interfaces 45, 103909. doi:10.1016/j.surfin.2024.103909
Yu, W., Lin, J., Zhao, Z., Fang, J., Wang, Z., Huang, J., et al. (2024c). Polyimide-based porous carbon and cobalt nanoparticle composites as high-performance electromagnetic wave absorbers. RSC Adv. 14 (14), 9716–9724. doi:10.1039/D4RA00488D
Yu, Z., Peng, W., Liu, Q., Liu, Y., and Dai, X. (2024a). Effect of porosity on the infrared extinction properties of carbon aerogel ultrafine powders. J. Non-Crystalline Solids 630, 122895. doi:10.1016/j.jnoncrysol.2024.122895
Zeng, Y., Wang, Y., Zhan, L., Shi, Z., Xiong, C., and Yang, Q. (2025). High-performance chitin-based carbon aerogels with mesoporous structure for electromagnetic interference shielding. Diam. and Relat. Mater. 154, 112198. doi:10.1016/j.diamond.2025.112198
Zhang, E., Lei, C., Li, J., Liu, Y. y., Gao, Y. z., Lv, T., et al. (2020). The preparation of super lightweight magnetic Fe3O4/graphene/carbon aerogels and their use in electromagnetic interference shielding. New Carbon Mater. 35 (6), 707–715. doi:10.1016/S1872-5805(20)60524-8
Zhang, R., Li, B., Yang, Y., Wu, N., Sui, Z., Ban, Q., et al. (2023). Ultralight aerogel sphere composed of nanocellulose-derived carbon nanofiber and graphene for excellent electromagnetic wave absorption. Nano Res. 16, 7931–7940. doi:10.1007/s12274-023-5521-5
Zhao, H., Yang, X., Sun, J., Lv, H., Liu, X., He, X., et al. (2025). Biomass-derived oriented carbon aerogels with integrated high-performance microwave absorption and thermal insulation. J. Mater. Sci. and Technol. 226, 196–204. doi:10.1016/j.jmst.2024.11.051
Keywords: carbon aerogel, smoke box test, infrared interference, porosity, pore size distribution
Citation: Guan Z, Guo A, Li T, Zhai J and Gao X (2025) Research on the influence of pore parameters of carbon aerogel on infrared interference performance. Front. Mater. 12:1641853. doi: 10.3389/fmats.2025.1641853
Received: 05 June 2025; Accepted: 24 July 2025;
Published: 22 August 2025.
Edited by:
Guohai Chen, National Institute of Advanced Industrial Science and Technology (AIST), JapanReviewed by:
Daiming Tang, National Institute for Materials Science, JapanDewu Lin, Peking University, China
Copyright © 2025 Guan, Guo, Li, Zhai and Gao. This is an open-access article distributed under the terms of the Creative Commons Attribution License (CC BY). The use, distribution or reproduction in other forums is permitted, provided the original author(s) and the copyright owner(s) are credited and that the original publication in this journal is cited, in accordance with accepted academic practice. No use, distribution or reproduction is permitted which does not comply with these terms.
*Correspondence: Xinbao Gao, eGJnYW90Z0AxMjYuY29t