 Yuyang Fu
 Zhibo Chen
 Yating Zhang
- School of Materials Science and Engineering, Shanghai Institute of Technology, Shanghai, China
For osmotic energy harvesting based on nanofluidic membranes, aqueous instability, less-than-optimal ion selectivity, and moderately high internal resistance can somewhat restrict its performance advancement. This study develops a novel composite membrane combining 2D SnO2 and vermiculite (VMT) nanosheets to balance permeability and ion selectivity, boosting power density. The optimized membrane achieves an output power density of 0.727 W m-2 using simulated saltwater/river water, offering a promising solution for efficient osmotic energy conversion.
1 Introduction
Notwithstanding significant advancements in renewable energy technology over the past few decades, conventional fossil fuels remain the foundation of the energy sector (Rahman, 2023). To meet growing energy demands and mitigate environmental issues stemming from the imprudent utilization of fossil fuels, it is essential to cultivate renewable and clean energy sources (Achakulwisu et al., 2023; Xie et al., 2023; Vedhanarayanan and Seetha Lakshmi, 2024).
Osmotic energy, predominantly located near the confluence of rivers and the ocean, arises from the chemical potential gradient between freshwater and saltwater or between varying salinities of seawater (Mohammadi Amin and Krühne, 2024; Ramon et al., 2011; Laucirica et al., 2021). Owing to its ecological sustainability, low daily variations, and considerable reserves, it is regarded as a very promising renewable and clean energy source with tremendous development potential (Yip et al., 2016). Research estimates indicate that the global total of accessible osmotic energy is twice the yearly consumption of hydroelectric power output (Zhang et al., 2021). This research highlights the potential significance of osmotic energy as a renewable energy source and illustrates its considerable contribution to the future energy portfolio. Nanofluidic membranes, composed of thin-membrane materials with nanoscale channels or pores, offer significant benefits in osmotic energy conversion due to the distinctive ability of nanoscale channels to regulate ion transport (Tonnah et al., 2023; Xin et al., 2021; Tong et al., 2021). The design and development of high-performance nanofluidic membrane assemblies will promote the efficient capture of osmotic energy and establish a foundation for its substitution of fossil fuels. Researchers have recently reported rapid permeation and highly selective transport in two-dimensional (2D) nanofluidic membranes, presenting novel avenues for the acquisition of osmotic energy. These events reveal significant potential for transcending the restrictions of conventional membrane technologies.2D nanofluidic membranes are typically made up of many exfoliated nanosheet layers stacked on top of one another (Mei et al., 2024; Qin et al., 2022). Ion diffusion over the interlayer space happens vertically, and this process can be done at a tunable nanoscale with control spanning from a few nanometers to sub-nanometer scales (Zhang et al., 2019; Cheng et al., 2018; Abraham et al., 2017; Ling et al., 2014; Raidongia and Huang, 2012). In recent years, researchers have investigated the potential of 2D materials such as boron nitride (BN) (Pendse et al., 2021), molybdenum disulfide (MoS2) (Zhu et al., 2021), graphene oxide (GO) (Ma et al., 2024), and MXene (Ding et al., 2020) for osmotic energy conversion applications. Based on these 2D materials, researchers have produced a number of unique 2D nanofluidic membrane designs. In contrast to conventional one-dimensional (1D) nanofluidic membranes, two-dimensional (2D) nanofluidic membranes are easier to fabricate and possess a broader reference range (Ji et al., 2017; Park and Jung, 2014; Feng et al., 2016).
Composite membranes based on two different 2D nanosheets have consistently exhibited a diverse array of uses in osmotic energy conversion (Wang et al., 2023). Due to their distinctive structure and elevated surface charge density, 2D nanosheets can significantly enhance ionic transport, enabling nanofluidic membranes to realize efficient osmotic energy conversion (Cheng et al., 2019). Nevertheless, the majority of 2D nanosheets are produced through the use of potent acids and oxidizers, which might elevate expenses and result in considerable environmental pollution throughout the fabrication process (Wang and Mi, 2017). Vermiculite (VMT) is an economical natural clay mineral with a worldwide production of around 500,000 t (Xia et al., 2022). VMT possesses a negative structural charge resulting from the substitution of Si4+/Al3+ with low-valent cations. It is defined by the adsorption of Mg2+, K+, and other interlayer cations to preserve electroneutrality, which substantially influences its ion exchange capacity and interfacial properties (Wang and Mi, 2017). Prior studies have shown that bulk VMT may be effectively exfoliated in aqueous solutions, resulting in the production of 2D VMT nanosheets of nanoscale thickness by more environmentally benign and gentle ion exchange methods (Ja et al., 2018). VMT nanosheets (Wang et al., 2024), similar to GO nanosheets (Nde et al., 2024), possess a lamellar structure, rendering them suitable for the formation of nanochannels for osmotic energy conversion. In comparison to other 2D nanosheets, VMT nanosheets exhibit a reduced cost and a more environmentally sustainable preparation method. SnO2 is a prototypical n-type semiconducting metal oxide predominantly utilized in the fabrication of lithium batteries and the advancement of hydrogen sensors (Villarreal et al., 2020; Bhardwaj et al., 2016). Researchers have successfully synthesized and extensively examined SnO2 nanostructures with various morphologies, including nanoparticles, nanotubes, nanosheets, and layered nanostructures (Tonezzer, 2019). Among these numerous forms, 2D SnO2 nanosheets, synthesized using the hydrothermal method (Li et al., 2020), have garnered significant interest and scrutiny in recent years due to their remarkable properties, including a high specific surface area (Zhao et al., 2018) and a distinct exposed crystalline surface (Wang et al., 2013). Due to the presence of a negative charge on the surface and varied carrier mobility in SnO2 nanosheets (Pu et al., 2022), they possess great potential for applications in osmotic energy conversion. Nonetheless, no research has employed SnO2 nanosheets in the domain of osmotic energy conversion. The composite membrane composed of SnO2 and VMT nanosheets is cost-effective and effectively balances permeation current and diffusion voltage, facilitating energy collection and conversion to electrical energy. The composite membrane possesses substantial scientific importance in osmotic energy conversion.
Herein, we report a novel composite membrane consisting of SnO2 nanosheets and VMT nanosheets, characterized by increased ion selectivity, little internal resistance, and excellent aqueous stability. In testing conditions involving artificial river water and artificial saltwater, nanofluidic devices constructed from this composite membrane generated an output power density of 0.727 W m–2. It is worth noting that the 50-fold NaCl concentration gradient employed here mimics the salinity difference between seawater and river water at natural estuaries, a critical target environment for osmotic energy harvesting. This configuration establishes a robust benchmark for evaluating the membrane’s performance under realistic estuarine conditions, where NaCl constitutes the primary electrolyte. Meanwhile, this work provides significant insights and novel research concepts about osmotic energy conversion.
2 Materials and methods
2.1 Materials
Cetyltrimethylammonium bromide (CTAB) and sodium hydroxide (NaOH) were purchased from Titan Technology Discovery Platform; stannous chloride dihydrate (SnCl2-2H2O) was purchased from Yatai United Chemical Co. Ltd. 2D VMT nanosheet dispersion (50 mg mL–1) was purchased from Nano Functional Materials Co. Ltd.; and organic-based nylon microporous filter membranes were purchased from Derfiltration Technology. All chemicals, including sodium chloride (NaCl), potassium chloride (KCl), and lithium chloride (LiCl), were analytically pure.
2.2 Preparation of SnO2 nanosheets
As depicted in Supplementary Figure S1a, 4.52 g of SnCl2-2H2O, 1.28 g of CTAB, and 2.4 g of NaOH were introduced to 70 mL of deionized water, magnetically stirred for 1.5 h to ensure complete dissolution, and thereafter subjected to ultrasonic agitation for 1 h. The ultrasonicated solution was subsequently transferred to a 100 mL hydrothermal reactor, where it experienced a 12-h hydrothermal reaction at 180 °C. The product was extracted and then rinsed multiple times with deionized water and anhydrous ethanol once it reached room temperature. Upon cooling the hydrothermal reactor to ambient temperature, the product was extracted and subjected to numerous cross-washings with anhydrous ethanol and deionized water, respectively. The cleaned product was further annealed at 500 °C for 3 h at a rate of 5 °C min–1 to yield SnO2 nanosheets.
2.3 Preparation of VMT-X%SnO2 composite membranes
As illustrated in Supplementary Figure S1b, a dispersion of VMT nanosheets at a concentration of 5 mg mL–1 was initially generated. Subsequently, 3 mL of VMT nanosheet dispersion was combined with 10%, 30%, and 40% of SnO2 nanosheets, respectively. The two components were meticulously combined using continuous magnetic stirring for 8 h, followed by ultrasonication for 1 h. Following that, using vacuum filtration, the VMT nanosheet dispersion was amalgamated with 3 mL of VMT nanosheet dispersion. After ultrasound treatment, the VMT-10%SnO2, VMT-30%SnO2, and VMT-40%SnO2 mixed dispersions were sequentially deposited via vacuum filtration onto the nylon microporous filter membrane of the organic system and then dried for 8 h at 60 °C, resulting in VMT-X%SnO2 membranes, where X% indicates the mass percentage of SnO2 nanosheets relative to VMT nanosheets in the membrane.
2.4 Characterization
Scanning electron microscopy (SEM, FEI Quanta 200FEG, Netherlands, and Zeiss Sigma 300, Germany) was used to examine the membranes’ microstructure. A dynamic light scattering device (Brookhaven, NanoBrook Omni, United States) was used to test the dispersions’ zeta potential at a concentration of 0.5 mg mL–1. Using Cu Kα irradiation and a scan rate of 5 min–1, X-ray diffraction spectroscopy (XRD) was performed on a Rigaku D/MAX-2200PC X-ray diffractometer.
2.5 Electrochemical workstation testing
Using an electrochemical workstation (CS301M, Wuhan Kotai Instrument Co., Ltd.), the produced devices’ ion transport characteristics and osmotic energy conversion ability were assessed and tested. Ag/AgCl electrodes were utilized for the testing unless otherwise noted. Schematically depicted in Figure 2a, the test apparatus was composed of a composite membrane encased in epoxy resin. The composite membrane was inserted into the epoxy resin plate that separated the device’s two chambers.
2.6 Measurement of power density
Current-voltage (I-V) curves, open-circuit voltage (VOC), and short-circuit current (ISC) were measured across a voltage range of – 0.2 V–0.2 V at a 50-fold KCl concentration gradient (0.5 M for high concentration and 0.01 M for low concentration) to ascertain the maximum power density.
To determine the output power density, external resistors with diverse resistance values were applied to the current-time (I-T) curves at 50-fold concentration gradients of KCl, NaCl, and LiCl (0.5 M for high concentration and 0.01 M for low concentration). Throughout the scanning procedure, the voltage was established at 0 V.
2.7 Ion selectivity test
The I-V curves documenting salinity gradients of 10, 50, 100, 500, and 1,000 times were evaluated to determine ion selectivity utilizing Ag/AgCl electrodes with saturated salt bridges within a voltage measurement range of −0.2–0.2 V and a scan rate range of 10 mVs–1.
2.8 Conductivity test
The conductivity of KCl solutions, ranging from 10−6 M–1 M without a concentration gradient, was assessed by scanning the I-V curves at a rate of 10 mV s–1 across a voltage range of −0.2–0.2 V.
2.9 Ion transport stability test
Using a 0.1 M KCl solution in both chambers, external bias voltages of +1 V and −1 V were sequentially applied to the device, and the I-T curves were recorded every 3,000 s in a cycle to assess the ion transfer stability of the device.
3 Results and discussions
3.1 Microanalysis of nanosheets and composite membranes
Figure 1 shows the microscopic characterization of VMT nanosheets, SnO2 nanosheets and VMT-X%SnO2 composite membranes. VMT nanosheets and SnO2 nanosheets were initially analyzed microscopically. As shown in TEM images (Figures 1a,b), the VMT and SnO2 nanosheets exhibit a distinct lamellar structure at the nanometer scale, with the diameters of the VMT nanosheets surpassing those of the SnO2 nanosheets. The zeta potentials of the VMT and SnO2 nanosheets are −27.47 mV and −23.45 mV, respectively (Figure 1c). The higher zeta potential of VMT (−27.47 mV) establishes a robust electrostatic driving force for cation attraction and anion repulsion, while the moderate zeta potential of SnO2 (−23.45 mV) prevents excessive local charge accumulation that might otherwise impede cation transport through overcrowding. This balance prevents “charge saturation” in nanochannels, ensuring efficient cation migration while maintaining anion exclusion. Subsequently, we can calculate the surface charge density of VMT nanosheets and SnO2 nanosheets by the value of zeta potential as −2.12 mC m–2 and –1.81 mC m–2, respectively (Supporting Note1). Thereafter, we microscopically analyzed the VMT-X%SnO2 composite membrane. The XRD spectra (Figure 1d) indicate that the VMT-30%SnO2 composite membrane preserves the (003) and (009) crystalline absorption peaks characteristic of VMT nanosheets (Zhang et al., 2023) and also exhibits the (110) and (101) crystalline absorption peaks related to SnO2 nanosheets (Chen et al., 2014). The aforementioned phenomenon demonstrated that the VMT-X%SnO2 composite membrane preserved the original lattice structure of both VMT and SnO2 nanosheets. Analysis of the cross-sectional SEM images of the VMT membrane and the VMT-X%SnO2 composite membrane (Figure 1e) reveals that both exhibit a somewhat regular laminar structure, with components organized in close proximity. This structure creates favorable conditions for the development of nano-channels, as well as nanofluidic ion transport (Zhang et al., 2022). The nanochannel dimensions of VMT-X%SnO2 composite membranes exhibit a non-monotonic variation with increasing SnO2 nanosheet additive ratio, demonstrating initial expansion followed by subsequent contraction. The VMT-X%SnO2 composite membranes exhibit a relatively uniform laminar structure, as illustrated in Figure 1f, facilitating the development of nano-channels. The SnO2 nanosheets are deposited and adhere to the planar framework formed by VMT nanosheets. This structure comprises aluminum tetrahedra, silicate tetrahedra, and magnesium octahedra in an orderly arrangement (Wang et al., 2024). Multiple nano-channels for ion transport were established between the SnO2 nanosheets and the VMT nanosheets. In these nano-channels, the surface charges of the walls attract counterions of opposite charge, resulting in the formation of electric double layer (EDL) structures. When the channel dimensions are comparable to the Debye length, the electric double layers, comprising the Stern and diffusion layers, overlap within the channel (Supplementary Figure S2). In this situation, ions with identical surface charges within the channel experience repulsion, whereas counterions can traverse the channel (Chang et al., 2022).
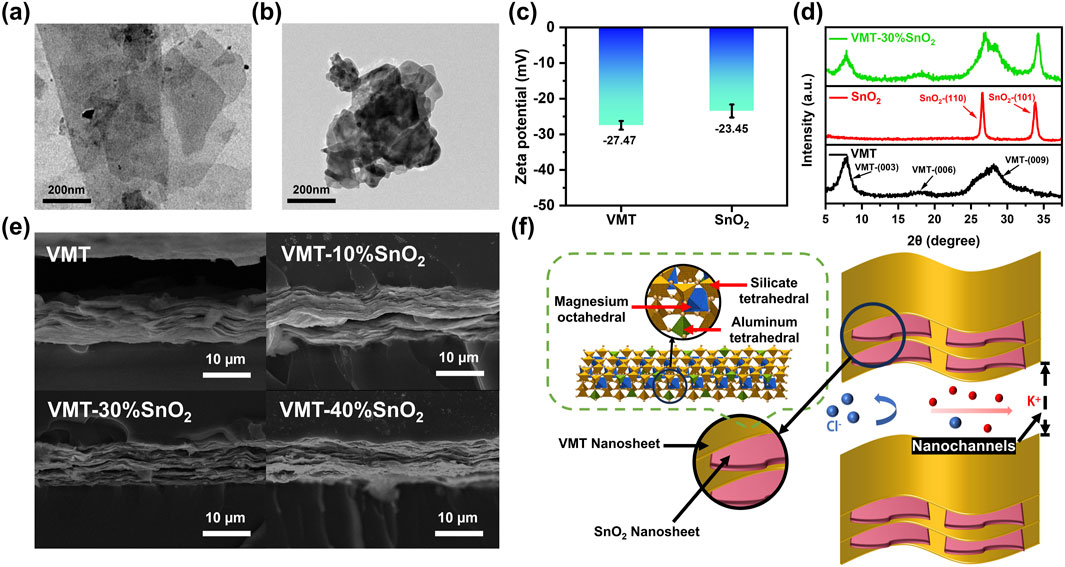
Figure 1. Characterization of VMT nanosheets, SnO2 nanosheets and VMT-X%SnO2 composite membranes. TEM images of (a) VMT nanosheets and (b) SnO2 nanosheets. (c) Zeta potential values of VMT nanosheets and SnO2 nanosheets. (d) XRD spectra of VMT-30%SnO2 composite membrane. (e) Cross-sectional SEM images of VMT membranes and VMT-X%SnO2 composite membranes. (f) Schematic diagram of VMT-X%SnO2 composite membrane nano-channels.
3.2 Relationship between power density and additive ratio
The ion transport properties and osmotic energy conversion performance of the fabricated devices were assessed using an electrochemical workstation (CS301M, Wuhan Kotai Instrument Co., Ltd.). Unless stated otherwise, Ag/AgCl electrodes were employed for all experiments in this investigation. As illustrated in Supplementary Figure S3, the test device was constructed from a composite membrane encased in epoxy resin. The device comprises two chambers: the left chamber contains a low concentration salt solution, while the right chamber contains a high concentration salt solution. The composite membrane is situated within an epoxy resin plate utilized to partition the two chambers. Significantly, given that the test area of the VMT-X%SnO2 composite membranes with varying additive ratios was 0.03 mm2 (Figure 1d), and then enclosed them in devices using epoxy resin for further testing.
In the absence of an external electric field, ions diffuse spontaneously from regions of high concentration to low concentration due to the concentration gradient (Mohammadi Amin and Krühne, 2024). The VMT-X%SnO2 composite membrane possesses a negative surface charge, and its internal nano-channels preferentially allow the passage of cations while repelling anions. The differential ion migration behavior, influenced by the nanolimited domain effect and the material’s surface chemistry, results in cation-preferential transport, leading to charge separation and a net current across both sides of the membrane (Feng et al., 2016). Initially, we should ascertain the optimal additive ratio for the composite membrane. An aqueous KCl solution has been introduced into the chambers on both sides of the device as an electrolyte salt solution. The membrane-forming properties of the VMT-X%SnO2 composite membrane deteriorate as the mass percentage of added SnO2 nanosheets increases. The composite membrane becomes brittle and hence challenging to test when the additive ratio of SnO2 nanosheets exceeds 40%. Consequently, the additive ratio of SnO2 nanosheets incorporated is limited to 40% or below. The values of VOC and ISC are derived by analyzing the I-V curves of VMT-X%SnO2 composite membranes with differing additive ratios under a 50-fold KCl concentration gradient (high concentration of 0.5 M, low concentration of 0.01 M) across a voltage range of −0.2–0.2 V, as illustrated in Figure 2a. Supplementary Equation S3 can be employed to ascertain the power densities of the VMT-X%SnO2 composite membranes with differing additive ratios under a 50-fold KCl concentration gradient subsequent to the deduction of the redox potential (Figure 2b). As the additive ratio of SnO2 nanosheets increases, the power density initially ascends and thereafter declines. The power density reaches its maximum at a 30% additive ratio of SnO2 nanosheets (1.07 W m–2), representing a 55.3% improvement over the power density of pure VMT membrane (0.69 W m–2). As the additive ratio of SnO2 nanosheets grew, VOC also exhibited an upward trend (Figure 2c). Nonetheless, as the additive ratio of SnO2 nanosheets grew, the current density initially ascended and then declined. It reached a maximum additive ratio of 30%, surpassing that of the pure VMT membrane, consequently enhancing the power density (Figure 2d). The observed trend can be attributed to the following mechanism: Initially, with increasing additive ratio of SnO2 nanosheet, the interlayer spacing of nanochannels expands, thereby facilitating enhanced cation transport through the nanochannels and consequently leading to increased current density. However, when the additive ratio reaches a critical threshold, SnO2 nanosheet begin to aggregate within the nanochannels. This aggregation can lead to the blockage of the nanochannels, resulting in a decrease in effective nanochannels and a reduction in cation flux. Consequently, the current density shows a downward trend. The VMT-30%SnO2 composite membranes was chosen for further testing, as the optimal power density was attained with a 30% additive ratio of SnO2 nanosheets.
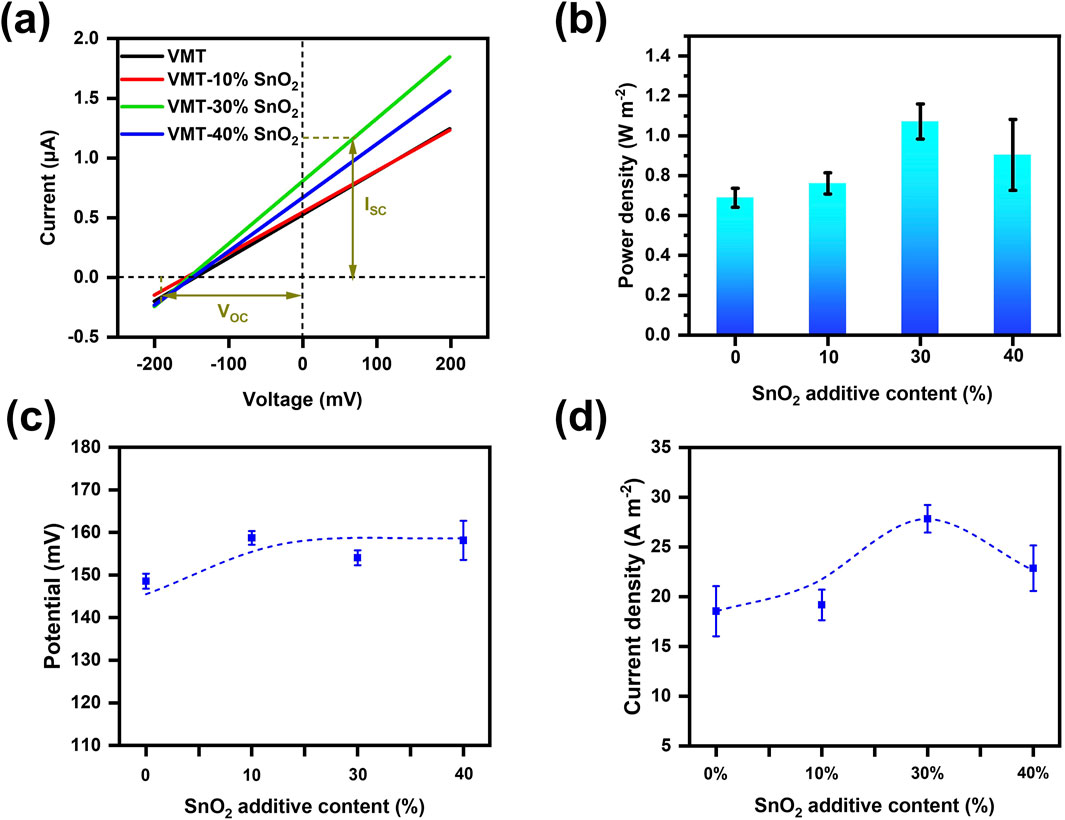
Figure 2. Study on the relationship between power density and additive ratio of VMT-X%SnO2 composite membranes. (a) I-V curves, (b) power density comparison, (c) VOC and (d) current density of VMT-X%SnO2 composite membranes with different additive ratios under 50-fold KCl concentration gradient.
3.3 Output power density test
Nanofluidic membranes can provide electrical energy to externally powered devices. (Wang et al., 2021). Supplementary Equation S4 can be utilized to ascertain the output power densities of the VMT membrane and the VMT-30%SnO2 composite membrane. At a 50-fold KCl concentration gradient (0.01 M/0.5 M), the output power density of the VMT-30%SnO2 composite membrane was 1.059 W m–2, surpassing that of the VMT membrane (Figure 3a). This can be attributed to the superior output current density of the VMT-30% SnO2 composite membrane compared to the VMT membrane (Figure 3b). However, the output power density of the VMT membrane and the VMT-30%SnO2 composite membrane reached reach their peak values under different external resistance values. The reason for this phenomenon can be attributed to the fact that the internal resistance of the VMT-30%SnO2 composite membrane is lower than that of the VMT membrane. Subsequently, we evaluated the output power density of the VMT-30%SnO2 composite membrane using various electrolytes. The output power density was 0.727 W m–2 with NaCl as the electrolyte and 0.531 W m–2 with LiCl, both under a 50-fold electrolyte concentration gradient (0.01 M/0.5 M) (Figure 3c). The addition of KCl, NaCl, and LiCl as electrolytes resulted in output current densities of 28.9 A m–2, 21.4 A m–2, and 15.9 A m–2, respectively, while sustaining a 50-fold electrolyte concentration gradient (0.01 M/0.5 M) (Figure 3d). The 50-fold NaCl concentration gradient (0.01 M/0.5 M) can be regarded as representative of the concentration gradient between artificial river water and artificial seawater. This discrepancy arises from variations in the cation diffusion coefficients of the electrolytes. The hierarchy of cation diffusion coefficients for the three selected electrolytes is K+ > Na+ > Li+. Elevated cation diffusion coefficients yield increased output current densities, thereby enhancing output power densities (Wu et al., 2020).
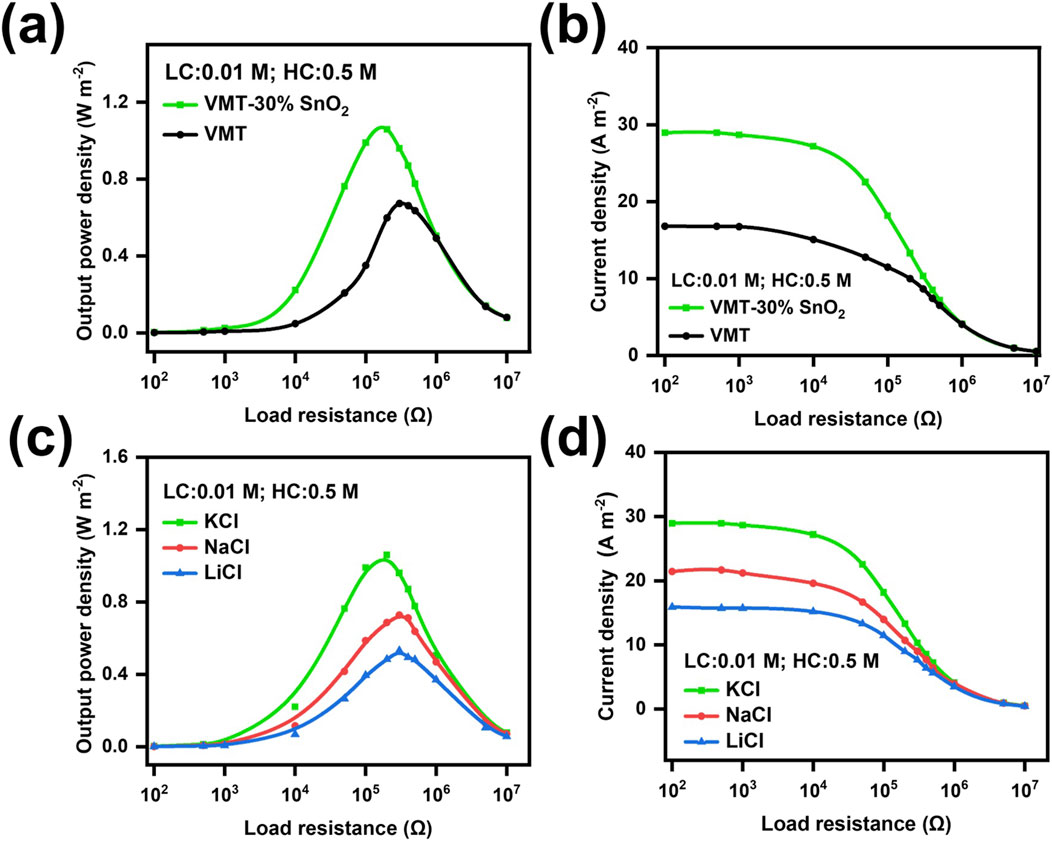
Figure 3. Output power density test of VMT-X%SnO2 composite membrane. Comparison of (a) output power density and (b) output current density of VMT composite membrane as well as VMT-30%SnO2 composite membrane under 50 times KCl concentration gradient (0.01 M/0.5 M) in the selected load range. (c) Output power density and (d) Output current density of VMT-30%SnO2 composite membrane under 50-fold concentration gradient (0.01 M/0.5 M) of different electrolytes in the selected loading range.
3.4 Transmembrane ion transport performance testing
Upon establishing the optimal additive ratio of the composite membrane, we utilized Ag/AgCl electrodes with saturated salt bridges to further examine the transmembrane ion transport performance. Maintaining the concentration of the low side KCl solution at a constant 10−3 M, the I-V curves of the VMT-30%SnO2 composite membrane and the VMT membrane were examined over various KCl solution concentration gradients within the voltage range of −0.2 V–0.2 V (Figures 4a,b). Consequently, the VOC values of VMT-30% SnO2 composite membrane and VMT composite membrane were derived from the I-V curves at varying concentration gradients of KCl solutions, respectively. The absolute values of VOC for the VMT-30% SnO2 composite membrane and VMT membrane escalated with the concentration gradient. The VOC of the VMT-30%SnO2 composite membrane was approximately −50 mV at a concentration gradient of 10 times, and around −98 mV when the gradient increased to 1,000 times. Furthermore, the absolute values of the VOC for the VMT membrane at varying concentration gradients were lower than those of the VMT-30%SnO2 composite membrane, corroborating previous test results (Supplementary Figures S4a,b). Cation transfer number (t+) and energy conversion efficiency are critical metrics for assessing the ion-selective performance of the devices (Ji et al., 2017; Zhou and Jiang, 2020). When the value of t+ equals 1, it signifies that the composite membrane exhibits complete cation selectivity. The t+ values of the VMT-30%SnO2 composite and VMT membranes can be ascertained using Supplementary Equation S5. The maximum value of t+ for the VMT-30% SnO2 device is 0.910, surpassing the maximum value of t+ for the VMT device, which is 0.869. The aforementioned conclusion demonstrates that the ion selectivity of the composite membrane improved with the incorporation of SnO2 nanosheets, while VMT-30%SnO2 exhibited commendable cation selectivity. As the KCl concentration gradient intensifies, the t+ values exhibit a declining trend, attributable to the reduction in the Debye length and concentration polarization at elevated concentrations (Figure 4c). The energy conversion efficiencies of the VMT-30%SnO2 composite membrane and VMT membrane can be obtained from Supplementary Equation S6. The energy conversion efficiency of the VMT-30%SnO2 composite membrane (33.63%) surpasses that of the VMT membrane (27.23%), and the efficiency diminishes with an increasing concentration gradient (Figure 4d).
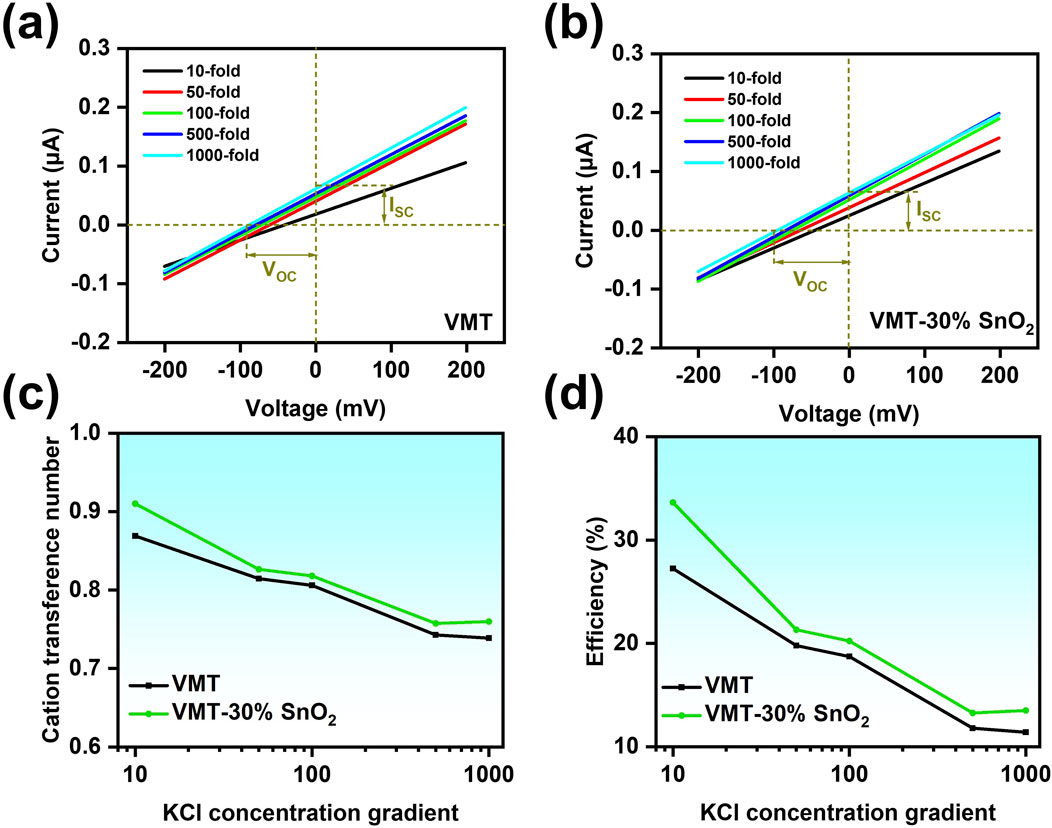
Figure 4. Transmembrane ion transport in VMT-30%SnO2 composite membranes. I-V curves of (a) VMT-30% SnO2 composite membrane and (b) VMT membrane in different concentration gradients of KCl solution. (c) Cation transfer number (t+) and (d) energy conversion efficiency plots of VMT-30%SnO2 composite membrane and VMT membrane at different KCl solution concentration gradients.
3.5 Conductivity test
The ion transport characteristics of VMT-30%SnO2 composite membrane and VMT membrane were further examined by assessing their conductivity. During the conductivity test, the concentration of KCl solution in the chambers on either side of the testing apparatus had to be uniform. The precise value of the nano-channel conductivity was ascertained using Supplementary Equation S7. As the concentration of KCl solution increased, conductivity rose, and the conductivity of the VMT-30%SnO2 composite membrane surpassed that of the VMT membrane (Figure 5a). This phenomenon can be mechanistically ascribed to the expansion of interlayer spacing in nanochannels induced by the introduction of SnO2 nanosheets. Such structural evolution effectively mitigates the steric hindrance during ion transport, thereby facilitating the permeation kinetics of ions through the nanochannel network. The conductance (S), as indicated by Supplementary Equations S7, 8, was predominantly influenced by the surface charge density at low electrolyte solution concentrations. Consequently, when the concentration of the KCl solution was in the low concentration range (below 10−3 M) the conductivity tended to stabilize on a logarithmic scale. The phenomenon was typical of nanofluidic ion transport behavior. The S of KCl solutions in the high concentration range (higher than 10−3 M) was predominantly influenced by the S of the aqueous KCl solution at varying concentrations. Therefore, the conductance trend in this region, when represented on a logarithmic scale, aligned with the linear variation of the intrinsic conductance of KCl.
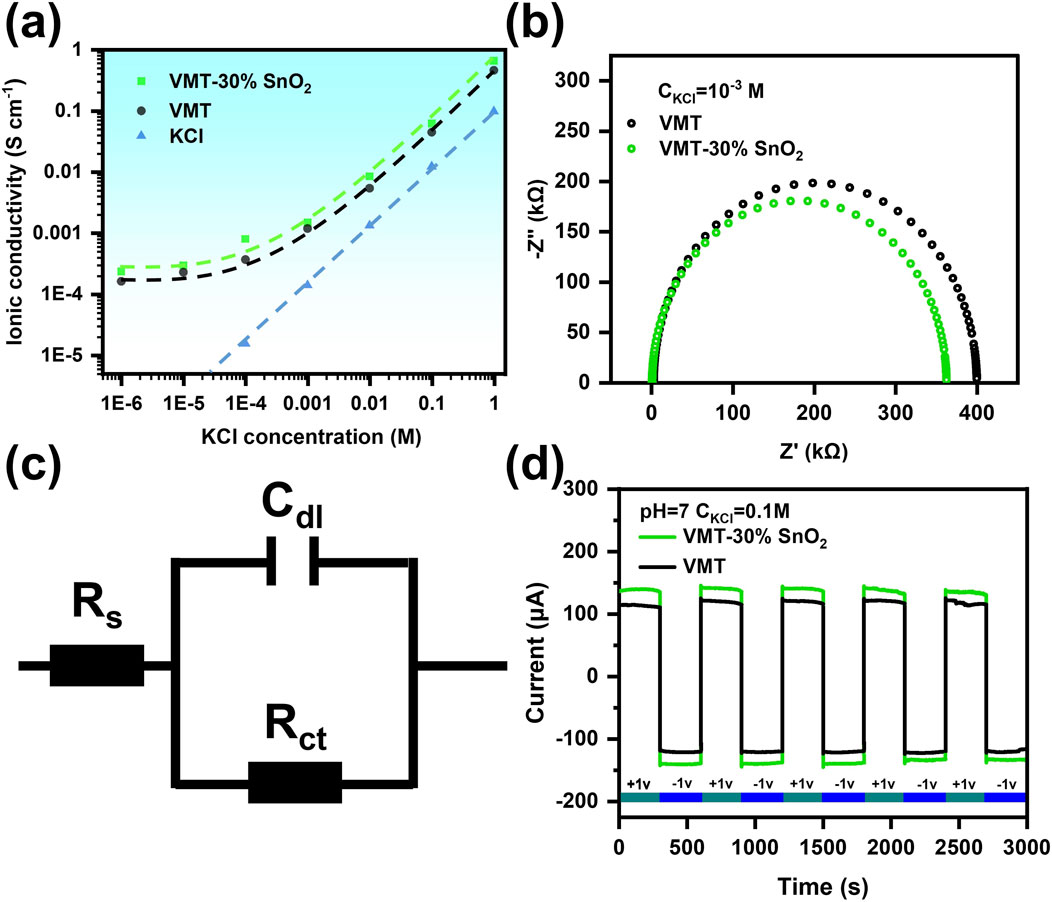
Figure 5. (a) Relationship between ionic conductivity and electrolyte concentration for VMT membranes and VMT-30%SnO2 composite membranes. (b) Nyquist plots of membranes measured in 10−3 M aqueous KCl solution. (c) The equivalent circuit used for the fitting of the EIS curves. (d) Ion transport stability of VMT membrane VMT-30%SnO2 composite membrane under alternating external bias voltage of +1 V and −1 V applied externally over 3,000 s.
Simultaneously, we acquired the Nyquist plots of the VMT membrane compared to the VMT-30%SnO2 membrane by measuring with a KCl solution concentration of 10−3 M on both sides of the chamber (Figure 5b). We subsequently fitted the Nyquist curves using an EIS equivalent circuit (Figure 5c) to get the internal resistance values of the VMT membrane and the VMT-30%SnO2 composite membrane (Table 1). The charge transfer resistance (Rct) of the VMT-30% SnO2 composite membrane was around 361.8 kΩ, marginally lower than the Rct of the VMT membrane at 397.1 kΩ SnO2 nanosheets reduce Rct through synergistic surface charge effects and optimized channel structures, minimizing energy loss and improving ion transport efficiency. The comparatively lower internal resistance was advantageous for output power density, resulting in the VMT-30%SnO2 composite membrane exhibiting a greater output power density than the VMT membrane.
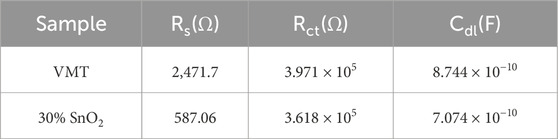
Table 1. Computations subsequent to curve fitting for EIS equivalent circuits.
Ultimately, we assessed the ion transport stability of the composite membranes over 3,000 s by alternately applying +1 V and −1 V external bias voltages outside the testing apparatus. As illustrated in Figure 5d, both the VMT membrane and the VMT-30%SnO2 composite membrane exhibited minimal fluctuations throughout the 3,000 s, indicating that they both demonstrated relatively robust ion transport stability.
4 Conclusion
In summary, this work demonstrated the preparation of VMT/SnO2 nanofluidic membranes and their application in osmotic energy conversion. The composite membrane effectively balanced permeability and ion selectivity due to the synergistic effect of two negatively charged surface nanosheets, resulting in enhanced performance for osmotic energy conversion. The composite membrane’s output power density attained 0.727 W m–2 at a 50-fold NaCl concentration gradient (artificial seawater versus river water). This study provides a novel approach for osmotic energy conversion and energy sustainability, and offers a theoretical basis for the application of VMT/SnO2 nanofluidic membranes in real-life scenarios.
Data availability statement
The original contributions presented in the study are included in the article/Supplementary Material, further inquiries can be directed to the corresponding authors.
Author contributions
YF: Funding acquisition, Conceptualization, Project administration, Formal Analysis, Writing – review and editing, Data curation, Methodology, Writing – original draft, Resources, Investigation. ZC: Visualization, Methodology, Data curation, Validation, Investigation, Conceptualization, Writing – review and editing. YZ: Visualization, Validation, Investigation, Methodology, Writing – review and editing, Conceptualization. BX: Writing – review and editing, Investigation, Conceptualization, Methodology, Resources, Project administration, Visualization.
Funding
The author(s) declare that no financial support was received for the research and/or publication of this article.
Conflict of interest
The authors declare that the research was conducted in the absence of any commercial or financial relationships that could be construed as a potential conflict of interest.
Generative AI statement
The author(s) declare that no Generative AI was used in the creation of this manuscript.
Any alternative text (alt text) provided alongside figures in this article has been generated by Frontiers with the support of artificial intelligence and reasonable efforts have been made to ensure accuracy, including review by the authors wherever possible. If you identify any issues, please contact us.
Publisher’s note
All claims expressed in this article are solely those of the authors and do not necessarily represent those of their affiliated organizations, or those of the publisher, the editors and the reviewers. Any product that may be evaluated in this article, or claim that may be made by its manufacturer, is not guaranteed or endorsed by the publisher.
Supplementary material
The Supplementary Material for this article can be found online at: https://www.frontiersin.org/articles/10.3389/fmats.2025.1648638/full#supplementary-material
References
Abraham, J., Vasu, K. S., Williams, C. D., Gopinadhan, K., Su, Y., Cherian, C. T., et al. (2017). Tunable sieving of ions using graphene oxide membranes. Nat. Nanotechnol. 12 (6), 546–550. doi:10.1038/nnano.2017.21
Achakulwisut, P., Erickson, P., Guivarch, C., Schaeffer, R., Brutschin, E., and Pye, S. (2023). Global fossil fuel reduction pathways under different climate mitigation strategies and ambitions. Nat. Commun. 14 (1), 5425. doi:10.1038/s41467-023-41105-z
Bhardwaj, N., Pandey, A., Satpati, B., Tomar, M., Gupta, V., and Mohapatra, S. (2016). Enhanced CO gas sensing properties of Cu doped SnO2nanostructures prepared by a facile wet chemical method. Phys. Chem. Chem. Phys. 18 (28), 18846–18854. doi:10.1039/c6cp01758d
Chang, C. W., Chu, C. W., Su, Y. S., and Yeh, L. H. (2022). Space charge enhanced ion transport in heterogeneous polyelectrolyte/alumina nanochannel membranes for high-performance osmotic energy conversion. J. Mater. Chem. A 10 (6), 2867–2875. doi:10.1039/d1ta08560c
Chen, C.-J., Zhong-Ai, H., Ying-Ying, H., Li, L., Yu-Ying, Y., Ning, A., et al. (2014). SnO2/Graphite nanosheet composite electrodes and their application in supercapacitors. Acta Physico-Chimica Sin. 30 (12), 2256–2262. doi:10.3866/pku.whxb201409302
Cheng, C., Jiang, G., Simon, G. P., Liu, J. Z., and Li, D. (2018). Low-voltage electrostatic modulation of ion diffusion through layered graphene-based nanoporous membranes. Nat. Nanotechnol. 13 (8), 685–690. doi:10.1038/s41565-018-0181-4
Cheng, Y., Ke, X., Chen, Y., Huang, X., Shi, Z., and Guo, Z. (2019). Lithiophobic-lithiophilic composite architecture through co-deposition technology toward high-performance lithium metal batteries. Nano Energy 63, 103854. doi:10.1016/j.nanoen.2019.103854
Ding, L., Xiao, D., Lu, Z., Deng, J., Wei, Y., Caro, J., et al. (2020). Oppositely charged Ti3C2TXMXene membranes with 2D nanofluidic channels for osmotic energy harvesting. Angew. Chem. 132 (22), 8798–8804. doi:10.1002/ange.201915993
Feng, J., Graf, M., Liu, K., Ovchinnikov, D., Dumcenco, D., Heiranian, M., et al. (2016). Single-layer MoS2 nanopores as nanopower generators. Nature 536 (7615), 197–200. doi:10.1038/nature18593
Janica, I., Del Buffa, S., Mikołajczak, A., Eredia, M., Pakulski, D., Ciesielski, A., et al. (2018). Thermal insulation with 2D materials: liquid phase exfoliated vermiculite functional nanosheets. Nanoscale 10 (48), 23182–23190. doi:10.1039/c8nr08364a
Ji, J., Kang, Q., Zhou, Y., Feng, Y., Chen, X., Yuan, J., et al. (2017). Osmotic power generation with positively and negatively charged 2D nanofluidic membrane pairs. Adv. Funct. Mater. 27 (2), 1603623. doi:10.1002/adfm.201603623
Laucirica, G., Toimil-Molares, M. E., Trautmann, C., Marmisollé, W., and Azzaroni, O. (2021). Nanofluidic osmotic power generators–advanced nanoporous membranes and nanochannels for blue energy harvesting. Chem. Sci. 12 (39), 12874–12910. doi:10.1039/d1sc03581a
Li, J., Jiao, J., Zhang, H., Zhu, P., Ma, H., Chen, C., et al. (2020). Two-dimensional SnO2nanosheets for efficient carbon dioxide electroreduction to formate. ACS Sustain. Chem. and Eng. 8 (12), 4975–4982. doi:10.1021/acssuschemeng.0c01070
Ling, Z., Ren, C. E., Zhao, M. Q., Yang, J., Giammarco, J. M., Qiu, J., et al. (2014). Flexible and conductive MXene films and nanocomposites with high capacitance. Proc. Natl. Acad. Sci. 111 (47), 16676–16681. doi:10.1073/pnas.1414215111
Ma, X., Neek-Amal, M., and Sun, C. (2024). Advances in two-dimensional ion-selective membranes: bridging nanoscale insights to industrial-scale salinity gradient energy harvesting. ACS Nano 18 (20), 12610–12638. doi:10.1021/acsnano.3c11646
Mei, T., Liu, W., Sun, F., Chen, Y., Xu, G., Huang, Z., et al. (2024). Bio-inspired two-dimensional nanofluidic ionic transistor for neuromorphic signal processing. Angew. Chem. Int. Ed. 63 (17), e202401477. doi:10.1002/anie.202401477
Mohammadi Amin, M., and Krühne, U. (2024). Computational fluid dynamics modeling of pressure-retarded osmosis: towards a virtual lab for osmotic-driven process simulations. Membranes 14 (11), 236. doi:10.3390/membranes14110236
Nde, D., Appiah-Kubi, M., Watt, J., Watanabe, F., and Zhao, W. (2024). Tuning fabrication factors for reduced graphene oxide forward osmosis membranes. J. Phys. Chem. C 128 (12), 5300–5312. doi:10.1021/acs.jpcc.3c08114
Park, H. G., and Jung, Y. (2014). Carbon nanofluidics of rapid water transport for energy applications. Chem. Soc. Rev. 43 (2), 565–576. doi:10.1039/c3cs60253b
Pendse, A., Cetindag, S., Rehak, P., Behura, S., Gao, H., Nguyen, N. H. L., et al. (2021). Highly efficient osmotic energy harvesting in charged boron-nitride-nanopore membranes. Adv. Funct. Mater. 31 (15), 2009586. doi:10.1002/adfm.202009586
Pu, W., Xiao, W., Wang, J., Li, X. W., and Wang, L. (2022). Stress and defect Effects on electron transport Properties at SnO2/perovskite interfaces: a first-principles insight. ACS omega 7 (18), 16187–16196. doi:10.1021/acsomega.2c01584
Qin, R., Tang, J., Wu, C., Zhang, Q., Xiao, T., Liu, Z., et al. (2022). Nanofiber-reinforced clay-based 2D nanofluidics for highly efficient osmotic energy harvesting. Nano Energy 100, 107526. doi:10.1016/j.nanoen.2022.107526
Rahman, M. M. (2023). Membranes for osmotic power generation by reverse electrodialysis. Membranes 13 (2), 164. doi:10.3390/membranes13020164
Raidongia, K., and Huang, J. (2012). Nanofluidic ion transport through reconstructed layered materials. J. Am. Chem. Soc. 134 (40), 16528–16531. doi:10.1021/ja308167f
Ramon, G. Z., Feinberg, B. J., and Hoek, E. M. (2011). Membrane-based production of salinity-gradient power. Energy and Environ. Sci. 4 (11), 4423–4434. doi:10.1039/c1ee01913a
Tonezzer, M. (2019). Selective gas sensor based on one single SnO2nanowire. Sensors Actuators B Chem. 288, 53–59. doi:10.1016/j.snb.2019.02.096
Tong, X., Liu, S., Crittenden, J., and Chen, Y. (2021). Nanofluidic membranes to address the challenges of salinity gradient power harvesting. Acs Nano 15 (4), 5838–5860. doi:10.1021/acsnano.0c09513
Tonnah, R. K., Chai, M., Abdollahzadeh, M., Xiao, H., Mohammad, M., Hosseini, E., et al. (2023). Bioinspired angstrom-scale heterogeneous MOF-on-MOF membrane for osmotic energy harvesting. ACS Nano 17 (13), 12445–12457. doi:10.1021/acsnano.3c01924
Vedhanarayanan, B., and Seetha Lakshmi, K. (2024). Beyond lithium-ion: emerging frontiers in next-generation battery technologies. Front. Batter. Electrochem. 3, 1377192. doi:10.3389/fbael.2024.1377192
Villarreal, J., Orrostieta Chavez, R., Chopade, S. A., Lodge, T. P., and Alcoutlabi, M. (2020). The use of succinonitrile as an electrolyte additive for composite-fiber membranes in lithium-ion batteries. Membranes 10 (3), 45. doi:10.3390/membranes10030045
Wang, Z., and Mi, B. (2017). Environmental applications of 2D molybdenum disulfide (MoS2) nanosheets. Environ. Sci. and Technol. 51 (15), 8229–8244. doi:10.1021/acs.est.7b01466
Wang, L., Wang, S., Wang, Y., Zhang, H., Kang, Y., and Huang, W. (2013). Synthesis of hierarchical SnO2nanostructures assembled with nanosheets and their improved gas sensing properties. Sensors Actuators B Chem. 188, 85–93. doi:10.1016/j.snb.2013.06.076
Wang, L., Wang, Z., Patel, S. K., and Elimelech, M. (2021). Nanopore-based power generation from salinity gradient: why it is not viable. ACS Nano 15 (3), 4093–4107. doi:10.1021/acsnano.0c08628
Wang, J., Wang, D., Song, Z., Jiang, N., Zhang, Y., Huang, G., et al. (2023). Efficient solar energy conversion via bionic sunlight-driven ion transport boosted by synergistic photo-electric/thermal effects. Energy and Environ. Sci. 16 (7), 3146–3157. doi:10.1039/d3ee00720k
Wang, J., Cui, Z., Song, Z., He, M., Huang, D., Feng, Y., et al. (2024). Unlocking osmotic energy harvesting potential in challenging real-world hypersaline environments through vermiculite-based hetero-nanochannels. Nat. Commun. 15 (1), 608. doi:10.1038/s41467-023-44434-1
Wu, Y., Xin, W., Kong, X. Y., Chen, J., Qian, Y., Sun, Y., et al. (2020). Enhanced ion transport by graphene oxide/cellulose nanofibers assembled membranes for high-performance osmotic energy harvesting. Mater. Horizons 7 (10), 2702–2709. doi:10.1039/d0mh00979b
Xia, Z., Chen, W., Shevate, R., Wang, Y., Gao, F., Wang, D., et al. (2022). Tunable ion transport with freestanding vermiculite membranes. ACS Nano 16 (11), 18266–18273. doi:10.1021/acsnano.2c05954
Xie, Y., Xu, M., Pu, J., Pan, Y., Liu, X., Zhang, Y., et al. (2023). Large-scale renewable energy brings regionally disproportional air quality and health co-benefits in China. Iscience 26 (8), 107459. doi:10.1016/j.isci.2023.107459
Xin, W., Jiang, L., and Wen, L. (2021). Two-dimensional nanofluidic membranes toward harvesting salinity gradient power. Accounts Chem. Res. 54 (22), 4154–4165. doi:10.1021/acs.accounts.1c00431
Yip, N. Y., Brogioli, D., Hamelers, H. V. M., and Nijmeijer, K. (2016). Salinity gradients for sustainable energy: primer, progress, and prospects. Environ. Sci. and Technol. 50 (22), 12072–12094. doi:10.1021/acs.est.6b03448
Zhang, J., Li, Z., Zhan, K., Sun, R., Sheng, Z., Wang, M., et al. (2019). Two dimensional nanomaterial-based separation membranes. Electrophoresis 40 (16-17), 2029–2040. doi:10.1002/elps.201800529
Zhang, M., Chen, S., Sheng, N., Wang, B., Wu, Z., Liang, Q., et al. (2021). Anisotropic bacterial cellulose hydrogels with tunable high mechanical performances, non-swelling and bionic nanofluidic ion transmission behavior. Nanoscale 13 (17), 8126–8136. doi:10.1039/d1nr00867f
Zhang, M., Sheng, N., Song, Q., Zhang, H., Chen, S., Wang, H., et al. (2022). Enhanced selective ion transport by assembling nanofibers to membrane pairs with channel-like nanopores for osmotic energy harvesting. Nano Energy 103, 107786. doi:10.1016/j.nanoen.2022.107786
Zhang, X., You, H., Hou, J., Feng, Y., Lin, Y., Dai, X., et al. (2023). Green and scalable narrow-gap exfoliation of high-quality two-dimensional vermiculite nanosheets as poly (vinyl chloride) thermal stabilizers. J. Mater. Res. Technol. 24, 3804–3814. doi:10.1016/j.jmrt.2023.04.002
Zhao, C., Gong, H., Lan, W., Ramachandran, R., Xu, H., Liu, S., et al. (2018). Facile synthesis of SnO2hierarchical porous nanosheets from graphene oxide sacrificial scaffolds for high-performance gas sensors. Sensors Actuators B Chem. 258, 492–500. doi:10.1016/j.snb.2017.11.167
Zhou, Y., and Jiang, L. (2020). Bioinspired nanoporous membrane for salinity gradient energy harvesting. Joule 4 (11), 2244–2248. doi:10.1016/j.joule.2020.09.009
Keywords: osmotic energy, energy conversion, nanofluidic membranes, ion selectivity, vermiculite nanosheets, SnO2 nanosheets
Citation: Fu Y, Chen Z, Zhang Y and Xie B (2025) Assembly of vermiculite/SnO2 composite membranes with high ion selectivity for enhancing osmotic energy conversion performance. Front. Mater. 12:1648638. doi: 10.3389/fmats.2025.1648638
Received: 17 June 2025; Accepted: 15 September 2025;
Published: 25 September 2025.
Edited by:
Liang Ma, Southeast University, ChinaReviewed by:
Zhiyi Ding, University of Shanghai for Science and Technology, ChinaDuc Viet Nguyen, Ghent University Global Campus, Republic of Korea
Xinghua Yu, Zhejiang University, China
Copyright © 2025 Fu, Chen, Zhang and Xie. This is an open-access article distributed under the terms of the Creative Commons Attribution License (CC BY). The use, distribution or reproduction in other forums is permitted, provided the original author(s) and the copyright owner(s) are credited and that the original publication in this journal is cited, in accordance with accepted academic practice. No use, distribution or reproduction is permitted which does not comply with these terms.
*Correspondence: Yuyang Fu, MjI2MDgxMTEwQG1haWwuc2l0LmVkdS5jbg==; Zhibo Chen, MTExNTI2MDEzNUBxcS5jb20=