 W. L. Chen1
 X. W. Tang
- 1Zhejiang Guangchuan Engineering Consulting Co., Ltd., Hangzhou, China
- 2Research Center of Coastal and Urban Geotechnical Engineering, Zhejiang University, Hangzhou, China
- 3Engineering Research Center of Urban Underground Space Development of Zhejiang Province, Hangzhou, China
The effects of lateral constrained uniaxial tensile strain on the tensile behavior of needle-punched nonwoven geotextiles were investigated. Tests were conducted on geotextile specimens using a clamping device that imposed lateral constrained strains. The pore size characteristics of geotextiles were obtained using bubble point method (BBP) test. An extended pore size distribution (PSD) model for nonwoven geotextile subjected to lateral constrained uniaxial strain condition was proposed. A finite element method (FEM) model of the geotextile was established to model the tensile behavior of geotextiles under later constrained tensile strains. The experimental results obtained by the BBP tests were analyzed, and the theoretical and simulated values were compared with the BBP-based values. It is showed that the PSD curves of geotextiles shifted towards larger sizes under tensile strain, with insignificant shape changes. The five characteristic pore sizes (O95, O80, O50, O30, O10) exhibited a consistent increasing trend. The theoretical and simulated PSD curves for geotextiles steadily shifted towards larger sizes, maintaining consistent shapes as tensile strain increased. Both the theoretical and FEM models accurately predicted the variations in the experimental O95. For the theoretical model, the correlation coefficients were 0.90 and 0.9962 respectively; for the FEM model, the correlation coefficients were 0.9481 and 0.9866 respectively.
1 Introduction
Geotextiles have been used extensively as filters in areas such as environmental protection, urban construction, flood control, and disaster reduction (Lee and Douglas, 2012; Brachman and Sabir, 2013; Touze-Foltz et al., 2016; Rowe and Yu, 2019; Yang et al., 2019; Dai et al., 2025). The growing use of these materials can be attributed to several factors: easy transportation and on-site installation, high repeatability, and environmental friendliness (Sprague and Sprague, 2016; Dixon et al., 2017; Palmeira, 2023; Wang et al., 2024; Wang et al., 2025; Niu et al., 2025; Zhao et al., 2025).
For proper performance, the design of geotextile filters must attend the following three criteria: retention, permeability and anti-clogging (Koerner, 2005). These related properties of geotextile filter have been investigated by researchers under laboratory conditions, rarely under conditions significantly more severe than those expected in the field. Nonwoven geotextiles are highly compressible materials that in practical engineering applications will work under in-plane tensile conditions (Wu et al., 2008; Palmeira, 2023). For example, in silt fence for erosion control, as separators in roads on compressible grounds, in drainage layers at the base of embankments on soft soils and geotextile bags for hydraulic work (Fourie and Kuchena, 1995; Fourie and Addis, 1997; Moon-Young and Ochola, 1999; Wu et al., 2008; Edwards and Hsuan, 2010; Chen et al., 2019; Tang et al., 2013; Palmeira and Trejos Galvis, 2017; 2018; Palmeira et al., 2019; Palmeira, 2023). The same applies when geotextiles are used in the embankment, when tensile strain exceeding 10% was applied to the geotextile in the direction perpendicular to the long axis of the embankment, the deformation of the geotextile in the direction of the long axis was very small and could be neglected. The lateral constraint exerted by the embankment cover on the geotextile makes the geotextile approximately in a lateral constrained uniaxial tensile condition (Rowe and Myleville, 1990). The tensile strains that develop can affect the pore dimensions of geotextiles and alter their filtration behavior.
Several studies can be found in the literature on the behavior of nonwoven geotextile filters under uniaxial and biaxial tension. Fourie and Kuchena (1995) carried out a permeability tests on needle-punched nonwoven geotextiles after uniaxial strains. The authors observed a significant decrease in flow rate through geotextiles with a relatively small increase in tensile stress. When subjected to tensile stresses of less than 3% of its ultimate tensile strength, the flow rate through the geotextile specimen decreased by up to 80% compared to an unstressed specimen. Fourie and Kuchena (1995) also investigated the behavior of needle-punched nonwoven geotextiles subjected to biaxial tensile strains. The results showed a reduction in the filtration opening size of geotextiles as the load increased, with most of the decrease occurring at very low tensile loads.
Moo-Young and Ochola (1999) carried out tests to investigate the influence of uniaxial tensile strain ranging from 0% to 9% on the apparent opening sizes in needle-punched nonwoven geotextile filters employed in containers for the aquatic disposal of contaminated sediments. It is observed that strain had very little influence on the pore sizes of nonwoven geotextiles. Edwards and Hsuan (2010) reported that the flow rate through nonwoven geotextiles decreased as uniaxial tensile strain increased, with the applied longitudinal tensile stresses ranging from 10% to 40% of the ultimate tensile strength.
Tests to investigate the effects of uniaxial tensile strains of 0%–20% on the filtration performance of heat-bonded nonwoven geotextiles were performed by Wu et al. (2008). The authors observed increases in the filtration opening size and flow rate, along with reductions in the gradient ratio, for geotextile samples. In addition, Wu and Hong (2016) carried out wet sieving tests on needle-punched nonwoven geotextiles subjected to uniaxial and biaxial tensile strains. The results indicated that with the increase in tensile strain, whether uniaxial or biaxial, the pore size of the geotextiles decreased accordingly.
Palmeira et al. (2019) performed bubble point tests (BBP) on needle-punched nonwoven geotextiles under tension and confinement conditions. The results showed that tensile strain can affect the filtration opening size of geotextiles. Under unconfined conditions, both uniaxial strain and equal biaxial strain led to an increase in filtration opening size with increasing tensile strain. On the other hand, in tests under plane strain and unequal biaxial strain conditions, the filtration opening size remained essentially unchanged.
Tang et al. (2021) used gradient ratio tests to study the effects of unequal biaxial tensile strain on the filtration performance of needle-punched nonwoven geotextiles. It is observed that under the same strain ratio, the gradient ratio increased with increasing strain, while the permeability of the soil-geotextile system, the permittivity of the pure geotextile, and the soil loss decreased. Additionally, under the same strain in the machine direction, increasing the strain ratio generally led to a decrease in the gradient ratio and soil loss. The permeability of the soil-geotextile system and the permittivity of the pure geotextile were higher under equal biaxial tensile strain compared to unequal biaxial tensile strain. In previous studies regarding in-plane tensile strains, limited tests have been conducted on the behavior of nonwoven geotextiles under lateral constrained uniaxial tensile strain. As one of the important conditions in practical engineering applications of nonwoven geotextile filters, it is urgent to conduct relevant research.
In this study, the influence of lateral constrained uniaxial tensile strain on the pore size characteristics of needle-punched nonwoven geotextiles were investigated. First, the traditional clamping device was modified to achieve both uniaxial and lateral constrained uniaxial stretching of nonwoven materials without slippage, while simultaneously measuring lateral constraint forces in real time. The pore size characteristic parameters of the geotextile were obtained through BBP testing. Subsequently, a theoretical model for the pore size distribution (PSD) curve of nonwoven geotextiles under lateral constrained uniaxial tensile strain was proposed. Furthermore, a finite element method (FEM) model of the nonwoven geotextile was established to simulate the variation patterns of pore size characteristics under lateral constrained uniaxial tensile strain. The mechanism of filtration performance changes in nonwoven geotextiles under lateral constrained uniaxial tensile strain were further elucidated by analyzing the experimental results. The relevant research findings can provide theoretical foundations and technical support for designing geotextile filtration layers under complex strain conditions in practical engineering applications.
2 Experimental
2.1 Materials
Laterally constrained uniaxial tensile tests were performed on polyester continuous filament needle-punched geotextiles with different specifications. The mass per unit area of the geotextiles was 101 g/m2 and 365 g/m2, respectively referred to as NW101 and NW365. The main properties of these geotextiles are shown in Table 1.
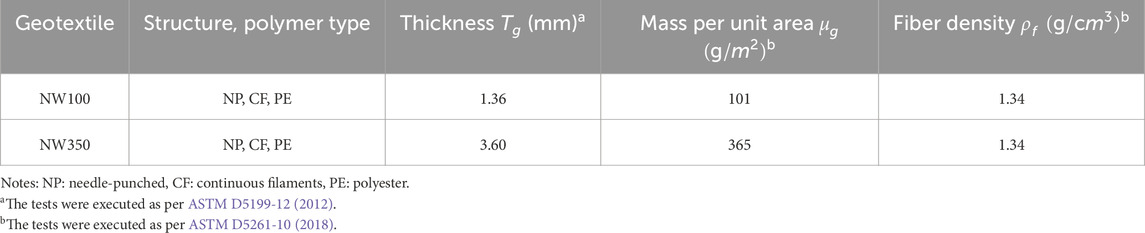
Table 1. Properties of nonwoven geotextiles.
2.2 Tensioning device
Li et al. (2024) invented an instrument capable of applying uniaxial tensile and laterally constrained uniaxial tensile on geotextiles, as shown in Figure 1a. The device consists of a pair of upper and lower clamping devices, with two smooth rods extending vertically from the top through pre-cut holes on clamping device and linear slide. Lateral constraint of the geotextile was achieved by adjusting the quick clamps fixed on the linear slide. Subsequent application in tests on nonwoven geotextile revealed insufficient clamping force, leading to slippage, which prompted modifications to the instrument in this study. Additionally, based on the demand for collection of data on the relationship between lateral constrained force and vertical strain, corresponding improvements were made to the instrument, as shown in Figure 1b.
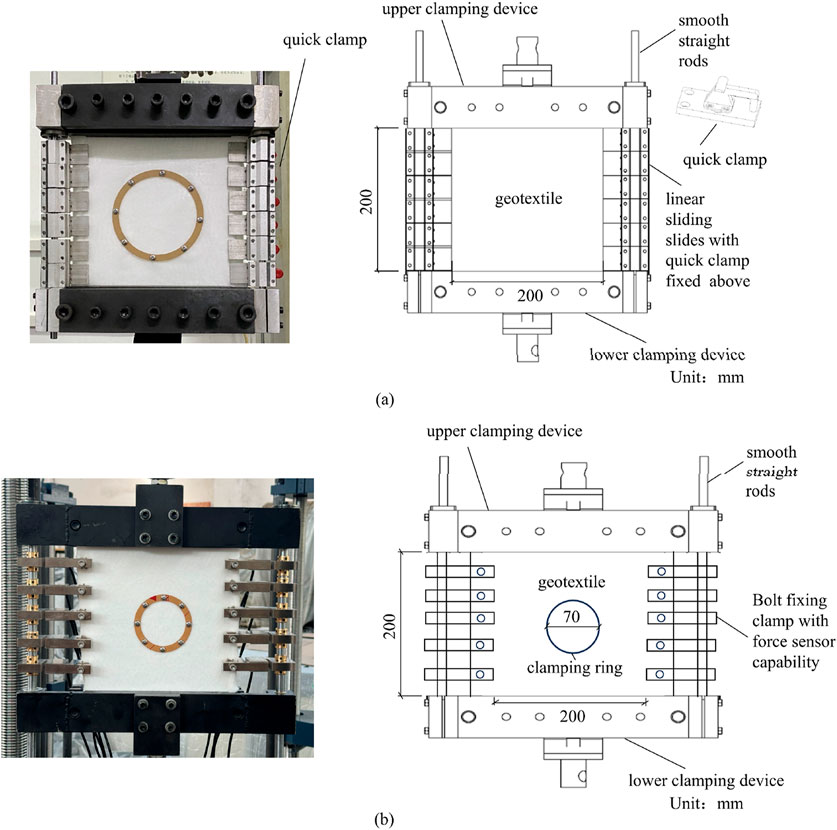
Figure 1. Laterally constrained uniaxial tensile test device: (a) original device; (b) improved device.
Five clamps were uniformly distributed between the upper and lower clamping devices, securing the geotextile on both sides with bolts. Moreover, these clamps were equipped with force sensors, allowing for the synchronous measurement of lateral constrained forces. In the geotextile lateral tensile test, a 250 mm wide and 300 mm high geotextile specimen was tested, as per T/ZWEIA 001-2023. The specimens were clamped 50 mm on the upper and lower sides, and 25 mm on each of the left and right sides, with a geotextile section of 200 mm wide and 200 mm high subjected to tension, as shown in Figure 1b. To ensure consistency with previous studies and based on strain levels reported in the literature (Rowe and Myleville, 1990; Schimelfenyg et al., 1990; Won and Kim, 2007; Izadi et al., 2018; Palmeira et al., 2019), a strain loading rate of 20 mm/min was applied during testing. The geotextiles were stretched to four strain levels: 5%, 10%, 15%, and 20%. After reaching the specified strain, a self-made acrylic clamping ring with an inner diameter of 70 mm was used to secure the geotextile, preventing it from rebounding (Figure 1b), for subsequent pore size characteristic testing.
2.3 Bubble point test
According to the relevant specifications released by the American Society for Testing and Materials (ASTM), dry sieving test (ASTM D4751-20, 2020) and bubble point test (ASTM D6767-12, 2012) are the two most used methods for measuring the pore characteristics of geotextiles. However, due to factors such as electrostatic effects, particle shape, and sieving equipment, the repeatability of dry sieving results is poor and the errors are significant (Bhatia and Smith, 1994; Blond et al., 2015). Palmeira and Trejos Galvis (2018) tested a steel wire mesh with known pore sizes using the BBP test, and the difference between the actual pore size and the BBP result was less than 5%, indicating that the measurement accuracy of this method can meet the purpose of this study. Moreover, the currently available instruments for this test can achieve fully automatic measurement, thereby reducing the corresponding operational errors.
Therefore, the pore size distribution and characteristic pore size (On) of nonwoven geotextile samples under specified tensile strain conditions were measured using the BBP test, as per ASTM D6767. Here, On represents the n percentage of pores smaller than that size (Palmeira et al., 2019; Li et al., 2023). The experimental apparatus used was the BSD-PB bubble pressure method membrane pore size analyzer produced by Bester Instrument Co., Ltd. The geotextile samples were first completely wetted with anhydrous ethanol (surface tension at 20°C is 21.90 mN/m), and then air was used to squeeze the infiltrating liquid in the sample pores. As the airflow velocity gradually increased, the pressure in the air increased, and the infiltrated liquid in the largest pores was first pushed out. Then, as the pressure increased, the pore size decreased, and the infiltrating liquid in the pores was successively pushed out. By testing the relationship between gas pressure and flow rate, pore size distribution data can be obtained according to the Washburn equation (Washburn, 1921).
3 Results
3.1 Pore size distribution
Figure 2 shows the variation of pore size distribution curves on specimens of geotextile NW100 and NW350 under lateral constrained uniaxial tensile strains ranging from 0% to 20%. The PSD curves for two geotextiles all exhibited an overall shift to the right under tensile strain, indicating an enlargement of all pores. The shapes of the PSD curves also demonstrated insignificant changes, suggesting a relatively uniform change in all pores.
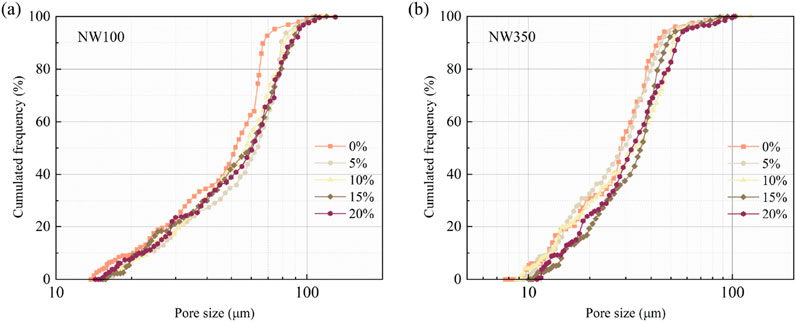
Figure 2. Variation of PSDs with lateral constrained uniaxial tensile: (a) NW100; (b) NW350.
However, for NW100 under 5% strain, the PSD curve corresponding to the cumulative frequency below 50% was located on the far right side of the other curves, indicating larger pore sizes than under other strains. Additionally, for NW350, the PSD curve under 20% strain was located on the left side of the curve under 15% strain for the cumulative frequency below 60%, indicating smaller pore sizes than under 15% strain. Therefore, the effect of lateral constrained tensile strain on the pore size characteristics of the geotextiles cannot be analyzed merely by observing the pore size distribution curves. The characteristic pore sizes were determined in this study using the PSD curve to quantify variations in pore size.
3.2 Pore size
The O95 is widely used in current application standards for geotextiles to evaluate and design geotextile filters. Additionally, the importance of other characteristic pore sizes representing different-sized pores has gradually been recognized by scholars (Wu and Hong, 2016; Palmeira et al., 2019; Li et al., 2024a). Therefore, different characteristic pore sizes On (with n = 10%, 30%, 50%, 80%, and 98%) were determined as shown in Figure 3.
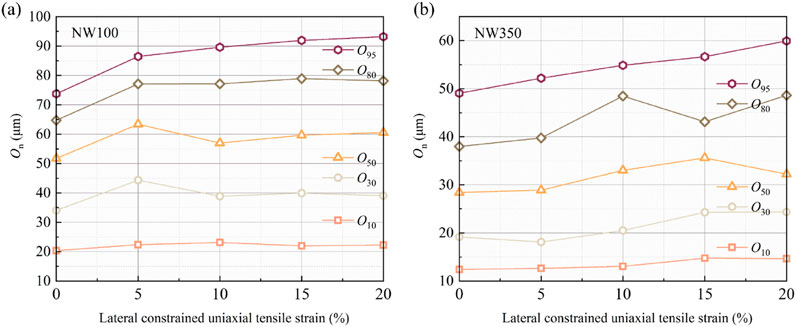
Figure 3. Variation of characteristic pore sizes with lateral constrained uniaxial tensile: (a) NW100; (b) NW350.
It can be noted that with the increase of tensile strain, the five characteristic pore sizes show a relatively stable increasing trend. When the tensile strain increased from 0% to 20%, the O95, O80, O50, O30, and O10 of NW100 increased by 9.30%, 14.58%, 17.03%, 20.72%, and 26.38%, respectively, while the corresponding characteristic pore sizes of NW350 increased by 18.05%, 27.21%, 13.43%, 28.02%, and 22.21%, respectively.
With respect to an unstrained specimen, for a tensile strain of 5%, the characteristic pore sizes of NW100 and NW350 exhibited opposite trends. The characteristic pore sizes of NW100 increased sharply under a tensile strain of 5% and then gradually increased with further strain (O95, O80, O10) or first decreased and then increase (O50, O30). In contrast, the characteristic pore sizes of NW350 steadily increased or even first decreased and then increased under tensile strain. For example, O30 value decreased by 5.45% when the tensile strain increased from 0% to 5% and then increased by 13.16% when the tensile strain increased from 5% to 10%.
It should be noted that in the previous study of Li et al. (2024c), experimental investigations and numerical simulations were conducted on the pore size characteristic changes of nonwoven geotextiles under uniaxial tensile strain, with results showing certain similarities to the lateral constrained uniaxial tensile test findings in this study.
The uniaxial tensile tests revealed that the equivalent pore size of nonwoven geotextiles exhibited an initial decrease followed by an increase or a continuous increase within the 0%–20% tensile strain range, with the transition point occurring in the 0%–10% strain interval. Similarly, fluctuations in equivalent pore size were observed in the early stages of lateral constrained uniaxial tensile tests (e.g., an initial increase followed by a decrease or vice versa), while a general increasing trend with strain was noted in later stages. This phenomenon may be explained by the pore size characteristic variation model proposed by Li et al. (2024c): under small strain conditions, fiber reorientation leads to adjustments in pore shape, resulting in either an increase or decrease in pore size. As the confined uniaxial tensile strain further increases, the overall pore shape of the nonwoven geotextiles undergoes minimal changes, with pore enlargement becoming dominant and thus leading to an increasing trend in pore size in subsequent stages.
Regarding the inconsistency between lateral constrained uniaxial and uniaxial tensile tests in the early stages, as well as the fluctuation in equivalent pore size for both NW100 and NW350 nonwoven geotextiles when lateral constrained uniaxial tensile strain exceeds 15%, this may be attributed to the necking effect in tensile specimens. As the stretching process progresses, localized deformation induces stress concentration, prompting fiber rearrangement and consequently altering the equivalent pore size. This observation aligns with the findings of Palmeira et al. (2019) on the plane strain behavior of nonwoven geotextiles. It can be noted that when uniaxial tensile strain exceeds 10%, the equivalent pore size begins to significantly deviate from results obtained under lateral constraint-free conditions, attributing this discrepancy to the necking effect.
4 Theoretical model
4.1 Original model
Combining the stochastic and geometrical probability approaches, the cumulative probability of a particle with diameter r passing through the layers of unstrained nonwoven geotextiles
where
4.2 Modified model
Considering the Poisson effect, the dimensions of the geotextile will change under lateral constrained uniaxial tensile strain
where
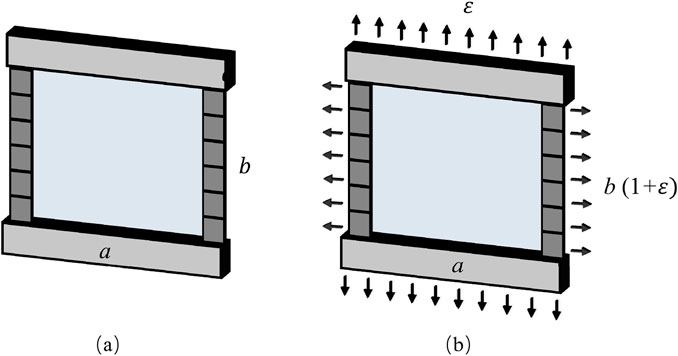
Figure 4. Schematic of geotextile specimen under lateral constrained uniaxial tensile strain: (a) before; (b) after.
Hence, the mass per unit area of geotextile
Consider a fiber oriented at an initial orientation angel
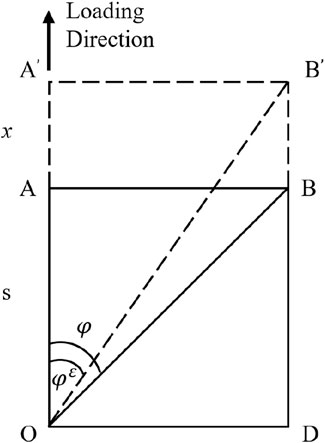
Figure 5. Relationship between fiber and fiber strain.
Diving Equation 13 by s from Equation 12, the fiber orientation can be expressed as Equation 14
Therefore, the directional parameter
The coverage parameter
Finally, the cumulative probability of a particle with diameter r passing through the layers of strained nonwoven geotextiles
4.3 Prediction result
The parameters contained in Equation 17 were recorded in Tables 1, 2. The in-plane fiber orientation distributions of geotextiles were obtained utilizing the two-dimensional digital analysis and calculated using Equation 4 (Li et al., 2023; 2024b). The fiber diameter and Poisson’s ratio were measured and recorded in Table 2 (Li et al., 2024b). Based on these parameters, the theoretical PSD curves of geotextiles were calculated according to Equation 17.
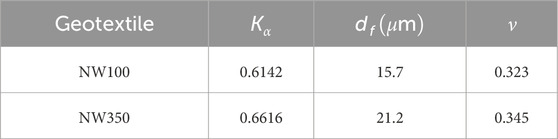
Table 2. Nonwoven geotextiles parameters.
Figure 6 presents the variation of theoretical PSD curves with lateral constrained uniaxial tensile strain. As the tensile strain increases, the PSD curves of both geotextiles steadily shift towards the larger direction, and the shape of the curves remains consistent. This trend is generally consistent with the experimental results. Moreover, since it is a theoretical model, the PSD curves obtained were very smooth, with consistent shapes and intervals of change with strain, in contrast to the uncertainties present in the actual experimental process.
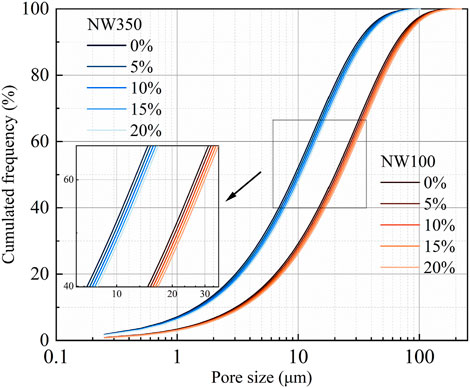
Figure 6. Variation of theoretical PSDs with lateral constrained uniaxial tensile.
Figure 7 compares the theoretical results for the On (with n = 10%, 30%, 50%, 80%, and 95%) values of NW100 and NW350 under lateral constrained uniaxial tensile strains of 0%, 5%, 10%, 15%, and 20% with the results of the BBP tests.
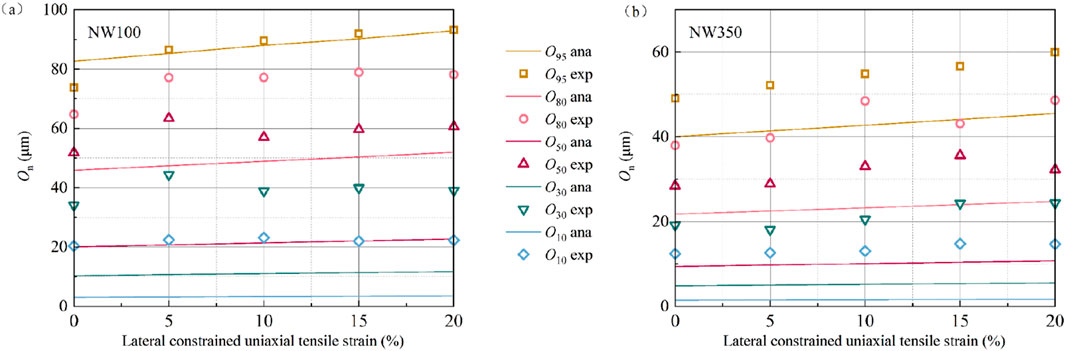
Figure 7. Comparison of experimental and theoretical value of On with lateral constrained uniaxial tensile strain: (a) NW100; (b) NW350.
For NW100, the theoretical values of the five characteristic pore sizes all show an increasing trend with strain. Within the 0%–20% strain range, the theoretical values of characteristic pore sizes O10, O30, O50, and O80 were all smaller than the BBP-based values. For O95, the theoretical and BBP-based values were very close, with an error within 12.04%. Moreover, the theoretical model can accurately predict the variations in the experimental O95, the correlation coefficient between the two is 0.90.
For NW350, the theoretical values of the five characteristic pore sizes also show an increasing trend. Within the 0%–20% strain range, the theoretical values of the five characteristic pore sizes are all smaller than BBP-based values. For O95, the error between the two is within 31.76%. However, the theoretical model can also accurately predict the trend of the experimental O95, with a correlation coefficient of 0.9962.
O95 was widely used in engineering, but the theoretical O95 values obtained cannot completely match the experimental values. Tang et al. (2020) measured the initial O95 value of the unstrained geotextiles and used the difference between this experimental value and the theoretical value to correct the theoretical O95 error. Therefore, the model proposed in this study is effective, as it can accurately predict the trend of O95 with increasing lateral constrained uniaxial tensile strain, providing a reference for filter design under engineering strain.
5 FEM model
Li et al. (2024a) developed a FEM model to simulate the microstructure and tensile behavior of needle-punched nonwoven geotextiles. Since the materials targeted in this study are consistent with those of Li et al. (2024a), the same material parameters and model parameters were adopted for analysis. To maintain geometric similarity with the experimental setup (where full-scale specimens had 50 mm top/bottom clamping and 25 mm lateral constraints), the FEM dimensions were proportionally scaled down by a factor of 10, resulting in 5 mm clamping length, 2.5 mm lateral constraints, and a 20 mm × 20 mm central test area. A 20% strain was applied in the y-direction of the model, and boundary conditions were set in the x-direction to achieve lateral constraint effects, as shown in Figure 8. The FEM and pore network model (PNM) methods were subsequently combined to obtain the pore size characteristics. Details of the model, FEM–PNM method, and input parameter measurement methods can be found in Li et al. (2024a).
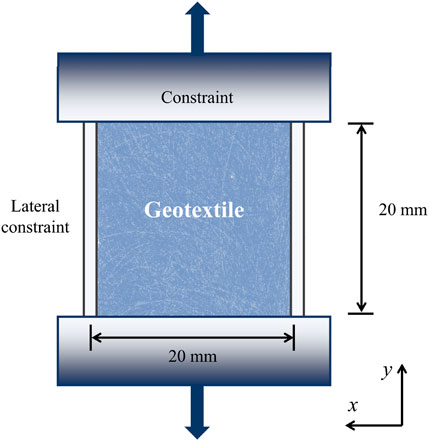
Figure 8. Model configuration of lateral constrained uniaxial tensile test.
Figure 9 presents the variation of simulated PSD curves with lateral constrained uniaxial tensile strain. Consistent with the results of the BBP test and theoretical results, as the strain increases, the PSD curve shifted steadily to the right, indicating an increase in pore size, and the shape of the curve remained unchanged.
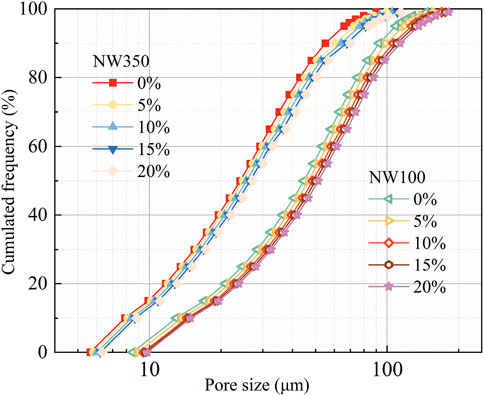
Figure 9. Variation of FEM-simulated PSD curves with lateral constrained uniaxial tensile strain.
Figure 10 compares the FEM simulation results for the On (with n = 10%, 30%, 50%, 80%, and 95%) values of NW100 and NW350 under lateral constrained uniaxial tensile strains of 0%, 5%, 10%, 15%, and 20% with the results of the BBP tests. The simulated values for O50, O30, and O10 of the two geotextiles were all smaller than the BBP values. For NW100, the simulated values of O10 were more than 32.99% smaller than the BBP results in the 20% strain range, the simulated-O30 values were more than 20.27% smaller, and the simulated-O30 values were more than 13.89% smaller. For NW350, the simulated-O10 values were more than 35.61% smaller, the simulated-O30 values were more than 12.82% smaller, and the simulated-O50 values were more than 14.54% smaller. The simulated values of O95 and O80 were larger than the BBP values. For NW100 within 20% tensile strain ranges, the simulated values of O95 and O80 were more than 2.13% and 36.35% larger, respectively, than the BBP values. For NW350, the simulated values of O95 and O80 were more than 3.67% and 34.25% larger, respectively, than BBP-based values.
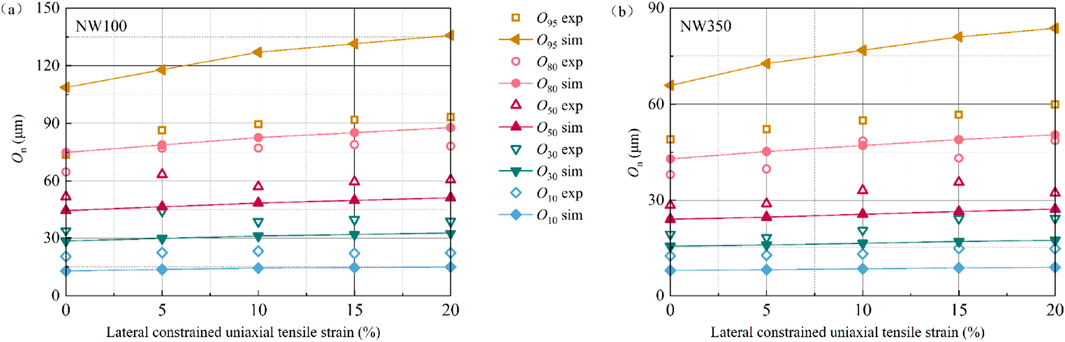
Figure 10. Comparison of experimental and simulated value of On with lateral constrained uniaxial tensile strain: (a) NW100; (b) NW350.
The FEM model can accurately predict the variations in the experimental O95, the correlation coefficient between the FEM-based and BBP-based values are 0.9481 and 0.9866, respectively. As mentioned above, by correcting the initial simulated O95 value of the unstrained geotextiles, the strained O95 under certain engineering strains can be predicted to be used for filtration design. Therefore, the FEM was considered effective for nonwoven geotextiles under lateral constrained uniaxial tensile strain conditions.
6 Conclusion
In this study, the pore size characteristics of needle-punched nonwoven geotextiles under laterally constrained uniaxial tensile strain condition were investigated. The pore sizes were acquired using BBP method. A theoretical model of PSD curves of geotextiles subjected to lateral constrained conditions was proposed. A FEM model of the geotextile was established to model the tensile behavior of geotextiles under lateral constrained tensile strains. Some major conclusions can be drawn as follows.
(1) The PSD curves for two geotextiles shifted to enlargement direction under tensile strain, with insignificant shape changes. The five characteristic pore sizes (O95, O80, O50, O30, O10) showed a stable increasing trend: The pore sizes increased sharply at 5% strain, then gradually increased or first decreased then increased. For strains above 15%, the pore sizes of both geotextiles either increased or decreased.
(2) As tensile strain increases, the theoretical and simulated PSD curves for both geotextiles shift steadily towards larger sizes, with consistent shapes. There is a certain discrepancy between the BBP-based characteristic pore size values and the theoretical values, and there is also a discrepancy between BBP-based and simulated values.
(3) The theoretical model and FEM model can accurately predict the variations in the experimental O95, with a correlation coefficient of 0.90 and 0.9962 for theoretical model, and 0.9481 and 0.9866 for FEM model. The two methods proposed can offer a reference for filter design under engineering strain.
Data availability statement
The raw data supporting the conclusions of this article will be made available by the authors, without undue reservation.
Author contributions
WC: Writing – original draft. QX: Funding acquisition, Writing – review and editing, Investigation. KL: Writing – review and editing, Writing – original draft. JQ: Writing – review and editing, Data curation, Validation. XC: Writing – review and editing, Supervision. XT: Resources, Funding acquisition, Supervision, Writing – review and editing.
Funding
The author(s) declare that financial support was received for the research and/or publication of this article. This study was supported by the National Natural Science Foundation of China (52478369), the Key Laboratory of Geotechnical and Underground Engineering of Ministry of Education, Tongji University (KLE-TJGE-B2202), the Zhejiang Province Public Welfare Technology Application Research Project (LGG22E080002), the Key Water Science and Technology Project of Zhejiang Province (RB2027), and the Cultural Heritage Bureau of Zhejiang Province (2023006).
Conflict of interest
Authors WC, QX, JQ and XC were employed by Zhejiang Guangchuan Engineering Consulting Co., Ltd.
The remaining authors declare that the research was conducted in the absence of any commercial or financial relationships that could be construed as a potential conflict of interest.
Generative AI statement
The author(s) declare that no Generative AI was used in the creation of this manuscript.
Publisher’s note
All claims expressed in this article are solely those of the authors and do not necessarily represent those of their affiliated organizations, or those of the publisher, the editors and the reviewers. Any product that may be evaluated in this article, or claim that may be made by its manufacturer, is not guaranteed or endorsed by the publisher.
References
ASTM D4751-20 (2020). Standard test method for determining the apparent opening size of a geotextile. West Conshohocken, PA, USA: ASTM International.
ASTM D5199-12 (2012). Standard test method for measuring the nominal thickness of geosynthetics. West Conshohocken, PA, USA: ASTM International.
ASTM D5261-10 (2018). Standard test method for measuring mass per unit area of geotextiles. West Conshohocken, PA, USA: ASTM International.
ASTM D6767-12 (2012). Standard test method for pore size characteristics of geotextiles by capillary flow test. West Conshohocken, West Conshohocken, PA, USA: ASTM International.
Bhatia, S. K., and Smith, J. L. (1994). Comparative study of bubble point method and mercury intrusion porosimetry techniques for characterizing the pore-size distribution of geotextiles. Geotext. Geomembranes 13 (10), 679–702. doi:10.1016/0266-1144(94)90068-x
Blond, E., Veermersch, O., and Diederich, R. (2015). “A comprehensive analysis of the measurement techniques used to determine geotextile opening size: AOS, FOS, O90, and ‘bubble point,” in Geosynthetics conference 2015, portland Oregon (US), 1190–1199.
Brachman, R. W. I., and Sabir, A. (2013). Long-term assessment of a layered-geotextile protection layer for geomembranes. J. Geotech. Geoenviron. Eng. 139 (5), 752–764. doi:10.1061/(asce)gt.1943-5606.0000812
Chen, H. X., Liu, X., Feng, S. J., Chen, J. N., Zhang, D. M., and Zhou, A. (2019). Microscale investigation into mechanical behaviors of heat-bonded nonwoven geotextile using DEM. Geotext. Geomembranes 47 (3), 429–438. doi:10.1016/j.geotexmem.2019.01.002
Dai, N., Li, L., Xu, K., Lu, Z., Hu, X., and Yuan, Y. (2025). Development of a standardized data collection and intelligent fabric quality prediction system for the weaving department. J. Eng. Fibers Fabr. 20. doi:10.1177/15589250241312778
Dixon, N., Fowmes, G., and Frost, M. (2017). Global challenges, geosynthetic solutions and counting carbon. Geosynth. Int. 24 (5), 451–464. doi:10.1680/jgein.17.00014
Edwards, M., and Hsuan, G. (2010). “Permittivity of geotextiles with biaxial tensile loads,” in Proceedings of the 9th International Conference on Geosynthetics, Guaruja, Brazil, 23–27 May, 2010, 1135–1140.
Fourie, A. B., and Addis, P. C. (1997). The effect of in-plane tensile loads on the retention characteristics of geotextiles. Geotech. Test. J. 20 (2), 211–217. doi:10.1520/gtj10740j
Fourie, A. B., and Kuchena, S. M. (1995). The influence of tensile stresses on the filtration characteristics of geotextiles. Geosynth. Int. 2 (2), 455–471. doi:10.1680/gein.2.0018
Izadi, E., Decraene, T., De Strijcker, S., Bezuijen, A., and Vinckier, D. (2018). A laboratory investigation on the impact resistance of a woven geotextile. Geotext. Geomembranes 46 (1), 91–100.
Lee, E. C., and Douglas, R. S. (2012). Geotextile tubes as submerged dykes for shoreline management in Malaysia. Geotext. Geomembranes 30, 8–15. doi:10.1016/j.geotexmem.2011.01.003
Li, K. Y., Tang, X. W., Fei, M. L., Xiang, Q. Q., and Wang, T. Q. (2024a). Numerical investigation of the tensile behaviors of needle-punched nonwoven geotextiles. Geotext. Geomembranes 52 (1), 110–120. doi:10.1016/j.geotexmem.2023.09.006
Li, K. Y., Tang, X. W., Fei, M. L., Chou, J., Chen, X. L., Xiang, Q. Q., et al. (2024b). Permeability of needle-punched nonwoven geotextiles subjected to uniaxial tensile strains. Geosynth. Int. 32, 289–301. doi:10.1680/jgein.24.00001
Li, K. Y., Tang, X. W., Fei, M. L., Feng, S. J., Tang, J. J., Xiang, Q. Q., et al. (2024c). Tensile behavior of needle-punched nonwoven geotextiles based on in-situ X-ray computed tomography and numerical simulation. Geotext. Geomembranes 52 (6), 1251–1263. doi:10.1016/j.geotexmem.2024.08.004
Li, K. Y., Tang, X. W., Zhao, W. F., Liang, J. X., Chen, X. L., and Lin, W. K. (2023). Microstructure characteristics of nonwoven geotextiles using SEM and CT methods. Geotext. Geomembranes 51, 293–302. doi:10.1016/j.geotexmem.2022.11.003
Moo-Young, H. K., and Ochola, C. (1999). Strain effects on the filtration properties of Geotextiles. Geosynthetics 99, 757–768.
Niu, Q. H., Wang, J., He, J. B., Yuan, W., Chang, J. F., Wang, W., et al. (2025). Evolution of pore structure, fracture morphology and permeability during CO2+O2in-situ leaching process of fractured sandstone. Energy 315, 134348. doi:10.1016/j.energy.2024.134348
Palmeira, E. M. (2023). “Geotextile filters: from idealization to real behaviour (Giroud lecture),” in 12th international conference on geosynthetics (Roma, Italy: Associazione Geotecnica Italiana), 3–45. doi:10.1201/9781003386889-1
Palmeira, E. M., Melo, D. L. A., and Moraes-Filho, I. P. (2019). Geotextile filtration opening size under tension and confinement. Geotext. Geomembranes 47 (4), 566–576. doi:10.1016/j.geotexmem.2019.02.004
Palmeira, E. M., and Trejos Galvis, H. L. (2017). Opening sizes and filtration behaviour of nonwoven geotextiles under confined and partial clogging conditions. Geosynth. Int. 24 (2), 125–138. doi:10.1680/jgein.16.00021
Palmeira, E. M., and Trejos Galvis, H. L. (2018). Evaluation of predictions of nonwoven geotextile pore size distribution under confinement. Geosynth. Int. 25 (2), 230–241. doi:10.1680/jgein.18.00004
Rawal, A. (2010). Structural analysis of pore size distribution of nonwovens. J. Text. Inst. 101 (4), 350–359. doi:10.1080/00405000802442351
Rawal, A., and Agrahari, S. K. (2011). Pore size characteristics of nonwoven structures under uniaxial tensile loading. J. Mater. Sci. 46 (13), 4487–4493. doi:10.1007/s10853-011-5342-x
Rowe, R. K., and Myleville, B. L. J. (1990). Implications of adopting an allowable geosynthetic strain in estimating stability. Proc. Fourth Int. Conf. Geotext. Geomembranes Relat. Prod. 1, 131–136.
Rowe, R. K., and Yu, Y. (2019). Magnitude and significance of tensile strains in geomembrane landfill liners. Geotext. Geomembranes 47 (3), 439–458. doi:10.1016/j.geotexmem.2019.01.001
Schimelfenyg, P., Fowler, J., and Leshchinsky, D. (1990). Fabric reinforced containment dyke, New Fedford superfund site. Proc. 4th Int. Conf. Geosynth. the Hague 1, 149–154.
Sprague, C. J., and Sprague, J. E. (2016). “Chapter 24: geosynthetics in erosion and sediment control,” in Geotextiles from design to applications. Editor R. M. Koerner (Amsterdam: Woodhead Publishing Inc.), 531–562.
Tang, L., Tang, Q., Zhong, A. L., and Li, H. J. (2020). Prediction of pore size characteristics of needle-punched nonwoven geotextiles subjected to uniaxial tensile strains. Adv. Civ. Eng. 2020, 8839519. doi:10.1155/2020/8839519
Tang, L., Wang, Y., Wang, Y., Tang, X. W., and Du, P. M. (2021). Effect of unequal biaxial tensile strains on the filtration behaviour of continuous filament needle-punched nonwoven geotextiles. Geotext. Geomembranes 49 (3), 501–515. doi:10.1016/j.geotexmem.2020.10.001
Tang, X. W., Tang, L., She, W., and Gao, B. S. (2013). Prediction of pore size characteristics of woven slit-film geotextiles subjected to tensile strains. Geotext. Geomembranes 38, 43–50. doi:10.1016/j.geotexmem.2013.05.001
Touze-Foltz, N., Bannour, H., Barral, C., and Stoltz, G. (2016). A review of the performance of geosynthetics for environmental protection. Geotext. Geomembranes 44 (5), 656–672. doi:10.1016/j.geotexmem.2016.05.008
Wang, K. Y., Cao, J., Ye, J. H., Qiu, Z. L., and Wang, X. Q. (2024). Discrete element analysis of geosynthetic-reinforced pile-supported embankments. Constr. Build. Mater. 449 (25), 138448. doi:10.1016/j.conbuildmat.2024.138448
Wang, X. Y., Liu, H., Meng, X., and Hu, H. S. (2025). GPR-FWI-Py: open-source Python software for multi-scale regularized full waveform inversion in Ground Penetrating Radar using random excitation sources. Gomput. Geosci. 197, 105870. doi:10.1016/j.cageo.2025.105870
Washburn, E. W. (1921). Note on a method of determining the distribution of pore sizes in a porous material. Proc. Natl. Acad. Sci. 7 (4), p115–p116. doi:10.1073/pnas.7.4.115
Won, M. S., and Kim, Y. S. (2007). Internal deformation behavior of geosynthetic-reinforced soil walls. Geotext. Geomembranes 25 (1), 10–22. doi:10.1016/j.geotexmem.2006.10.001
Wu, C. S., and Hong, Y. S. (2016). The influence of tensile strain on the pore size and flow capability of needle-punched nonwoven geotextiles. Geosynth. Int. 23 (6), 422–434. doi:10.1680/jgein.16.00007
Wu, C. S., Hong, Y. S., and Wang, R. H. (2008). The influence of uniaxial tensile strain on the pore size and filtration characteristics of geotextiles. Geotext. Geomembranes 26 (3), 250–262. doi:10.1016/j.geotexmem.2007.09.004
Yang, Y., Wei, Z., Cao, G., Yang, Y., Wang, H., Zhuang, S., et al. (2019). A case study on utilizing geotextile tubes for tailings dams construction in China. Geotext. Geomembranes 47 (2), 187–192. doi:10.1016/j.geotexmem.2018.12.007
Keywords: geosynthetics, nonwoven geotextiles, pore size characteristics, lateral constrained uniaxial tensile, numerical modeling
Citation: Chen WL, Xia QY, Li KY, Qiu J, Chen XL and Tang XW (2025) Pore size characteristics of needle-punched nonwoven geotextiles under laterally constrained condition. Front. Mater. 12:1648818. doi: 10.3389/fmats.2025.1648818
Received: 17 June 2025; Accepted: 07 July 2025;
Published: 08 August 2025.
Edited by:
Bing Bai, Beijing Jiaotong University, ChinaReviewed by:
Mahmoud Ebrahimi, University of Maragheh, IranChen Peipei, Beijing University of Civil Engineering and Architecture, China
Copyright © 2025 Chen, Xia, Li, Qiu, Chen and Tang. This is an open-access article distributed under the terms of the Creative Commons Attribution License (CC BY). The use, distribution or reproduction in other forums is permitted, provided the original author(s) and the copyright owner(s) are credited and that the original publication in this journal is cited, in accordance with accepted academic practice. No use, distribution or reproduction is permitted which does not comply with these terms.
*Correspondence: X. W. Tang, dGFuZ3hpYW93dUB6anUuZWR1LmNu