 Shiffali Middha1
 Amritpal Singh Nindrayog2Jagriti Mahajan1Nitin Tandon3Satvir Singh3Indu Sharma4,5Harmanjit Singh Dosanjh6Jaspal Singh7Aman Mahajan8Nupur Prasad9Deekshant Varshney10,11Lovepreet Singh12*Anupinder Singh1*
- 1Department of Physics, Multifunctional Materials Laboratory, Guru Nanak Dev University, Amritsar, India
- 2Department of Physics, Lyallpur Khalsa College, Jalandhar, India
- 3Department of Applied Sciences, School of Engineering and Technology, CT University, Punjab, Ludhiana, India
- 4Department of Physics, Career Point University, Hamirpur, India
- 5Center for Green Energy Research, Career Point University, Hamirpur, India
- 6School of Chemical Engineering and Physical Sciences, Lovely Professional University, Phagwara, India
- 7Department of Physics, Punjabi University, Patiala, India
- 8Department of Physics, Materials Science Lab, Guru Nanak Dev University, Amritsar, India
- 9Research and Development Cell, Lovely Professional University, Phagwara, India
- 10Centre of Research Impact and Outcome, Chitkara University, Rajpura, India
- 11Centre for Promotion of Research, Graphic Era (Deemed to be University), Uttarakhand, Dehradun, India
- 12Brain Science Institute, Korea Institute of Science & Technology, Seoul, Republic of Korea
The detection of volatile organic compounds (VOCs), particularly acetone, is crucial for environmental monitoring and biomedical diagnostics. In this study, Mg-substituted PrFeO3 perovskite oxides (PrMgxFe1-xO3, x = 0.1, 0.2, 0.3) were synthesized via a sol-gel auto-combustion route using Fe and Mg precursors extracted from waste-derived materials, offering a sustainable and cost-effective synthesis pathway. Pristine PrFeO3 exhibited p-type semiconducting behavior; however, Mg incorporation induced a shift to n-type conduction, attributed to the generation of oxygen vacancies and Fe3+/Fe2+ charge compensation. Gas sensing measurements conducted between 60 °C and 210 °C identified 150 °C as the optimal operating temperature. The x = 0.3 composition demonstrated the highest response to acetone, with rapid response (33 s) and recovery (20 s) times. The sensor exhibited excellent repeatability at 50 ppm acetone, moderate selectivity toward ethanol, propanol, and DMF, and demonstrated good long-term stability. The VOC sensing performance is attributed to defect engineering via Mg substitution, increased oxygen vacancy concentration, and improved charge carrier dynamics. These results highlight the potential of waste-integrated perovskite sensors in advancing sustainable gas-sensing technologies.
1 Introduction
The rapid expansion of industrial activities, especially in developing nations, has raised critical concerns about occupational safety and environmental pollution. Industries such as petrochemicals, chemical manufacturing, biomedical devices, and food processing frequently emit hazardous gases, necessitating reliable, real-time gas detection systems. Acetone, a prominent volatile organic compound (VOC), is widely used across sectors and poses substantial health risks, including respiratory issues, neurotoxicity, and organ damage upon prolonged exposure. Moreover, its high volatility and flammability demand continuous monitoring to mitigate fire hazards and ensure workplace safety (Fan et al., 2011; WANG et al., 2016; Li et al., 2016; Liu et al., 2008).
Metal oxide semiconductor (MOS)-based gas sensors have garnered attention due to their fast response, durability, and operational simplicity. These sensors operate by detecting changes in electrical resistance due to interactions between adsorbed oxygen species (O2−, O−, O22-) and the target gas. However, conventional MOS materials such as ZnO and SnO2 often exhibit limited selectivity, high operating temperatures, and inadequate long-term stability (Leidinger et al., 2014; Mirzaei et al., 2016; Fergu and s, 2007; Saha et al., 2016a; Arya et al., 2025). This has prompted the exploration of novel materials with tailored physicochemical properties.
Perovskite oxides (ABO3) have emerged as promising candidates for gas sensing owing to their structural flexibility, high oxygen ion mobility, and mixed ionic-electronic conductivity (MIEC) (He et al., 2023; Shannon and Prewitt, 1970; Pei et al., 2021; Litzelman et al., 2005; Nakhaei and Sanavi Khoshnoud, 2021; Benyoussef et al., 2024; Harikrishnan et al., 2022; Ge et al., 2001; Ecija et al., 2025; Yang et al., 2023; Sultan et al., 2014; Singh et al., 2024; Jia et al., 2015; Bertocci et al., 2017; Moseley, 1992; Qin et al., 2021; Ma et al., 2018a; Shella et al., 2020; Bui and Shin, 2023). Their A- and B-site cation tunability allows precise engineering of electronic structure, defect chemistry, and catalytic activity—critical parameters for optimizing gas adsorption, charge transport, and surface reactions. Among them, praseodymium orthoferrite (PrFeO3) stands out due to its structural stability and ease of cation substitution.
Recent studies indicate that doping transition or rare-earth metals at the B-site—such as Sm3+, Ti3+, Co3+, Mn2+, and Ni2+—can significantly enhance gas sensing by modulating oxygen vacancy concentrations and electronic properties (Pei et al., 2021; Litzelman et al., 2005; Nakhaei and Sanavi Khoshnoud, 2021; Benyoussef et al., 2024; Harikrishnan et al., 2022; Ge et al., 2001; Ecija et al.; Yang et al., 2023; Sultan et al., 2014; Singh et al., 2024). For example, Sm-doped PrFeO3 exhibited improved acetone sensitivity due to increased defect density and better charge transport (Pei et al., 2021). Previous studies have shown that Mg doping in rare-earth orthoferrites can significantly enhance acetone sensing performance by increasing oxygen vacancies and improving charge transport dynamics (Liu et al., 2008).
In this study, we explore the synthesis and gas sensing characteristics of Mg-substituted PrFeO3 (PrMgxFe1-xO3, x = 0.1, 0.2, 0.3), focusing on the role of Mg2+ (ionic radius = 0.72 Å) in replacing Fe3+ (0.645 Å) to induce structural distortion, create oxygen vacancies, and modify electronic behavior. Magnesium (Mg2+) was selected as a dopant for Fe3+ due to its larger ionic radius (0.72 Å) compared to Fe3+ (0.645 Å) and its lower valence state. This substitution creates a charge imbalance that is compensated by the formation of oxygen vacancies (V_O..), which are known to act as active sites for gas adsorption. Additionally, the size mismatch induces lattice strain, promoting enhanced surface reactivity. Notably, both Fe and Mg precursors were extracted from waste-derived sources, aligning the synthesis approach with sustainable and circular economy principles. This green synthesis strategy aims to reduce the dependence on commercial salts, lower material costs, and minimize environmental impact.
Comprehensive characterization using XRD, FESEM, XPS, BET, and gas sensing measurements is employed to elucidate the structure-property-performance relationships. The findings offer valuable insights into defect-controlled perovskite design and position PrMgxFe1-xO3 as a candidate for VOC sensing applications, especially in acetone detection under moderate operating conditions.
2 Experimental methodology
2.1 Synthesis
Mg-substituted PrFeO3 perovskite oxides, PrMgxFe1-xO3 (x = 0.1, 0.2, and 0.3), were synthesized via a sol-gel auto-combustion method using waste-derived precursors for iron and magnesium. High-purity praseodymium oxide (Pr6O11, Sigma Aldrich, ≥99.9%) was dissolved in concentrated nitric acid (HNO3, 68%) under mild heating (70 °C) and continuous stirring for 30 min to obtain a clear praseodymium nitrate solution. Industrial red mud (rich in Fe2O3) was used as the iron source. 20 g of dried red mud powder was treated with 200 mL of 2.0 M hydrochloric acid (HCl) and heated at 80 °C for 4 h under constant magnetic stirring (600 rpm) in a reflux setup to enhance leaching efficiency. The leachate was filtered using Whatman No. 42 filter paper to remove silicates and residual solids. The resulting Fe3+-enriched solution was reacted with 30 mL of concentrated nitric acid (HNO3) and evaporated at 60 °C on a rotary evaporator under reduced pressure (150 mbar) to obtain crystalline Fe(NO3)3·9H2O (Bartel et al., 2019; Agrawal et al., 2004; Rai et al., 2012). Scrapped magnesium alloy (AZ31 type) was washed with acetone, dried, and ground into small flakes. 10 g of alloy was dissolved in 100 mL of 1.5 M nitric acid (HNO3) at 60 °C for 3 h under stirring (500 rpm). After complete dissolution, the solution was filtered to remove insoluble residues like aluminum and zinc. The clear filtrate containing Mg2+ ions was subjected to slow evaporation at 60 °C to yield purified Mg(NO3)2·6H2O crystals (Cui et al., 2019; Royani et al., 2018; Jiao et al., 2019). The schematic view of the sol-gel auto-combustion route shown in Figure 1. The stoichiometrically required amounts of Fe(NO3)3·9H2O, Mg(NO3)2·6H2O, and praseodymium nitrate were then dissolved in 100 mL of triply distilled deionized water and thoroughly mixed for 1 h at 60 °C. Citric acid (molar ratio 1:1 with total metal cations) was added as a chelating agent, followed by ethylene glycol (molar ratio 2:1 with citric acid) to promote the formation of a polymeric gel. The resulting solution was stirred continuously at 80 °C until it formed a homogeneous gel (∼3 h). The gel was then dried in a hot-air oven at 250 °C, where auto-combustion spontaneously occurred within 5–10 min, yielding a loose, voluminous ash-like powder. This as-prepared precursor was calcined at 700 °C for 6 h in a muffle furnace to remove organic residues and initiate perovskite phase formation. Finally, the powders were finely ground and sintered at 900 °C for 2 h to achieve better crystallinity and phase purity.
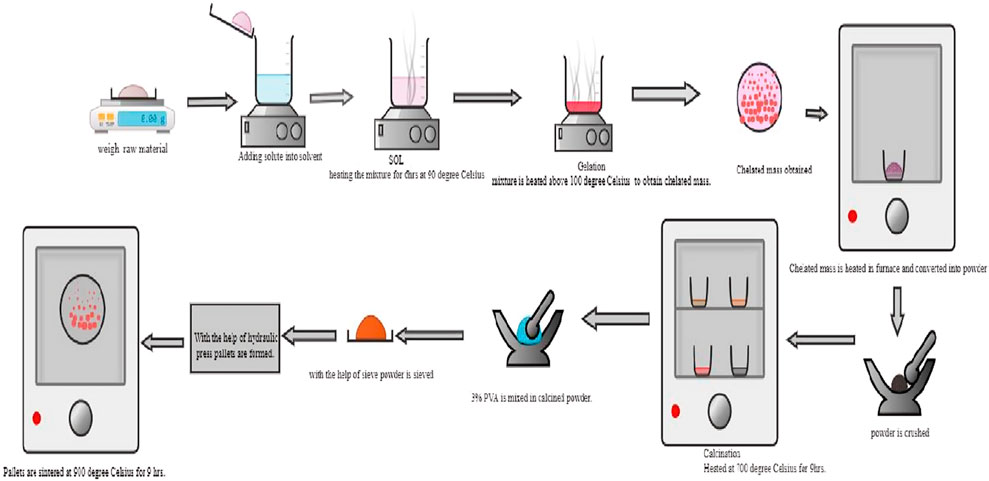
Figure 1. Schematic representation of the synthesis process for PrMgxFe1-xO3 (x = 0.1, 0.2 & 0.3) via sol-gel auto-combustion route.
2.2 Characterization
The structural, morphological, chemical, and gas sensing characteristics of PrMgxFe1-xO3 (x = 0.1, 0.2 & 0.3) were meticulously analyzed employing diverse methodologies. X-ray diffraction (XRD) was performed using a Bruker D8 X-ray diffractometer (Cu Kα radiation, λ = 1.54 Å, 40 kV, 30 mA) to verify the single-phase orthorhombic structure. Morphological examination was conducted utilizing Field Emission Scanning Electron Microscopy (FESEM) with a Carl Zeiss Supra 55, operating at 20 kV, while compositional analysis was executed using Energy Dispersive X-ray Spectroscopy (EDX) with an Oxford Instruments X-MaxN 51-XMX0004 detector. Surface area and porosity assessments were performed utilizing the Brunauer–Emmett–Teller (BET) technique with a Micromeritics ASAP 2020 analyzer, while pore size distribution was ascertained by the Barrett–Joyner–Halenda (BJH) method. An investigation of the oxidation state of elements of the prepared composition was conducted using X-ray Photoelectron Spectroscopy (XPS) using a Thermo Scientific K-Alpha + spectrometer, employing a monochromatic Al Kα source at 1486.6 eV. The gas detecting performance was assessed utilizing a Keithley 2,450 SourceMeter for real-time resistance measurements.
2.3 Fabrication and measurement of gas sensors
A pellet is self-standing and mechanically stable. Therefore, sintered sample pellets were taken, and two electrodes of silver paste were drawn on one of their surfaces with a fine brush. The paste was then allowed to dry at room temperature (Singh et al., 2024). Finally, the sensors were connected to a measurement system to monitor their electrical responses.
Response and efficiency measurement of a gas sensor involves quantifying its response to the presence and concentration of specific gases in the environment, primarily through changes in its electrical properties. Initially, the sensor’s baseline electrical characteristic, particularly resistance (R0), was measured in a clean-air environment to serve as a reference. After the sensors were exposed to a known concentration of the target gas in a controlled gas chamber. The concentration of the target gas was measured by the formula (Jia et al., 2015):
Where the Concentration of the target gas is denoted by C, measured in ppm, the volume of the gas fraction is mentioned as Φ, and the liquid density is given by the symbol ρ (g/mL). V1 is the volume of the liquid measured in μL. The chamber volume is expressed as V2 (L), and M is the molecular weight of the liquid in g/mol.
The interaction between the gas molecules and the sensing material caused changes in its resistance, denoted by Rg. This change was due to the adsorption and reaction of gas molecules on the sensor’s surface, altering its conductivity.
The sensor’s responses ‘S’ can be denoted by the formula:
Where R0 is the resistance in clean air, and Rg is the resistance when exposed to the target gas (Bertocci et al., 2017; Moseley, 1992; Qin et al., 2021; Ma et al., 2018a; Shella et al., 2020).
3 Results and discussion
3.1 Structural and morphological analysis
The Goldschmidt tolerance factor (t) is a key parameter used to predict the stability and structural distortion of perovskite oxides. It is defined as:
where
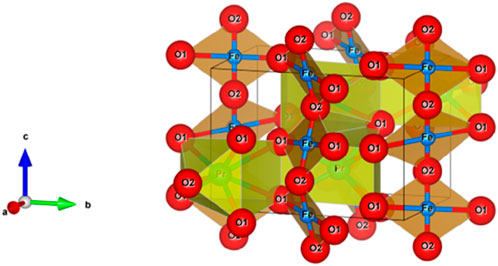
Figure 2. Crystal structure of PrFeO3.
The X-ray diffraction (XRD) patterns confirm the formation of a single-phase orthorhombic perovskite structure for PrMgxFe1-xO3 (x = 0.1, 0.2 & 0.3), with space group Pbnm (No. 62), consistent with PDF No. 01-074–1472 for PrFeO3, shown in Figure 3, indicating the successful incorporation of Mg2+ into the perovskite lattice. The primary diffraction peaks at 2θ ≈ 22.7 °, 32.4 °, 46.9 °, and 57.9 ° correspond to the (101), (121), (202), and (123) planes, respectively. The crystallite size (D) was estimated using the Scherrer equation:
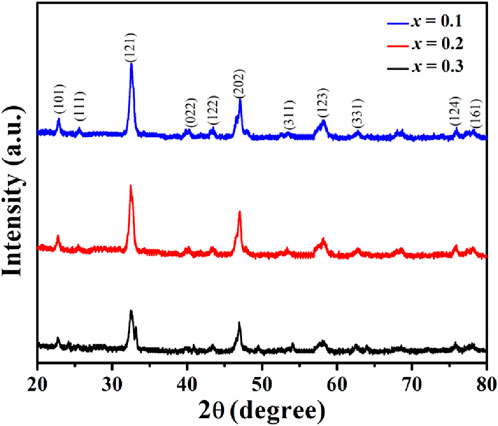
Figure 3. X-ray Diffraction (XRD) patterns of PrMgxFe1-xO3 (x = 0.1, 0.2 & 0.3), confirming the formation of a single-phase orthorhombic perovskite structure with space group Pbnm.
Where K is the shape factor (0.9), λ is the X-ray wavelength (Cu Kα = 1.5406 Å), β is the full-width at half maximum (FWHM), and θ is the Bragg angle. The calculated crystallite sizes showed a decreasing trend with increasing Mg content: 13.21 nm (x = 0.1), 12.20 nm (x = 0.2), and 10.75 nm (x = 0.3), indicating that Mg substitution introduces structural distortions, thereby limiting crystal growth. To further analyze lattice imperfections, the dislocation density was determined using the Williamson–Smallman relation:
The calculated dislocation densities were found to be 5.72
Where β is the FWHM in radians. The microstrain values also exhibited an increasing trend, from 7.39
The observed reduction in crystallite size, increase in dislocation density, and rise in microstrain strongly indicate that Mg incorporation leads to higher structural disorder and defect density. These effects can be attributed to oxygen vacancies and strain-induced lattice deformations, which are further supported by the broadening of XRD peaks.
Field Emission Scanning Electron Microscopy (FESEM) was performed to analyse the grain morphology and porosity of PrMgxFe1-xO3 (x = 0.1, 0.2 & 0.3), as shown in Figure 4. The micrographs at 100kX magnification exhibit a polycrystalline structure characterized by distinct round grains, whilst the 50kX pictures elucidate differences in porosity. The grain size, analysed with ImageJ software, decreases from 143 nm (x = 0.1) to 134 nm (x = 0.2) and thereafter declines to 117 nm (x = 0.3), following the XRD crystallite size trend. A significant rise in porosity is noted with Mg doping; x = 0.1 displays a dense structure, while x = 0.2 and x = 0.3 reveal more pronounced voids and grain boundary separation. Energy Dispersive X-ray Spectroscopy (EDX) of PrMgxFe1-xO3 (x = 0.3), shown in Figure 5, verifies the existence of Pr, Fe, O, and Mg, with atomic ratios consistent with the anticipated stoichiometry. Elemental mapping reveals a consistent distribution of Mg and Fe, signifying homogenous doping within the perovskite structure.
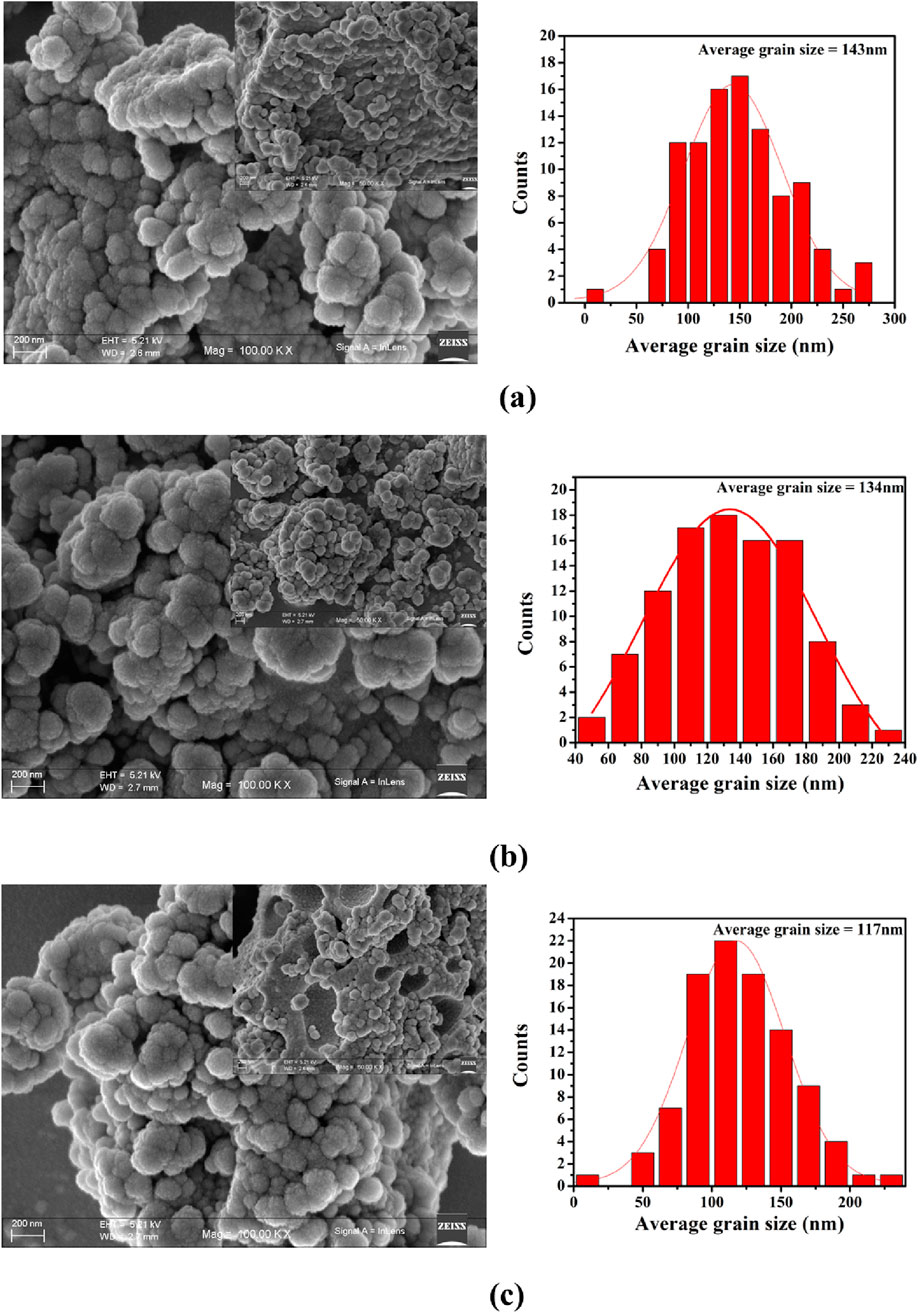
Figure 4. Field Emission Scanning Electron Microscopy (FESEM) images of PrMgxFe1-xO3 samples with (a) x = 0.1, (b) x = 0.2, and (c) x = 0.3, showing variations in average grain size with increasing Mg content.
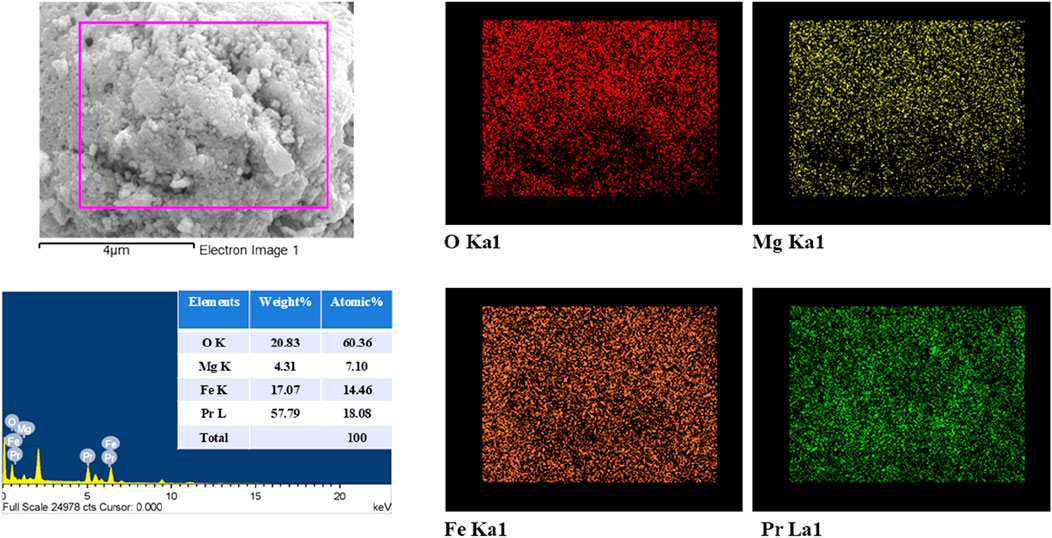
Figure 5. Energy Dispersive X-ray (EDX) spectrum of PrMgxFe1-xO3 (x = 0.3).
The textural characteristics of PrMgxFe1-xO3 (x = 0.3) validate its mesoporous nature, as demonstrated by a Type IV nitrogen adsorption-desorption isotherm exhibiting a hysteresis loop illustrated in Figure 6. The material exhibits a Brunauer–Emmett–Teller (BET) surface area of around 6.24 m2 g-1, calculated using the multi-point BET method. The total pore volume is approximately 0.030 cm3 g-1, Additionally, the Barrett–Joyner–Halenda (BJH) analysis reveals a pore surface area of ∼ 5.61 m2/g and a narrow pore size distribution centered ∼ 3.83 nm, indicating homogeneous and well-developed mesoporosity and promoting effective gas diffusion and adsorption-desorption processes. The interlinked pore network and augmented surface area improve the accessibility of adsorption sites, increasing the material’s structural efficacy.
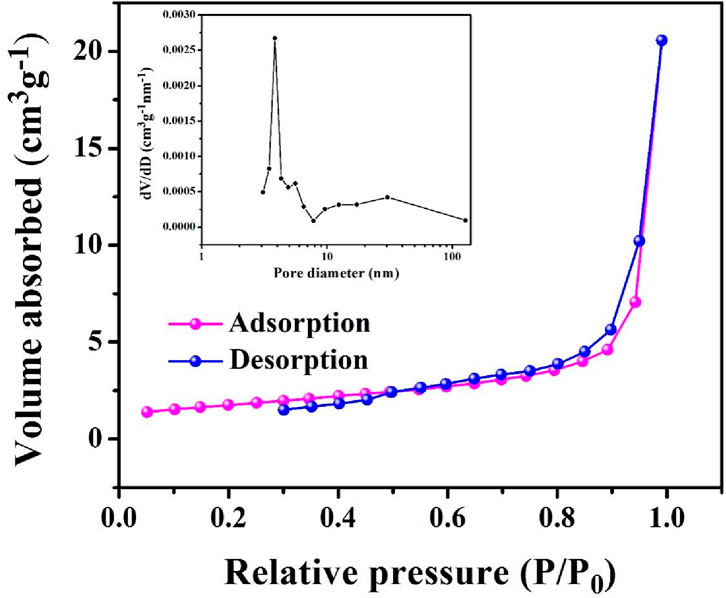
Figure 6. Nitrogen Adsorption- Desorption Isotherms and BJH Pore Size Distribution curve for PrMgxFe1-xO3 (x = 0.3).
X-ray Photoelectron Spectroscopy (XPS) was utilized to examine the oxidation states and defect structure of PrMgxFe1-xO3 (x = 0.1, 0.2 & 0.3), concentrating on the development of oxygen vacancies and Fe valence states. The survey spectrum depicted in Figure 7 validated the existence of Pr, Mg, Fe, and O, with no extraneous elements identified, hence confirming the phase purity of the synthesized materials. The O 1 s spectra were deconvoluted into three separate components: lattice oxygen (OL, ∼529 eV), oxygen vacancies (OV, ∼531–532 eV), and surface-adsorbed oxygen species (OA, ∼532–533 eV), as seen in Figure 8. The quantitative analysis of these peaks offer information into the defect chemistry of the system summarised in Table 1. As the Mg concentration increased, the OL peak area diminished from 31.70% (x = 0.1) to 25.86% (x = 0.2) and subsequently to 22.71% (x = 0.3), signifying a gradual reduction of lattice oxygen. Concurrently, the OV peak area increased from 37.39% (x = 0.1) to 53.43% (x = 0.2) and 60.73% (x = 0.3), thus corroborating the augmented production of oxygen vacancies. The OA peak area associated with chemisorbed oxygen species, demonstrated reduction with Mg doping from 30.91% (x = 0.1), 20.71% (x = 0.2) to 16.56% (x = 0.3), indicating that vacancy generation prevails over surface adsorption. The Fe 2p spectra corroborate these findings illustrated in Figure 9, indicating shifts in the peak locations of Fe3+ and Fe2+, as well as deviations in the Fe3+/Fe2+ ratio are detailed in Table 2. The Fe3+ 2p3/2 peak changed from 711.90 eV (x = 0.1) to 711.73 eV (x = 0.2) and 711.26 eV (x = 0.3), whereas the Fe2+ 2p3/2 peak shifted from 710.50 eV (x = 0.1) to 710.21 eV (x = 0.2) and 709.72 eV (x = 0.3), signifying an increase in Fe2+ content owing to charge compensation. The Fe3+/Fe2+ area ratio for Fe 2p3/2 diminished from 2.80 (x = 0.1) to 1.57 (x = 0.2) and 1.05 (x = 0.3), corroborating the reduction of Fe3+ to Fe2+ linked to the creation of oxygen vacancies. The Fe3+-S satellite peaks exhibited a comparable pattern, with Fe3+-S (2p3/2) decreasing from 719.92 eV (x = 0.1) to 719.31 eV (x = 0.2) and 717.39 eV (x = 0.3), indicating alterations in the electronic structure resulting from defect generation. The Fe3+-S (2p1/2) peak was seen at x = 0.1 and x = 0.2, but it was absent in the x = 0.3 spectrum, indicating a substantial change in the electronic environment at elevated Mg concentrations. The observed shifts in Fe 2p binding energies and Fe3+/Fe2+ ratios are consistent with the increasing concentration of oxygen vacancies (as derived from the O 1 s spectra), confirming the charge compensation mechanism. The findings are further substantiated by XRD and FESEM investigations, indicating that increased Mg doping resulted in lattice distortions and alterations in grain size. The gradual rise in oxygen vacancies and Fe2+ concentration due to Mg substitution signifies substantial changes in the electronic structure, affecting charge transport characteristics across the compositions. The conversion of Fe3+ to Fe2+ and the increased concentration of oxygen vacancies strongly indicate n-type conduction characteristics in the produced materials.
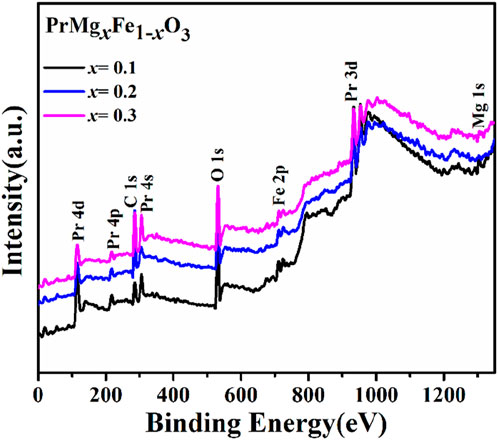
Figure 7. XPS survey spectra of PrMgxFe1-xO3 (x = 0.1,0.2 & 0.3).
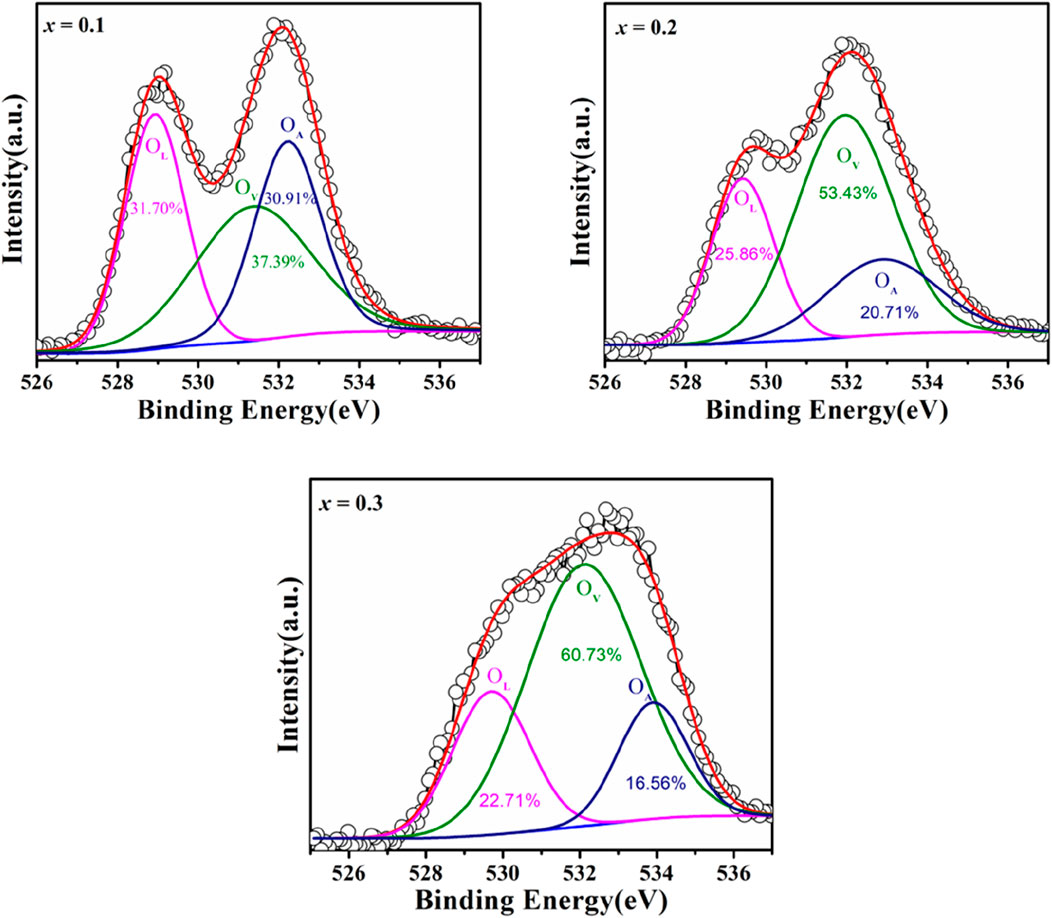
Figure 8. XPS spectra of O 1 s for PrMgxFe1-xO3 (x = 0.1, 0.2 & 0.3).
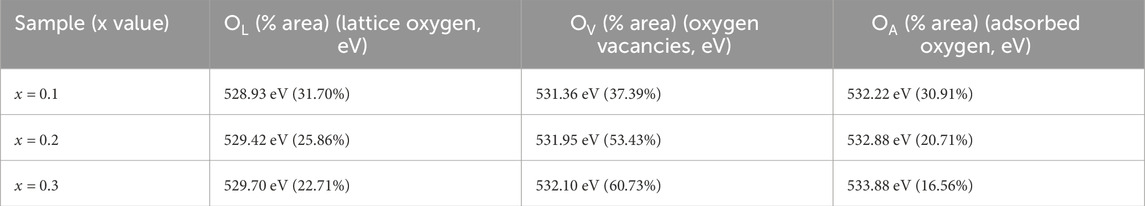
Table 1. Peak position and area percentage evaluation of deconvoluted XPS spectra of O 1 s of PrMgxFe1-xO3 (x = 0.1, 0.2 & 0.3).
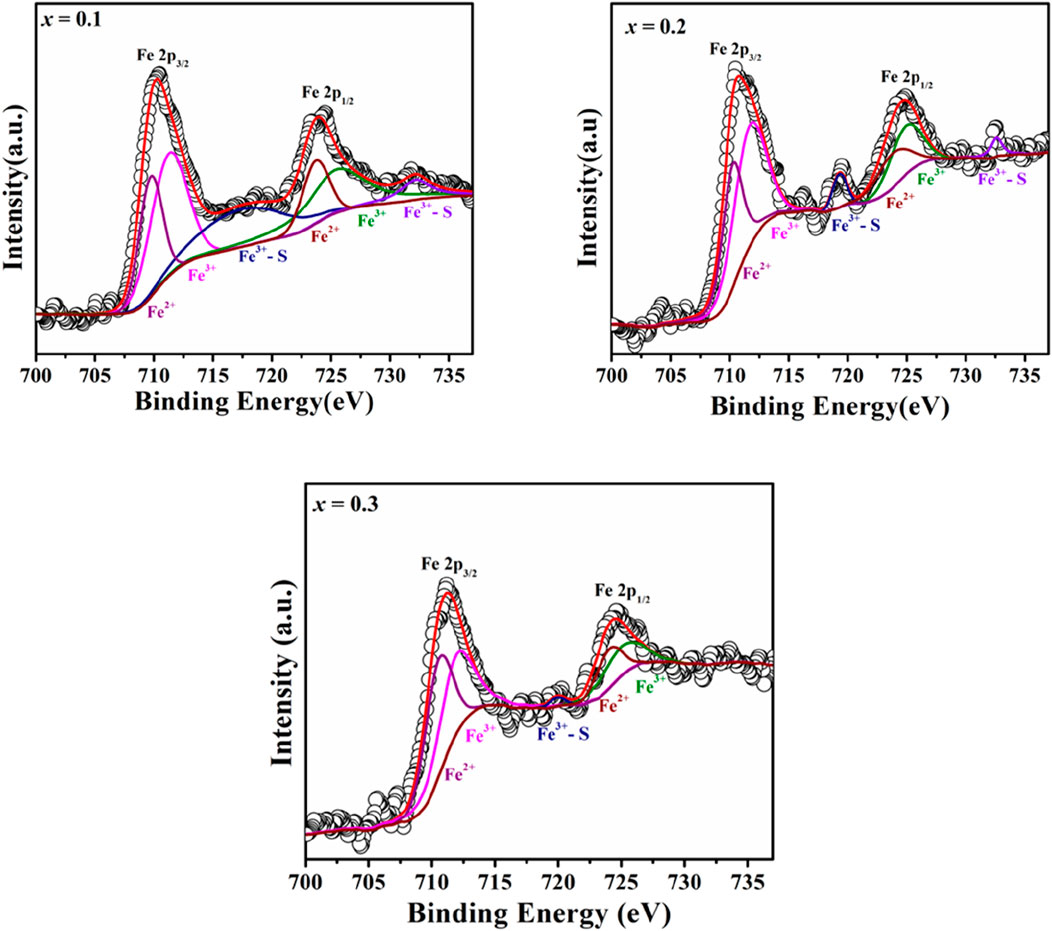
Figure 9. XPS spectra of Fe 2p for PrMgxFe1-xO3 (x= 0.1, 0.2 & 0.3).
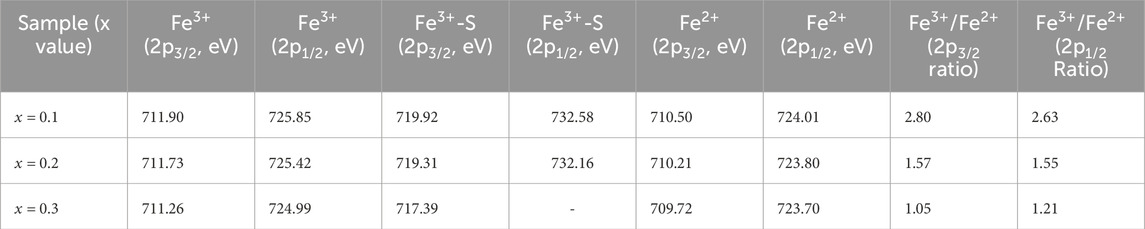
Table 2. Peak position and Fe3+/Fe2+ ratio of deconvoluted XPS spectra Fe 2p of PrMgxFe1-xO3 (x = 0.1,0.2 & 0.3).
3.2 The gas sensing analysis
The gas sensing properties of PrMgxFe1-xO3 (x = 0.1, 0.2 & 0.3) perovskite materials were thoroughly examined to assess their potential for acetone detection. Response and recovery times, repeatability, long-term stability, operating temperature optimization, and selectivity against interfering gases were among the many factors that were examined. The sensing response of all three compositions was evaluated across a temperature range from 60 °C to 210 °C at an acetone concentration of 50 ppm, as seen in Figure 10a. The response was initially observed to increase with temperature, peaking at 150 °C, after which a decrease in sensitivity was recorded. The observed trend can be explained by the interplay between the kinetics of adsorption and desorption processes. At low temperatures, the restricted thermal energy impedes gas molecule interaction with the sensor surface, resulting in lowered responses. As the temperature rises to 150 °C, adequate energy is supplied to promote gas adsorption and interaction with surface oxygen species, thereby improving the sensing response. Increasing the temperature beyond 150 °C leads to significant thermal desorption of acetone molecules, which reduces the number of surface reactions and ultimately lowers the response. From the three compositions analysed, the sample with x = 0.3 demonstrated the most significant response at 150 °C. Following the determination of 150 °C as the ideal operating temperature, the gas sensing response of samples with x values of 0.1, 0.2, and 0.3 was methodically assessed across various acetone concentrations ranging from 5 to 500 ppm, as seen in Figure 10b. The observed response values exhibited a rising trend in relation to acetone concentration, thereby validating a conventional adsorption-controlled sensing mechanism. The sample x = 0.3 exhibited a response increase from 1.118 at 5 ppm to 1.394 at 500 ppm, indicating an improvement in sensitivity. In comparison, the compositions at x = 0.1 and x = 0.2 demonstrated reduced responses across all concentrations, highlighting that the x = 0.3 composition shows the highest efficiency in charge transfer and surface reactivity. The enhanced performance observed at x = 0.3 can be attributed to the increased density of oxygen vacancies, which act as active sites for acetone adsorption, thereby promoting swift electron transfer. The dynamics of response and recovery for the x = 0.3 composition were analysed at 150 °C to 50 ppm acetone as seen in Figure 10c, showcasing its enhanced sensing performance. The observed response time was found to be 33 s, while the recovery time was 20 s. The rapid response and recovery observed indicate the effective kinetics of adsorption and desorption of acetone molecules on the sensor surface. In comparison, the samples with x = 0.1 and x = 0.2 demonstrated slower response times of 47 s and 36 s, along with longer recovery times of 41 s and 30 s, respectively. The rapid response and recovery of x = 0.3 highlight its significant surface reactivity and refined defect structure, positioning it as a stable candidate for acetone detection.
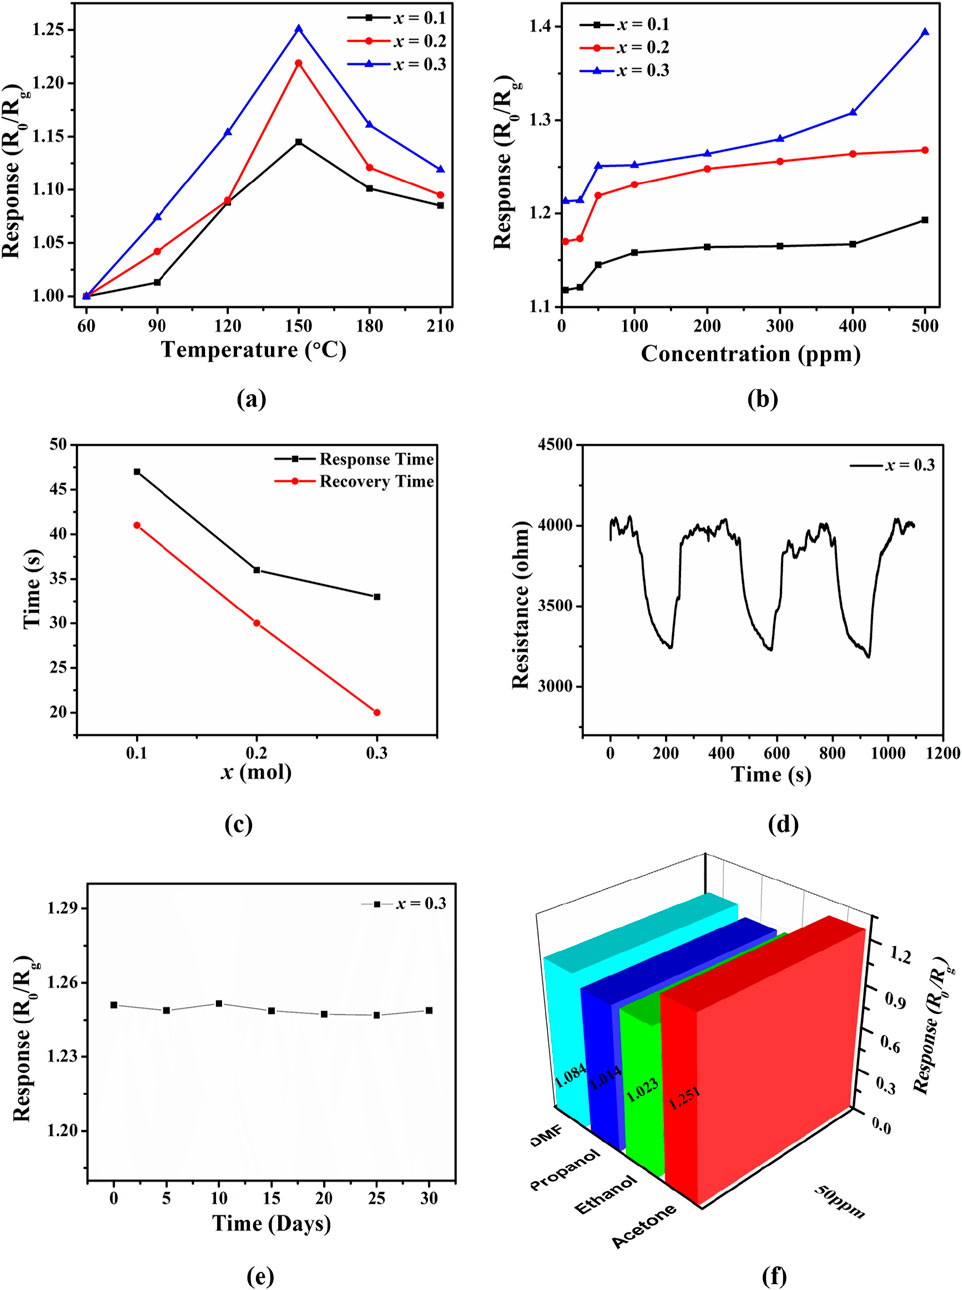
Figure 10. (a) Gas sensing response of PrMgxFe1-xO3 (x = 0.1, 0.2 & 0.3) toward 50 ppm acetone at different testing temperatures ranging from 60 °C to 210 °C, (b) Response of PrMgxFe1-xO3 (x = 0.1, 0.2 & 0.3) to acetone ranging from 5 to 500 ppm at 150 °C, (c) Response and recovery time of PrMgxFe1-xO3 (x = 0.3) to 50 ppm acetone at 150 °C, (d) A 3-cycle response-recovery test of PrMgxFe1-xO3 (x = 0.3) sensor for 50 ppm acetone at 150 °C, (e) Long-term stability of PrMgxFe1-xO3 (x = 0.3) sensor for 50 ppm acetone at 150 °C, (f) The sensing responses of PrMgxFe1-xO3 (x = 0.3) upon exposing to 50 ppm DMF, propanol, ethanol and acetone at 150 °C.
A three-cycle test was conducted on the x = 0.3 composition at 50 ppm acetone to assess the consistency of the sensing performance shown in Figure 10d. The fluctuations in resistance across several cycles demonstrated a reliable response and recovery, highlighting the reproducibility and stability of the sensing properties. Additionally, the extended stability of the x = 0.3 sensor, shown in Figure 10e, was evaluated over a period of 30 days, with data collected at five-day intervals through continuous observation of its response to 50 ppm acetone. The sensor exhibited a consistent response throughout the duration of the study, demonstrating its reliability and endurance for extended use. The x = 0.3 sensor’s response to 50 ppm acetone at 150 °C was evaluated in relation to typical interfering gases such as ethanol, propanol, and dimethylformamide (DMF) as seen in Figure 10f. The findings demonstrated that the reaction to acetone (1.215) was markedly greater than that of ethanol (1.023), propanol (1.014), and DMF (1.084). The improved selectivity for acetone arises from the more robust molecular interactions and greater binding affinity of acetone molecules with the sensor surface, in contrast to other volatile organic compounds.
3.3 Gas sensing mechanism
The gas sensing mechanism of n-type semiconductors, such as Mg-doped PrFeO3, involves an acetone-sensing mechanism that involves a series of adsorption, charge transfer, and chemical reactions. The parent perovskite PrFeO3 is intrinsically a p-type semiconductor due to cation vacancies that serve as electron donors and foster a hole-rich conduction mechanism. However, when Mg2+ is substituted into the parent perovskite to form PrMgxFe1-xO3, it starts behaving differently than it normally would. Doping Mg2+(divalent ion) at the Fe3+(trivalent) site in PrFeO3 creates a charge imbalance. To maintain charge neutrality, the lattice compensates by generating oxygen vacancies (V_O••) as per the defect reaction:
The presence of oxygen vacancies facilitates the release of electrons into the conduction band, resulting in an elevated concentration of free electrons, leading to a transition from p-type to n-type conductivity. The sensing mechanism illustrated in Figure 11 begins with the adsorption of atmospheric oxygen molecules (O2) onto the surface of PrMgxFe1-xO3. The oxygen molecules ionize by capturing electrons from the conduction band, resulting in the formation of chemisorbed oxygen species (O2−, O−, O2-). The operational temperature determines which oxygen species are going to get involved. The following are the conditions involved:
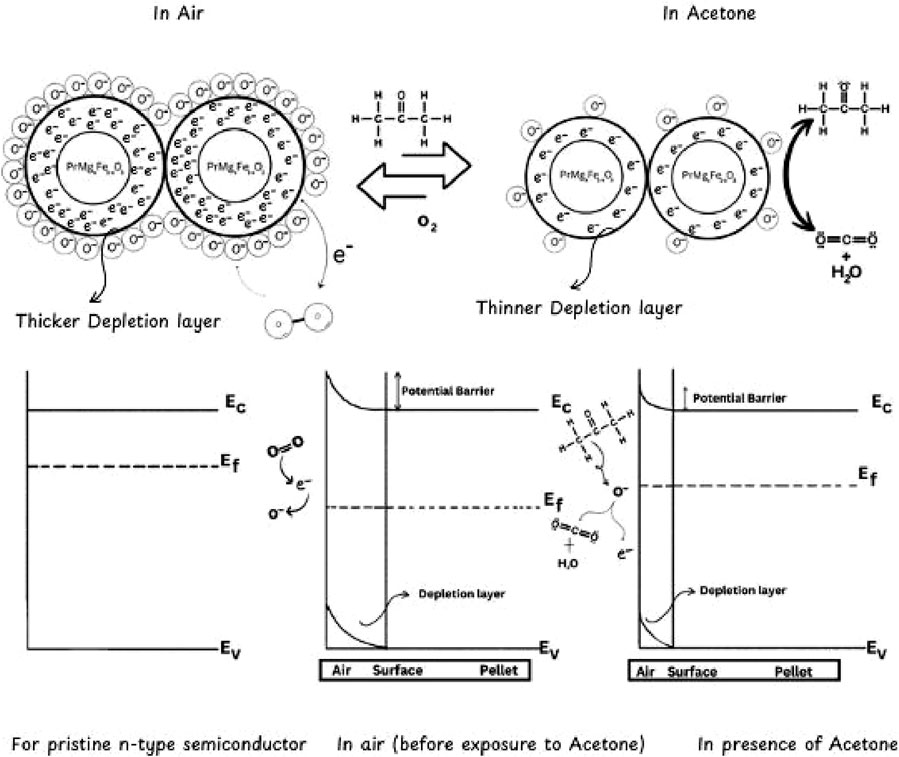
Figure 11. Illustration of the gas-sensing mechanism of PrMgxFe1-xO3 (x = 0.1, 0.2 & 0.3).
These chemisorbed species induce a surface depletion layer through electron removal, leading to an increase in resistance in the n-type semiconductor (Bartel et al., 2019).
Upon interaction with the sensor surface, acetone (CH3COCH3) molecules engage in adsorption and subsequently participate in oxidation reactions with the chemisorbed oxygen species. The process of oxidation facilitates the liberation of trapped electrons into the conduction band. The responses may be articulated in the following manner:
The aforementioned reactions lead to a reduction in the depletion layer, consequently resulting in a decreased resistance of the sensor. The alteration in the sensor’s resistance is directly related to the concentration of the target gas. Afterwards, the elimination of acetone, atmospheric oxygen re-adsorbs onto the surface, facilitating the extraction of electrons and reinstating the depletion layer, thereby reverting the resistance to its original condition, a comparison mentioned in Table 3. The reversible modulation of resistance facilitates the effective detection of reducing gases, a behavior that is emblematic of n-type semiconducting materials.
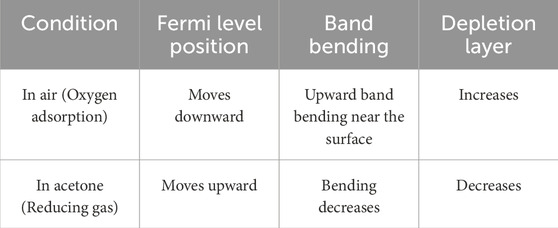
Table 3. Comparison of different variables of the Fermi-level diagram of PrMgxFe1-xO3 in air and acetone.
4 Conclusion
This study demonstrates that substituting Mg2+ into PrFeO3 significantly alters its structural, electronic and gas sensing properties. The substitution leads to a transition from p-type to n-type conductivity, primarily due to the formation of oxygen vacancies and the redox shift between Fe3+ and Fe2+ ions. Among the synthesized compositions PrMgxFe1-xO3 (x = 0.3), exhibited the highest acetone sensing performance. It operated optimally at 150 °C, showing a fast response time of 33 s and a recovery time of 20 s. The sensor also demonstrated excellent repeatability at 50 ppm acetone and moderate selectivity over interfering gases such as ethanol, propanol, and DMF. Notably, both Fe and Mg were successfully extracted from waste-derived sources, namely, industrial red mud and Mg alloy scrap. Environmentally benign acid-leaching methods were used for this green synthesis route. These results show that high-performance perovskite oxides can be developed using secondary raw materials without compromising structural integrity or sensor efficiency. The findings support the potential of circular material strategies for next-generation gas sensor technologies. Future work will focus on nano-architecturing and integrating these materials into flexible platforms for wearable or on-site environmental sensing applications.
Data availability statement
The raw data supporting the conclusions of this article will be made available by the authors, without undue reservation.
Author contributions
SM: Writing – original draft. AN: Data curation, Writing – review and editing. JM: Writing – original draft. NT: Conceptualization, Writing – review and editing. SS: Data curation, Writing – review and editing. IS: Formal Analysis, Funding acquisition, Writing – review and editing. HD: Data curation, Writing – review and editing. JS: Investigation, Supervision, Writing – review and editing. AM: Investigation, Resources, Writing – review and editing. NP: Investigation, Writing – review and editing. DV: Conceptualization, Writing – review and editing. LS: Writing – review and editing. AS: Writing – review and editing, Funding acquisition.
Funding
The author(s) declare that no financial support was received for the research and/or publication of this article.
Acknowledgments
The authors sincerely acknowledge the financial support from the DST-INSPIRE Fellowship, Department of Science and Technology (DST), Government of India (Grant No. DST/INSPIRE/03/2023/000140). The authors also gratefully acknowledge the Himachal Pradesh Council for Science, Technology & Environment (HIMCOSTE) for granting the project HIMCOSTE(R&D/2023-24–6(4)) to our co-author, IS.
Conflict of interest
The authors declare that the research was conducted in the absence of any commercial or financial relationships that could be construed as a potential conflict of interest.
Generative AI statement
The author(s) declare that no Generative AI was used in the creation of this manuscript.
Any alternative text (alt text) provided alongside figures in this article has been generated by Frontiers with the support of artificial intelligence and reasonable efforts have been made to ensure accuracy, including review by the authors wherever possible. If you identify any issues, please contact us.
Publisher’s note
All claims expressed in this article are solely those of the authors and do not necessarily represent those of their affiliated organizations, or those of the publisher, the editors and the reviewers. Any product that may be evaluated in this article, or claim that may be made by its manufacturer, is not guaranteed or endorsed by the publisher.
References
Agrawal, A., Sahu, K. K., and Pandey, B. D. (2004). Solid waste management in non-ferrous industries in India. Resour. Conservation & Recycl. 42 (2), 99–120. doi:10.1016/j.resconrec.2003.10.004
Arya, N., Bajwa, B. S., Inoue, K., Joshi, A., Sahoo, S. K., Natarajan, T., et al. (2025). Assessment of uranium contamination in groundwater of mansa district, Punjab (India) and its remediation using SnO2. Appl. Radiat. Isotopes 225, 112018. doi:10.1016/j.apradiso.2025.112018
Bartel, C. J., Sutton, C., Goldsmith, B. R., Ouyang, R., Musgrave, C. B., Ghiringhelli, L. M., et al. (2019). New tolerance factor to predict the stability of perovskite oxides and halides. Sci. Adv. 5, eaav0693. doi:10.1126/sciadv.aav0693
Benyoussef, S., Jabar, A., Idrissi, S., Tahiri, N., and Bahmad, L. (2024). The structural, electronic, optical, thermoelectric, and magnetic properties of the perovskite PrFeO3: DFT and monte carlo simulations. J. Mol. Model. 30 (10), 325. doi:10.1007/s00894-024-06122-9
Bertocci, F., Fort, A., Vignoli, V., Mugnaini, M., and Berni, R. (2017). Optimization of perovskite gas sensor performance: characterization, measurement, and experimental design. Sensors Switz. 17 (6), 1352. doi:10.3390/s17061352
Bui, T. H., and Shin, J. H. (2023). “Perovskite materials for sensing applications: recent advances and challenges,”, 191. Elsevier Inc. doi:10.1016/j.microc.2023.108924Microchem. J.108924
Cui, Y., Chen, J., Zhang, Y., Peng, D., Huang, T., and Sun, C. (2019). pH-Dependent leaching characteristics of major and toxic elements from red mud. Int. J. Environ. Res. Public Health 16 (11), 2046. doi:10.3390/ijerph16112046
Ecija, A., Vidal, K., Larrañaga, A., Ortega-San-Martín, L., Isabel Arriortua, M., and Químicas, S. (2025). Synthetic methods for perovskite materials-structure and morphology. Available online at: www.intechopen.com.
Fan, H., Zhang, T., Xu, X., and Lv, N. (2011). Fabrication of N-type Fe2O3 and P-type LaFeO3 nanobelts by electrospinning and determination of gas-sensing properties. Sensors Actuators, B Chem. 153 (1), 83–88. doi:10.1016/j.snb.2010.10.014
Fergus, J. W. (2007). Perovskite oxides for semiconductor-based gas sensors. Sensors Actuators, B Chem. 123 (2), 1169–1179. doi:10.1016/j.snb.2006.10.051
Ge, X., Liu, Y., and Liu, X. (2001). Preparation and gas-sensitive properties of LaFe1−yCoyO3 semiconducting materials. Sensors Actuators B Chem. 79, 171–174. doi:10.1016/S0925-4005(01)00869-3
Harikrishnan, R., Mani, G., Baskaran, I., and Kumar, M. (2022). Influence of PrFeO3 compositions on the magnetic properties of PrFeO3/PrO2 nanocomposites: structural, optical, and magnetic studies. J. Mater. Sci. Mater. Electron. 33 (23), 18565–18586. doi:10.1007/s10854-022-08708-6
He, J., Xu, X., Li, M., Zhou, S., and Zhou, W. (2023). “Recent advances in perovskite oxides for non-enzymatic electrochemical sensors: a review. 1251. Elsevier B.V. Anal. Chim. Acta. doi:10.1016/j.aca.2023.341007
Jia, F. F., Zhong, H., Zhang, W. G., Li, X. R., Wang, G. Y., Song, J., et al. (2015). A novel nonenzymatic ECL glucose sensor based on perovskite LaTiO3-Ag0.1 nanomaterials. Sensors Actuators, B Chem. 212, 174–182. doi:10.1016/j.snb.2015.02.011
Jiao, F., Li, W., Xue, K., Yang, C., and Qin, W. (2019). Recovery of chromium and magnesium from spent magnesia-chrome refractories by acid leaching combined with alkali precipitation and evaporation. Sep. Purif. Technol. 227, 115705. doi:10.1016/j.seppur.2019.115705
Leidinger, M., Sauerwald, T., Conrad, T., Reimringer, W., Ventura, G., and Schütze, A. (2014). Selective detection of hazardous indoor VOCs using metal oxide gas sensors. Procedia Eng. 87, 1449–1452. doi:10.1016/j.proeng.2014.11.722
Li, L., Qin, H., Zhang, L., and Hu, J. (2016). Ultrasensitive sensing performances to sub-ppb level acetone for Pd-functionalized SmFeO3 packed powder sensors. RSC Adv. 6 (65), 60967–60974. doi:10.1039/c6ra05761f
Litzelman, S. J., Rothschild, A., and Tuller, H. L. (2005). The electrical properties and stability of SrTi0.65Fe0.35O3-δ thin films for automotive oxygen sensor applications. Sensors Actuators, B Chem. 108 (1-2 SPEC. ISS.), 231–237. doi:10.1016/j.snb.2004.10.040
Liu, X., Hu, J., Cheng, B., Qin, H., and Jiang, M. (2008). Acetone gas sensing properties of SmFe1-xMgxO3 perovskite oxides. Sensors Actuators, B Chem. 134 (2), 483–487. doi:10.1016/j.snb.2008.05.024
Ma, L., Ma, S. Y., Shen, X. F., Wang, T. T., Jiang, X. H., Chen, Q., et al. (2018a). PrFeO3 hollow nanofibers as a highly efficient gas sensor for acetone detection. Sensors Actuators, B Chem. 255, 2546–2554. doi:10.1016/j.snb.2017.09.060
Mirzaei, A., Leonardi, S. G., and Neri, G. (2016). “Detection of hazardous volatile organic compounds (VOCs) by metal oxide nanostructures-based gas sensors: a review. Ceram. Int. 42. Elsevier Ltd, 15119–15141. doi:10.1016/j.ceramint.2016.06.145
Moseley, P. T. (1992). Materials selection for semiconductor gas sensors. Sensors Actuators B 6, 149–156. doi:10.1016/0925-4005(92)80047-2
Nakhaei, M., and Sanavi Khoshnoud, D. (2021). Study on structural, magnetic, and electrical properties of ReFeO3 (Re= La, Pr, Nd, Sm & Gd) orthoferrites. Phys. B Condens. Matter 612, 412899. doi:10.1016/j.physb.2021.412899
Pei, S., Ma, S., Xu, X., Xu, X., and Almamoun, O. (2021). Modulated PrFeO3 by doping Sm3+ for enhanced acetone sensing properties. J. Alloys Compd. 856, 158274. doi:10.1016/j.jallcom.2020.158274
Qin, W., Yuan, Z., Gao, H., Zhang, R., and Meng, F. (2021). Perovskite-structured LaCoO3 modified ZnO gas sensor and investigation on its gas sensing mechanism by first principle. Sensors Actuators, B Chem. 341, 130015. doi:10.1016/j.snb.2021.130015
Rai, S., Wasewar, K. L., Mukhopadhyay, J., Yoo, C. K., and Uslu, H. (2012). Neutralization and utilization of red mud for its better waste management. Arch. Environ. Sci. 6, 13–33.
Royani, A., Sulistiyono, E., Prasetiyo, A. B., and Subagja, R. (2018). Extraction of magnesium from calcined dolomite ore using hydrochloric acid leaching. AIP Conf. Proc. 1964, 020017. doi:10.1063/1.5038299
Saha, S., Chanda, S., Dutta, A., and Sinha, T. P. (2016a). Dielectric relaxation of PrFeO3 nanoparticles. Solid State Sci. 58, 55–63. doi:10.1016/j.solidstatesciences.2016.05.013
Shannon, R. D., and Prewitt, C. T. (1970). Revised values of effective ionic radii. Acta crystallographica section B: structural crystallography and crystal chemistry. 26, 1046–1048. doi:10.1107/S0567740870003576
Shellaiah, M., and Sun, K. W. (2020). Review on sensing applications of perovskite nanomaterials. Multidiscip. Digit. Publ. Inst. (MDPI) 8 (3), 55. doi:10.3390/chemosensors8030055
Singh, S., Sharma, I., Kumar, S., Kumar, S., Singh, A., Kaur, I., et al. (2024). Comparative analysis of adsorptive potential of TiO2 and its MWCNT composite (TiO2-MWCNT) as uranium (VI) scavengers. J. Radioanalytical Nucl. Chem. 333 (6), 3173–3183. doi:10.1007/s10967-023-09332-2
Sultan, K., Ikram, M., and Asokan, K. (2014). Structural, optical, and dielectric study of Mn-doped PrFeO3 ceramics. Vacuum 99, 251–258. doi:10.1016/j.vacuum.2013.06.014
Wang, X., Qin, H., Pei, J., Chen, Y., Li, L., Xie, J., et al. (2016). Sensing performances to low concentration acetone for palladium doped LaFeO3 sensors. J. Rare Earths 34 (7), 704–710. doi:10.1016/S1002-0721(16)60082-0
Keywords: waste-derived materials, gas sensing, perovskite oxides, response time, and recovery time
Citation: Middha S, Nindrayog AS, Mahajan J, Tandon N, Singh S, Sharma I, Dosanjh HS, Singh J, Mahajan A, Prasad N, Varshney D, Singh L and Singh A (2025) Green-synthesized Mg-substituted PrFeO3 perovskites via waste-derived precursors for acetone gas sensing. Front. Mater. 12:1655749. doi: 10.3389/fmats.2025.1655749
Received: 28 June 2025; Accepted: 21 August 2025;
Published: 11 September 2025.
Edited by:
Jagpreet Singh, Rayat Bahra University, IndiaReviewed by:
Mohd Khan, King Saud University, Saudi ArabiaCristina Echevarria Bonet, University of Oviedo, Spain
Copyright © 2025 Middha, Nindrayog, Mahajan, Tandon, Singh, Sharma, Dosanjh, Singh, Mahajan, Prasad, Varshney, Singh and Singh. This is an open-access article distributed under the terms of the Creative Commons Attribution License (CC BY). The use, distribution or reproduction in other forums is permitted, provided the original author(s) and the copyright owner(s) are credited and that the original publication in this journal is cited, in accordance with accepted academic practice. No use, distribution or reproduction is permitted which does not comply with these terms.
*Correspondence: Anupinder Singh, YW51cGluZGVyc0BnbWFpbC5jb20=; Lovepreet Singh, bG92ZXByZWV0LnNAa2lzdC5yZS5rcg==