 Bin Huang1,2
 Bowen Liu1Ge Xiao3
 Xin Jin1*Duyang Liu1Jinguo Liu1Chenxi Liu1Yumeng Ling1
 Dikuan Wang1Chengdong Xia1,4,5
- 1National Engineering Laboratory of Highway Maintenance Technology, Changsha University of Science and Technology, Changsha, China
- 2Hunan Provincial Expressway Group Co., Ltd., Changsha, China
- 3Modern Investment Co., Ltd., Changsha, China
- 4Department of Civil and Environmental Engineering, The Hong Kong Polytechnical University, Hong Kong, Hong Kong SAR, China
- 5Xiangjiang Laboratory, Changsha, China
To enhance the mechanical performance of ultra-thin asphalt overlays subjected to heavy traffic and severe environmental conditions, this study developed a high-performance SMA-8 asphalt mixture incorporating a chemically toughened modified binder specifically designed for ultra-thin applications. The mixture’s strength response to varying loading rates was systematically assessed through direct tensile, indirect tensile, and unconfined compressive tests, facilitating the analysis of rate-dependent behavior and strength evolution under different stress states. The results demonstrated that all strength indices increased with loading rate following power-law trends, with indirect tensile strength showing the highest sensitivity to loading rate and compressive strength exhibiting the greatest absolute magnitude. Cohesion, determined using Mohr–Coulomb analysis, increased significantly with loading rate, while the internal friction angle exhibited a non-monotonic variation, indicating complex interfacial failure mechanisms. A unified strength model was developed by normalizing and converting results across the three loading modes, providing a generalized framework for strength characterization of ultra-thin overlays. These findings offer both theoretical insights and practical guidance for the design, evaluation, and engineering application of chemically modified high-performance ultra-thin asphalt overlays.
1 Introduction
China’s highway network has expanded rapidly in recent decades. By the end of 2024, total highway mileage reached 5.4904 million kilometers, including 190,700 km of expressways—the longest globally. This rapid development highlights not only the extensive use of asphalt pavement but also the mounting demand for maintenance. In 2022, maintenance mileage accounted for 99.9% of the total, signaling a strategic shift from construction-centric development to integrated maintenance and service performance preservation (Ying et al., 2023).
Ultra-thin overlays have been widely adopted as a preventive maintenance solution due to their cost-effectiveness and ease of construction (Guo et al., 2024). These overlays are effective in improving surface friction, sealing minor cracks, and retarding pavement aging. However, their limited thickness (typically 1–2 cm) compromises structural strength and durability (Editorial Department of China Journal of Highway and Transport et al., 2024), especially under heavy axle loads and extreme environmental conditions. Common distresses include early cracking (Vuye et al., 2016) and delamination (Du et al., 2024; Geng et al., 2017) caused by insufficient interlayer bonding. In response, researchers have investigated high-performance binders (e.g., SBS, polyurethane, waterborne epoxy) (Beyene and Youtcheff, 2016; Geng et al., 2017; Shi et al., 2021; Yang et al., 2020; Yu et al., 2021; Zheng et al., 2023), special aggregates (e.g., emery, slag) (Liapis and Likoydis, 2012; Song et al., 2022), optimized gradations, and fiber reinforcement technologies to enhance mixture strength and longevity.
From a structural design perspective, the mechanistic-empirical method—based on elastic layered theory is commonly used in China (Ministry of Transport of the People’s Republic of China, 2017; Huang et al., 2018; You et al, 2018a). However, the mechanical strength of asphalt mixtures, as determined by laboratory tests such as direct tensile (Lopez et al., 2019; Lv et al., 2018a), indirect tensile (Li et al., 2019; Lv et al., 2018b; You et al, 2018b), and unconfined compression (Chávez-Valencia et al., 2007), often varies considerably across loading modes. This variation introduces uncertainty into pavement design, as selecting a representative strength parameter becomes problematic, potentially leading to errors in thickness design and performance prediction [28].
To address this issue, the concept of unified strength models has gained increasing attention. These models aim to normalize strength results from different test modes, reducing the influence of testing variability and enhancing design reliability. While unified strength theories have been extensively applied in concrete and rock mechanics (Danni et al., 2015; Eid and Paultre, 2017; Mingqing, 2013), their application to asphalt mixtures is relatively recent. Our earlier work established a normalized power-law relationship linking direct-tension, indirect-tension, and unconfined-compression strengths for a dense-graded SBS-modified asphalt, enabling reliable strength conversion across loading modes and thereby enhancing performance evaluation (Lv et al., 2018a; Xia et al., 2019). That model, however, was calibrated at moderate loading rates (<60 MPa s-1) and for a conventional binder–gradation system; it therefore cannot represent the rheological response of the chemically toughened, gap-graded SMA-8 mixture used in ultra-thin overlays or the higher loading-rate spectrum generated by high-speed traffic. The present study addresses these limitations by extending the unified-strength framework to this advanced material and a broader range of loading conditions.
However, existing unified strength models are primarily based on standard asphalt mixtures and do not account for the unique structural and mechanical characteristics of ultra-thin overlay materials. In particular, high-performance asphalt mixtures specifically engineered for ultra-thin overlays—which face more demanding stress environments and failure modes—have not yet been adequately addressed within the unified modeling framework. There remains a critical gap in the literature regarding whether the same unified strength principles can be extended to these advanced materials under rate-sensitive loading.
In this context, the present study focuses on a chemically toughened high-performance asphalt mixture designed for ultra-thin overlays. Direct tensile, indirect tensile, and unconfined compression tests were conducted under varying loading rates. A unified strength model was developed by normalizing the strength-to-rate relationships across all three loading modes. The resulting model characterizes the rate sensitivity and mechanical behavior of the material comprehensively, providing consistent, transferable strength parameters for reliable structural design and performance prediction of ultra-thin overlays.
2 Materials and sample fabrication
2.1 Materials and mixture design
To support the growing demands of pavement maintenance engineering, this study focused on the strength characterization of a high-performance asphalt mixture specifically designed for ultra-thin overlays. The mixture adopted a gap-graded SMA-8 gradation and incorporated a chemically toughened modified asphalt binder, developed by Prof. Jianlong Zheng’s team at the School of Transportation Engineering, Changsha University of Science and Technology. Basalt was selected as the aggregate material.
Comprehensive strength tests including direct tension, indirect tension, and unconfined compression—were conducted to capture the material’s mechanical behavior under various stress modes. A unified strength model was established to evaluate the performance consistency across these loading conditions.
Key material properties and mixture proportions are summarized in Tables 1–5, including the physical characteristics of the modified binder (Table 1), bulk densities of the aggregates (Table 2), performance indices of lignin fibers (Table 3), gradation design for the SMA-8 mixture (Table 4), and Marshall test results for determining the optimal asphalt content (Table 5).
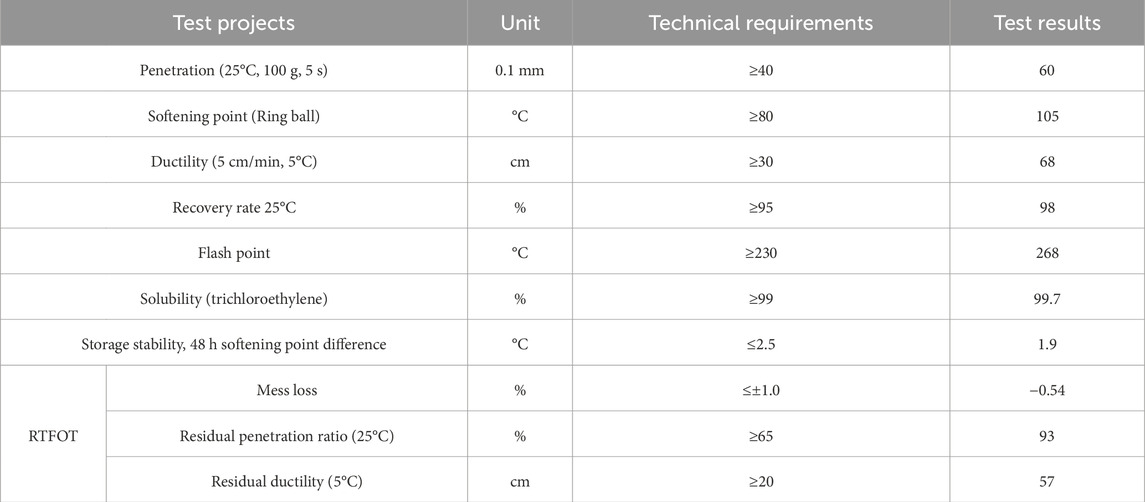
Table 1. Properties of chemically toughened modified asphalt.

Table 2. Bulk density index of aggregate.

Table 3. Fundamental performance indicators of lignin.
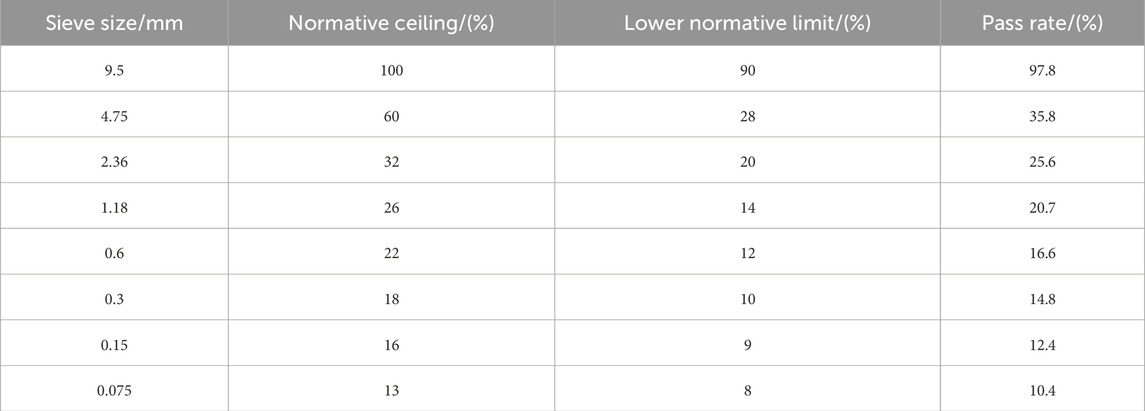
Table 4. Aggregate gradation design for SMA-8 gap-graded asphalt mixture.

Table 5. Marshall test results for optimum asphalt binder content.
To establish the optimum asphalt–aggregate ratio (OAR), a Marshall mix design was performed. Five trial asphalt contents—5.4, 5.7, 6.0, 6.3, and 6.6 wt% of the total mixture—were prepared and tested in triplicate for stability, flow, air voids, voids in mineral aggregate (VMA), and voids filled with asphalt (VFA). Statistical evaluation showed that 6.1 wt% simultaneously satisfied all JTG E20-2011 design requirements while offering the greatest stability reserve. Therefore, 6.1 wt% was selected as the optimum asphalt content for subsequent specimen preparation (Table 5).
2.2 Sample preparation and experimental methods
2.2.1 Preparation of direct tension specimens
SMA-8 mixtures were thoroughly blended and compacted into slab molds (300 mm × 300 mm × 50 mm) using an automatic bidirectional compactor to ensure uniform density. After compaction, the slabs were precision-cut into rectangular beam specimens (250 mm × 50 mm × 50 mm). The ends of each beam were bonded to steel fixtures using a two-part epoxy adhesive (mass ratio 2:1), followed by vertical curing to ensure that tensile failure occurred within the specimen body rather than at the adhesive interface, thereby improving measurement reliability.
2.2.2 Preparation of unconfined compression specimens
Cylindrical specimens were fabricated using a Superpave Gyratory Compactor (SGC) under a vertical pressure of 600 kPa (±18 kPa). The gyration rate was maintained at 30 r/min (±0.5 r/min), with an angle of gyration set to 1.16° (±0.02°). The compacted specimens measured 100 mm in diameter and height (±2 mm), meeting requirements for unconfined compression testing.
2.2.3 Preparation of indirect tension specimens
Specimens for indirect tensile testing were also compacted using the SGC. After compaction, the cylinders were trimmed to a standard height of 60 mm and a diameter of 100 mm (±2 mm), conforming to specifications for indirect tensile strength tests.
2.2.4 Experimental procedure
Standard specifications (AASHTO T167, JTG E20-2011) define displacement-controlled rates (2 mm/min, 50 mm/min) at 20°C or 15°C. However, to investigate the rate-dependent strength behavior of asphalt mixtures under different stress states, a single standardized displacement rate is not appropriate. Therefore, this study employs a stress-controlled loading rate protocol, with the test temperature uniformly set to 15°C. This approach enables consistent evaluation of strength characteristics across varying loading rates. Detailed protocols for each test mode are described in the corresponding subsections.
Tests were carried out on an MTS Landmark loading system. Loading heads were carefully positioned to just contact the specimen surface before initiating loading. The entire testing process was conducted in a temperature-controlled environment. Detailed loading protocols for each strength test mode are illustrated in Figure 1.
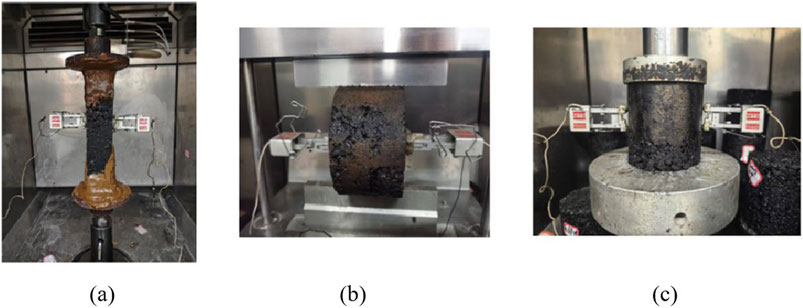
Figure 1. Strength test process under different loading modes. (a) Direct tensile test (b) Indirect tensile test (c) Unconfined compressive test.
Figures 1a–c realistically documents the loading configurations adopted in this work: (a) Direct-tension test—a prismatic asphalt beam (250 × 50 × 50 mm) is adhesively mounted to steel grips and pulled axially under a prescribed loading rate until rupture; (b) Indirect-tension (Brazilian) test—a cylindrical specimen (Φ 100 mm × 60 mm) is compressed across its diameter between flat loading strips at a constant loading rate, producing a uniform transverse tensile stress field; (c) Unconfined uniaxial-compression test—a gyratory-compacted cylinder (Φ 100 mm × 100 mm) is compressed between parallel platens under loading-rate control to peak strength. All tests were performed at 15°C with the loading rate set in the range of 10–110 MPa s-1.
3 Results and discussion
3.1 Direct tension strength testing at varying loading rates
Direct tensile strength tests were conducted at loading rates of 10, 15, 20, 25, 30, 50, 60, 80, 100, and 110 MPa/s. The test results are summarized in Table 6, and the relationship between tensile strength and loading rate is shown in Figure 2.
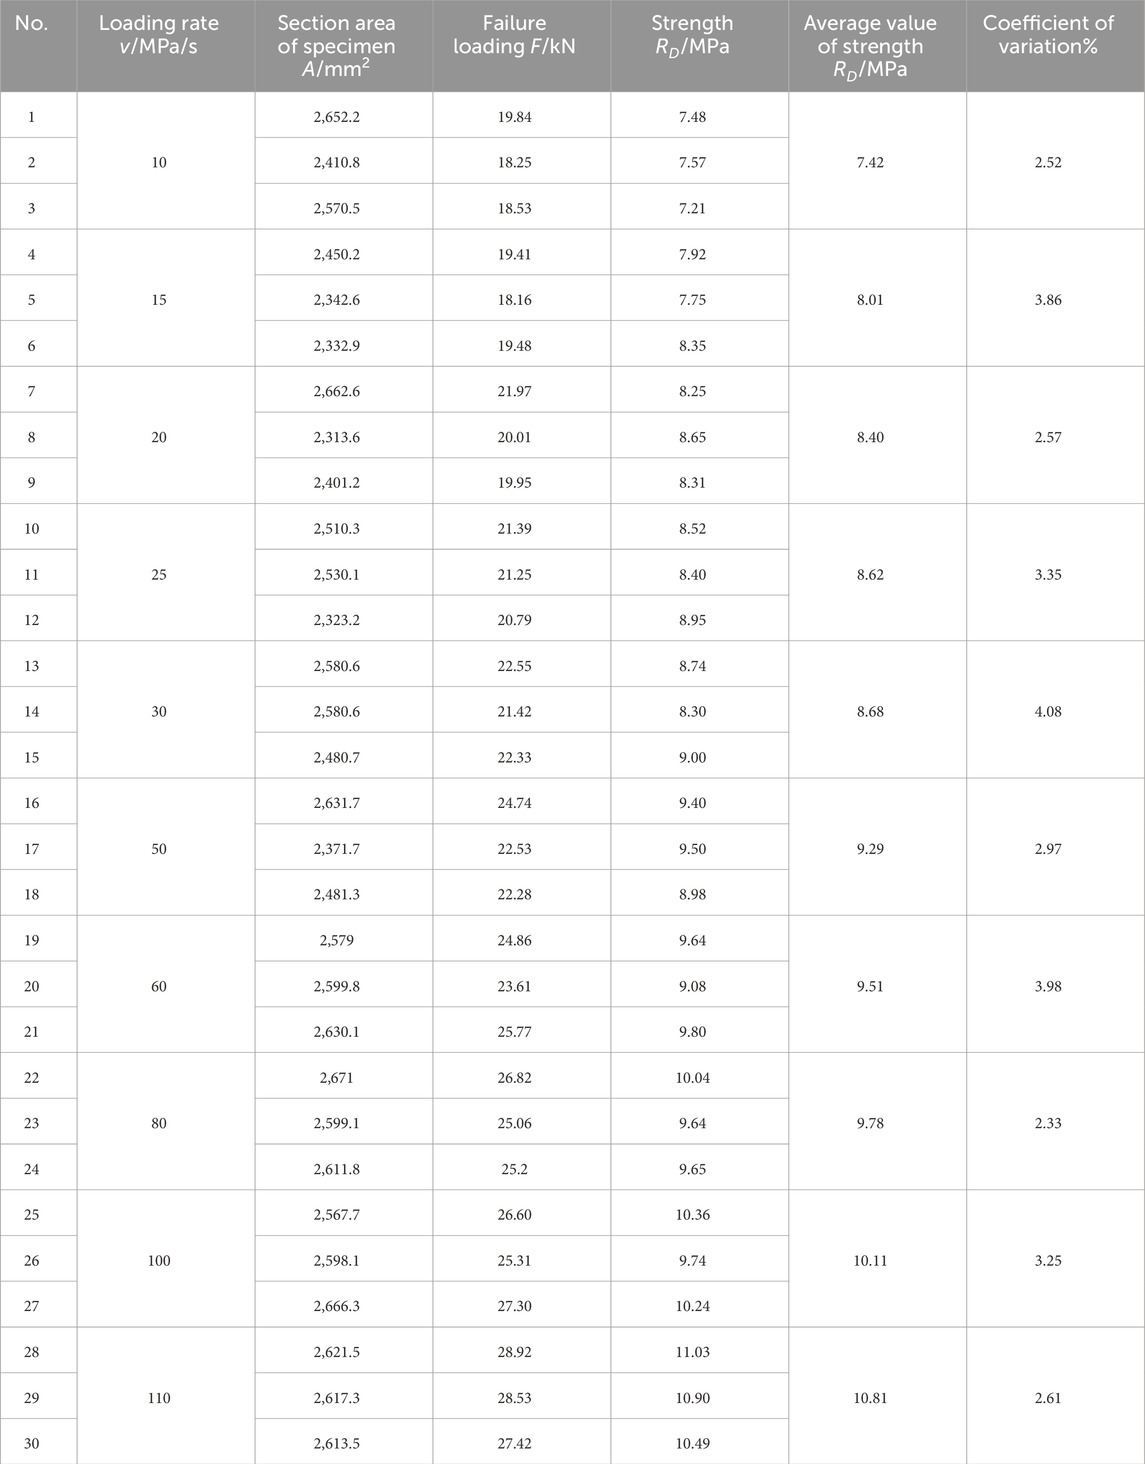
Table 6. Test results of direct tension strength for asphalt mixtures.
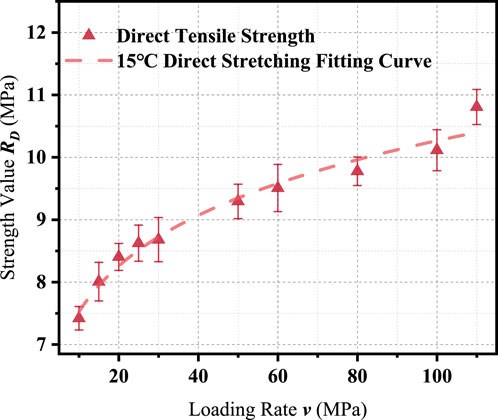
Figure 2. Relationship between loading rate and direct tensile strength of asphalt mixture.
The results indicate a clear trend: the direct tensile strength of the asphalt mixture increases progressively with the loading rate, following a power-law relationship. The fitted regression model for this trend is shown in Equation 1:
where RD is the direct tensile strength (MPa), and v is the loading rate (MPa/s). The coefficient of determination (R2 = 0.97144) confirms the reliability of the fitting.
This rate-dependent strengthening behavior can be attributed to the viscoelastic nature of asphalt mixtures. At higher loading rates, the time available for crack nucleation and propagation is reduced, resulting in a delayed failure process and thus a higher apparent strength. This phenomenon is analogous to the stiffening observed at low temperatures, where increased stiffness inhibits microcrack growth. As the loading rate continues to increase, the strength enhancement gradually plateaus, indicating a saturation effect in the rate sensitivity of the material.
3.2 Uniaxial compression test of asphalt mixture at varying loading rates
The uniaxial compressive strength of the asphalt mixture was evaluated at loading rates of 1, 5, 10, 15, 20 and 25 MPa/s. Due to equipment limitations, direct measurements at higher loading rates were not feasible using the MTS Landmark testing system. Therefore, a delayed loading extrapolation method (Xia et al, 2019) was employed to estimate compressive strength values beyond 25 MPa/s. The extrapolated strengths for higher loading rates (30–110 MPa/s) are also included in the analysis.
The test results are summarized in Table 7, and the corresponding strength-loading rate relationship is illustrated in Figure 3.
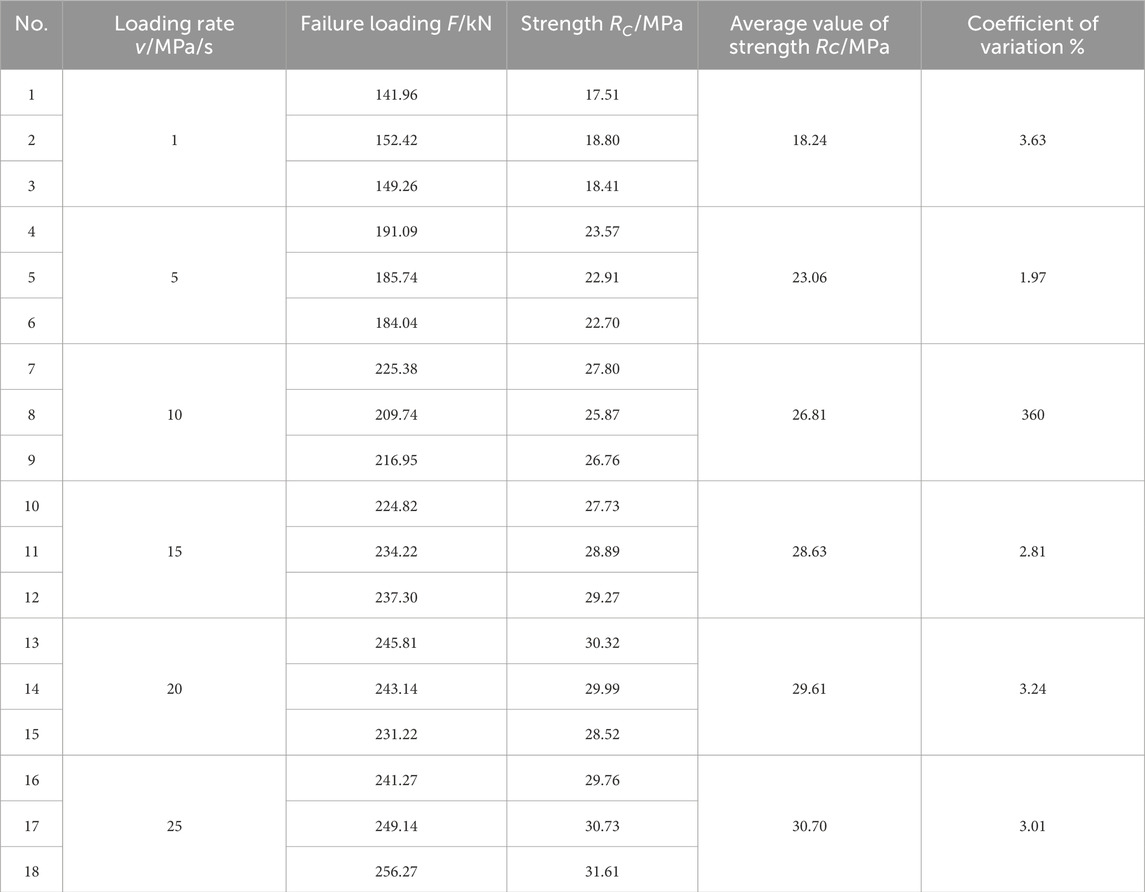
Table 7. Test results of uniaxial compressive strength for asphalt mixtures.
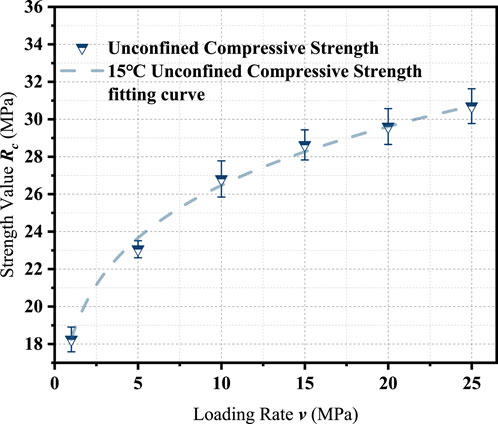
Figure 3. Correlation between loading rate and unconfined compression strength of asphalt mixture.
The fitted power-law model describing the relationship between compressive strength and loading rate is demonstrated by Equation 2:
where RC is the unconfined compressive strength (MPa), and v is the loading rate (MPa/s). The high coefficient of determination (R2 = 0.98825) confirms the accuracy and reliability of the fitted curve.
The fitting results demonstrate that the compressive strength of the asphalt mixture increases significantly with loading rate, following a nonlinear trend. This behavior is attributed to the viscoelastic response of the material under rapid loading, which suppresses microcrack development and enhances aggregate interlock. As the loading rate increases, the deformation time shortens, resulting in stiffer material behavior and greater resistance to compressive failure.
In contrast to the tensile strength discussed in Section 3.1, the compressive strength exhibits both higher absolute values and greater rate sensitivity. This difference arises from the fundamental mechanics of failure: compressive loading activates the full structural capacity of the aggregate skeleton, while tensile loading primarily challenges the adhesive and cohesive properties of the asphalt binder.
The extrapolated compressive strengths under higher loading rates—obtained through the fitted model serve as a critical dataset for strength comparison across stress modes and provide the basis for constructing the unified strength model described in Section 3.5.
3.3 Indirect tension strength testing at varying loading rates
The indirect tensile strength of the asphalt mixture was evaluated at loading rates of 10, 15, 20, 25, 30, 50, 60, 80, 100, and 110 MPa/s, consistent with the rates used in the direct tension tests. Test results are summarized in Table 8, and the corresponding relationship between strength and loading rate is illustrated in Figure 4.
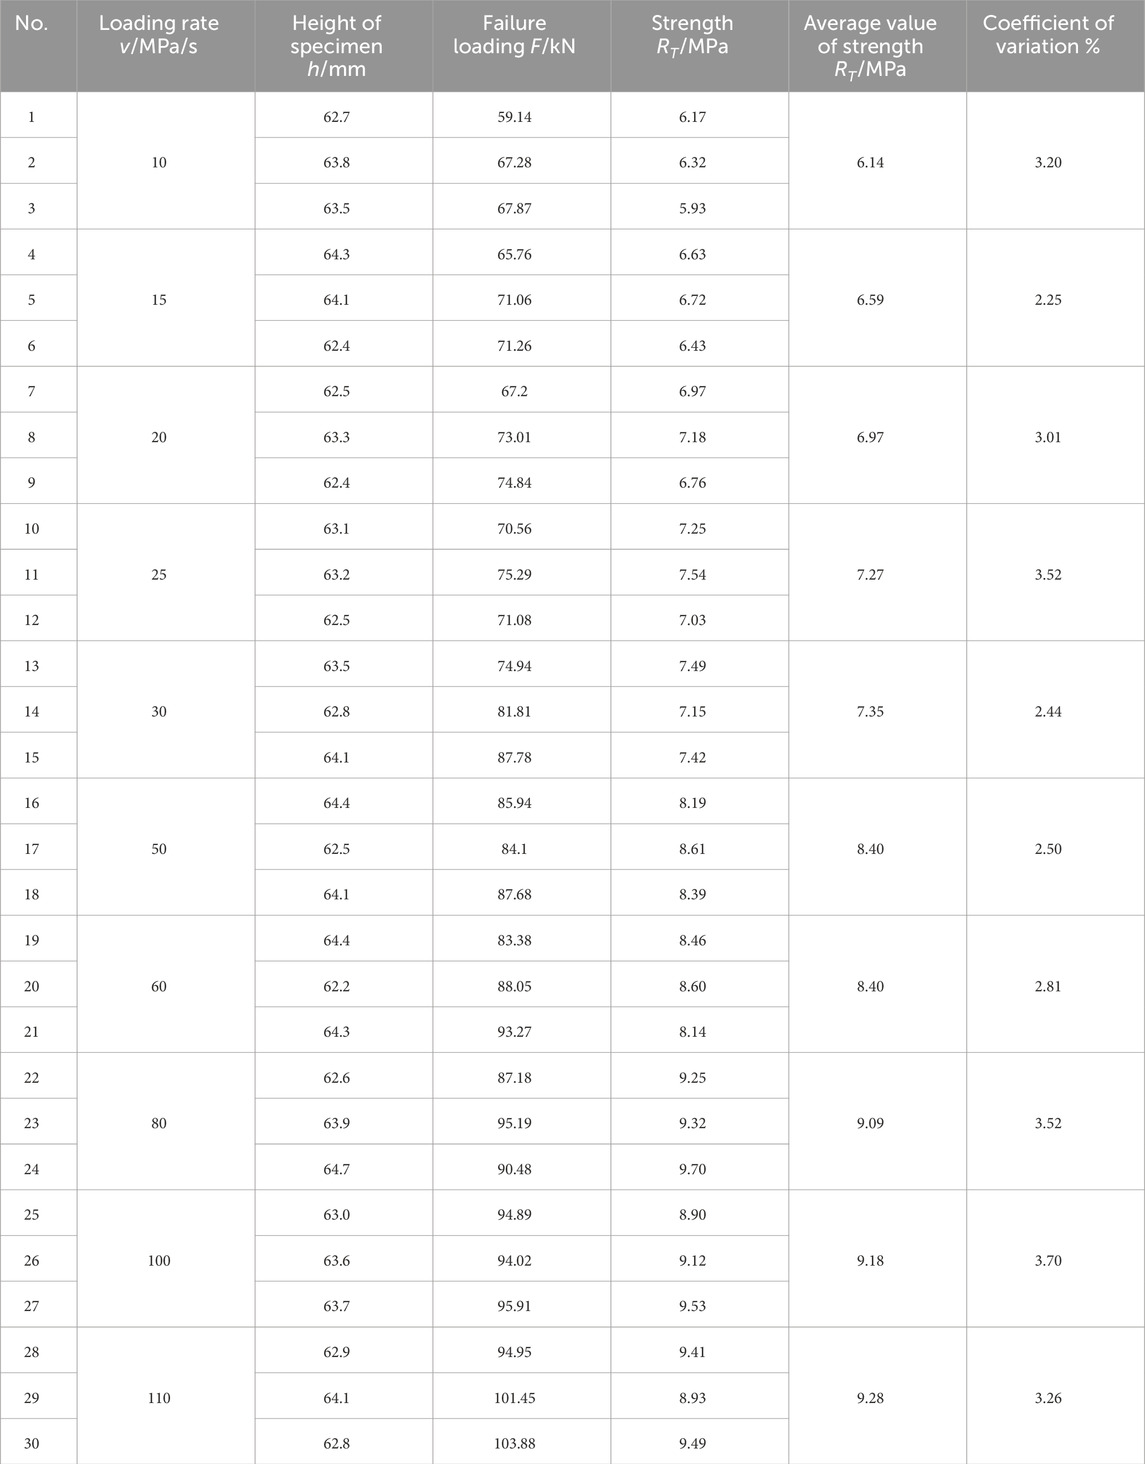
Table 8. Test results of indirect tension strength for asphalt mixtures.
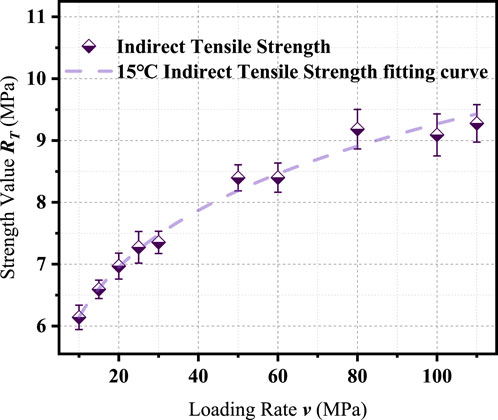
Figure 4. Relationship between loading rate and indirect tensile strength of asphalt mixture.
The variation of indirect tensile strength with loading rate can be described by the power-law function in Equation 3:
where RT is the indirect tensile strength (MPa), and v represents the loading rate (MPa/s). The coefficient of determination for this regression model is 0.98489, indicating strong consistency between experimental data and the fitted trend.
An increase in loading rate leads to a nonlinear increase in indirect tensile strength. This trend is attributed to the viscoelastic characteristics of the asphalt mixture, which become more pronounced under rapid loading conditions. At higher loading rates, the time available for crack nucleation and propagation is reduced, resulting in enhanced apparent strength. The increase in strength tends to slow down as the loading rate approaches higher values, suggesting that the material reaches a threshold of rate sensitivity beyond which further strength gains are limited.
Compared with the other loading modes, the indirect tensile strength shows the highest sensitivity to changes in loading rate, as indicated by the exponent value of 0.17620. The direct tensile strength exhibits the lowest rate sensitivity, with an exponent of 0.14149, while the compressive strength shows intermediate sensitivity with an exponent of 0.16183.
In terms of strength magnitude, unconfined compressive strength remains significantly higher than both tensile modes due to the dominant role of aggregate interlock under compressive loading. However, the rate-dependent behavior under indirect tension reflects a more prominent influence of crack formation and propagation mechanisms, which are particularly sensitive to time-dependent loading conditions.
These results confirm that asphalt mixtures exhibit distinct mechanical responses under different stress states. Both the magnitude of strength and its sensitivity to loading rate vary across testing methods. This variation reinforces the necessity of developing a unified strength evaluation framework capable of bridging different loading conditions, which is addressed in Section 3.5.
3.4 Strength parameter evaluation based on mohr–coulomb theory
Asphalt mixtures are composed primarily of asphalt binder and mineral aggregates. The mechanical behavior of the material is governed by the interaction between these two phases. The binder provides cohesive strength, while contact and interlock among aggregate particles contribute to internal friction. These two parameters—cohesion and internal friction angle—are fundamental components of the shear strength and are typically described using the Mohr Coulomb failure criterion.
Triaxial shear testing is conventionally regarded as the standard method for determining these strength parameters, due to its ability to replicate complex stress states encountered in the field. However, the high cost, operational complexity, and strict requirements for sample preparation and test execution often limit its application in routine engineering evaluations.
To simplify the testing process and improve practical applicability, this study employed an alternative method using direct tension and unconfined compression tests to estimate cohesion and internal friction angle. Based on the assumption that material properties remain consistent across test modes and that principal stresses can be represented by the measured strengths, the Mohr Coulomb envelope can be constructed using results from unconfined compression and direct tension.
In direct tension, the stress condition corresponds to σ1 = RD and σ3 = 0, while in unconfined compression, it corresponds to σ1 = 0 and σ3 = −RC. By constructing the Mohr circle under these two stress conditions, cohesion C and internal friction angle φ can be back-calculated using geometric principles. The relationship between the two is defined as shown in Equations 4, 5:
By substituting the strength values from Table 6 (direct tensile strength) and Table 7 (unconfined compressive strength) into the above equations, the corresponding values of cohesion and internal friction angle under various loading rates were calculated. The results are summarized in Table 9, and their variation trends with loading rate are illustrated in Figure 5.
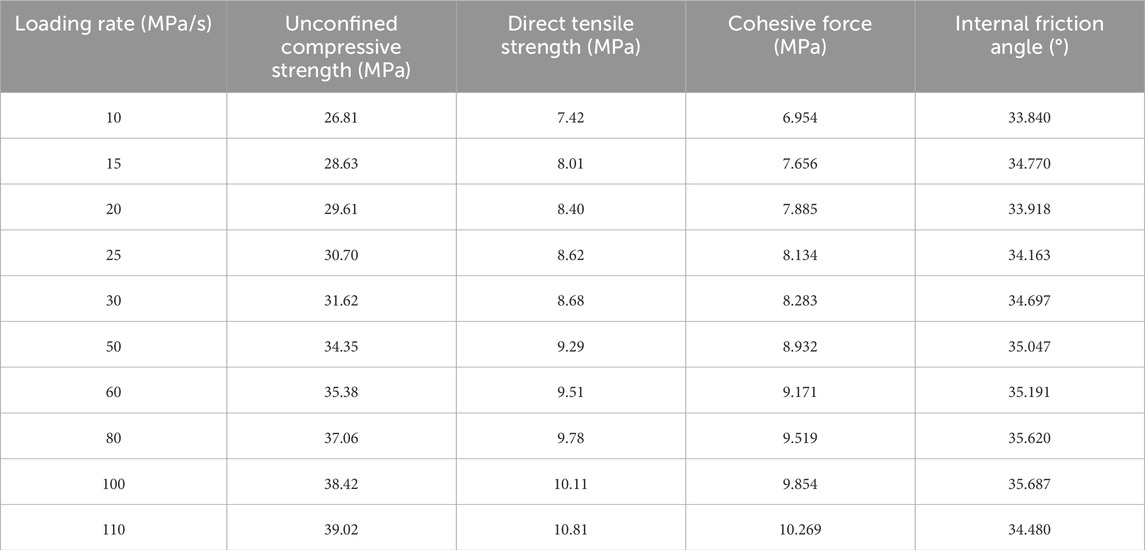
Table 9. Variation of cohesion and internal friction angle with loading rate.
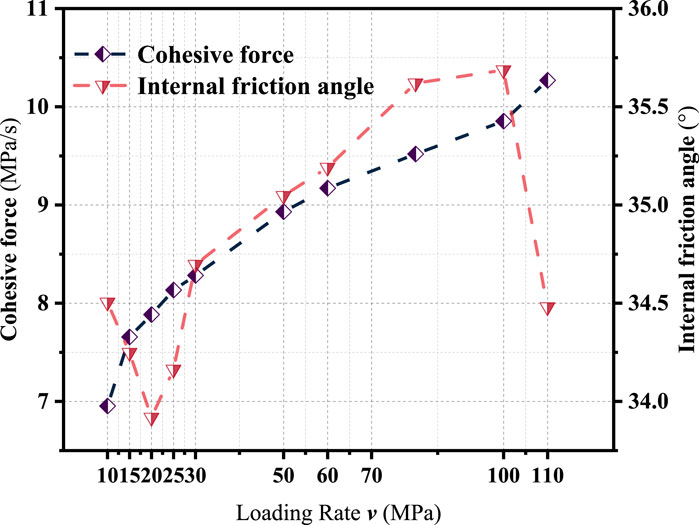
Figure 5. Changes in cohesion and internal friction angle under different loading rates.
As illustrated in Figure 5, the cohesion of the asphalt mixture increases significantly with loading rate, showing a rapid rise followed by a gradual leveling off. This trend indicates enhanced interfacial adhesion between asphalt and aggregates under rapid loading conditions, which can be attributed to reduced molecular mobility and improved stiffness. The calculated cohesion values are influenced simultaneously by compressive and tensile strength, reflecting the combined effect of aggregate structure and binder adhesion.
In contrast, the internal friction angle exhibits a fluctuating trend rather than a clear monotonic change with loading rate. The variation in internal friction angle may result from differences in failure mechanisms, local stress distributions, or microstructural inconsistencies. Unlike cohesion, which is primarily governed by asphalt–aggregate interaction, the internal friction angle is more sensitive to aggregate morphology, compaction quality, and crack propagation paths—all of which may vary across test conditions.
These observations suggest that cohesion is a more stable and reliable indicator of rate-dependent strength enhancement, while the internal friction angle is more prone to experimental fluctuations. Further investigation at the microscale is necessary to clarify the mechanisms driving the evolution of internal friction with loading rate.
3.5 Unification of strength-loading rate relationship across stress states
To establish a consistent strength characterization framework across different loading modes, the average strength values obtained from direct tensile, indirect tensile, and unconfined compression tests were compiled for a loading rate range of 10–110 MPa/s. These results, including extrapolated values for compressive strength using the delayed loading method, are presented in Table 10.
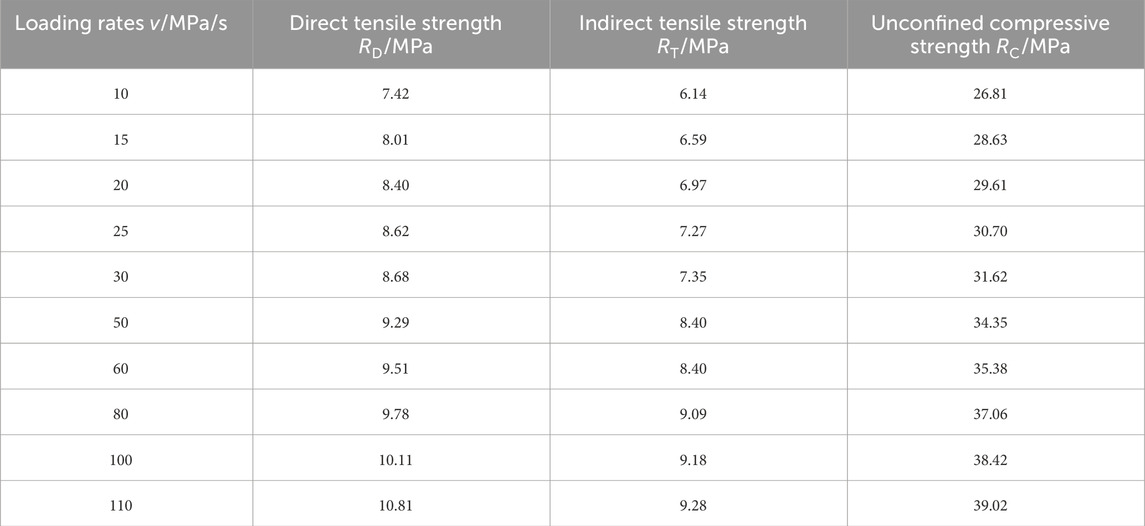
Table 10. Strength data under varying loading rates and stress conditions.
Table 10 clearly shows the progressive increase in strength with loading rate for each stress mode. Among the three, unconfined compressive strength reaches the highest magnitude, while direct and indirect tensile strengths remain comparatively lower but still exhibit notable rate sensitivity.
To further visualize and compare these trends, Figure 6 presents the fitted strength–loading rate relationships for the three loading modes.
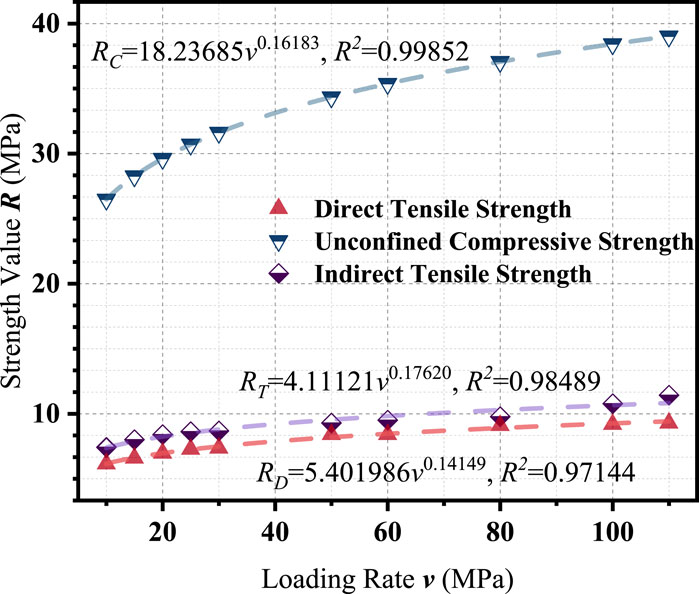
Figure 6. Comparative Analysis of Strength vs Loading Rate across Stress Modes.
As shown in Figure 6, all strength values increase with loading rate and conform to power-law trends. However, their growth patterns differ significantly. The compressive strength exhibits the steepest increase, reflecting enhanced aggregate interlock and greater resistance under compression as loading rate increases. In contrast, direct and indirect tensile strengths demonstrate more moderate increases and follow nearly parallel trajectories, suggesting similar viscoelastic responses under tensile loading.
To quantify these differences, the regression parameters for each stress mode are listed in Table 11.
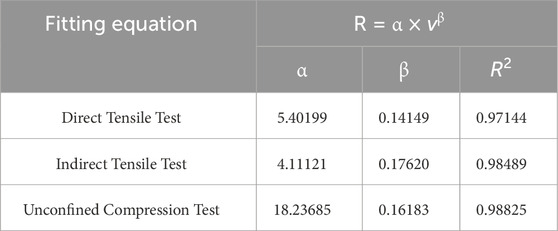
Table 11. Regression equations for strength-loading rate trends under various stress conditions.
As shown in Table 11, the fitted models for all three modes yield high coefficients of determination (R2 >0.97), confirming the strong correlation between strength and loading rate. However, the considerable variation in both α and β values indicates that direct conversion of strength values across different loading modes is unreliable without further normalization.
To address this issue, a dimensionless normalization approach was adopted. For each loading mode, the strength at 110 MPa/s was designated as the reference value S0, and both strength and loading rate were normalized to obtain strength ratios S/S0 and rate ratios v/v0. The normalized data for all three loading modes are provided in Table 12.
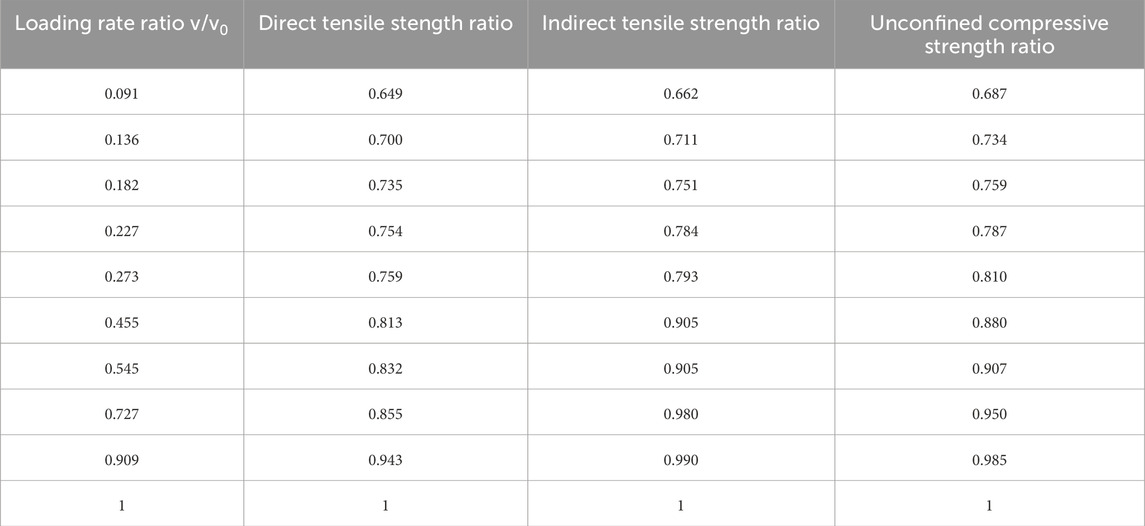
Table 12. Strength ratio as a function of loading rate ratio.
Figure 7 plots the normalized strength ratio against the normalized loading rate ratio.
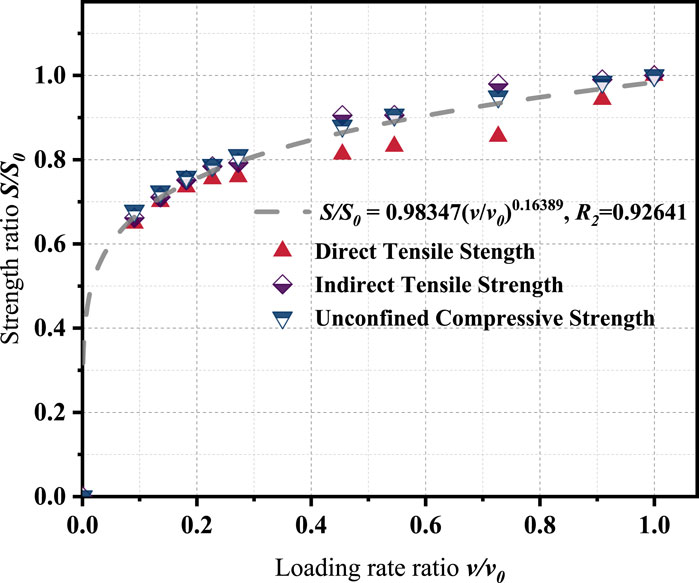
Figure 7. Curves of strength ratio versusloading rate ratio for different stress states.
Figure 7 plots the normalized strength ratio against the normalized loading rate ratio. As shown in Figure 7, the normalized data from all three loading modes collapse onto a single unified curve. This trend can be well represented by the following power-law relationship:
The fitting result achieves a high correlation coefficient (R2 = 0.92641), demonstrating the feasibility of using a unified strength model to describe rate-dependent mechanical behavior across different stress states.
This normalization-based approach enables reliable interconversion of strength values among direct tension, indirect tension, and unconfined compression modes. It also offers practical benefits, such as reducing the number of required strength tests by allowing estimation of unmeasured strength values based on a known test result under another mode. Furthermore, the model facilitates unified material characterization and design parameter selection in performance-based mixture design and mechanistic-empirical pavement analysis frameworks.
4 Conclusion
This study systematically investigated the strength behavior of a chemically toughened high-performance asphalt mixture designed for ultra-thin overlay applications. Direct tensile, indirect tensile, and unconfined compression tests were conducted under a wide range of loading rates to examine rate sensitivity and mechanical response. A unified strength model was subsequently developed to enable cross-mode strength conversion and provide a standardized strength evaluation method. The main conclusions are as follows.
(1) Rate-dependent behavior: The asphalt mixture exhibited clear rate sensitivity under all three loading conditions. As the loading rate increased, the measured strengths under direct tension, indirect tension, and unconfined compression all showed significant improvement, following stable nonlinear growth patterns. This behavior reflects the viscoelastic characteristics of the material, where faster loading suppresses crack initiation and propagation, thereby enhancing its resistance to failure.
(2) Variation among stress modes: Strength values differ substantially across loading modes even at the same loading rate. Compressive strength is consistently the highest, followed by indirect tensile and direct tensile strength. These differences are attributed to the underlying failure mechanisms, including aggregate interlock in compression and binder-aggregate interface failure in tension.
(3) Mohr-Coulomb analysis: Using test results from direct tension and unconfined compression, cohesion and internal friction angle were calculated based on the Mohr-Coulomb criterion. Cohesion increases with loading rate, reflecting improved interfacial bonding under fast loading. However, internal friction angle exhibits non-monotonic behavior, likely due to varying failure paths and local microstructural effects.
Unified strength model. A normalized power-law equation, S/S0 = 0.98347 (v/v0)0.16389, reliably links strength to loading rate for the chemically-toughened SMA-8 mixture in direct-tension, indirect-tension, and unconfined-compression tests (R2 = 0.92641). Because the equation converts a strength obtained in any one stress state—for example, an indirect-tensile value at a given loading rate—into its equivalents for the other two, it delivers a complete strength profile from a single test, cuts laboratory workload, and supplies self-consistent inputs for mechanical analysis. These advantages improve the consistency of strength evaluation and provide a practical reference for designing and predicting the performance of ultra-thin asphalt overlays. The current calibration, however, is limited to one binder, a single gradation, and 15°C; validation across additional binders, gradations, and temperature regimes is needed before the model can be generalized for routine pavement design.
Data availability statement
The raw data supporting the conclusions of this article will be made available by the authors, without undue reservation.
Author contributions
BH: Data curation, Funding acquisition, Formal Analysis, Writing – review and editing, Writing – original draft. BL: Project administration, Methodology, Writing – review and editing, Data curation. GX: Project administration, Methodology, Writing – review and editing. XJ: Project administration, Writing – review and editing, Methodology. DL: Supervision, Writing – review and editing, Investigation, Project administration. JL: Supervision, Writing – review and editing, Validation. CL: Validation, Writing – review and editing, Project administration, Data curation, Methodology. YL: Validation, Writing – review and editing. DW: Data curation, Writing – review and editing. CX: Validation, Writing – review and editing.
Funding
The author(s) declare that financial support was received for the research and/or publication of this article. This research is partially sponsored by these agents and organizations: National Outstanding Youth Science Fund Project of National Natural Science Foundation of China (52225806), the Open Fund of National Engineering Research Center of Highway Maintenance Technology (Changsha University of Science and Technology) (kfj230203, kfj230205), Shandong Province Transportation Science and Technology Program (2023B83), the Major R&D project of Zhejiang Provincial Department of Transportation (ZJXL-SJT-202316A).
Conflict of interest
Author BH was employed by Hunan Provincial Expressway Group Co., Ltd. Author GX was employed by Modern Investment Co., Ltd.
The remaining authors declare that the research was conducted in the absence of any commercial or financial relationships that could be construed as a potential conflict of interest.
The reviewer MG declared a shared affiliation with the author CX at the time of review.
Generative AI statement
The author(s) declare that no Generative AI was used in the creation of this manuscript.
Publisher’s note
All claims expressed in this article are solely those of the authors and do not necessarily represent those of their affiliated organizations, or those of the publisher, the editors and the reviewers. Any product that may be evaluated in this article, or claim that may be made by its manufacturer, is not guaranteed or endorsed by the publisher.
References
Beyene, M. A., Meininger, R. C., Gibson, N. H., Munoz, J. F., and Youtcheff, J. (2016). Forensic investigation of the cause(s) of slippery ultra-thin bonded wearing course of an asphalt pavement: influence of aggregate mineralogical compositions. Int. J. Pavement Eng. 17 (10), 887–900. doi:10.1080/10298436.2015.1025780
Chávez-Valencia, L. E., Alonso, E., Manzano, A., Pérez, J., Contreras, M. E., and Signoret, C. (2007). Improving the compressive strengths of cold-mix asphalt using asphalt emulsion modified by polyvinyl acetate. Constr. Build. Mater. 21 (3), 583–589. doi:10.1016/j.conbuildmat.2005.07.017
Danni, L., Qingbin, L., Yu, H., and Chen, T. (2015). Strength criterion for high strength concrete based on unified strength theory. J. Water Resour. 46 (01), 74–82. doi:10.13243/j.cnki.slxb.2015.01.010
Du, X., Gao, L., Rao, F., Lin, H., Zhang, H., Sun, M., et al. (2024). Damage mechanism of ultra-thin asphalt overlay (UTAO) based on discrete element method. J. Wuhan Univ. Technol. Mater. Sci. Ed. 39 (2), 473–486. doi:10.1007/s11595-024-2903-9
Eid, R., and Paultre, P. (2017). Compressive behavior of FRP-confined reinforced concrete columns. Eng. Struct. 132, 518–530. doi:10.1016/j.engstruct.2016.11.052
Editorial Department of China Journal of Highway and Transport Qiao, D., Yuchuan, D., Meng, G., You, H., Yanshun, J., et al. (2024). 2024 review of pavement engineering research in China. China J. Highw. Transp. 37 (03), 1–81. doi:10.19721/j.cnki.1001-7372.2024.03.001
Geng, L., Ma, T., Zhang, J., Huang, X., and Hu, P. (2017). Research on performance of a dense graded ultra-thin wearing course mixture. Appl. Sci. 7 (8), 800. doi:10.3390/app7080800
Guo, M., Zhang, R., Du, X., and Liu, P. (2024). A state-of-the-art review on the functionality of ultra-thin overlays towards a future low carbon road maintenance. Engineering 32, 82–98. doi:10.1016/j.eng.2023.03.020
Huang, T., Zheng, J. L., Lv, S. T., Zhang, J. H., Wen, P. H., and Bailey, C. G. (2018). Failure criterion of an asphalt mixture under three-dimensional stress state. Constr. Build. Mater. 170, 708–715. doi:10.1016/j.conbuildmat.2018.03.081
Li, X. L., Lv, X. C., Liu, X. Y., and Ye, J. H. (2019). Discrete element analysis of indirect tensile fatigue test of asphalt mixture. Appl. Sciences-Basel 9 (2), 327. doi:10.3390/app9020327
Liapis, I., and Likoydis, S. (2012). Use of electric arc furnace slag in thin skid–resistant surfacing. Procedia - Soc. Behav. Sci. 48, 907–918. doi:10.1016/j.sbspro.2012.06.1068
Lopez, C., Gonzalez, A., Thenoux, G., Sandoval, G., and Marcobal, J. (2019). Stabilized emulsions to produce warm asphalt mixtures with reclaimed asphalt pavements. J. Clean. Prod. 209, 1461–1472. doi:10.1016/j.jclepro.2018.11.138
Lv, S., Liu, C., Chen, D., Zheng, J., You, Z., and You, L. (2018a). Normalization of fatigue characteristics for asphalt mixtures under different stress states. Constr. Build. Mater. 177, 33–42. doi:10.1016/j.conbuildmat.2018.05.109
Lv, S., Wang, S., Liu, C., Zheng, J., Li, Y., and Peng, X. (2018b). Synchronous testing method for tension and compression moduli of asphalt mixture under dynamic and static loading states. J. Mater. Civ. Eng. 30 (10). doi:10.1061/(asce)mt.1943-5533.0002414
Mingqing, Y. (2013). Discussion on unified strength theories for rocks. Chin. J. Rock Mech. Eng. 32 (2), 258–265. doi:10.3969/j.issn.1000-6915.2013.02.006
Ministry of Transport of the People’s Republic of China (2017). Industry Standard of the People’s Republic of China. JTG D50-2017 Specifications for Design of Highway Asphalt Pavements. Beijing: China Communications Press.
Shi, K., Zhang, Y. F., Gao, Y. L., Yao, H., He, B., Duan, K. R., et al. (2021). Effects of adhesives on properties and mechanism of the ultra-thin pavement. Road Mater. Pavement Des. 22 (5), 1140–1159. doi:10.1080/14680629.2019.1668289
Song, W., Zou, X., Wu, H., and Zhan, Y. (2022). Effect of RAP and glass fiber on mode I fracture behaviors of ultra-thin friction course. Eng. Fract. Mech. 275, 108868. doi:10.1016/j.engfracmech.2022.108868
Vuye, C., Bergiers, A., and Vanhooreweder, B. (2016). The acoustical durability of thin noise reducing asphalt layers. Coatings 6 (2), 21. doi:10.3390/coatings6020021
Xia, C., Lv, S., You, L., Chen, D., Li, Y., and Zheng, J. (2019). Unified strength model of asphalt mixture under various loading modes. Materials 12 (6), 889. doi:10.3390/ma12060889
Yang, G. L., Wang, C. H., Wen, P. H., and Yin, W. Y. (2020). Performance characteristics of cold-mixed porous friction course with composite-modified emulsified asphalt. J. Mater. Civ. Eng. 32. doi:10.1061/(asce)mt.1943-5533.0003047(3)
Ying, L., Peng, Z., and Chunyang, X. (2023). Survey and research on strengthening financial security for highway maintenance in the new era. J. Manag. Cadre Coll. Ministry Transp. Commun. 33 (01), 3–5+15. Available online at: https://www.ncpssd.cn/Literature/articleinfo?id=JTYSBGLGBXYXB2023001002&synUpdateType=&type=journalArticle&typename=.
You, L., Yan, K., Hu, Y., and Ma, W. (2018a). Impact of interlayer on the anisotropic multi-layered medium overlaying viscoelastic layer under axisymmetric loading. Appl. Math. Model. 61, 726–743. doi:10.1016/j.apm.2018.05.020
You, L. Y., You, Z. P., Dai, Q. L., Guo, S. C., Wang, J. Q., and Schultz, M. (2018b). Characteristics of water-foamed asphalt mixture under multiple freeze-thaw cycles: laboratory evaluation. J. Mater. Civ. Eng. 30. doi:10.1061/(asce)mt.1943-5533.0002474(11)
Yu, J. M., Yang, N. K., Chen, F. D., Chen, Y. L., Lin, Z. H., and Yu, H. Y. (2021). Design of cold-mixed high-toughness ultra-thin asphalt layer towards sustainable pavement construction. Buildings 11, 619. doi:10.3390/buildings11120619(12)
Keywords: ultra-thin overlay, chemically toughened asphalt, loading rate, strength response, rate sensitivity, unified strength model
Citation: Huang B, Liu B, Xiao G, Jin X, Liu D, Liu J, Liu C, Ling Y, Wang D and Xia C (2025) A unified strength model for chemically toughened high-performance asphalt mixtures in ultra-thin overlay applications. Front. Mater. 12:1656467. doi: 10.3389/fmats.2025.1656467
Received: 30 June 2025; Accepted: 09 July 2025;
Published: 22 July 2025.
Edited by:
Hui Yao, Beijing University of Technology, ChinaReviewed by:
Roberto Alonso González-Lezcano, CEU San Pablo University, SpainZihao Chen, National University of Singapore, Singapore
Mingyang Gong, The Hong Kong Polytechnic University, Hong Kong, SAR China
Copyright © 2025 Huang, Liu, Xiao, Jin, Liu, Liu, Liu, Ling, Wang and Xia. This is an open-access article distributed under the terms of the Creative Commons Attribution License (CC BY). The use, distribution or reproduction in other forums is permitted, provided the original author(s) and the copyright owner(s) are credited and that the original publication in this journal is cited, in accordance with accepted academic practice. No use, distribution or reproduction is permitted which does not comply with these terms.
*Correspondence: Xin Jin, YTEzMjY0OTAyODNAb3V0bG9vay5jb20=