 Xiao Yin1
 Mutian Jia
 Giuseppe Lacidogna
 Jie Xu
- 1Shandong Electric Power Engineering Consulting Institute Corp., Ltd., Jinan, China
- 2School of Civil Engineering, Tianjin University, Tianjin, China
- 3Department of Structural, Geotechnical and Building Engineering, Politecnico di Torino, Torino, Italy
With the depletion of global fossil energy and the rapid development of photovoltaic power, prestressed high-strength concrete (PHC) pipe piles are widely applied in photovoltaic projects due to their superior mechanical properties and ease of construction. However, PHC pipe piles in cold regions face severe challenges of vertical cracks, which reduce the bearing capacity of the piles and threaten the safe operation of photovoltaic equipment. Motivated by a field case study of extensive cracking at a large-scale photovoltaic site, this paper investigates the failure mechanism through a combination of laboratory experiments and finite element (FE) analysis. The results reveal that the freezing and expansion of a sufficient volume of accumulated internal water is the necessary and definitive condition for vertical cracking, while pre-existing defects act only as promoting factors. A critical water level threshold for cracking was identified, and a subsequent parametric analysis demonstrated that this threshold is highly sensitive to design parameters. Specifically, the critical water level increases significantly with greater wall thickness and higher concrete strength, but is largely unaffected by the level of axial prestress. The findings are corroborated by the field data, which shows a strong correlation between the highest rates of pile failure and water-rich environmental conditions. This study provides a quantitative framework for engineers to assess the risk of frost heave and offers a scientific basis for developing effective preventive measures to enhance the durability of photovoltaic infrastructure in cold regions.
1 Introduction
Under the dual pressures of deteriorating global ecological environment and gradual depletion of traditional fossil energy, sustainable energy development has become an international consensus. As an important clean and renewable energy production method, photovoltaic power generation has seen a sharp growth in global installed capacity in recent years, driven by countries’ efforts to promote energy transition. In photovoltaic projects, stable foundation support is crucial. As Figure 1a shows, PHC pipe piles transmit loads of photovoltaic panel brackets, and are widely used due to advantages like high single-pile bearing capacity, wide applicability, and fast construction. Their compressive and flexural capabilities help resist wind and snow loads, shortening construction period and reducing costs in distributed projects (Liu et al., 2023; Feng et al., 2024; Yao et al., 2023).
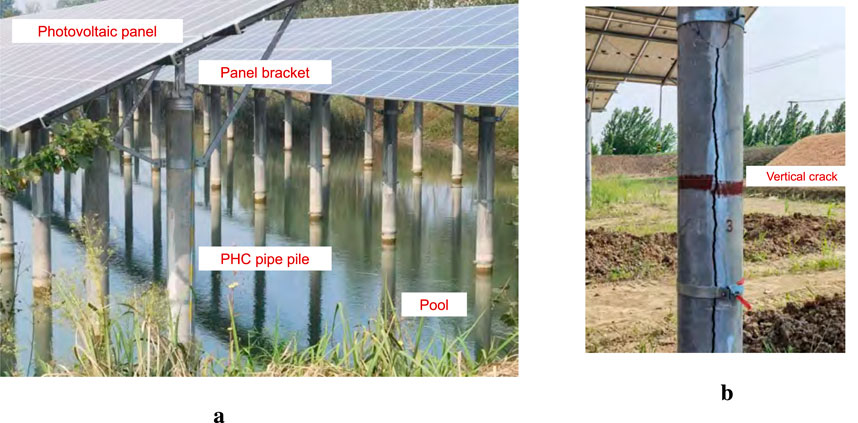
Figure 1. PHC pipe piles and vertical crack. (a) PHC pipe piles in photovoltaic modules. (b) Vertical crack in PHC pipe pile.
However, the durability of these foundations in cold regions presents a significant challenge. Frost damage is a major degradation phenomenon for construction materials in cold climates, where the expansion of freezing water in the material’s pore space can lead to internal pressures and cracking (Janssens et al., 2024; Boyd and Leone 2019). Research from northern latitudes, such as in Canada and Nordic countries, has extensively documented the detrimental effects of frost action on infrastructure. Canadian studies, for instance, focus on the unique geotechnical challenges of building on permafrost, including frost heave and the impact of climate change on foundation stability (Dourado et al., 2024; Grandmont and Fortier, 2013). In the Nordic region, research in Finland has highlighted that freeze-thaw damage is a primary degradation mechanism for concrete structures, with its severity strongly linked to the presence of water from sources like wind-driven rain (Pakkala et al., 2025). For pile foundations, this issue is particularly critical as it involves complex soil-pile interactions, such as adfreezing and frost jacking, which can compromise the foundation’s stability and bearing capacity (Ashkinadze, 2012). In this context, the piles widely used in photovoltaic projects are susceptible to severe vertical cracking, a widespread damage phenomenon that the authors investigated in a detailed case study at a project site in Northeast China (detailed in Section 4), as Figure 1b shows. This cracking impairs durability by creating pathways for aggressive media, and the subsequent thaw-weakening of the surrounding soil can further threaten the safety of the supported structures (Miller et al., 2015). The durability of concrete in freeze-thaw environments is a well-established field of study, with international standards providing guidance on materials and testing. For instance, the American Concrete Institute (ACI) offers specific guidelines for cold-weather concreting, and ASTM standards define methods for evaluating the frost resistance of concrete (ACI Committee 306 2016; ASTM C666/C666M-15 2015). Recent studies on PHC piles have specifically investigated their freeze-thaw resistance at the material level. For example, Qi (2024) examined the influence of admixtures and curing methods on the frost resistance of PHC pile concrete and explored the effectiveness of repair technologies, highlighting the importance of material composition and quality control in mitigating frost damage.
Beyond durability against environmental factors, the mechanical performance of PHC piles under various service conditions has been a major focus of academic research, with numerical analysis emerging as a vital tool. Studies have delved into a wide array of technical issues, including the bearing performance of pile-cap connections under cyclic loads (Liu et al., 2024), the seismic response and the need for seismic improvement solutions (Darmawan et al., 2022; Oktiovan et al., 2021), and the ultimate bearing capacity in complex soil layers (Li et al., 2021). Furthermore, research has addressed challenges during installation, such as pore water pressure generation in soft soils (Jia et al., 2024), and has explored detailed pile-soil interaction and load transfer mechanisms (Al-Jeznawi et al., 2025; Li and Li, 2023). These comprehensive studies highlight the importance of connection detailing, structural properties, and construction methods on the overall integrity and safety of PHC pile systems.
Despite this progress, a significant research gap remains regarding the specific failure mechanism of vertical cracking in PHC pipe piles caused by the frost heave of accumulated internal water. Existing studies on longitudinal cracking in cold regions fall into two main categories: (1) Focusing on frost heave of fillers. Using thick-walled cylinder theory, Jia et al. (2021) calculated the ultimate frost heave load on the inner wall as 1.680 MPa. Their extended finite element analysis showed that when frost heave pressure reaches this limit, concrete develops initial cracks that expand into longitudinal through-cracks. However, the study did not describe crack propagation characteristics in detail and lacked experimental validation. Zhang and Xin (2020) used a concrete damage plasticity model in numerical simulations, concluding that the transition of circumferential stress from compression to tension causes axial damage and cracking. This finding, too, lacked theoretical calculation or experimental verification. Kong et al. (2021) measured soil frost heave pressure via a steel barrel and conducted finite element simulations. They noted that cracking occurs when inner wall tensile stress reaches the concrete’s tensile strength, but failed to replicate on-site crack patterns due to the uniform application of frost heave pressure in their model. Based on investigations of photovoltaic projects, Wang (2020) attributed vertical cracks to winter freezing expansion of internal water in pipe piles, with wind-induced vibration exacerbating crack growth. However, this conclusion lacked theoretical and experimental support. (2) Focusing on initial defects of pipe piles. Through theoretical calculations and numerical simulations aligned with relevant codes, Tan et al. (2022) proposed that frost heave cracks only form if initial cracks exist from manufacturing or construction. However, their overestimation of crack resistance—due to the irrational adoption of thin-walled cylinder theory—remained unverified. Zhang and Xin (2020) observed numerous vertical cracks in photovoltaic pile foundations at a reservoir, identifying non-standard construction as the primary cause. They claimed that improving construction technology could resolve the issue, but provided no systematic experiments or reliable theoretical evidence to support this assertion.
In summary, current researchers agree that both initial defects of pipe piles and water frost heave can cause cracking in piles during service. However, theoretical and experimental studies on the sufficiency and necessity of these two conditions remain insufficient.
The preceding review reveals a critical gap between recognizing the problem and understanding its fundamental mechanism. While previous studies have also employed experiments and simulations, they have often treated internal water and initial defects as confounding variables. Critically, they have failed to systematically decouple these factors to establish whether they are necessary or merely promoting conditions for cracking. Furthermore, while the concept of a damage threshold is generally understood, no prior study has experimentally established a specific critical water level for a common PHC pile configuration (such as the PHC300-AB-70 with C80 concrete used in this study). The lack of this quantitative, type-specific data has hindered the development of targeted and cost-effective mitigation strategies, a particularly urgent issue given the widespread damage observed in our field case study.
To address this need, the primary objective of this study is to systematically investigate the cracking mechanism of PHC pipe piles, quantify the critical conditions for its initiation, and analyze the influence of key design parameters on the pile’s vulnerability to this failure mode through a combination of experiments and numerical simulation.
To achieve this objective, this paper is structured as follows, with the main contributions being:
1. Comparative experiments reveal the dominant inducement of frost heave cracking. The results show that frost heave cracking in pipe piles essentially stems from the coupling effect between the external environment and structural weak links. For vertical cracking to occur, two conditions are critical: first, the sufficient freezing and expansion of accumulated water inside the pile under negative temperatures is a necessary condition; second, initial cracks and uneven structural stress act as promoting factors. Notably, pipe piles can still crack due to frost heave even without obvious initial structural defects.
2. Frost heave experiments with varying water levels demonstrate that vertical cracking in pipe piles occurs only when fully frozen internal water reaches a sufficient frost-heave segment length. thereby establishing the existence of a critical water level threshold. Additionally, the mechanism of vertical cracking were preliminarily analyzed through finite element numerical simulation.
3. A comprehensive parametric analysis is conducted using the FE model to quantify the influence of key design parameters—including frost heave pressure, concrete strength, and wall thickness–on the critical water level for cracking. This provides actionable data for optimizing pile design against frost heave.
These findings provide a theoretical basis for preventing frost heave cracking in PHC pipe piles in cold regions. For instance, measures such as draining accumulated water to reduce the frost-heave segment length and optimizing the inner wall structure to uniformize stress can lower the risk of cracking. Together, these findings also provide a quantitative basis for developing effective and targeted mitigation strategies, such as specifying maximum allowable internal water levels based on specific pile designs and environmental conditions.
2 PHC pipe pile low-temperature frost heave experiment
2.1 Experimental study on freeze heave and initial cracks of PHC pipe piles
2.1.1 Experimental design
In this experiment, PHC300-AB-70 pipe piles were selected. In practical applications, the underground segment provides anti-pulling and bending resistance, while the above-ground segment supports the superstructure. The specific parameters and reinforcement details of the pipe piles are shown in Figure 2. The piles have an outer diameter of 300 mm, a wall thickness of 70 mm, and are made of C80-grade concrete, whose mechanical properties comply with the GB 50010–2010 code gb5 (2011). Key mechanical properties include: an elastic modulus of
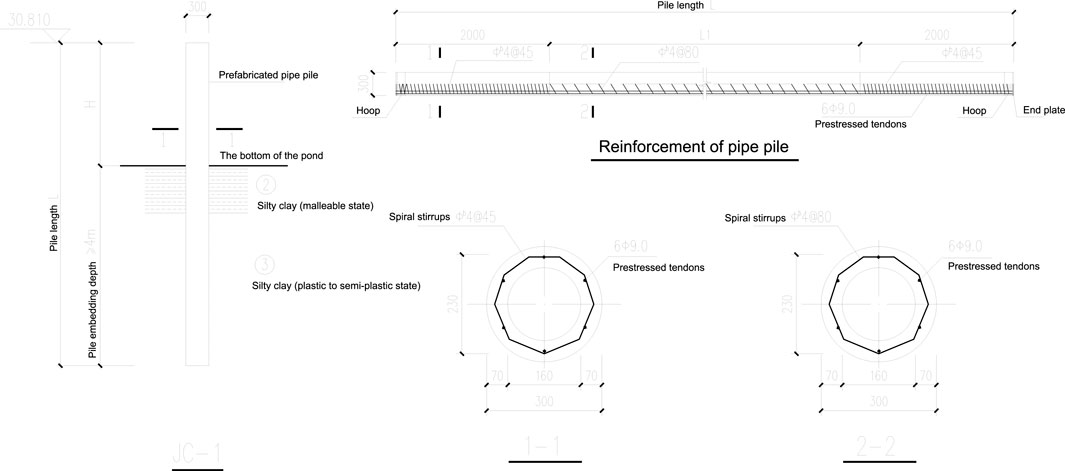
Figure 2. Design parameters of PHC300-AB-70 pipe pile.
To explore the necessity of two factors—initial structural cracks and full frost heave of fillers—for vertical cracking, we adopted an orthogonal control test design. A total of four pipe piles were used, numbered 1–1, 1–2, two to one, and two to two based on the combination of two variables: “with or without initial cracks” and “with or without water-ponding frost heave” as Figure 3a shows. The specific variable controls are as follows: Three full-length initial cracks were cut along the axial direction of the pipe piles using an angle grinder, with unified parameters: 1.5 cm in depth, 0.5 cm in width, and length equal to that of the pile segment (1.4 m). The cracks are parallel to the pipe pile axis. For piles one to one and two to one, the bottom of the pipe piles was sealed with grouting material and planks, and 1.3 m deep test water was injected. The water surface is 10 cm below the pile top to reserve space for frost heave.
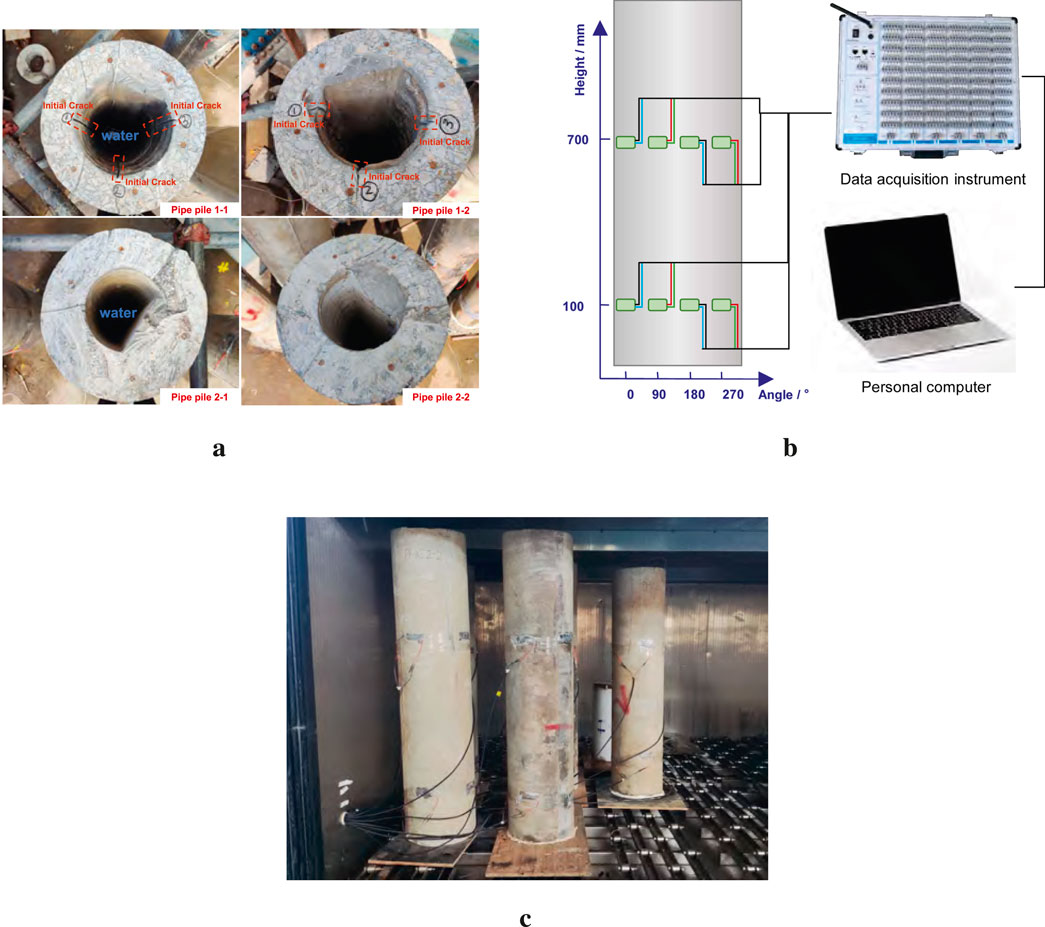
Figure 3. Overview of the experimental setup. (a) Top-down view showing the four specimen conditions. (b) Schematic of the instrumentation and data acquisition. (c) Specimens placed inside the low-temperature environmental chamber.
The test equipment used was an ultra-low-temperature environmental chamber at Tianjin University, with a minimum temperature of −110 °C and a temperature control accuracy of
The test process was strictly controlled as follows: Pipe piles were hoisted into the environmental chamberas Figure 3c shows. The temperature was cooled from 30 °C, with full freezing defined as the internal temperature (recorded by the sensor in the water) remaining below −10 °C for 2 h to ensure complete freezing of internal water. Piles 2–2 (no initial cracks, no water ponding) and 1–2 (with initial cracks, no water ponding) underwent the same cooling process as the experimental group but without water injection, ensuring all conditions were identical except for “water-ponding frost heave.” The total test duration was 12 h. After removal, the pipe piles were left at room temperature until internal ice completely melted. Water was drained, and cracking was then observed.
2.1.2 Analysis of test phenomena and results
After the test, distinct cracks on both the inner and outer surfaces of Pipe Piles one to one and two to one were observed, as Figure 4a,c shows. The cracks on the inner and outer surfaces corresponded one-to-one in position. Specific data on crack width and length are provided in Table 1. Additionally, the 4-mm-diameter cold-drawn low-carbon steel wire stirrups near the cracks exhibited brittle fracture, with fracture positions concentrated directly ahead of the crack propagation path. This indicates that excessive tensile stress was generated when frost heave force was transmitted to the stirrups.
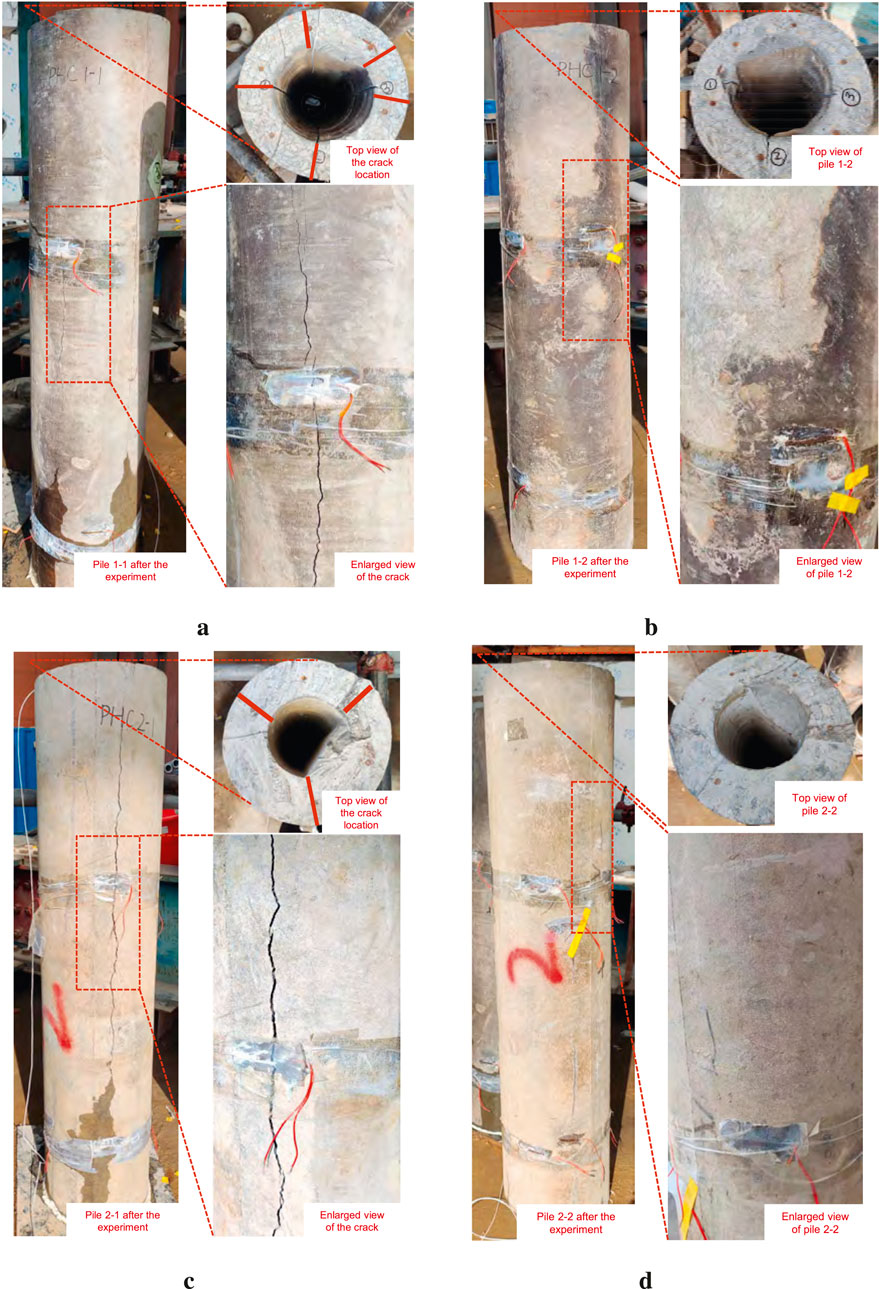
Figure 4. The cracking situation of water injection pipe piles. (a) Pile one to one after experiment. (b) Pile one to two after experiment. (c) Pile two to one after experiment. (d) Pile two to two after experiment.
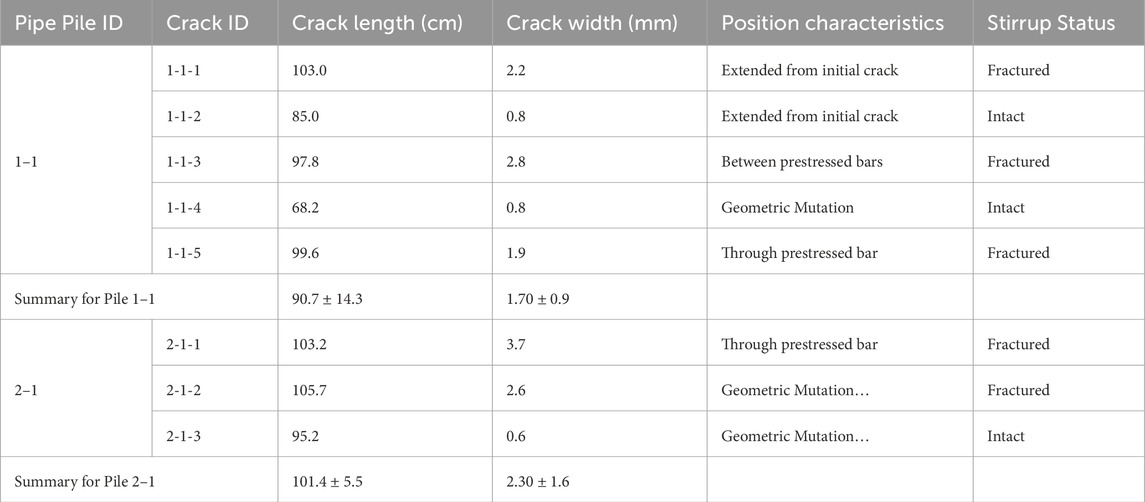
Table 1. Summary of crack data from the orthogonal control experiment.
Pipe Pile one to one developed two through - cracks that developed from the expansion of initial cracks. This occurred because when the pipe pile was subjected to frost heave force from internal water freezing, stress concentration arose at the tips of the initial cracks, making these areas structural weak points. Pipe Pile 2-1—filled with water but without initial cracks—developed three cracks from a single frost heave event. These cracks were located at geometric discontinuities in the inner cross-section (the transition where wall thickness suddenly decreased from 80 mm to 70 mm) and traversed the 9-mm-diameter HPB300 prestressed tendons. This confirms the principle that geometric discontinuities and prestressed tendon locations are prone to cracking.
As Figure 4b,d shows, no visible cracks were observed on the inner or outer surfaces of the control group pipe piles (one to two and 2–2). This further confirms that low-temperature environments alone do not cause cracking—damage occurs only when accumulated water freezes and expands. Conversely, Pile 1–1 (with initial defects) developed more cracks (5) than Pile 2–1 (3). A quantitative comparison of the summary statistics in Table 1 shows that the average crack length and width for Pile 2–1 (101.4
Figure 5 shows the internal temperature changes of the pipe piles during the experiment and the strain data at 700 mm height (no cracks were observed at 100 mm height, so this data is excluded from the analysis). During the test, the test chamber was opened three times for observation (at 5h53min, 6h36min, and 10h43min), causing sudden temperature rises. The strain curves of all groups fluctuated briefly due to this environmental interference, so these fluctuations are excluded from the cracking mechanism analysis.
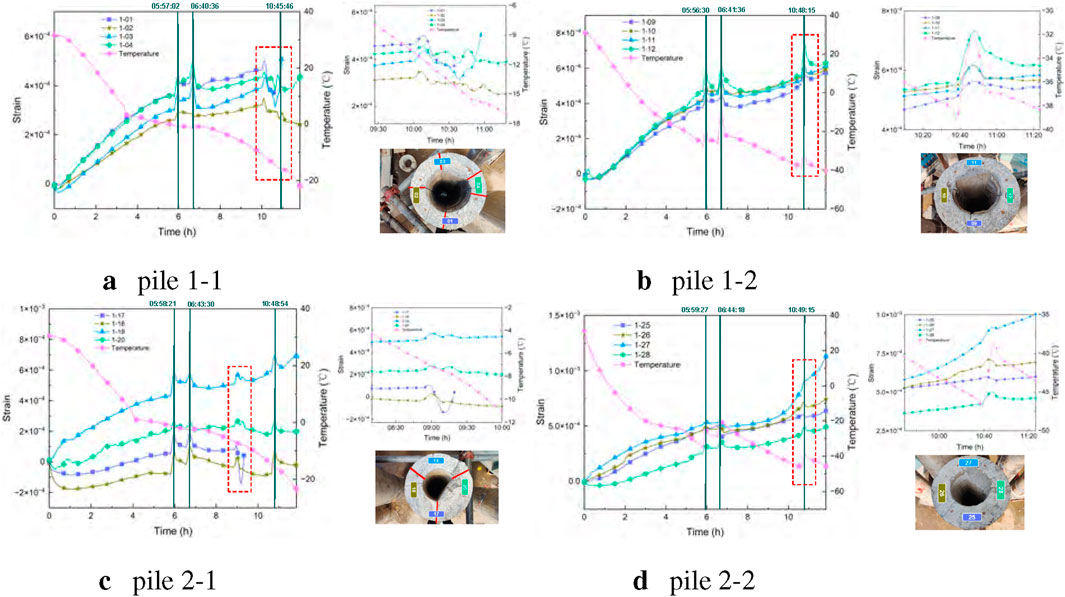
Figure 5. The curve of strain changing with time. (a) pile 1–1. (b) pile 1–2. (c) pile 2–1. (d) pile two to two.
The correlation between the overall strain trend and frost heave is as follows: In the common change stage from 0 to 9 h (30 °C to −15 °C), the strain trends of the experimental and control groups were nearly identical. Both initially exhibited fluctuations of
In summary, all cracking events were accompanied by strain gauge overload failures, and this phenomenon occurred exclusively in the water-injected groups. This confirms that full frost heave of accumulated water inside the pipe piles is a necessary condition for vertical cracking, which ultimately manifests as overload of strain gauges at specific positions.
2.2 PHC pipe pile frost heave height experiment
To investigate how water level height influences frost heave cracking in piles, 4 PHC300-AB-70 pipe piles (1.0 m long, stirrup spacing 80 mm) were selected for this experiment. After plugging their bottoms, water levels of 200 mm, 300 mm, 400 mm, and 500 mm were set respectively. The temperature in the low-temperature chamber was lowered from 30 °C to −15 °C, and frost heave cracking characteristics were observed directly. The results are as follows:
The pipe pile with a 200 mm water level showed no visible cracks as Figure 6a shows. This indicates that the frost heave pressure at this water level did not reach the critical value for cracking. In contrast, the pipe piles with water levels of 300 mm, 400 mm, and 500 mm all developed three cracks (Figures 6b-d). The length and width of the cracks showed significant differences with the increase of water level, as quantitatively analyzed in Figure 7.
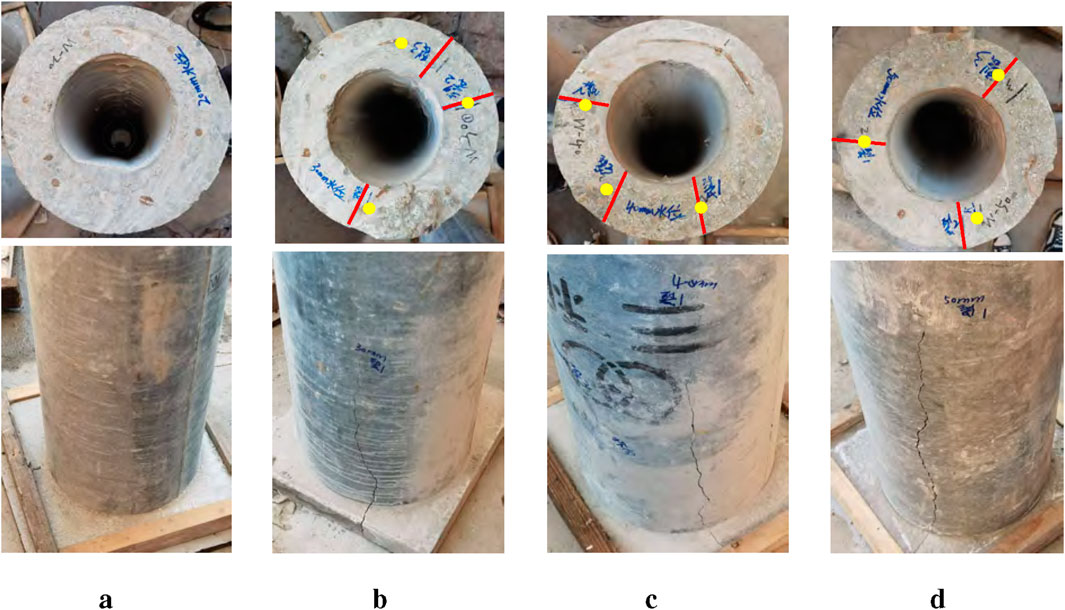
Figure 6. Cracks of pipe piles with different frost heave heights. (a) 200 mm. (b) 300 mm. (c) 400 mm. (d) 500 mm.
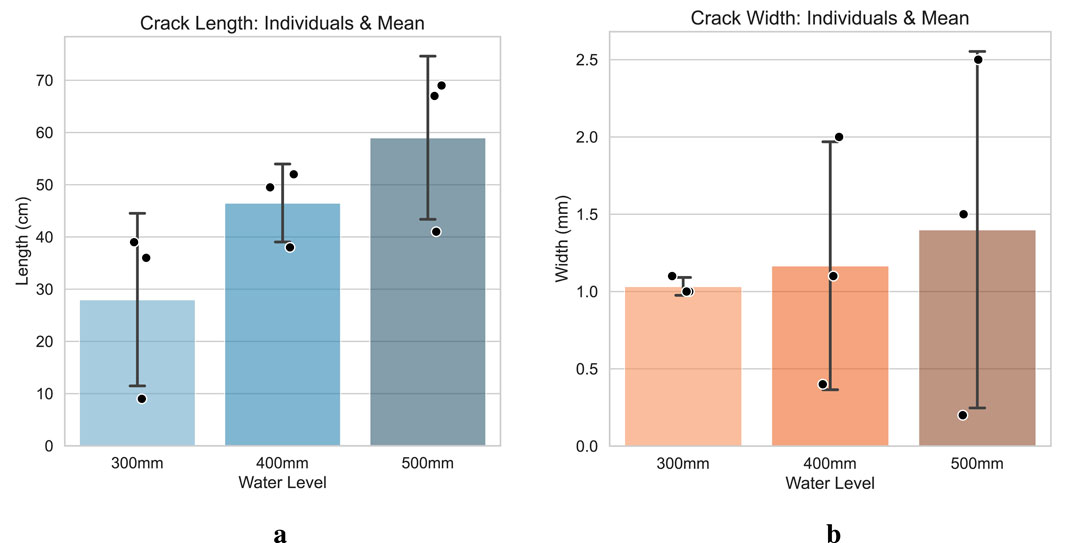
Figure 7. The lengths and widths of cracks in pipe piles at different frost heave heights. (a) Length. (b) Width.
Figure 7 displays the mean, standard deviation, and individual data points for the three cracks observed at each water level. A clear trend was observed: as the water level rose, both the average crack length and width increased. The average crack length grew from 28.0
The absence of cracking at the 200 mm water level directly confirms the existence of a critical water level threshold (200–300 mm) for frost heave cracking. When the water level is below this threshold, even full freezing of accumulated water generates insufficient expansion force to exceed the tensile strength of C80 concrete. In contrast, at water levels of 300 mm or higher, frost heave pressure increases significantly with rising water levels, causing concurrent growth in crack length and width. Notably, cracks at the 500 mm water level (the highest tested) developed most fully, validating the rule that higher water levels correspond to greater risk and severity of frost heave cracking.
In conclusion, this test clarifies the quantitative relationship between water level height and frost heave cracking through measured data, offering direct guidance for engineering practice: controlling accumulated water inside pipe piles below the critical threshold can effectively mitigate frost heave cracking risks in cold regions.
3 Numerical simulation
3.1 Model overview
To further investigate how frost heave of accumulated water at different heights contributes to cracking, numerical simulations of various material combinations under identical loading magnitudes and different loading heights were conducted.
The general finite element software Abaqus is used to model the PHC300-AB-70 pipe pile, with an axial length of 1 m, and inner and outer diameters of 160 mm and 300 mm, respectively. Corresponding to the maximum water level of 500 mm in the experiment, the frost heave loading length does not exceed 0.5 m. As Figure 8a shows, the pipe pile is an axisymmetric structure, and the frost heave load is uniformly distributed along the circumferential direction, satisfying both geometric and load symmetry. Therefore, a 1/4 symmetric model is adopted, which reduces the calculation amount by 75% while ensuring the accuracy of the results. The model primarily consists of longitudinal prestressed reinforcement, concrete, and circumferential stirrups, with dimensions defined in millimeters. Concrete and longitudinal prestressed reinforcement are modeled with the solid element C3D8R, which uses fewer integration points than general full-integration elements, thus reducing the calculation time. Unlike previous studies that used line elements, we opted for solid elements because the scale discrepancy between the actual prestressed reinforcement and concrete models exceeds 10%, a non-negligible factor in engineering analysis. Circumferential stirrups were modeled using the truss element T3D2.
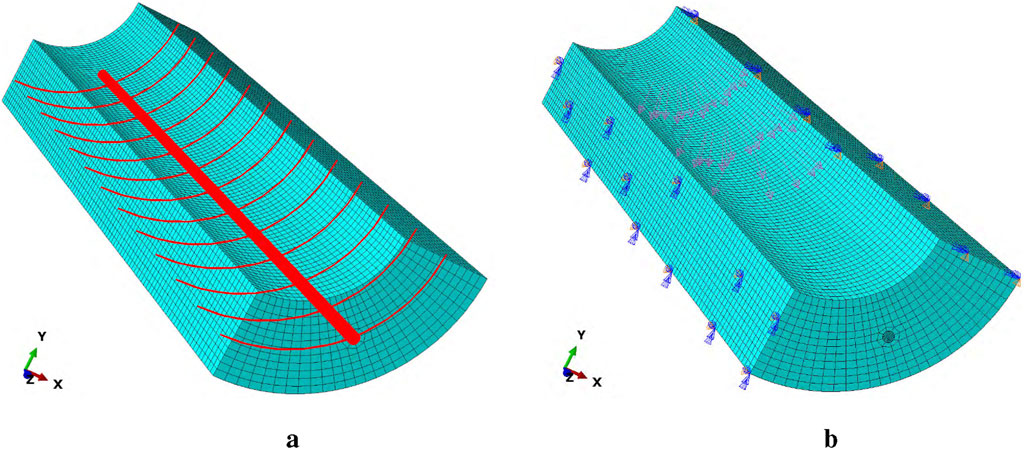
Figure 8. Finite element model. (a) Concrete-longitudinal reinforcement-stirrup model. (b) Boundary conditions and load application.
The Concrete Damage Plasticity (CDP) model specified in Code for Design of Concrete Structures (Concrete structures, 2011) is selected as the concrete constitutive model for the simulation of PHC pipe piles (gb5 (2011)). In this model: The stress-strain relationship in the elastic stage is defined by concrete’s Young’s modulus and Poisson’s ratio. The inelastic stage stress-strain relationship follows the concrete stress-strain curve provided in the code as Figure 9 shows. Other parameters for the CDP model are listed in Table 2. Concrete’s physical and mechanical parameters adhere to Section 4.1 of GB 50010–2010: elastic modulus =
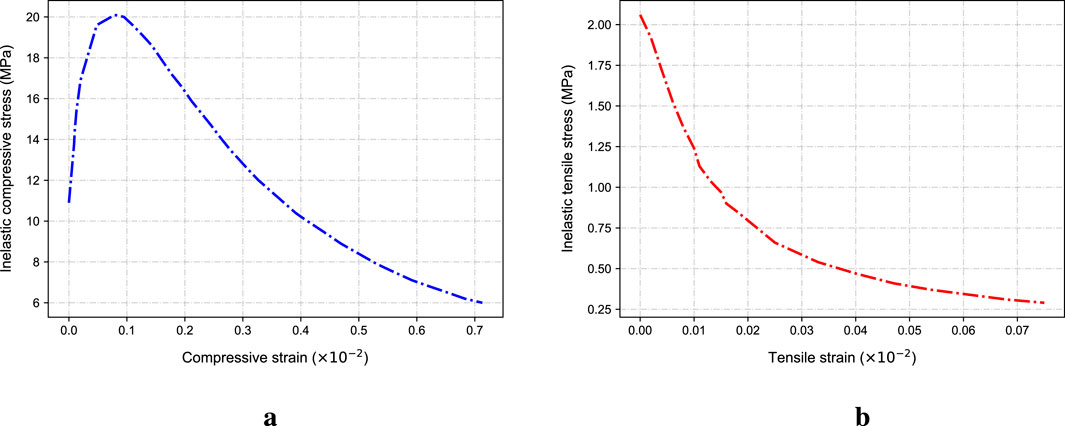
Figure 9. The curve specified in the concrete damage plastic model. (a) The “inelastic stress”-strain curve under compression. (b) The “inelastic stress”-strain curve under tension.

Table 2. CDP model parameters.
To simulate the bonding effect between reinforcement and concrete, we applied a “tie” constraint between the surface of longitudinal reinforcement and the inner surface of concrete. Circumferential stirrups were embedded in the concrete and offset 10 mm toward the outer wall to prevent them from being placed inside the longitudinal reinforcement of solid elements. Frost heave load was applied as a uniformly distributed pressure on the concrete inner wall. This idealized pressure was applied to systematically identify the locations on the inner wall most vulnerable to circumferential tensile stress. Referring to Jia et al. (2021), who calculated an ultimate frost heave force of 1.680 MPa, we set the applied load to 1.5 MPa (slightly reduced). This adjustment ensures the concrete remains in the elastic range, facilitating clear analysis of stress distribution characteristics just before cracking. Notably, this elastic analysis focuses on identifying initial crack locations rather than modeling the full crack propagation and material failure process. Meanwhile, symmetric boundary conditions restricting normal displacement are applied to the symmetric planes of the 1/4 model. This ensures that the concrete remains in the elastic state during the loading stage, facilitating the analysis of stress distribution characteristics before cracking. Symmetric boundary conditions restricting normal displacement are applied to the symmetric planes of the 1/4 model. In accordance with the provisions of Prestressed Concrete Pipe Piles (10G409), the calculated effective precompressive stress of concrete for PHC300-AB-70 pipe piles is 6.37 MPa (10G (2010)). Therefore, a uniformly distributed pressure of 6.37 MPa is applied synchronously from the top and bottom of the model to simulate the axial prestress of the pipe pile. Verification showed that stress concentration near the precompression loading area was limited to a 50 mm range at the ends, which does not affect stress distribution in the frost heave loading section, confirming the model’s rationality. Loading was divided into two analysis steps: (1) Applying prestress to simulate the initial precompression state of the pipe pile during service. (2) Applying the frost heave load. This sequence aligns with real engineering scenarios, where pipe piles first bear prestress and then undergo frost heave effects.
3.2 Structural response comparative analysis
First, the problem of the freezing expansion pressure on the inner wall of pile concrete can be approximately regarded as the problem of a thick - walled cylinder under internal pressure. For a thick - walled cylinder with inner and outer radii
In the formula,
Using the material mechanics calculation method for thick-walled cylinders specified in Equation 2, the maximum tensile stress response value of the inner wall of the pipe pile with the geometric dimensions in this study is calculated to be 2.693 MPa under a uniform internal pressure of 1.5 MPa. As Figure 10 shows, we extracted the maximum circumferential tensile stress values of the concrete inner wall in the loading section across 40 working conditions, covering four models: concrete-only, concrete-stirrup, concrete-stirrup-prestressed reinforcement, and concrete-stirrup-prestressed reinforcement-prestress. These values were sampled at 50 mm intervals from 50 mm to 500 mm height. The results show that at a loading height of 50 mm, the maximum circumferential tensile stress in the concrete-stirrup-prestressed reinforcement-prestress model (0.9488 MPa) is only 35% of the theoretical value (2.693 MPa), with a 65% deviation; at 300 mm, the concrete stress (2.620 MPa) reaches 99.9% of the theoretical value (deviation = 0.1%), as shown in Figure 11. From 400 mm to 500 mm, the deviation stabilizes at 3% - 5%. The maximum tensile stress of concrete increases from 50 mm to 300 mm, gradually approaching the theoretical calculation. This is because the thick-walled cylinder theoretical formula does not account for the constraint effect on both sides of the loading section.
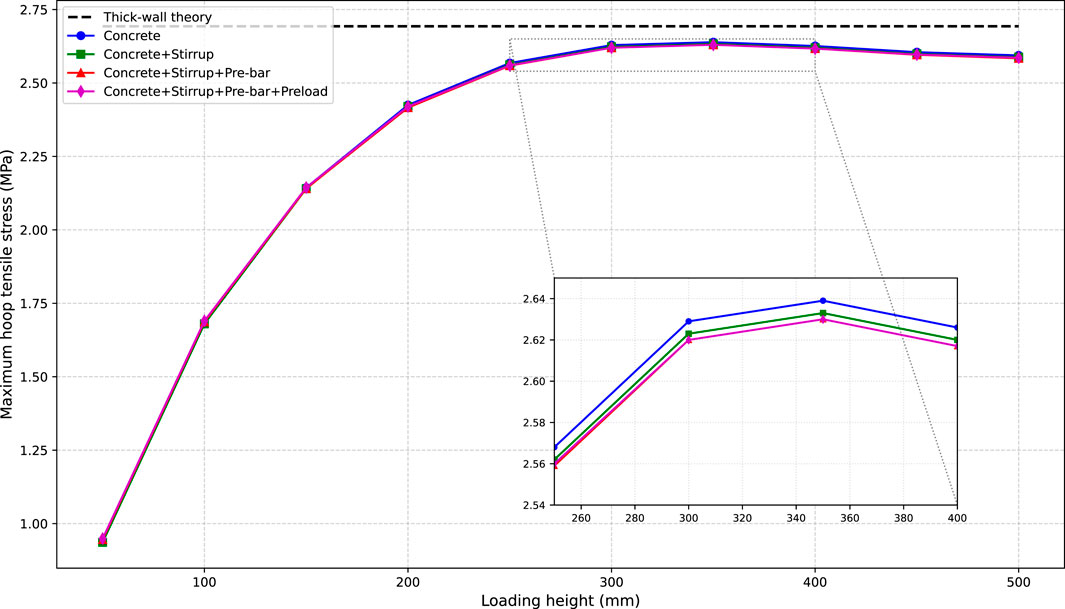
Figure 10. Comparison of maximum circumferential tensile stress with theoretical calculation under different material combinations and loading heights.
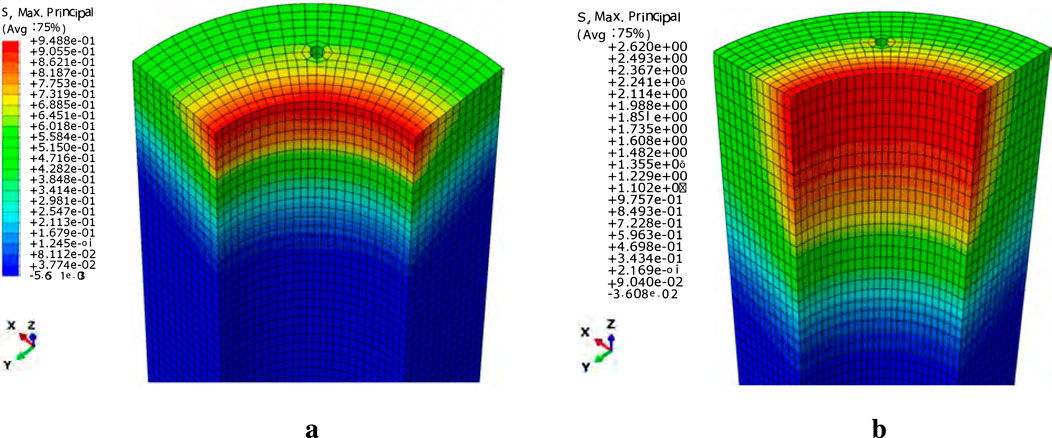
Figure 11. The maximum circumferential tensile stresses at two different loading heights. (a)50 mm loaded. (b) 300 mm loaded.
In addition, the four models show no significant difference in maximum circumferential tensile stress at the same loading height. The maximum stress difference between any two models at the same height does not exceed 0.015 MPa. For instance, at 300 mm, the pure concrete model exhibits a stress of 2.629 MPa, while the full model (with prestress and reinforcement) shows 2.620 MPa—a difference of 0.009 MPa, which is only 0.3% of the theoretical value. This indicates that in the elastic stage, stirrups, longitudinal reinforcement, and axial prestress have no significant impact on the maximum circumferential tensile stress.
Numerical simulations show that the constraint effect of the unloaded sections on the loaded section (with respect to maximum circumferential tensile stress) can only be neglected when the loading height reaches 300 mm. Thus, we selected the concrete-stirrup-prestressed reinforcement-prestress model at 300 mm for detailed analysis.
As Figure 12 shows, applying a frost heave pressure of 1.5 MPa results in the maximum circumferential tensile stress in concrete (2.731 MPa) occurring at the central axis of the inner wall. This aligns with the experimental observation that cracks in pipe piles with a 300 mm water level are concentrated in the middle, verifying the model’s rationality. Stirrups also exhibit maximum tensile stress in the middle of the loading section, but this value (13.78 MPa) is relatively low compared to their yield stress (320 MPa). This indicates that reinforcement does not significantly share stress when concrete is in the elastic stage. However, the stirrup fracture observed in the experiment strongly suggests that once the concrete cracks, a significant stress redistribution occurs, transferring load to the reinforcement and eventually causing it to yield or fracture. This discrepancy highlights a key limitation of the current elastic model, which cannot simulate the post-cracking stress redistribution that leads to reinforcement failure.
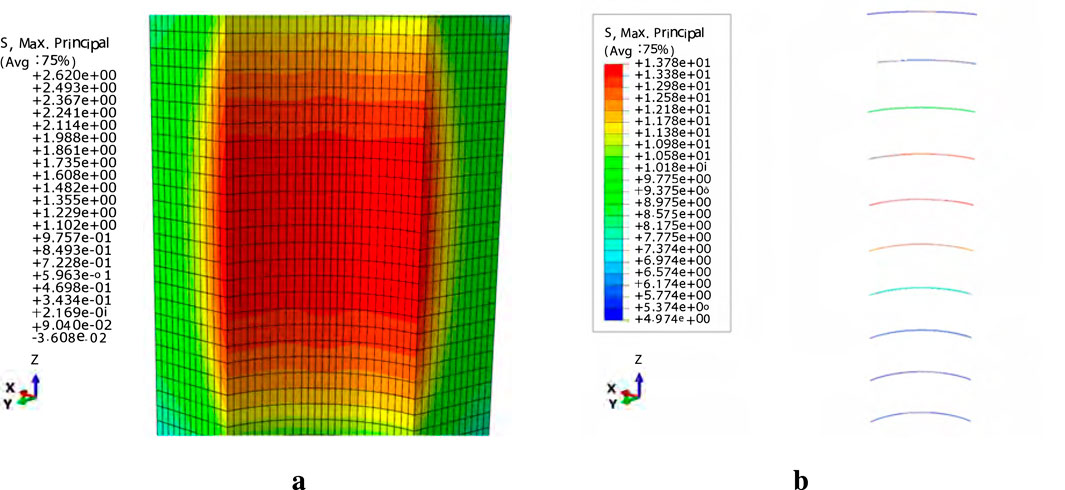
Figure 12. Stress response of the concrete-stirrup-prestressed tendon-prestress model at a loading height of 300 mm. (a) The distribution of tensile stress on the inner wall of concrete. (b) Distribution of stirrup tensile stress.
4 Parametric analysis of frost heave cracking
To quantitatively assess the influence of various design parameters on the frost heave cracking of PHC pipe piles, a systematic parametric study was conducted using the Finite Element (FE) model with elastic material parameters. The study adopts the One-Factor-At-a-Time (OFAT) method, where one parameter is varied while others are kept constant, to clearly isolate its effect. The baseline for this analysis is a PHC300-AB-70 pipe pile, constructed with C80 concrete (
The magnitude of the frost heave pressure, which depends on factors like freezing temperature and water confinement, is a primary driver of cracking. Simulations were run with four different pressure values: 1.5, 1.7, 1.9, and 2.1 MPa. The resulting maximum circumferential tensile stresses at various water levels are presented in Table 4.1 and visualized in Figure 13. The results clearly indicate an inverse relationship between the frost heave pressure and the critical water level. At lower pressures (1.5 and 1.7 MPa), the stress never reached the C80 concrete’s tensile strength of 3.11 MPa, meaning no cracking would occur under these conditions for the tested water levels. For a pressure of 1.9 MPa, the critical water level is found to be between 200 mm and 250 mm. By linear interpolation, Hcrit is calculated to be approximately 214 mm. When the pressure increases to 2.1 MPa, the critical water level drops significantly to a range between 150 mm and 200 mm, with an interpolated value of approximately 165 mm. This confirms that higher frost heave pressure dramatically increases the risk of cracking, requiring a much lower water level to initiate failure.
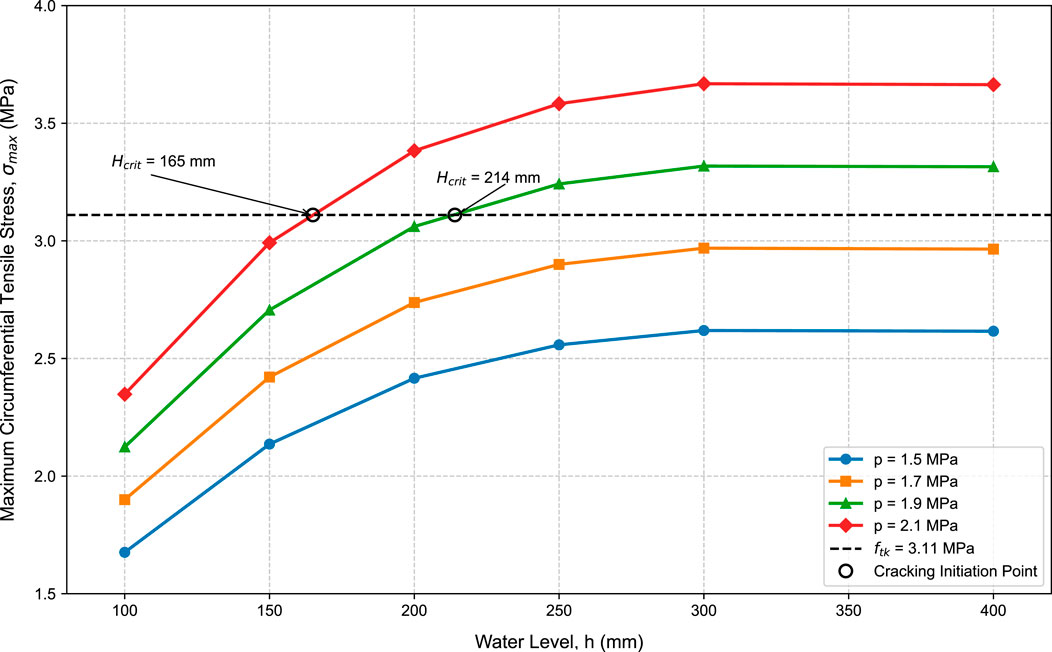
Figure 13. Influence of frost heave pressure on the critical water level.
To investigate the effect of material properties, simulations were conducted for three different concrete grades (C60, C70, C80, and C90) under a fixed frost heave pressure of 1.9 MPa. The tensile strengths
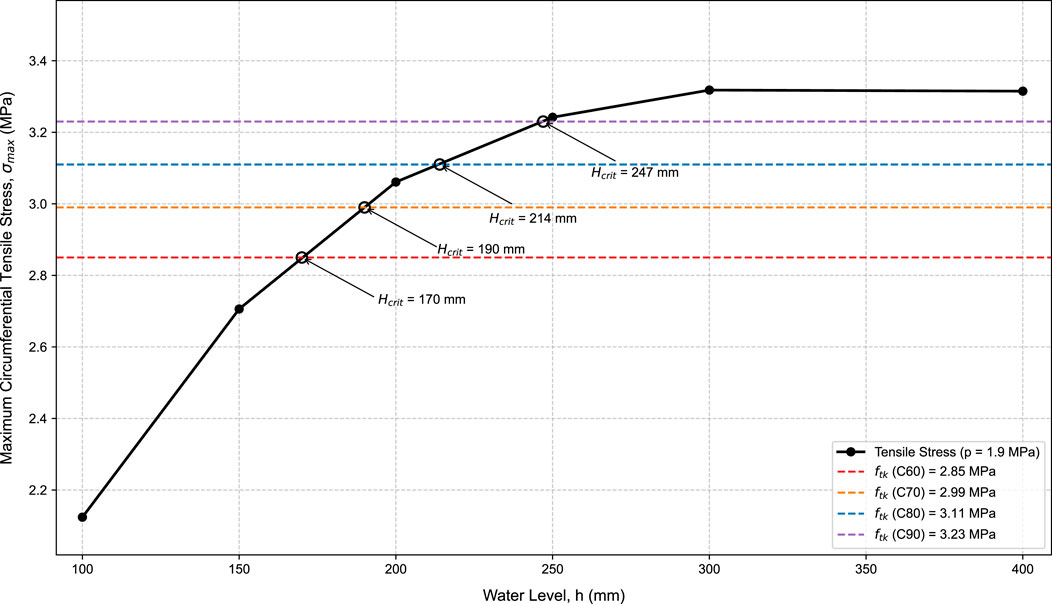
Figure 14. Influence of concrete strength on the critical water level.
The effect of axial prestress was evaluated by simulating three levels of effective precompressive stress: 4.07, 6.25, and 8.04 MPa (given in 10G (2010)). The results, summarized in Table 3, show that varying the axial prestress has a negligible effect on the maximum circumferential tensile stress caused by internal pressure. For a given water level, the difference in stress between the highest and lowest prestress levels is less than 0.1%. This is because the axial prestress and the circumferential stress from internal pressure act in orthogonal directions. Therefore, increasing the axial prestress, while beneficial for the pile’s bending capacity, does not significantly improve its resistance to this specific mode of frost heave cracking.
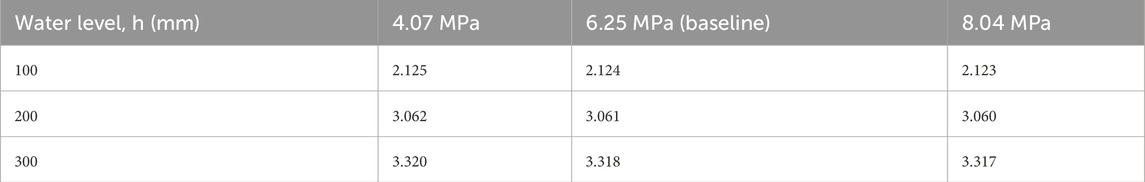
Table 3. Maximum circumferential tensile stress (MPa) under different prestress levels (p = 1.9 MPa).
The influence of wall thickness was investigated by simulating piles with thicknesses of 70, 80, and 95 mm, while keeping the outer diameter (300 mm) and other parameters constant. The results in Figure 15 demonstrate a strong inverse correlation between wall thickness and the induced tensile stress. Consistent with thick-walled cylinder theory, which states that tensile stress decreases with increasing wall thickness when outer diameter and internal pressure are held constant. Increasing wall thickness significantly reduces circumferential tensile stress: for the baseline 70 mm thickness, the critical water level is 214 mm; at 80 mm, stress does not reach the 3.11 MPa failure threshold within the simulated 400 mm water range, meaning no critical level exists under this pressure; and at 95 mm, stresses are further reduced, providing a substantial safety margin against cracking. This confirms that increasing wall thickness is a highly effective structural measure to mitigate frost heave cracking risk.
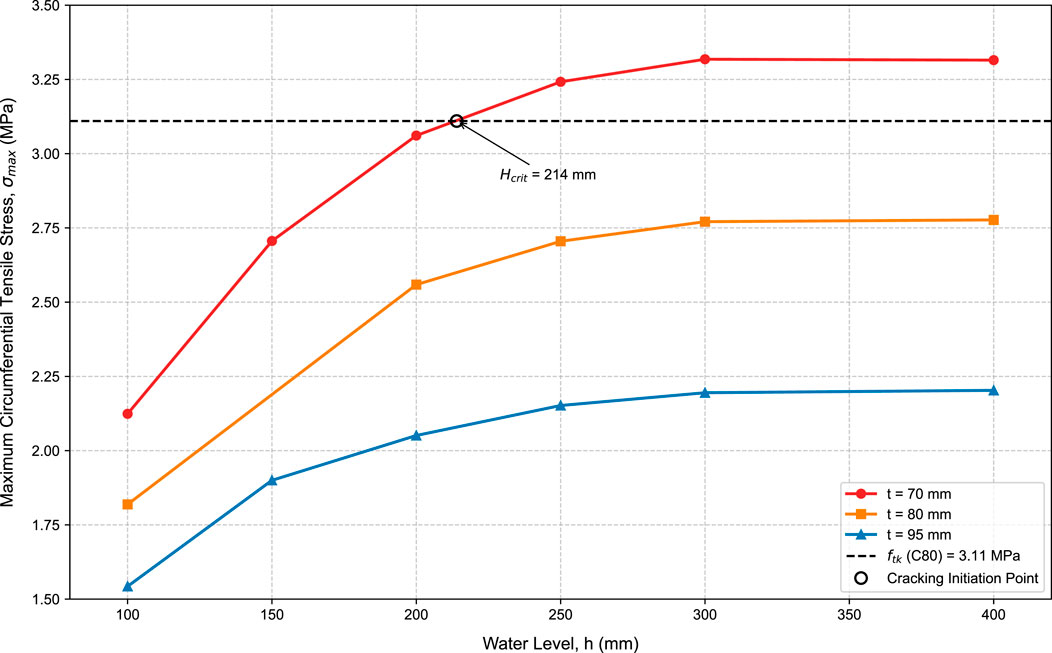
Figure 15. Influence of wall thickness on the critical water level.
5 Field case study and analysis
5.1 Project background and validation via morphological comparison
The theoretical and experimental work of this research ultimately aims to solve practical engineering problems. Its initial motivation stemmed from a field investigation of a large-scale photovoltaic project in northern China. In the “fish-light complementary” and “agriculture-light complementary” zones of this project, nearly 15,000 PHC300-AB pipe piles were installed as support foundations for photovoltaic panels (see Figure 1a). During operation, on-site engineers observed extensive longitudinal cracks of varying severity in these pipe piles (see Figure 1b). Such damage not only impairs the structure’s appearance and durability but also poses a potential threat to the long-term safe operation of the entire photovoltaic power station.
To systematically evaluate the extent of damage to the piles on site and to provide a scientific basis for subsequent maintenance and repair, we established a four-level crack classification standard. This standard categorizes the observed damage from most to least severe based on the crack’s morphology, size, and potential impact on structural integrity.
Specifically, Class 1 cracks, the most severe level, were defined by critical structural damage requiring immediate attention, such as transverse or diagonal cracks, severe local spalling, multiple through-cracks, through-cracks wider than 5 mm, or fractured stirrups. Class 2 cracks included longitudinal through-cracks with a significant width (0.3 mm–5 mm) that posed a clear durability risk, although the stirrups remained intact. Class 3 cracks were characterized as minor, non-through cracks with a width of less than 0.3 mm. Finally, Class 4 cracks represented the least damage, including only fine hairline cracks visible to the naked eye or traces of previous repairs. To visually illustrate these categories, Figure 16 shows representative examples of each of the four crack classes.
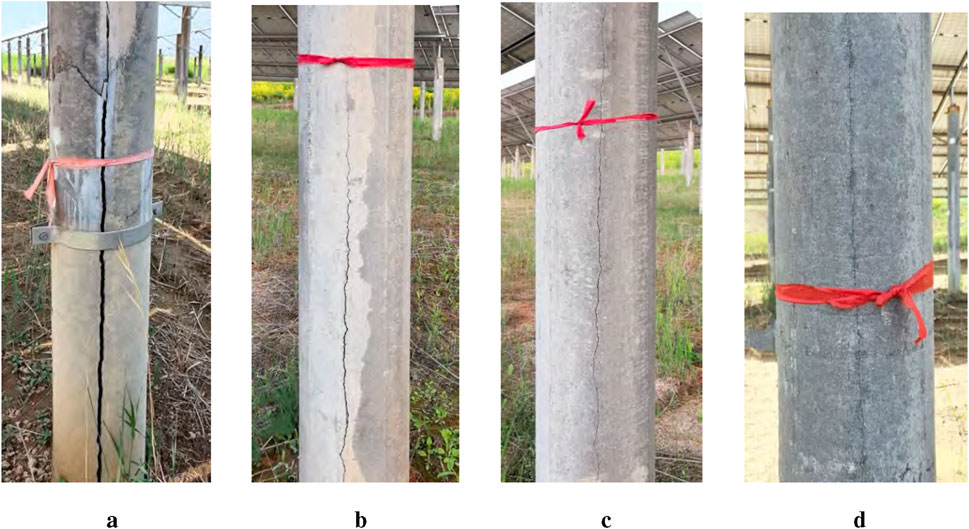
Figure 16. Typical forms of the four classes of cracks observed on-site. (a) Class 1 crack, (b) Class 2 crack, (c) Class 3 crack, (d) Class 4 crack.
As Figure 16 shows, the field cracks (16) and the laboratory-produced crack (4a and 4c) exhibit a high degree of consistency. Both are vertical and linear, developing along the pile’s longitudinal axis. This strong morphological similarity provides the most direct visual evidence for our core argument: the failure process reproduced in the laboratory is identical to the physical process causing large-scale field pile cracking. This confirms that our laboratory findings are highly relevant to explaining and solving this practical engineering problem, laying a solid foundation for proposing protective measures based on “controlling internal water accumulation.”
5.2 Statistical characteristics and spatial distribution of field cracks
Following the establishment of the crack classification standard, a comprehensive screening was conducted on a total of 14,289 pipe piles across 11 main survey zones. The statistical results show that cracking occurred to varying degrees in all zones, with a total of 2,255 cracks of all types identified within the surveyed area.
To systematically reveal the distribution patterns, severity of cracks, and their relationship with the total number of piles in each zone, we compiled the crack counts and the crack rate (i.e., the percentage of cracked piles out of the total piles in that zone) into a combined chart (as Figure 17 shhows). In the figure, the stacked bar chart (corresponding to the left Y-axis) visually represents the absolute number of cracks of different severities in each zone, while the blue line chart (corresponding to the right Y-axis) reflects the overall damage proportion of piles in each zone.
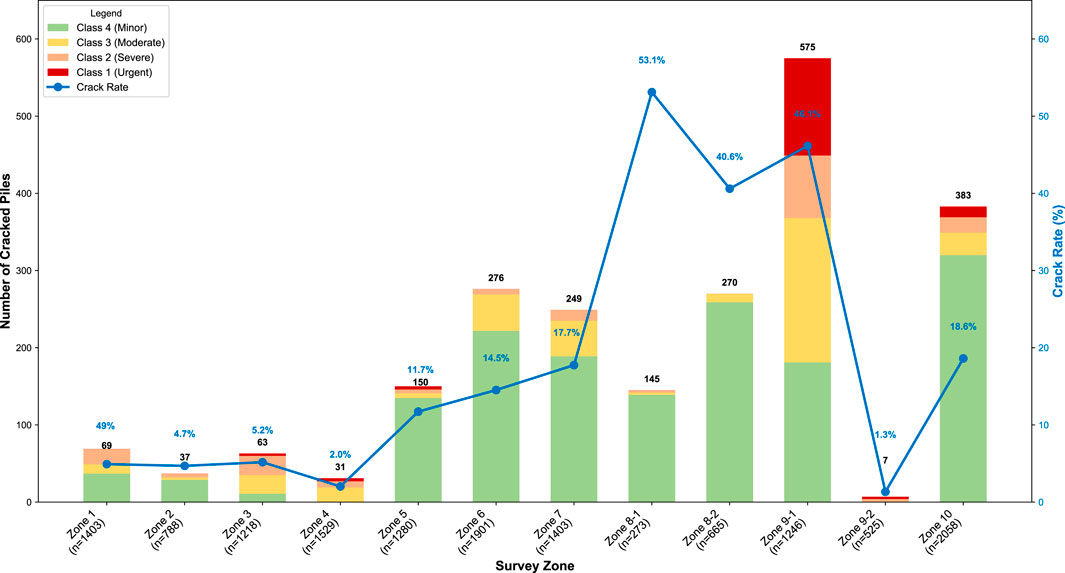
Figure 17. Crack counts and the crack rate on site.
From the statistical results in Figure 17, it is clear that the pile damage is not uniformly distributed but exhibits significant regional clustering, mainly reflected in two aspects: (1) High concentration of severe cracks in terms of quantity: The most severe Class 1 and Class 2 cracks (piles requiring urgent repair or reinforcement, totaling 346) are overwhelmingly concentrated in Zone 9–1 (207 piles), Zone 3 (28 piles), and Zone 10 (34 piles). Zone nine to one, in particular, accounts for 81.8% of all Class 1 cracks (126 piles), making it the most severely damaged area in absolute numbers. (2) Significant differences in crack rates across spatial distribution: As seen from the line chart, some areas exhibit extremely high proportions of damage despite having fewer total piles. The crack rates in Zone eight to one and Zone eight to two reached alarming levels of 53.1% and 40.6% respectively, far exceeding other zones.
A comprehensive analysis indicates that the most severely cracked zones (both in terms of quantity and proportion), namely, Zones 8–1, eight to two, and nine to one, are all “fish-light complementary” zones in the field condition. The sites in these areas are perennially near water, with high surface runoff and groundwater levels. This field data strongly points to a core conclusion: a long-term saturated or near-water external soil environment is a key external factor that exacerbates the frost heave damage of PHC pipe piles. This provides robust field evidence supporting the core mechanism that internal water accumulation is the direct cause of frost heave.
6 Conclusion and disscussion
6.1 Conclusion
This paper conducts a systematic study on the frost heave cracking issue of PHC pipe piles for photovoltaic brackets in cold regions through a combination of experimental, theoretical, and numerical simulation methods, and draws the following main conclusions:
1. Necessary conditions for frost heave cracking: Experimental results indicate that the freezing and expansion of accumulated water inside the pipe pile is a necessary condition for vertical cracking. Even in the absence of obvious initial structural cracks, the pipe pile will still crack under the action of frost heaving. Factors such as initial structural cracks and stress concentrations can promote the development of cracking but are not necessary conditions for it.
2. Influence of frost heave height: The severity of frost heave cracking is directly correlated with the internal water level. A critical water level threshold (identified between 200 mm and 300 mm for samples in this study) exists, below which cracking does not occur. This finding highlights that the frost heave length is a decisive factor in controlling the risk of cracking.
3. Stress distribution and cracking mechanism: The numerical simulation results show that under the frost heave load, the circumferential concrete tensile stress is greatest at the mid-height of the inner wall of the pipe pile, which may be the key factor leading to the longitudinal cracking of the pipe pile. While our elastic analysis shows that stirrups carry minimal stress before concrete fails, the stirrup fracture phenomenon observed in the experiment suggests that significant stress redistribution occurs post-cracking.
4. Influence of Design Parameters on Cracking Threshold: The parametric analysis quantifies the sensitivity of the critical water level to key design and environmental parameters. The critical level is inversely proportional to the magnitude of the frost heave pressure but is directly proportional to the concrete’s tensile strength and the pile’s wall thickness. Notably, increasing the wall thickness was found to be a highly effective measure for raising the cracking threshold, whereas the level of axial prestress had a negligible effect on the pile’s resistance to this specific failure mode.
In conclusion, this research provides a comprehensive explanation for the widespread frost heave cracking observed in the field case study. By integrating on-site damage statistics with laboratory experiments and numerical analysis, the study validates its core findings. The field data confirms that the highest damage rates occur in water-rich environments, directly corroborating the experimental conclusion that the freezing of a sufficient volume of internal water is the definitive condition for failure. The research then provides a quantitative framework for prevention by identifying a critical water level threshold and demonstrating its dependence on key design parameters such as wall thickness and concrete strength. These integrated findings offer a robust scientific basis for engineers to develop targeted design guidelines and effective preventive measures, thereby enhancing the long-term durability and safety of critical infrastructure in cold regions.
6.2 Recommended Preventive Measures
The findings of this research provide an important reference and actionable guidance for engineering practice. The measures concerning design and O&M phases.
6.2.1 Recommendations for the Design Phase
1. Installation of Drainage Holes: It is recommended to install at least two drainage holes in different directions at the base of the pile’s exposed section (e.g., 50–100 mm above ground level). The height of these holes should be below the critical frost heave height. This ensures that the effective frost heave length of any residual water is insufficient to cause damage. A minimum diameter of 20 mm is advised to prevent blockage by debris, silt, or ice.
2. Enhanced Sealing of Pile Tops: To prevent the ingress of rain and snow, an enhanced sealing design for pile tops should be implemented. This includes installing well-sealed pile caps or improving the connection nodes with the foundation cap. The joints between the pile top and the photovoltaic bracket connections should be meticulously filled with a high-elasticity, low-temperature resistant, and anti-aging sealant.
3. Optimization of the Pile’s Internal Structure: This study has shown that stress concentrations promote cracking. Therefore, abrupt geometric changes on the inner wall, such as sudden variations in wall thickness, should be avoided during the design and manufacturing stages of the pipe pile.
6.2.2 Measures for the Construction and O&M Phases
During the construction phase, especially before winter work suspensions or the casting of pile caps, a thorough inspection and cleaning should be performed to remove any accumulated water, ice, snow, or debris from inside the piles. For the operational and maintenance (O&M) phase, a regular inspection should be conducted annually in late autumn to ensure all drainage holes are unobstructed. Debris around the pile tops and drainage holes must be cleared to maintain the effectiveness of the drainage system throughout the winter.
6.3 Limitations and future work
The authors acknowledge several limitations in this study, which also highlight important directions for future research. These are summarized as follows:
1. Gap between Laboratory and Field Conditions: The current findings are derived from controlled laboratory experiments that deliberately isolate the frost heave mechanism. This approach does not account for complex real-world factors such as soil-pile interaction, which can introduce external confining pressures, or cyclic freeze-thaw actions, which may lead to progressive material degradation and fatigue damage not captured in our monotonic freezing tests.
2. Limited Sample Size and Statistical Analysis: The experimental conclusions are based on a small number of specimens for each condition. This limits the statistical power of the findings and the generalizability of quantitative results, such as the precise value of the critical water level. Future research should employ a larger sample size to perform robust statistical analysis (e.g., variance analysis) and to establish confidence intervals for the observed failure thresholds.
3. Simplifications in Modeling and Theoretical Framework: The numerical and theoretical models used in this study involve several idealizations. The FE simulation utilized a linear elastic model, which is effective for identifying crack initiation sites but cannot capture the full post-cracking behavior, such as softening and the stress redistribution that leads to stirrup fracture. Furthermore, the assumption of a uniform frost heave pressure does not account for asymmetrical real-world thermal conditions. Similarly, the analytical framework relied on the classical thick-walled cylinder theory, a strength-based approach that cannot model crack propagation from the pre-existing flaws inherent in concrete. Future modeling efforts should employ more advanced nonlinear and fracture mechanics-based approaches (e.g., using Concrete Damage Plasticity and calculating
Data availability statement
The original contributions presented in the study are included in the article/supplementary material, further inquiries can be directed to the corresponding author.
Author contributions
XY: Data curation, Writing – review and editing. FZ: Project administration, Writing – original draft. JW: Resources, Writing – review and editing. MJ: Investigation, Methodology, Software, Validation, Writing – original draft. GL: Supervision, Writing – review and editing. JX: Conceptualization, Funding acquisition, Project administration, Supervision, Writing – review and editing.
Funding
The author(s) declare that financial support was received for the research and/or publication of this article. This research was funded by the Project of Research on the Mechanism and Prevention Measures of Cracks in Photovoltaic PHC Pile Foundations in Cold Regions (2024GKF-0847) and 111 Project (B20039).
Conflict of interest
Authors XY, FZ, and JW were employed by Shandong Electric Power Engineering Consulting Institute Corp., Ltd.
The remaining authors declare that the research was conducted in the absence of any commercial or financial relationships that could be construed as a potential conflict of interest.
The author(s) declared that they were an editorial board member of Frontiers, at the time of submission. This had no impact on the peer review process and the final decision.
Generative AI statement
The author(s) declare that no Generative AI was used in the creation of this manuscript.
Any alternative text (alt text) provided alongside figures in this article has been generated by Frontiers with the support of artificial intelligence and reasonable efforts have been made to ensure accuracy, including review by the authors wherever possible. If you identify any issues, please contact us.
Publisher’s note
All claims expressed in this article are solely those of the authors and do not necessarily represent those of their affiliated organizations, or those of the publisher, the editors and the reviewers. Any product that may be evaluated in this article, or claim that may be made by its manufacturer, is not guaranteed or endorsed by the publisher.
References
ACI Committee 306 (2016). Guide to cold weather concreting (ACI 306R-16). Farmington Hills, MI: American Concrete Institute.
Al-Jeznawi, D., Sadik, L., Alzabeebee, S., Al-Janabi, M. A. Q., and Keawsawasvong, S. (2025). Novel explicit models for assessing the frictional resistance of pipe piles subjected to seismic effects. J. Saf. Sci. Resil. 6, 29–37. doi:10.1016/j.jnlssr.2024.06.010
Ashkinadze, K. (2012). “Limit states design of pile foundations in clay under combined action of transient uplift loads and frost jacking,” in Geo-Risk 2011: Risk Assessment and Management, 656–663. doi:10.1061/41183(418)66
ASTM C666/C666M-15 (2015). Standard test method for resistance of concrete to rapid freezing and thawing. doi:10.1520/C0666_C0666M-15
Boyd, A., and Leone, A. (2019). Effect of freeze-thaw cycling on fatigue behaviour in concrete. IOP Conf. Ser. Mater. Sci. Eng. 652, 012028. doi:10.1088/1757-899X/652/1/012028
Darmawan, M. F., Fajar, A. S., Satyarno, I., Awaludin, A., and Yogatama, B. A. (2022). “Seismic performance comparison of pile supported slab viaduct with PHC pile and RC bored pile in south part of Java island,” in Proceedings of the 5th international conference on sustainable civil engineering structures and construction materials. Editors S. Belayutham, C. K. I. Che Ibrahim, A. Alisibramulisi, H. Mansor, and M. Billah (Singapore: Springer Nature Singapore), 719–734.
Dourado, J., Deng, L., Chen, Y., and Chui, Y.-H. (2024). Foundations in permafrost of northern Canada: review of geotechnical considerations in current practice and design examples. Geotechnics 4, 285–308. doi:10.3390/geotechnics4010015
Feng, S.-J., Xi, W., Zhang, X.-L., and Sun, D.-M. (2024). Experimental and numerical investigations on the mechanical response of full-scale PHC pile foundations for solar power generation. Acta Geotech. 19, 5293–5314. doi:10.1007/s11440-024-02257-4
Grandmont, K., and Fortier, D. (2013). Geocryolab - cold regions geomorphology and geotechnical laboratory - studying cold regions dynamics and their impact on northern infrastructure. doi:10.13140/2.1.4578.5927
Janssens, K., Feng, C., Marincioni, V., and Bossche, N. V. D. (2024). Comparison of different frost models with hygrothermal simulations to better understand frost damage in porous building materials. Build. Environ. 255, 111399. doi:10.1016/j.buildenv.2024.111399
Jia, Y., Kong, X., Qian, Y., Yu, D., Cao, T., Wu, L., et al. (2021). Influence of cracks on the mechanical properties of phc pipe piles of water surface photovoltaic supports in cold regions. China Offshore Platf. 36, 84–88. doi:10.12226/j.issn.1001-4500.2021.01.20200615
Jia, Z., Wu, H., He, S., Zhao, Q., and Zhang, X. (2024). Study of the pore water pressure development characteristics of phc pipe piles in soft soil foundations. Buildings 14, 1976. doi:10.3390/buildings14071976
Kong, X., Qian, Y., Jia, Y., Cao, T., Yu, D., Wu, L., et al. (2021). Cracking mechanism of phc pipe piles for floating photovoltaic supports in cold regions. Build. Struct. 51, 2081–2086.
Li, C., and Li, X. (2023). Evaluation of bearing capacity of phc pipe piles via the dynamic and static loading test. Front. Earth Sci. 11, 1130294–1132023. doi:10.3389/feart.2023.1130294
Li, X., Zhang, J., Xu, H., Shi, Z., and Gao, Q. (2021). Static load test and numerical analysis of influencing factors of the ultimate bearing capacity of PHC pipe piles in multilayer soil. Sustainability 13, 13166. doi:10.3390/su132313166
Liu, X., Xiao, Y., Zhou, J., Ge, L., and Song, Z. (2023). Research on dynamic pile-driving formula parameters and driving feasibility of extra-long phc pipe piles. Buildings 13, 1302. doi:10.3390/buildings13051302
Liu, Y., Guo, Z., He, W., Ge, X., Wang, J., and Zhao, J. (2024). Bearing performance of prestressed high-strength concrete pipe pile cap connections under truncated pile conditions. Buildings 14, 1430. doi:10.3390/buildings14051430
Miller, H., Cabral, S., Peabody, D., Steven, C., Eaton, R., and Richard, B. (2015). “Solar effects on frost-thaw patterns at two adjacent roadway test sections: case study,” in Cold regions engineering 2015, 193–204. doi:10.1061/9780784479315.018
Oktiovan, Y., Otaki, T., Obara, T., Kono, S., Asai, Y., Kobayashi, K., et al. (2021). Analysis on shear failure of phc piles under different levels of axial load ratios
Pakkala, T., Lindman, N., and Lahdensivu, J. (2025). Assessing climate change effects on freeze-thaw exposure of concrete structures. Nordic Concr. Res. 72, 153–165. doi:10.2478/ncr-2025-0005
Qi, G. (2024). Study on the freezing resistance and repair technology of prestressed high-strength concrete pipe piles. J. Phys. Conf. Ser. 2713, 012041. doi:10.1088/1742-6596/2713/1/012041
Tan, Y., Wang, D., Wang, Y., Jin, X., and Zhao, C. (2022). Analysis and treatment of crack causes in phc pipe piles for photovoltaic supports. J. Wuhan Univ. Eng. Ed. 55, 142–146.
Wang, X. (2020). Investigation and analysis of cracks in prestressed pipe pile foundations of photovoltaic supports. Build. Mater. Decor. 44, 47.
Yao, Y., Hong, B., Liu, X., Wang, G., Shao, Z., and Sun, D. (2023). Field and numerical study of the bearing capacity of pre-stressed high-strength concrete (phc)-pipe-pile-reinforced soft soil foundations with tie beams. Appl. Sci. 13, 11786. doi:10.3390/app132111786
Keywords: PHC pipe pile, concrete cracking, frost heave, cold regions, photovoltaic foundation
Citation: Yin X, Zhang F, Wu J, Jia M, Lacidogna G and Xu J (2025) Experimental and numerical analysis on frost heave cracking of prestressed high-strength concrete (PHC) pipe piles in cold regions. Front. Mater. 12:1670409. doi: 10.3389/fmats.2025.1670409
Received: 21 July 2025; Accepted: 26 August 2025;
Published: 10 September 2025.
Edited by:
Mijia Yang, North Dakota State University, United StatesReviewed by:
Amir Ali Shahmansouri, Washington State University, United StatesAbdalrhman Milad, University of Nizwa, Oman
Copyright © 2025 Yin, Zhang, Wu, Jia, Lacidogna and Xu. This is an open-access article distributed under the terms of the Creative Commons Attribution License (CC BY). The use, distribution or reproduction in other forums is permitted, provided the original author(s) and the copyright owner(s) are credited and that the original publication in this journal is cited, in accordance with accepted academic practice. No use, distribution or reproduction is permitted which does not comply with these terms.
*Correspondence: Jie Xu, anh1QHRqdS5lZHUuY24=