 Shijun Huang1
 Chenyi Zhao
- 1Construction Branch of State Gird Jiangsu Electric Power Co. Ltd, Nanjing, China
- 2Civil Engineering School, Southeast University, Nanjing, China
Concrete-filled steel tube (CFST) columns are widely applied in long-span bridges due to their high strength, ductility, and construction efficiency. However, in large-diameter CFST members, early-age hydration heat may induce excessive temperature rise and thermal cracking, threatening structural integrity. This study integrates in-situ measurements, multi-field finite element (FE) modeling, and Long Short-Term Memory (LSTM) neural networks to predict thermal behavior of CFST members. Two full-scale columns (2.1 m diameter) and several scaled specimens were tested to record hydration-induced temperature and strain evolution. A chemo-thermal-mechanical coupled FE model was developed and validated against experimental results. Parametric studies revealed the influence of water-to-cement ratio, cement dosage, hydration heat release, and CFST diameter on core temperature evolution. Furthermore, an LSTM network trained on FE-simulated datasets accurately predicted both temperature history and maximum core temperatures, with 99.4% of predictions within 5% relative error. Compared with existing FE–AI hybrid approaches, the novelty of this study lies in the large-diameter CFST range (>2 m), the explicit coupling of chemo-thermal-mechanical fields, and the systematic parameterization of the LSTM training database. The proposed framework provides a reliable and efficient tool for design optimization and risk mitigation in large-scale bridge engineering.
1 Introduction
The inherent advantages, such as high strength, good ductility, and ease of construction, etc. (Li and Li, 2024). have promoted the application of concrete-filled steel tube (CFST) members in megastructures. Up to date, CFST hybrid arch bridges are regarded as an optimal solution for large-span bridge construction, of which the main span can easily exceed 500 m.
Since the 1990s, more than 500 CFST arch bridges has been constructed in China (see Table 1). Typically, the construction of Pingnan Third Bridge with a main span of 575 m was completed in 2020, becoming the largest span arch bridge through the world at that time (Zheng et al., 2022). To achieve the requirements of structural load-bearing capacity of arch bridges, the diameter of the arch rib section must also increase with their span length increasing, leading to the hydration temperature issues of the CFST arch ribs (DAI, 2022).
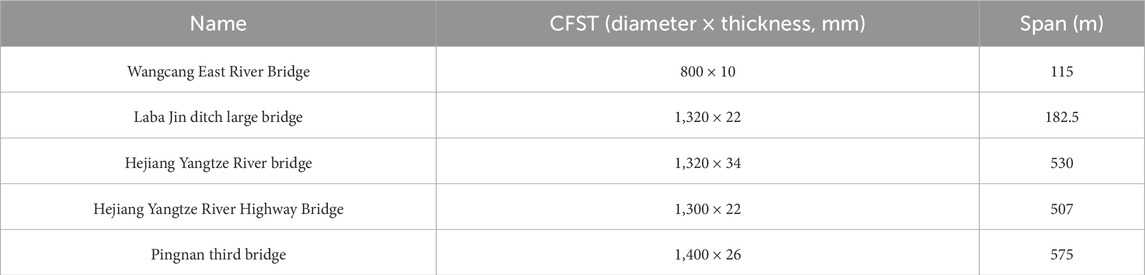
Table 1. Application of CFST in long span bridge.
Generally, excessive hydration heat of concrete in early age will cause expansion and shrinkage after casting (Cai et al., 2023), which may lead to the separation of concrete from the steel tube and degradation of the synergy between them. Moreover, an increase in hydration heat can lead to excessive initial thermal stress (Zhang et al., 2023), which affects the structural safety of CFST members to some extent. Currently, many experts and scholars have focused on the research of the cracking behavior of concrete in CFST members caused by hydration heat. Zhou et al. (2022). Investigated the distribution and evolution law of temperature field during bridge operation of CFST arch bridges. Based on the principle of heat transfer theory and the finite element method, Sun et al. (Cavacece, 2025). proposed a calculation method for the temperature field of the arch rib section of a CFST arch bridge. Shi et al. (2020). Evaluated the hydration-temperature field of no shrinkage concrete in large-diameter CFST arch ribs. An equation was experimentally proposed to predict the heat of hydration at all locations in CFST of different diameters. Xiao et al. (2023). Studied the calculation method of the stress concentration factor for CFST circular hollow section by establishing finite element models with 36 different geometric parameters. Sun and Xie. (2019). Studied the hydration temperature changes of pumped concrete in large-diameter CFST components and its influence on mechanical properties such as concrete strength and elastic modulus. Xie et al. (2022). Established a hydration heat conduction model to study the temperature field of CFST components, and studied the temperature stress changes of CFST during the hydration heat release process by considering the early concrete creep through numerical methods. From the above research, it can be seen that hydration reaction will cause a sharp increase in the internal concrete temperature of CFST members, and hydration heat is the main cause of early-age concrete cracking in CFST members. However, there is little research on the early behavior of large-sized CFST components with diameters exceeding 1.5 m, and there is also a lack of research on the relationship between CFST diameter, hydration heat temperature, and concrete cracking. In addition, there is a lack of research on CFST numerical simulation considering multi-field coupling, especially the coupling of concrete hydration heat, temperature field, and force field.
In essence, in-situ measurement and finite element (FE) analysis are two kinds of conventional approaches on the investigation of structural behavior. With regard to the prediction on the hydration heat temperature and strain evolution of large-diameter CFST members, traditional finite element modeling method is inefficient and its accuracy is dependent on the quality of the corresponding FE models. To date, with the rapid development of computer technology and artificial intelligence, machine-learning approaches has gained increasing attention due to the great performance on computational effort and been widely used on the analysis of structures. Duan et al. (2022). Accurately reflected the relationship between strain and acceleration and bridge displacement using long short-term memory (LSTM) networks. Huang et al. (2024). proposed a seasonally independent nonlinear model for predicting temperature and displacement of rigid frame bridges based on LSTM networks. In order to reduce the cost of fast and slow cycle experiments, Yazdanpanah et al. (Yazda et al., 2023). Used LSTM to predict the relationship between forces and deformations of the bridge and verified the high correlation between the predicted and measured values. The main girders of cable-stayed bridges produce large deflections under the influence of temperature, Yue et al. (2022). The parameters of the LSTM network were optimized to establish a temperature-deflection regression model with both accuracy and stability. Doroudi et al. (2024). Used LSTM to predict the structural damage of large span bridges, and the optimized and adjusted model became an effective bridge damage assessment method.
In this study, the objective is to propose a new kind of machine-learning method on the prediction of hydration heat temperature of CFST columns. Firstly, the temperature field of CFST columns with different diameters (0.2 m–2.1 m) was tested. Afterwards, the chemo-thermo-mechanical coupled model of CFST members was studied and implemented to establish the refined FE models of the tested columns based on the ABAQUS software. Furthermore, the LSTM neural networks was used as an effective method to predict the temperature field of CFST columns.
2 Long Short-Term Memory (LSTM)
Conventional artificial neural networks (ANNs) are a nonlinear data modeling technique inspired by the imitation of biological neural networks for processing various types of information. Generally, ANNs consist of three components: the input layer, the output layer, and hidden layers. Input parameters will be transmitted and analyzed through neurons, and ultimately a nonlinear result will be outputted through weighted connections, as Equation 1.
where x is vector for the input signals; W and b are the weights of the connections and biases, respectively; and
The limitations of conventional neural networks are also evident: while they can analyse relatively independent neurons, they struggle with problems that require dependency on previously input information. This is where recurrent neural networks (RNNs) come into play. In RNNs, neurons at a certain time t simultaneously receive the output from time t-1 and the current input
However, recurrent neural networks (RNNs) also have certain limitations. As dependence on information increases and the distance between prediction points expands, the issue of gradient vanishing tends to occur. Hence, there arises a need to utilize Long Short-Term Memory (LSTM) architecture to address this issue. The LSTM model comprises three distinct gates: the input gate
and
where
3 In-situ measurements and multi-field numerical modeling
3.1 Experimental set-up and data recording
Two full-scale CFST column with a diameter of 2.1 m adopted in the construction of large-span arch bridges was taken for evaluation. The 2.1-m-diameter full-scale CFST columns were tested on-site to investigate the relationship between its dimensions during hydration and concrete temperature and cracking behavior (see Figure 1). Temperature variations and strain values during hydration were recorded through the test. In addition, eight scaled-down CFST specimens, each 0.6 m in height and made of the same material as the test specimen, were fabricated, with diameters ranging from 0.2 m to 1.2 m, as shown in Figure 2. The dimensions and main materials of each specimen are summarized in Table 2.
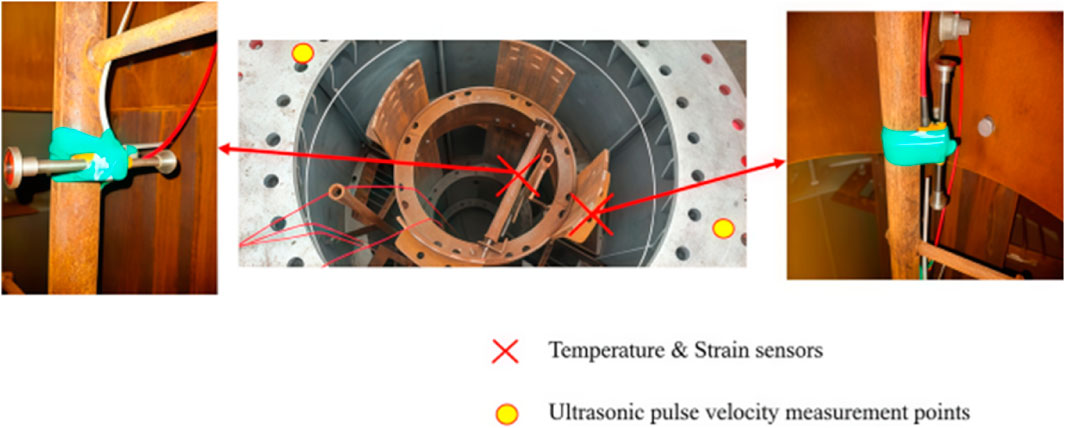
Figure 1. Instrument layout in 2.1 m-dia. CFST column.
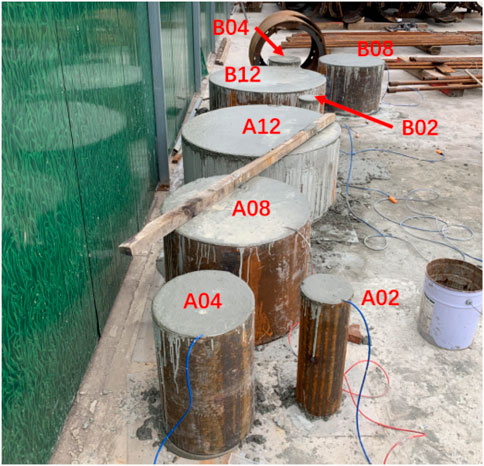
Figure 2. CFST Specimens.
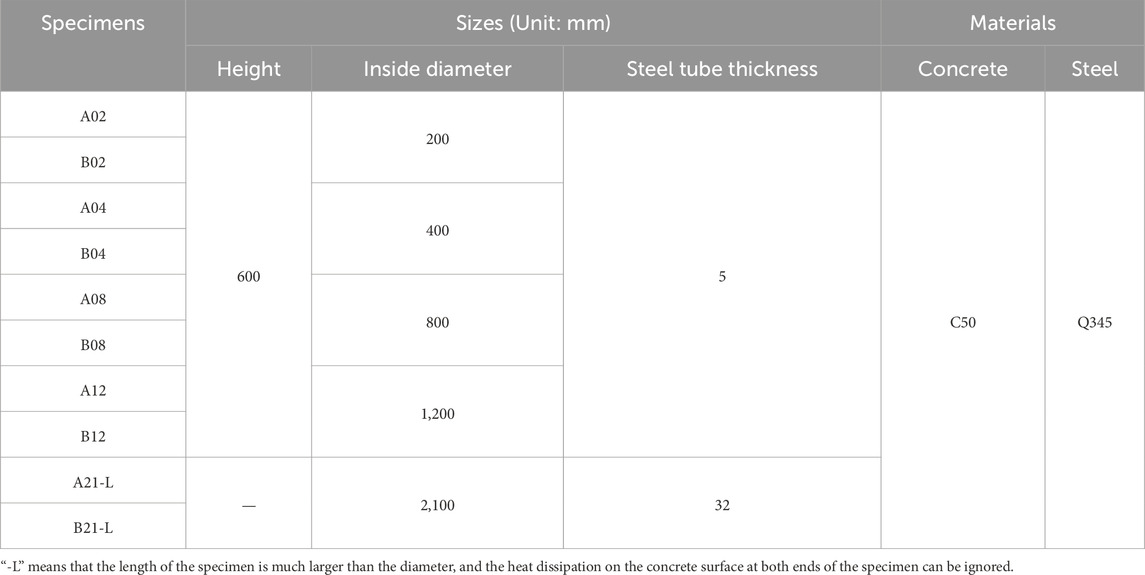
Table 2. Details of CFST specimens.
The experiment utilized self-consolidating concrete (SCC) with a strength grade of C50, with average cube compressive strengths of 53.6 MPa at 7 days and 62.5 MPa at 28 days. To capture temperature and strain variations as well as internal cracking, strain gauges with an accuracy of 1 were embedded in the specimens. Additionally, a temperature sensor with an accuracy of 0.2 °C was attached to the strain gauges. The sensors were placed 4.5 m below the joint to prevent edge effects, as shown in Figure 1.
3.2 Coupling chemo-thermal-mechanical model
The basic computational framework is roughly as follows: concrete hydration reaction releases heat (chemical field), which generates and transfers heat, leading to the rising heat and temperature differences (temperature field) of concrete. The temperature difference, together with the confinement from the steel tube, leads to the generation of thermal stress (mechanical field), as illustrated in Figure 3.
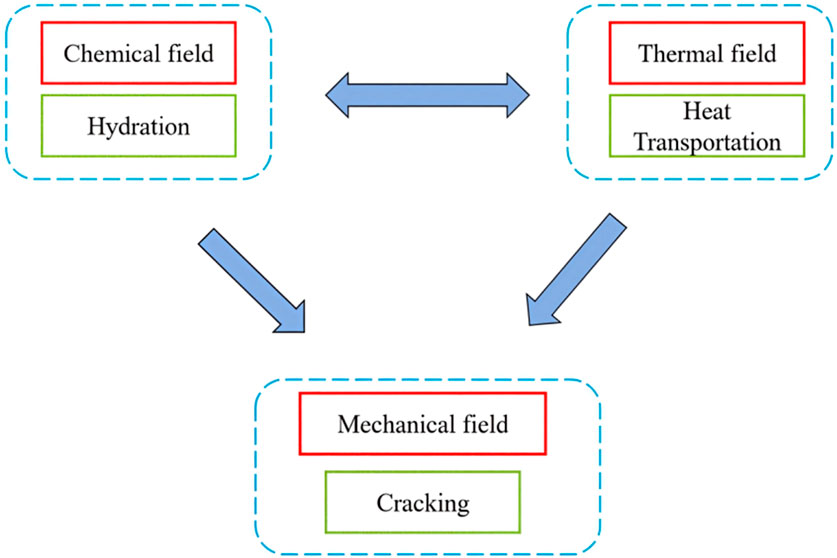
Figure 3. Illustration of “chemo-thermal-mechanical” fields of concrete.
3.2.1 Subsubsection
The heat release from concrete hydration is influenced by its mix proportion and degree of hydration. Therein, the hydration (Jia et al., 2024) degree of concrete can be calculated as Equation 9 (Sun et al., 2025):
where
where
Furthermore, the equivalent age
where
3.2.2 Thermal field
The hydration process of massive concrete will release a large amount of heat, leading to heat transfer. Through the heat transfer, the thermodynamic equilibrium requires that the heat absorbed equals the sum of the net external input heat and the heat of hydration, as Equation 12:
where
where
The thermal conductivity of concrete is calculated by the following Equation 14 (Dehwah and Yunping, 2025):
where
3.2.3 Mechanical field
The mechanical field adopted in the proposed approach employs the principle of small strain superposition, with the total strain tensor
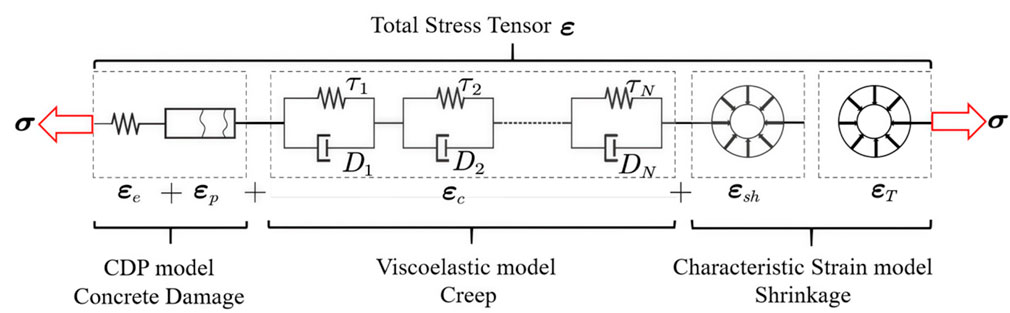
Figure 4. Illustration of strain superposition principle.
In addition, the plasticity and ductility of concrete after cracking
When using the CDP model to analyze the time-dependent damage of concrete, the stress tensor can be expressed as Equation 16:
where
Usually, the early mechanical properties of concrete are influenced by the hydration degree
where
In order to facilitate the use of finite element software for concrete creep analysis, the Kevin chain element is used to compute the creep, which can be shown as Equation 18 (Schindler, 2002):
where
To facilitate implementation in FE software, the creep compliance is often expressed by a Kelvin chain model, as shown in Equation 19. In this equation,
The self-shrinkage strain of concrete is related to the degree of hydration as Equation 20 (Li, 2020):
where
Moreover, it is assumed that the thermal strain rate and temperature change of concrete satisfy the linear assumption, which is presented as Equation 21:
where
3.3 Numerical simulation
After complex derivation of the coupling chemo-thermal-mechanical model, the refined finite element (FE) models of CFST specimens were established using the ABAQUS software, as shown in Figure 5. The CDP model in ABAQUS was used to describe the ductile behavior of concrete, with an expansion angle of 38°, a viscosity coefficient of 0.01, and default values for the remaining parameters (Ministry of Housing and Urban-Rural Development of the People’s Republic of China MOHURD, 2010; Bažant and Jirásek, 2018). Relevant parameters are summarized in Tables 3, 4.
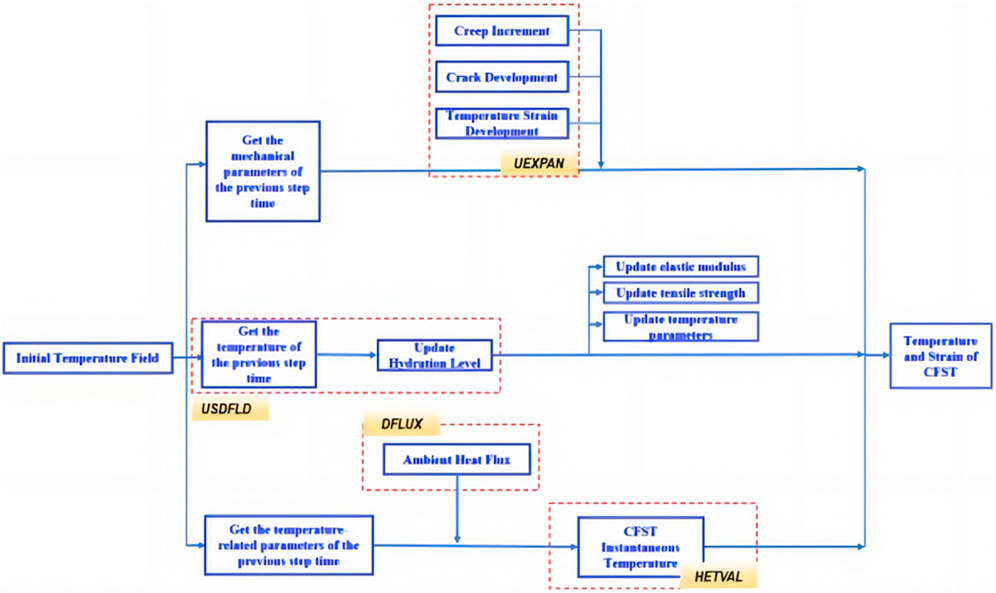
Figure 5. Implementation of proposed numerical model in Abaqus/Standard.
Table 3. Values of material parameters.
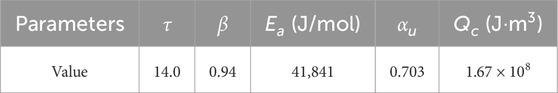
Table 4. Values of concrete hydration parameters.
In the modeling process, appropriate simplifications of initial conditions and boundary conditions were made to obtain an accurate and effective numerical solution. The boundary conditions of the CFST specimens consist of two parts: steel (C1) and concrete (C2), as shown in Figure 6.
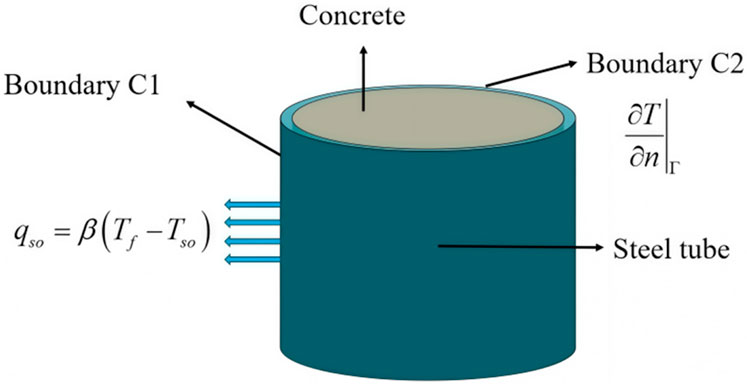
Figure 6. Temperature boundary conditions of CFST specimens.
The initial temperature fields of the steel tube and concrete at (t = 0) should satisfy the Equation 22:
Boundary C1: The temperature difference between the steel pipe surface and the ambient temperature results in heat convection, and their relationship is as Equation 23 (Sun and Xie, 2019):
In the equation,
In the equation,
Boundary C2: For larger-sized CFST specimens (A21-L and B21-L), the end of the CFST is considered an adiabatic boundary, i.e. Equation 25:
where n represents the normal vector of the boundary.
The measured temperature changes of the scaled CFST specimens and the simulation results are shown in Figure 7. It can be observed that approximately 5.9 h after the concrete pouring, the peak temperatures of specimens A02 and B02 were 43.6 °C and 42.7 °C, respectively; the peak temperatures of specimens A04 and B04 were 62.8 °C and 64.2 °C, respectively; the peak temperatures of specimens A08 and B08 were 79.9 °C and 76.2 °C, respectively; and the peak temperatures of specimens A12 and B12 were 85.5 °C and 77.7 °C, respectively. For CFST specimens with a diameter exceeding 0.8m, the peak temperatures were higher, indicating significant heat exchange between the concrete and the external steel surface. After 20 h of pouring, the temperature gradually decreased and eventually approached the ambient temperature. The core temperature of CFST specimens with smaller diameters (<0.4 m) was significantly affected by the ambient temperature.
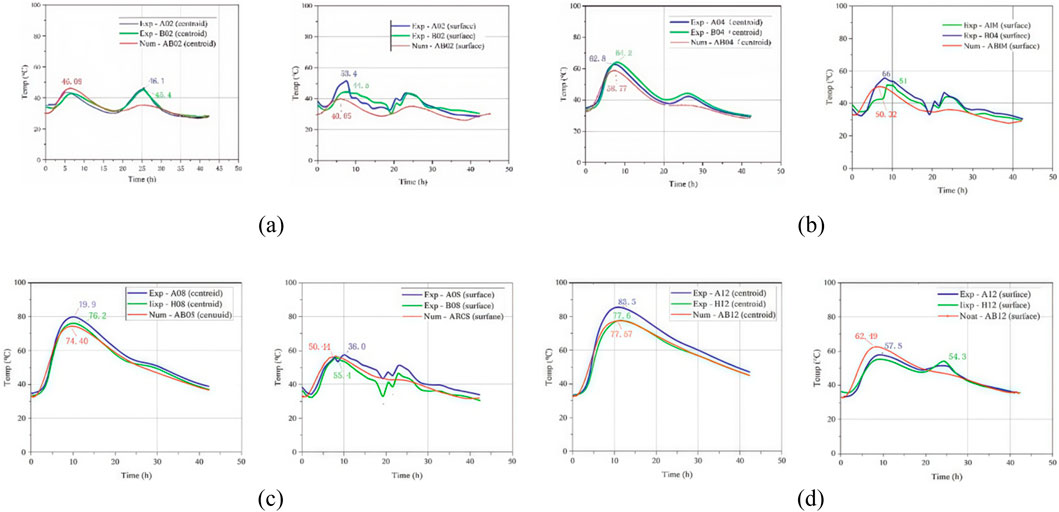
Figure 7. Surface and core concrete temperatures of scaled CFST specimens. (a) Specimens A02 and B02. (b) Specimens A04 and B04. (c) Specimens A08 and B08. (d) Specimens A12 and B12.
4 Temperature prediction based on LSTM network
To more effectively and efficiently train the LSTM neural network, this study has established the overall computational framework of the LSTM prediction model, which is presented in Figure 8. The framework consists of five functional modules, including (1) input layer; (2) hidden layer; (3) output layer; (4) network training, and (5) network prediction. The input layer is responsible for normalizing the raw data to achieve the network’s input requirements, and the hidden layer uses LSTM cells to build a single-layer recurrent neural network. The output layer provides the prediction results, and network training uses the Adam optimization algorithm to realize the network prediction.
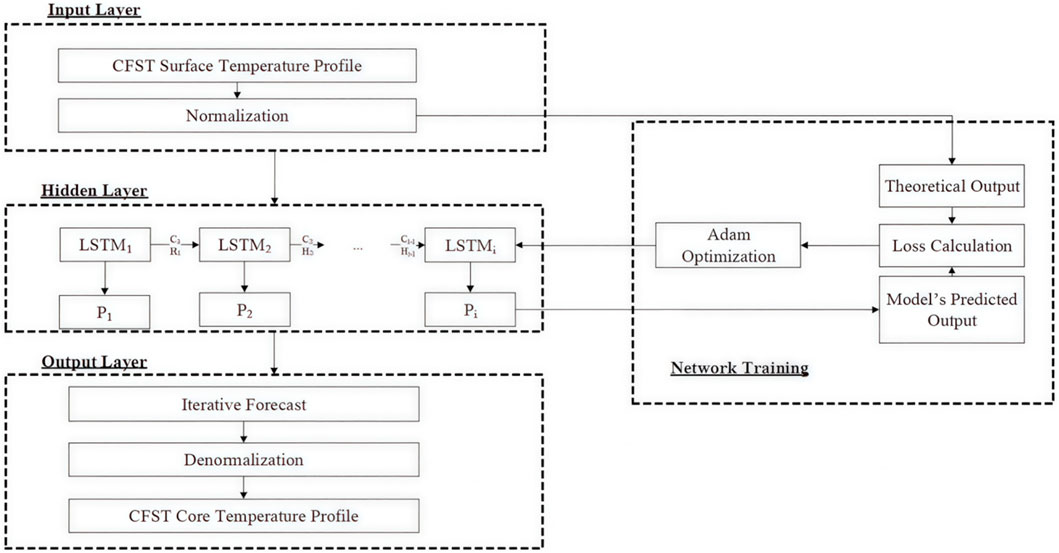
Figure 8. Framework of the LSTM prediction model.
4.1 Data generation and database construction
To study the impact of w/c, cement dosage, heat release of cement, and outside diameter of members on the maximum temperature of concrete in the core area of CFST during casting, 500 sets of input data were generated considering the above 4 parameters using the Monte Carlo sampling method within their respective value ranges, assuming that the parameters are independent with each other. The ranges of the parameters are listed in Table 5.
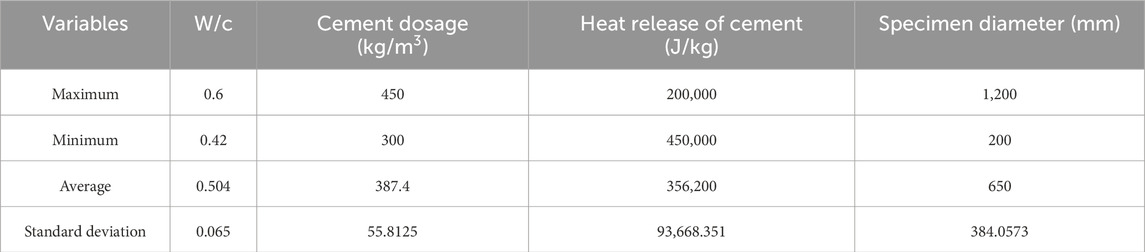
Table 5. Investigated ranges of input parameters.
For each set of input parameters, temperature variation curves of the core and surface of CFST members were calculated based on refined finite element (FE) models that consider coupled chemo-thermal-mechanical fields. After obtaining the initial output dataset, to ensure the accuracy of the training, it is necessary to standardize the initial data using Z-score normalization, which is a linear transformation method used to map the original data to a standard normal distribution. The standardization calculation method is presented as Equation 26:
where X is the standardized data, x is the original data, μ is the arithmetic mean of the data, and σ is the standard deviation of the data. In this way, all data are distributed around a mean of 0 and a standard deviation of 1, resulting in data with zero mean and unit standard deviation.
4.2 Establishment of LSTM neural network
The adopted LSTM neural network in this study was established using MATLAB 2022b. The hyperparameters were determined through a trial-and-error procedure, in which different numbers of hidden units (100–300), dropout rates (0.2–0.6), batch sizes (50–200), and epochs (1,000–3,000) were tested. The final configuration (200 hidden units, dropout = 0.5, batch size = 125, and 2000 epochs) provided the best compromise between prediction accuracy and computational cost. The dataset consisting of 500 generated samples was randomly divided into 70% training, 15% validation, and 15% testing subsets. Moreover, the parameters of hidden layers and options of the constructed LSTM network were listed in Table 6.
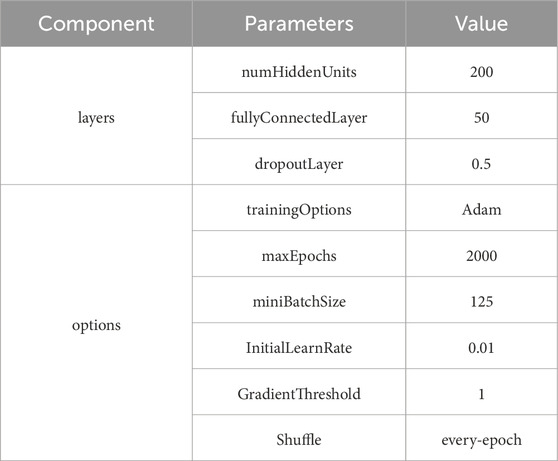
Table 6. Architecture of the LSTM.
4.3 Results and discussion
This section presents the results of LSTM predictions compared with experimental data, followed by a discussion of their implications. Figure 9 shows the prediction results of the core concrete temperature curves of four CFST columns with different diameters. For each group, only the diameter varied while the other parameters remained the same. The results demonstrate that the established LSTM model closely matches the measured data, successfully capturing both the peak temperature and the overall trend of temperature evolution.
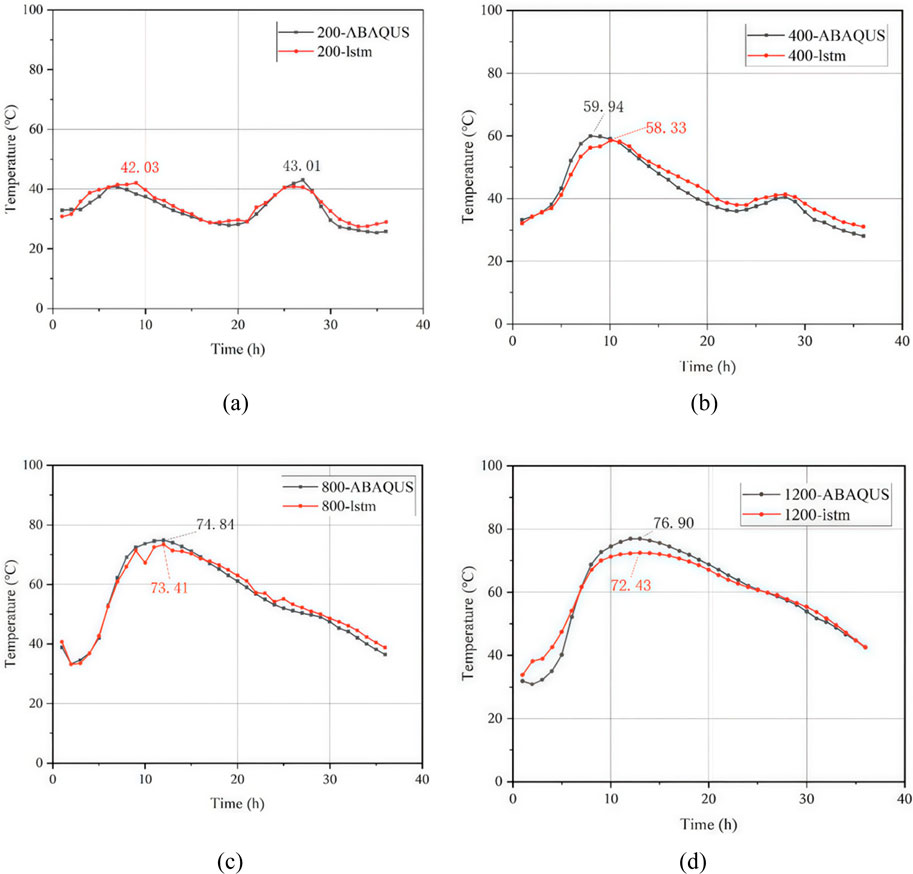
Figure 9. Surface and core concrete temperatures of scaled CFST specimens. (a) 200. (b) 400mm (c) 800mm (d) 1200mm.
For smaller CFST specimens (diameters
Considering that the maximum core temperature of CFST columns plays a significant role in practical engineering, thus the maximum temperature predicted by LSTM was also investigated and the results are shown in Figure 10. Figure 10 shows the distribution of relative errors in the maximum temperature prediction for 500 sets of data. It can be observed that 99.4% of the data exhibit a relative error within 5%, and all maximum temperature relative errors remain below 5.5%. The computational error is acceptable, and can demonstrate the efficiency and accuracy of the established LSTM model in this study. The model demonstrates notable accuracy, particularly in forecasting the maximum temperature of the core concrete in the CFST members after casting, indicating its potential to streamline and enhance temperature prediction in CFST structures, thereby offering practical benefits to engineering applications.
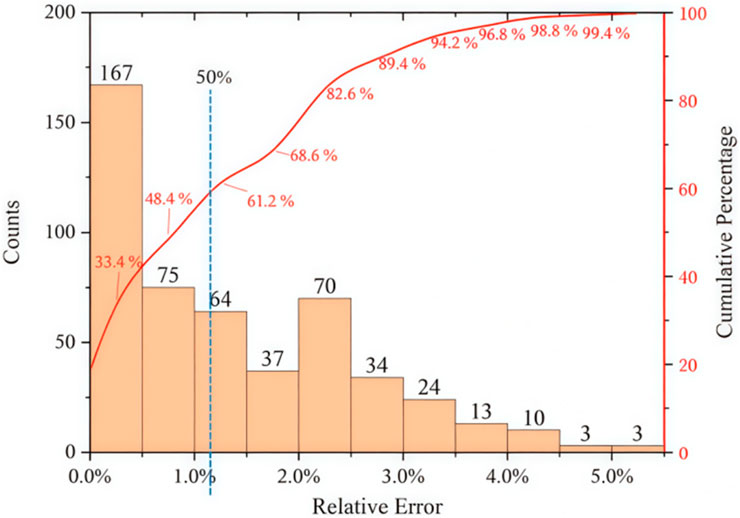
Figure 10. Histogram of relative errors.
To further validate the reliability of the established LSTM model, 16 sets of randomly generated parameters within the specified range were adopted. The numerical simulation results using ABAQUS were compared with the predicted results adopting LSTM model. The results of the 16 test cases are shown in Figure 11. Assuming that the numerical simulation results are accurate enough to satisfy the practical engineering based on the validated FE models, it can be seen that the precision of the predicted maximum temperature using the LSTM model will also achieve engineering requirements.
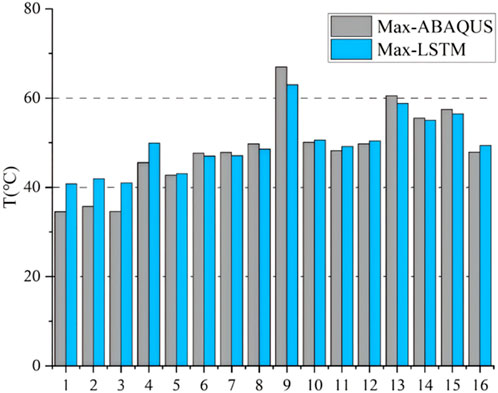
Figure 11. Verification set results.
Compared with previous studies on CFST thermal analysis (Sun et al., 2019; Xie et al., 2022), which relied solely on finite element simulations, the present study provides an additional data-driven approach capable of rapid and accurate prediction. The ability of the LSTM model to capture both the overall trend and local variations highlights its value as a complementary tool to FE simulations.
From an engineering perspective, the results imply that LSTM models can be effectively integrated into real-time monitoring and decision-making systems during the construction of large CFST bridge members. The rapid prediction of peak temperatures is particularly beneficial for preventing early-age cracking and ensuring long-term durability.
5 Conclusion
CFST components have been increasingly adopted in the construction of large-span arch bridges. The early hydration heat of massive concrete after casting will affect the structural performance and durability of CFST members. Therefore, this research has investigated the temperature variance of two full-scale CFST specimens and several scaled specimens with different diameters experimentally. Besides, a multiple coupling chemo-thermal-mechanical model was developed to describe the constitutive behavior of CFST members under the impact of hydration heat. In addition, the multiple coupling model can be implemented in the refined FE model to simulate the hydration process and calculate the response of CFST members. Considering the computational efficiency and model dependent of conventional FE methods, a more efficient approach was further proposed to predict the temperature variance curve and the maximum temperature of core concrete of CFST members based on the LSTM neural network model. The conclusions can be drawn as follows.
1. With the increase of diameter of CFST columns, the hydration degree and peak temperature of the concrete in the core area will increase. The increase in ambient temperature will accelerate the hydration process of CFST members, further accelerating the early hydration heat reaction of concrete.
2. The temperature variance of the core concrete of CFST members calculated by the refined FE models based on multiple coupling chemo-thermal-mechanical model can achieve great agreement with the in-situ measured temperature data.
3. The temperature field of full-scale CFST members is significantly affected by hydration heat. In the early stage, the temperature at the centroid and the outer surface of concrete increases rapidly due to the hydration heat, which may lead to concrete cracking.
4. For the scaled CFST members, the influence of ambient temperature of concrete is more pronounced if the diameter of the members is below 0.4 m. When the diameter exceeds 0.8 m, the heat release during early-age concrete hydration becomes notably significant. In addition, heat exchange resulting from boundary conditions at both ends of Concrete-filled steel tube (CFST) members significantly influences the crack propagation of the core concrete.
5. By combining refined FE modeling with LSTM neural network prediction, the core concrete temperature of CFST members can be predicted effectively using LSTM model. The established LSTM model can provide a convenient and efficient approach for evaluating the temperature and mechanical behavior of the core concrete in CFST members.
6. The LSTM model proposed in this study provides a reliable tool for predicting the hydration temperature of CFST members in large-span bridge construction. It can be integrated into real-time monitoring systems to optimize temperature control during the curing process. This approach helps mitigate the risk of early-age thermal cracking, ensuring better structural integrity and longevity.
Although the proposed multi-field FE model and LSTM predictions show strong agreement with experimental results, several limitations must be acknowledged. First, measurement uncertainty arises from sensor accuracy (±0.2 °C) and potential errors in sensor installation, which may locally affect the recorded temperature. Second, scaling effects exist between laboratory specimens (0.2–1.2 m in diameter) and full-scale CFST members (2.1 m in diameter); smaller specimens may dissipate heat more rapidly than larger ones. Third, in the FE simulations, boundary conditions were simplified by assuming adiabatic behavior at the specimen ends and using empirical convective coefficients, which may not perfectly represent real field conditions. Finally, variability in material properties, such as cement composition and hydration kinetics, introduces additional uncertainty. These factors may partly explain the small discrepancies observed between experiments and predictions. Nonetheless, the consistency across different validation methods (Figures 9–11) suggests that the proposed framework remains reliable for engineering applications, provided that these limitations are carefully considered.
Future studies should focus on expanding the LSTM framework to include strain and crack predictions, integrating real-time monitoring data, and applying the model to extreme environmental conditions to further enhance its practical application in CFST bridge construction.
Data availability statement
The original contributions presented in the study are included in the article/supplementary material, further inquiries can be directed to the corresponding author.
Author contributions
SH: Conceptualization, Data curation, Formal Analysis, Investigation, Writing – original draft, Writing – review and editing. ZL: Conceptualization, Data curation, Formal Analysis, Methodology, Writing – original draft, Writing – review and editing. XL: Data curation, Formal Analysis, Resources, Validation, Writing – original draft, Writing – review and editing. ZW: Formal Analysis, Resources, Software, Supervision, Writing – original draft, Writing – review and editing. CZ: Formal Analysis, Methodology, Validation, Writing – original draft, Writing – review and editing.
Funding
The author(s) declare that financial support was received for the research and/or publication of this article. This work was funded by Technical Consulting Project of the Construction Branch of State Grid Jiangsu Electric Power Co., Ltd (No. SGJSJSOOXMJS2500230).
Conflict of interest
Authors SH, ZL, XL, and ZW were employed by Construction Branch of State Gird Jiangsu Electric Power Co. Ltd.
The remaining authors declare that the research was conducted in the absence of any commercial or financial relationships that could be construed as a potential conflict of interest.
The authors declare that this study received funding from State Grid Jiangsu Electric Power Co., Ltd. The funder had the following involvement in the study: study design, data collection and analysis, interpretation of results, and the writing and revision of the manuscript.
Generative AI statement
The author(s) declare that no Generative AI was used in the creation of this manuscript.
Any alternative text (alt text) provided alongside figures in this article has been generated by Frontiers with the support of artificial intelligence and reasonable efforts have been made to ensure accuracy, including review by the authors wherever possible. If you identify any issues, please contact us.
Publisher’s note
All claims expressed in this article are solely those of the authors and do not necessarily represent those of their affiliated organizations, or those of the publisher, the editors and the reviewers. Any product that may be evaluated in this article, or claim that may be made by its manufacturer, is not guaranteed or endorsed by the publisher.
References
Bažant, Z. P., and Jirásek, M. (2018). “Temperature effect on water diffusion, hydration rate, creep and shrinkage,” in Creep and hygrothermal effects in concrete structures (Dordrecht, Netherlands: Springer), 607–686.
Cai, Y., Wang, F., Zhao, Z., Lyu, Z., Wang, Y., and Zou, P. (2023). Early-hydration heat and influencing factor analysis of large-volume concrete box girder based on equivalent age. Structures 50, 1699–1713. doi:10.1016/j.istruc.2023.02.081
Cavacece, M. (2025). Heat transfer analysis of the turbine blades by using finite element method. J. Phys. Conf. Ser. 3063 (1), 012009. doi:10.1088/1742-6596/3063/1/012009
Dai, M. H. (2022). Analysis of mechanical response during the pouring process of CFST arch Bridge based on hydration heat temperature effect [D]. Beijing, China: Chongqing Jiaotong University. doi:10.27671/d.cnki.gcjtc.2022.000183
Deng, N., Wu, Y., Niu, B., Zuo, Q., and Xu, H. (2025). A novel quantitative structure–property relationship model for predicting the maximum volumetric heating capacity and the corresponding working temperature of heat pump refrigerants. Chem. Eng. Sci. 312, 312121703–121703. doi:10.1016/j.ces.2025.121703
Doroudi, R., Lavassani, S. H. H., and Shahrouzi, M. (2024). Optimal tuning of three deep learning methods with signal processing and anomaly detection for multi-class damage detection of a large-scale bridge. Struct. Health Monit. 23, 3227–3252. doi:10.1177/14759217231216694
Duan, D. Y., Wang, Z. C., Sun, X. T., and Xin, Y. (2022). A data fusion method for bridge displacement reconstruction based on LSTM networks. Smart Struct. Syst. 29, 599–616. doi:10.12989/sss.2022.29.4.599
Dehwah, O. H. A., and Yunping, X. (2025). Theoretical modeling of the effective thermal conductivity of concrete. J. Mater. Civ. Eng. 37 (11), 04025396. doi:10.1061/jmcee7.mteng-19677
Huang, M. S., Zhang, J. W., Hu, J. L., Ye, Z. T., Deng, Z. H., and Wan, N. (2024). Nonlinear modeling of temperature-induced bearing displacement of long-span single-pier rigid frame bridge based on DCNN-LSTM. Case Stud. Therm. Eng. 53, 103897. doi:10.1016/j.csite.2023.103897
Jia, X. H., Zhong, L. Y., Tang, J. T., and Wei, Y. (2024). Analysis of influencing factors of hydration heat in mass concrete. Sichuan Cem. (06), 18–20. doi:10.20198/j.cnki.scsn.2024.06.007
Li, X.-X. (2020). Parametric study on numerical simulation of missile punching test using concrete damaged plasticity (CDP) model. Int. J. Impact Eng. 144, 103652. doi:10.1016/j.ijimpeng.2020.103652
Li, W.-J., and Li, W. (2024). Performance of spirally reinforced high-strength circular CFST column under eccentric compression. J. Constr. Steel Res. 216, 108576. doi:10.1016/j.jcsr.2024.108576
Ministry of Housing and Urban-Rural Development of the People’s Republic of China (MOHURD) (2010). Code for design of concrete structures (GB 50010-2010). Beijing, China: China Architecture and Building Press.
Nguyen, T.-T., Waldmann, D., and Bui, T. Q. (2019). Computational chemo-thermo-mechanical coupling phase-field model for complex fracture induced by early-age shrinkage and hydration heat in cement-based materials. Comput. Methods Appl. Mech. Eng. 348, 1–28. doi:10.1016/j.cma.2019.01.012
Schindler, A. K. (2002). Concrete hydration, temperature development, and setting at Early-Ages. Ph.D. thesis. Austin, TX, USA: The University of Texas at Austin.
Shi, T., Deng, N. C., Pan, D., and Wang, S. (2020). Hydration heat of nonshrinkage concrete in large-diameter CFST arch ribs cured at low temperatures. Adv. Civ. Eng. 2020, 8858702. doi:10.1155/2020/8858702
Sun, J., and Xie, J. (2019). Simulation analysis of the hydration heat of large diameter CFST arch and its effects on loading age. Appl. Therm. Eng. 150, 482–491. doi:10.1016/j.applthermaleng.2019.01.022
Sun, Y., Jia, H., Wang, J., Ding, Y., Guan, Y., Lei, D., et al. (2025). Calculation model for the degree of hydration and strength prediction in Basalt fiber-reinforced lightweight aggregate concrete. Buildings 15 (15), 2699. doi:10.3390/buildings15152699
Xiao, L., Wei, X., Zhao, J. M., and Wu, C. T. (2023). Hot spot stress concentration factor of CFST T/Y joints based on modified equivalent thickness. Structures 51, 910–925. doi:10.1016/j.istruc.2023.03.097
Xie, J. B., Sun, J. Y., and Bai, Z. Z. (2022). Degree of hydration-based thermal stress analysis of large-size CFST incorporating creep. Steel compos. Struct. 45, 263–279. doi:10.12989/scs.2022.45.2.263
Yazdanpanah, O., Chang, M., Park, M., and Chae, Y. (2023). Force-deformation relationship prediction of bridge piers through stacked LSTM network using fast and slow cyclic tests. Struct. Eng. Mech. 85, 469–484. doi:10.12989/sem.2023.85.4.469
Yue, Z., Ding, Y., Zhao, H., and Wang, Z. (2022). Mechanics-guided optimization of an LSTM network for real-time modeling of temperature-induced deflection of a cable-stayed bridge. Eng. Struct. 252, 113619. doi:10.1016/j.engstruct.2021.113619
Zhang, Y., Wang, S., He, S., and Hao, X. (2023). Analysis of factors influencing the temperature field variation in mass concrete during hydration heat release. Case Stud. Therm. Eng. 52, 103737. doi:10.1016/j.csite.2023.103737
Zheng, J. L., Du, H. L., Mu, T. M., Liu, J. P., Qin, D. Y., Mei, G. X., et al. (2022). Innovations in design, construction, and management of Pingnan Third Bridge - the largest-span arch bridge in the world. Struct. Eng. Int. 32, 134–141. doi:10.1080/10168664.2021.1956399
Zhou, Q., Zhou, J. T., Feng, P. C., Xin, L., Jing, S. H., and Zheng, G. H. (2022). Full-scale experimental study on temperature field of large-diameter CFST arch bridges under strong radiation and large daily ambient temperature difference. J. Civ. Struct. Health Monit. 12, 1247–1263. doi:10.1007/s13349-022-00604-1
Keywords: CFST, large diameter, hydration, multi-field, neural network
Citation: Huang S, Liu Z, Liu X, Wang Z and Zhao C (2025) Multi-field numerical model and LSTM-based neural networks for thermal field predictions of concrete-filled steel tubes. Front. Mater. 12:1672487. doi: 10.3389/fmats.2025.1672487
Received: 24 July 2025; Accepted: 06 October 2025;
Published: 11 November 2025.
Edited by:
Erkan Oterkus, University of Strathclyde, United KingdomReviewed by:
David Bassir, University of Technology of Belfort-Montbéliard, FranceSepideh Nasrollahpour, York University, Canada
Copyright © 2025 Huang, Liu, Liu, Wang and Zhao. This is an open-access article distributed under the terms of the Creative Commons Attribution License (CC BY). The use, distribution or reproduction in other forums is permitted, provided the original author(s) and the copyright owner(s) are credited and that the original publication in this journal is cited, in accordance with accepted academic practice. No use, distribution or reproduction is permitted which does not comply with these terms.
*Correspondence: Chenyi Zhao, MjIwMjMxNTM3QHNldS5lZHUuY24=