 Haoyue Sun1
 Xiaoping Su
- 1Powerchina Jilin Provincial Electric Power Survey and Design Institute Co., Ltd., Changchun, China
- 2School of Civil Engineering, Changchun Institute of Technology, Changchun, China
Introduction: The excellent backfilling performance and significant potential for waste resource utilization make controlled low-strength material (CLSM) an important technical alternative to traditional backfilling methods. The preparation of CLSMs using excavated soil not only enables local material sourcing but also promotes waste resource utilization and reduces backfilling costs.
Methods: In this study, a novel CLSM was developed by incorporating sand, cement, fly ash, high-efficiency plasticizer, and water into excavated soil. The engineering properties—including flowability, setting time, bleeding rate, and density—were evaluated, with a focus on strength characteristics and the establishment of a strength-age relationship model. Multiple characterization methods were used to elucidate the strength development mechanism from the perspectives of hydration product evolution and microstructural changes. A machine learning prediction model based on Newton‒Raphson-Based Optimizer (NRBO)-Light Gradient Boosting Machine (LightGBM) was constructed to achieve high-precision prediction of the relationship between mix proportions and strength.
Results and discussion: Results show that the prepared CLSM exhibits excellent engineering performance: flowability of 165–257 mm ensures good self-compacting and self-levelling; setting time of 4.6–7.48 h meets rapid construction needs; bleeding rate (≤1.28%) and fresh density (1880–2005 kg/m3) meet engineering standards; and 28-day strength (1.35–2.69 MPa) is suitable for both trenchless and excavatable applications. The strength–age relationship fits a hyperbolic model with accuracy above 0.98. Microstructural analysis reveals that hydration of cement and fly ash produces C-S-H and C-A-H gels, filling pores and densifying the structure. The NRBO-LightGBM model achieved R2 values of 0.995 and 0.966 for training and test sets, respectively, demonstrating high accuracy and stability. Furthermore, by utilizing excavated soil as a replacement for sand in the aggregate, each cubic metre of CLSM can recycle 328–600 kg of dry excavated soil. These findings provide theoretical and technical support for CLSM development using excavated soil.
1 Introduction
Backfilling is a crucial process in engineering construction. Traditional backfilling methods utilize primarily cohesive soil from engineering excavations for layered filling and mechanical compaction to enhance the mechanical properties and impermeability. However, this approach is time-consuming and labour-intensive, and it is difficult to ensure backfilling quality in space-constrained areas, which affects construction efficiency (Indraratna et al., 2005). In recent years, controlled low-strength materials (CLSMs) have emerged as an innovative solution for engineering backfilling (Do and Kim, 2016). Owing to their excellent flowability, CLSMs enable self-levelling and pump construction, making them particularly suitable for backfilling operations in confined spaces and complex structures. These materials can achieve uniform and dense filling effects without vibration, significantly improving backfilling quality and construction efficiency (Ling et al., 2018; Zhu et al., 2022; Dalal et al., 2023). Furthermore, CLSMs can be sourced from a wide range of materials, and various solid wastes can be used for CLSM preparation after passing performance testing (Wang et al., 2023; Zhao et al., 2024b). Such exceptional backfilling performance, combined with the enormous potential for waste resource utilization, makes CLSMs important technical alternatives to traditional backfilling methods, with promising prospects for widespread application in future backfilling projects.
To date, some progress has been made in the preparation of CLSMs using various types of engineering excavated soils (ESs). Finney et al. (2008) were among the first to propose the technical approach of using native soil to replace traditional aggregates in CLSM production, successfully applying fine-grained native soil and clay in a CLSM preparation for pipeline backfilling. Sheen et al. (2013) further investigated the engineering properties of soil-based CLSMs with partial cement replacement by slag, expanding the application scope of native soil CLSMs while improving their engineering performance and environmental benefits. Kim et al. (2016) explored the technical feasibility of combining ES with fly ash in a CLSM and proposed a technical approach for the synergistic utilization of ES and industrial byproducts, enriching the application pathways for ES resource utilization. Hwang et al. (2017) pioneered water treatment sludge–fly ash–slag alkali-activated CLSM technology, laying the foundation for the synergistic utilization of sludge and other solid wastes, with their research establishing mix design methods and performance evaluation systems that provide important references for subsequent studies. Qian et al. (2019) focused on evaluating the performance of excess ES in CLSMs, whereas Fauzi et al. (2021) employed response surface methodology to optimize CLSM mixtures containing waste paper ash, providing methodological support for multisource solid waste mix optimization. Liu et al. (2022) reviewed the current applications of incineration industrial byproducts as cementitious materials, identifying the synergistic feasibility of using different soil types and incineration byproducts. Zhu et al. (2022) comprehensively assessed the suitability of mixing excavated loess and gravel soil for CLSM construction through combined laboratory testing and field validation, providing localized CLSM solutions for infrastructure construction in loess regions and achieving local sourcing and utilization of soil resources. The cement–fly ash–sewage treatment sludge ternary system developed by Ho et al. (2022) provides an important technical reference for sludge resource utilization. Du et al. (2024) systematically explored the application potential of waste expansive soil in CLSMs, demonstrating that through appropriate mix design, waste expansive soil could be successfully prepared into a CLSM to meet engineering requirements, confirming the feasibility of waste expansive soil resource utilization and providing new approaches for solving expansive soil disposal problems. Zhao et al. (2024b); Zhao et al. (2024c) conducted a series of studies that addressed the technical challenges associated with incorporating large quantities of fine-particle waste soil from shield tunnelling into CLSMs. Their research successfully developed waste soil-based CLSMs that met performance requirements utilizing both cement combined with fly ash and slag combined with fly ash as binders.
These studies indicate that through mix design and admixture regulation, CLSMs with high flowability and controllable strength can be fabricated, and various types of engineering ESs can be utilized in CLSM preparation to obtain excellent performance. These findings have significantly expanded the range of raw materials available for CLSMs, deepened the understanding of their performance mechanisms, and strongly promoted technological advancements in this field. However, current research still faces a series of challenges: many materials remain in the laboratory stage, and although technically feasible, the processes are relatively complex, and numerous technical barriers persist during the transition to practical engineering applications, hindering widespread adoption. In addition, research on the strength development mechanisms of CLSMs and the development of strength prediction methods is insufficient, which restricts the precise control and optimization of material properties.
In addition, the modification and stabilization of soil through the incorporation of additives provide valuable reference and guidance for this study. Chang et al. (2024) applied phosphogypsum (PG) in a composite stabilizer consisting of cement, lime, and slag powder to modify loess for use in road base layers and analysed its microstructural evolution using X-ray diffraction (XRD) and scanning electron microscopy (SEM). Zhang et al. (2019) utilized fly ash and cement to stabilize loess and conducted freeze‒thaw durability tests, frost heave tests and thaw weakening tests, and unconfined compressive strength tests to evaluate performance improvements under laboratory freeze‒thaw conditions. Through one-dimensional consolidation tests, direct shear tests, and unconfined compressive strength tests, Pu et al. (2020) investigated the strength, water stability, compressibility, and shear properties of cement-stabilized silt and further analysed its microstructural characteristics using SEM and XRD. Although the preparation of CLSM using soil differs from stabilized soil in terms of soil content and targeted properties, these related studies provide important theoretical references regarding reaction mechanisms for the present research.
Addressing the research status and limitations, this study aims to develop a practical, and easily scalable preparation technology for soil-based CLSMs. This method uses ordinary Portland cement (OPC) and fly ash as cementitious materials, fully exploits engineering ES as fine aggregates, and incorporates an appropriate amount of construction sand along with a superplasticizer to optimize performance. On this basis, research is conducted that focuses on material properties, mechanisms, and strength prediction models, specifically encompassing the following three aspects. First, the workability properties of CLSMs, including flowability, setting time, bleeding rate, and density, are evaluated, with emphasis on strength characteristics and the establishment of a strength–time relationship model to verify their engineering applicability. Second, multiple characterization methods are employed to elucidate the strength development mechanism of the material system from the perspectives of hydration product evolution and microstructural changes. Finally, a machine learning-based strength prediction model is constructed, and its prediction accuracy is assessed to achieve precise prediction of CLSM strength performance while minimizing experimental input, thereby providing scientific decision-making support for engineering practice.
2 Materials and methods
2.1 Materials
2.1.1 Excavated soil
The soil samples used were obtained from the foundation pit excavation during the open-cut construction of Anxin Road Station on Changchun Metro Line 5. The sampling point was located at 125°14′22″ E, 43°48′25″ N. After collection, the soil samples were first subjected to impurity removal, eliminating non-soil components such as construction debris and plant roots. Systematic testing was subsequently conducted to evaluate the physical properties and mineral composition of the soils, with the relevant data presented in Table 1; Figure 1A. The particle size distribution analysis results are shown in Figure 1B, which indicate that the mass proportion of fine particles smaller than 0.075 mm in the soil is 82.2%. According to geotechnical classification standards, this soil is classified as silty clay. Mineral composition analysis revealed that the content of primary minerals (such as quartz and feldspar) in the soil is 70.2%, while clay minerals account for 29.8%. Among the clay minerals, illite and montmorillonite mixed layers are predominant.
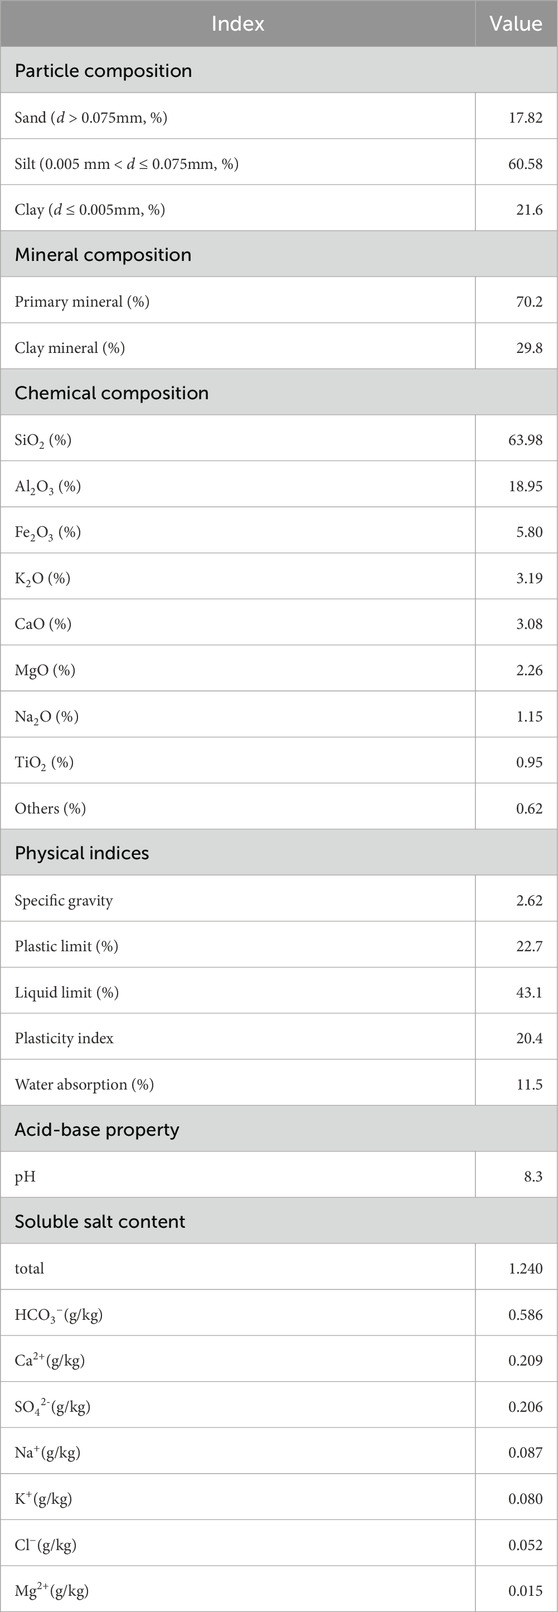
Table 1. ES index properties.
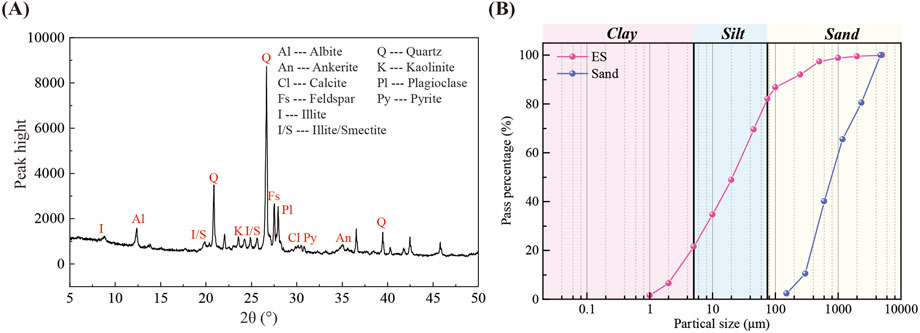
Figure 1. (A) XRD mineral phase analysis spectrum of ES; (B) particle size distribution curves of ES and sand.
2.1.2 Cement and fly ash
This study employed Dinglu brand OPC (P.O., strength grade 42.5) produced by Jilin Yatai Cement Co., Ltd. The fly ash used was laboratory-grade Class F fly ash, supplied by Zhengzhou Yuzhong Power Plant Fly Ash Development Company. Both materials comply with the relevant standard requirements of ASTM C150/C150M-17 (2017) and ASTM C618-19 (2019), respectively. The primary chemical compositions of the materials are detailed in Table 2.
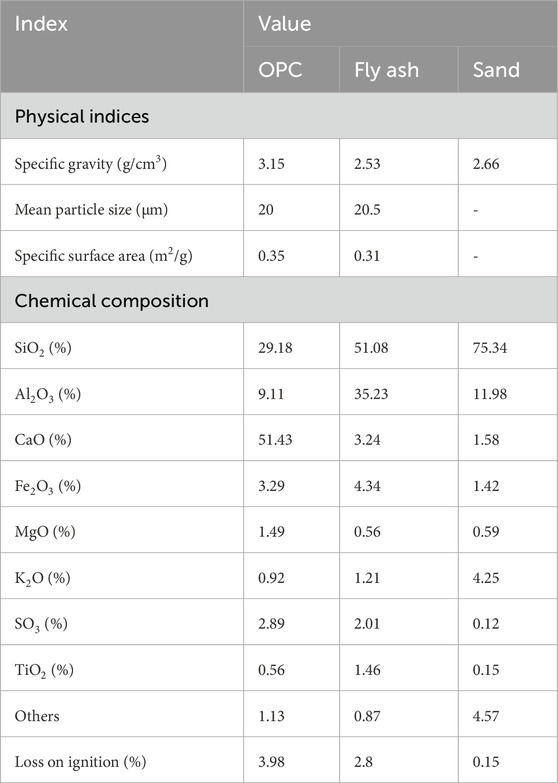
Table 2. Physical and chemical analyses of OPC, fly ash and sand.
2.1.3 Sand
Natural medium sand conforming to the relevant standards for Grade II sand as specified in GB/T 14684-2022 (2022) was used in this study. Its chemical composition is presented in Table 2, and the particle size distribution is illustrated in Figure 1B, with a fineness modulus of 2.66.
2.1.4 Superplasticizer
The water-reducing admixture used in this study was a liquid polycarboxylate-based superplasticizer produced by Hunan Zhongyan Building Materials Technology Co., Ltd., which exhibited excellent dispersion properties and water-reducing performance.
2.1.5 Water
The water used in this study was ordinary tap water sourced from Changchun City, which meets the water requirements for concrete mixing and related experimental procedures.
2.2 Mix proportion and mixing
2.2.1 Mix proportion
Given the high water absorption capacity of the ES, this study employed the water-to-solid ratio (W/S) instead of the traditional water-to-binder ratio to control the water content of the material. Additionally, the binder-to-aggregate ratio (B/A), the proportion of cement in the binder (C/B), and the proportion of sand in the aggregate (S/A) were considered to facilitate mix design. Response surface methodology, specifically, Box–Behnken design (BBD), was used to construct 25 mix proportions. Table 3 presents the design parameters for each mix proportion and the quantities of the CLSM components.
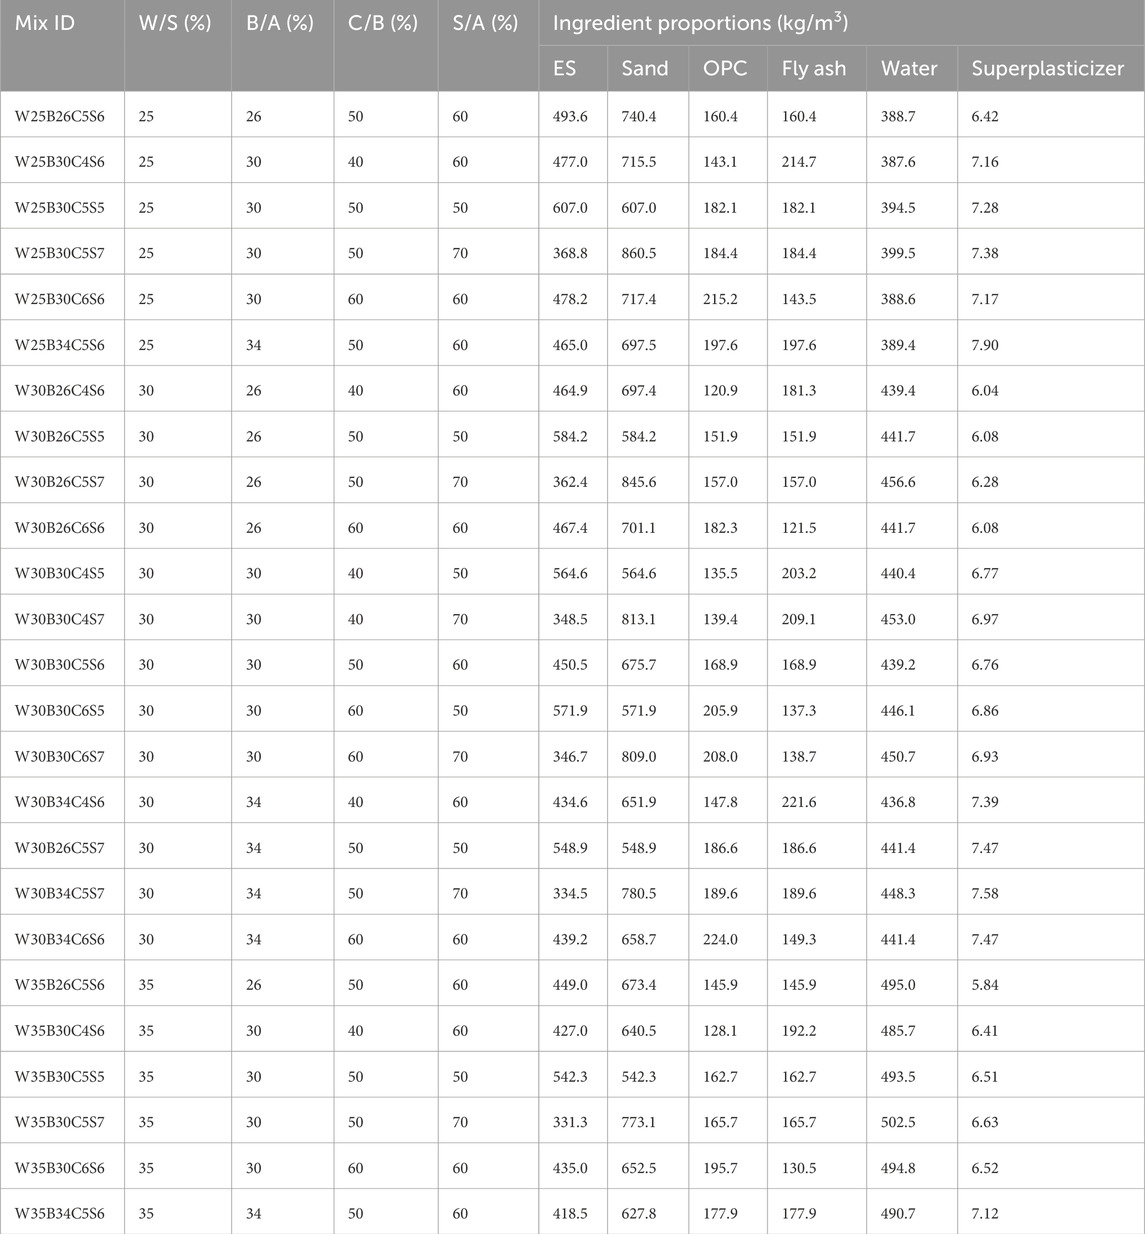
Table 3. Test matrix for the experiments.
Each mix proportion was identified using an ID code composed of letters and numbers. For example, the ID code “W25B26C5S6” represents a mix proportion with a W/S ratio of 25%, B/A ratio of 26%, C/B ratio of 50%, and S/A ratio of 60%. In this code, the uppercase letters denote the initial of each variable, while the numbers indicate the corresponding values, with the percentage sign omitted.
2.2.2 Mixing procedures
The ES and sand were thoroughly air-dried, after which their water content was determined. During batching, their inherent moisture was deducted to ensure an accurate value of W/S. To guarantee high homogeneity of the mixture, the solid components (ES, sand, OPC, and fly ash) were first precisely weighed according to the mix proportions and added sequentially to the mixer. They were then thoroughly mixed under dry conditions for no less than 5 min. Subsequently, the accurately measured water and superplasticizer were slowly introduced into the mixer in the correct proportions, followed by wet mixing for no less than 4 min to achieve the desired uniformity. The preparation process of the CLSM mixture and the characterization tests are shown in Figure 2.
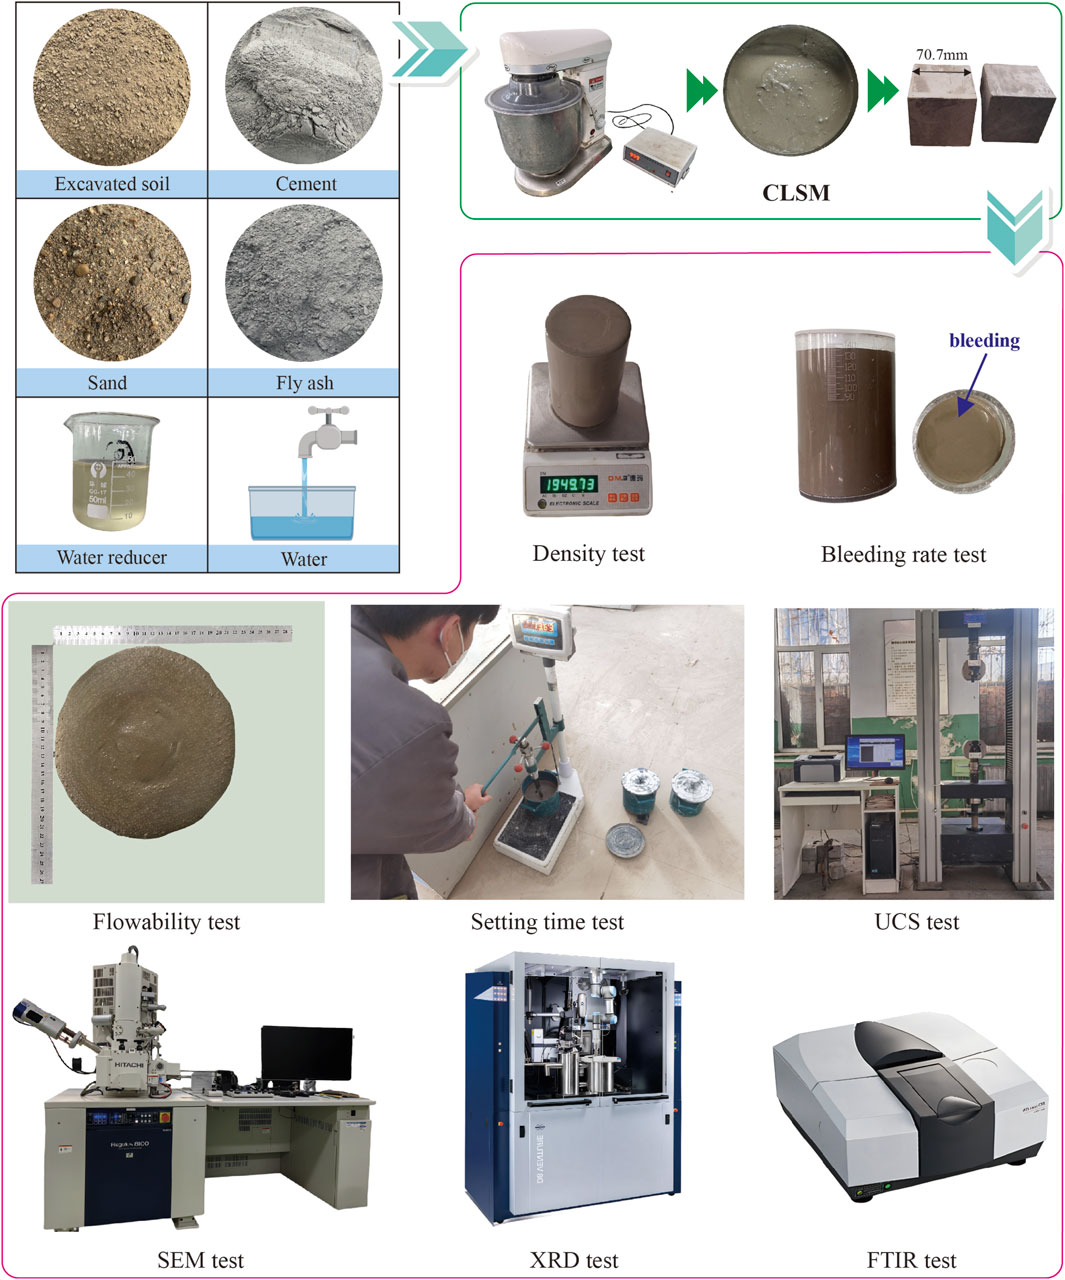
Figure 2. Mixing and preparation process and characterization tests.
2.3 Test methods
2.3.1 Flowability measurement
In this study, the flowability was evaluated using the flow cylinder method specified in ASTM D6103-17 (2017). The testing apparatus consisted of a highly transparent acrylic cylinder with an inner diameter of 75 mm and a height of 150 mm, which was placed vertically on a horizontally levelled acrylic plate while ensuring a tight seal at the base. The freshly mixed paste was poured into the cylinder until full, after which the cylinder was lifted vertically to allow the paste to spread freely under gravity. Once the paste ceased flowing, the maximum spread diameter and the diameter perpendicular to it were measured. The arithmetic mean of these two values was taken as the flowability, thereby minimizing errors caused by uneven spreading.
2.3.2 Setting time measurement
The setting time of CLSMs was determined according to ASTM C403-23 (2023). The test was conducted using a standard penetration resistance apparatus. Fresh CLSM was placed in cylindrical moulds and cured under standard conditions (temperature 20 °C ± 2 °C, relative humidity ≥95%). Testing began immediately after mixing, with measurements taken every 30 min initially. As the material hardened and resistance increased rapidly, the testing interval was reduced to 15 min. During each test, a penetration needle was inserted vertically into the specimen surface at a constant rate to a depth of 25 ± 2 mm over 10 ± 2 s. Multiple measurements were taken at different locations to avoid repeated testing at the same point. The setting time was determined when the penetration resistance first reached 2.74 MPa (Kim et al., 2016; Kuo et al., 2013).
2.3.3 Bleeding rate measurement
The bleeding rate was measured in accordance with ASTM C940-22 (2022). In the testing procedure, 800 ± 10 mL of thoroughly mixed fresh CLSM was immediately placed in a transparent cylindrical mould and maintained under standard laboratory conditions (temperature 25 °C ± 2 °C, relative humidity ≥50%) without vibration or disturbance. Timing began upon completion of moulding, with periodic observation and collection of bleed water from the specimen surface until bleeding essentially ceased or reached the 2-h termination time. The bleeding rate was calculated as the ratio of the volume of bleed water to the initial volume of the mixture. The final result was determined as the arithmetic mean of three parallel tests (Kim et al., 2016; Yan et al., 2014).
2.3.4 Density measurement
To ensure the high precision and reliability of the density test results, the volume of fresh paste used for each test was not less than 800 mL (ASTM D6023-16, 2016).
2.3.5 Unconfined compressive strength (UCS) measurement
Strength tests were conducted on cubic samples with dimensions of 70.7 mm × 70.7 mm × 70.7 mm. The paste was poured into the moulds in layers and vibrated for 10 s to eliminate air bubbles and ensure compaction and a smooth surface. After casting, the moulds were immediately placed in a curing chamber maintained at 20 °C ± 2 °C and a relative humidity of ≥95%. After 24 h, the samples were carefully demoulded to avoid damage and then cured under standard conditions until the specified ages were reached.
A WHY 10-type compression testing machine with a loading rate of 0.2 kN/s was used to test the strength of the samples at the key ages of 3, 7, 14, and 28 days. All tests were conducted in strict accordance with the JGJ/T 70-2009 (2009) standard to ensure the accuracy and reliability of the data.
2.3.6 Microstructural observations
Microstructural observations were conducted using a Hitachi Regulus 8100 cold field emission scanning electron microscope. The samples, with dimensions of 1.0 cm × 1.0 cm × 3.0 cm, were taken from the centre of the specimens with the same dimensions as those used for the UCS tests. After being cut, the samples frozen with liquid nitrogen and freeze-dried to preserve as much of the original microstructure as possible. Prior to observation, the samples were fractured along the longitudinal direction to obtain a fresh cross section, and observations were carried out at magnifications ranging from 500 to 50,000×.
2.3.7 Composition analysis
A Phillips X’Pert 3040 X-ray diffractometer was used to analyse the mineral composition and crystal structure of each sample, while a Thermo Scientific Nicolet iS5 Fourier transform infrared (FTIR) spectrometer was used to characterize the functional groups and chemical structure.
3 Results and discussion
3.1 Flowability
As a key parameter in evaluating CLSM performance, flowability has a decisive influence on the workability and filling effectiveness (Kaliyavaradhan et al., 2022). According to the ACI 229-13 (2013) standard, mixtures with a flow spread greater than 200 mm in the flow cylinder test are classified as having high flowability, whereas those with flow spreads between 150 mm and 200 mm are considered to have moderate flowability. In this study, the flowability for all mix proportions ranged from 165 to 257 mm, as shown in Figure 3A. All the mixtures met the minimum flowability requirement of 150 mm, and some even exceeded 200 mm, reaching the high flowability standard. Such moderate to high flowability endows the CLSMs with excellent workability, enabling them to flow and fill complex and narrow spaces under minimal external force, thereby eliminating the need for vibration and mechanical compaction.
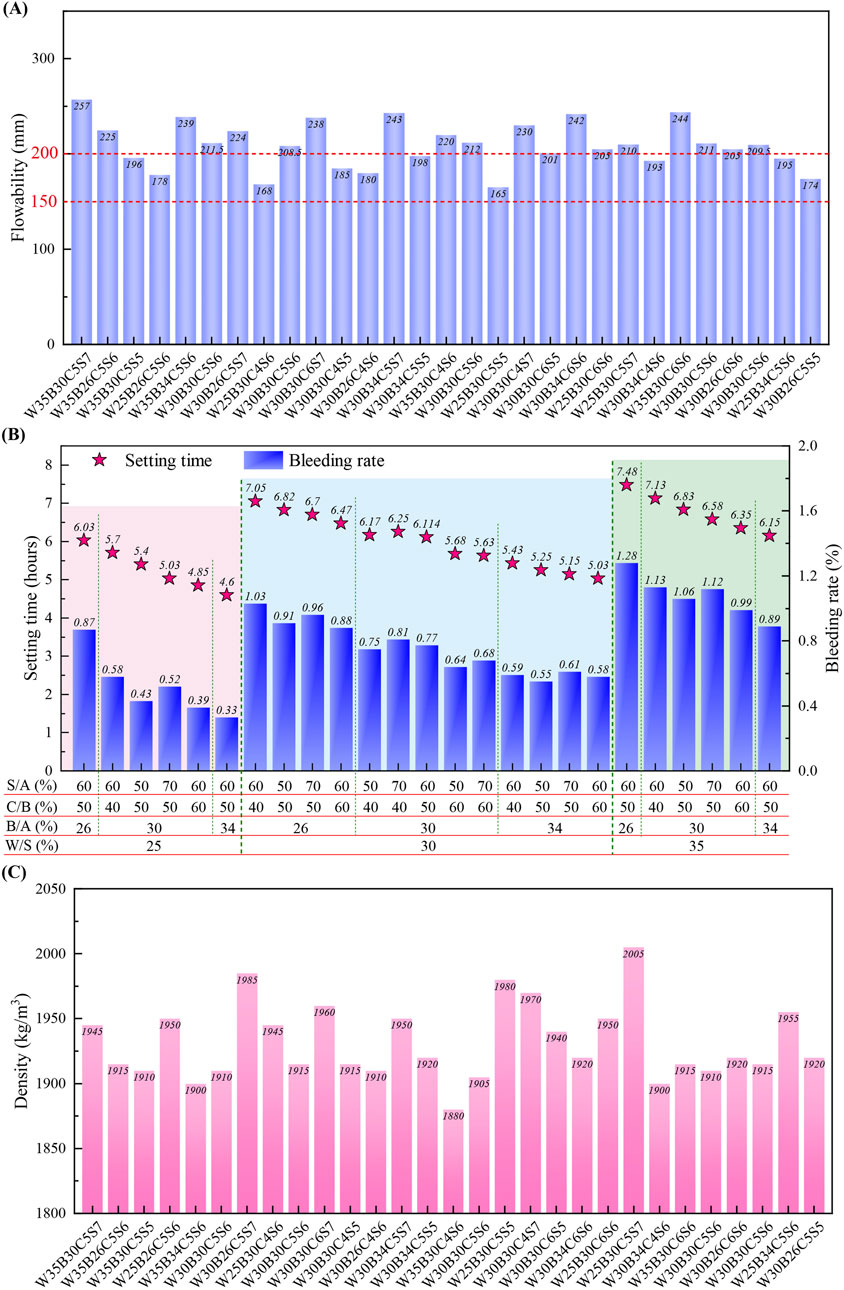
Figure 3. (A) Flowability, (B) setting time and bleeding rate and (C) densities of samples with different mix proportions.
The W/S ratio is a key parameter affecting the flow characteristics of a CLSM. Although a higher W/S ratio can significantly improve flowability, an excess of water often leads to severe bleeding, resulting in substantial ground settlement after filling and reducing both the density and overall performance of the backfill. In this study, by reasonably incorporating a high-efficiency polycarboxylate superplasticizer, ideal flowability was achieved at a relatively low W/S ratio (controlled within the range of 25%–35%). Moreover, CLSMs with lower W/S ratios exhibited a higher density and improved mechanical properties after hardening, providing more reliable technical support for engineering applications.
3.2 Setting time
As shown in Figure 3B, the setting time of the developed CLSM ranges from 4.6 to 7.48 h, significantly lower than the limit of 36 h, demonstrating excellent rapid-setting performance. Results indicate that the setting time is influenced by multiple factors, primarily including W/S, binder content, cement content, and sand ratio. Generally, the setting time shows a positive correlation with the W/S and sand ratio, as increased water and sand content extend the setting time. Conversely, it exhibits a negative correlation with the binder and cement contents, where increases in these components reduce setting time. The mechanism lies in that increased water content dilutes the binding system, slowing hydration reaction rates; higher sand ratios reduce the water absorption of fine particles, increasing free water in the system, similarly delaying hydration progress. In contrast, increased binder and cement contents provide more reactive components for hydration reactions, particularly cement, whose early hydration reaction significantly accelerates the setting process. In conclusion, this material demonstrates excellent setting time performance, and effective control can be achieved through rational adjustment of component proportions.
3.3 Bleeding
As shown in Figure 3B, the bleeding rate of the CLSM in this study ranges from 0.33% to 1.28%, significantly below the 5% limit, indicating good bleeding stability and resistance to segregation. The variation in bleeding rate is primarily influenced by mix proportion parameters. With increasing W/S, the relative water content in the system increases, leading to excess water during hydration and consequently higher bleeding rates. Conversely, increases in both B/A and C/B help reduce bleeding rates. Higher binder content increases water demand for hydration reactions, reducing free water in the system and weakening bleeding phenomena. Particularly in cement–fly ash systems, cement’s intense hydration reaction with water requires substantial water content, especially for tricalcium aluminate (C3A)’s initial hydration, which demands high water content and reacts rapidly. Fly ash, however, relies on calcium hydroxide (CH) produced from cement hydration as an activator for slow pozzolanic reactions, requiring relatively less water. Additionally, increasing S/A also helps reduce bleeding rate, as sand has lower water absorption than waste soil, reducing free water content in the system.
3.4 Density
The ACI 229-13 (2013) standard clearly stipulates that the wet density of a qualified CLSM should be controlled within the range of 1,840–2,320 kg/m3, which is generally higher than that of most conventional compacted fills. According to Figure 3C, the wet densities of the CLSMs with various mix proportions ranged from 1,880 to 2,005 kg/m3, fully meeting the standard requirements. An appropriate density not only ensures the overall stability of the backfill, effectively resisting lateral deformation and settlement, but also endows that material with excellent self-compacting properties, enabling it to uniformly fill complex geometric spaces and avoid the voids and looseness commonly observed with traditional backfill materials, thereby enhancing the safety and reliability of backfilling construction.
Replacing sand with ES as an aggregate in CLSM leads to a reduction in the material’s density while effectively decreasing the consumption and dependence on natural sand. This approach enables the resource utilization of excavated waste soil. Each cubic metre of CLSM can incorporate 328–600 kg of dry ES, significantly reducing the need for offsite disposal and handling of waste soil and promoting the efficient use of waste resources.
3.5 Unconfined compressive strength
As shown in Figure 4A, the 28-day UCSs ranged from 1.35 to 2.69 MPa, fully meeting the requirements of the ACI 229-13 (2013) standard (0.3–8.3 MPa). Among the samples, mixtures with UCS values not exceeding 2.1 MPa can be classified as excavatable CLSMs (Do et al., 2015), which are particularly suitable for temporary backfilling projects such as trenches and temporary support structures that require subsequent re-excavation. These materials provide sufficient bearing capacity while maintaining moderate excavatability, thereby significantly reducing energy consumption and costs in later construction stages. In contrast, mixtures with UCS values exceeding 2.1 MPa can be applied to permanent filling projects with higher strength requirements, such as foundation reinforcement and abutment backfill, offering more reliable long-term load-bearing capacity and structural stability. The wide range of strength distributions endows the developed CLSM system with excellent adaptability and flexibility, allowing for targeted mix adjustments according to the specific needs of different engineering scenarios and meeting the technical requirements of diverse applications, such as municipal pipeline installation, underground space backfilling, and subgrade treatment.
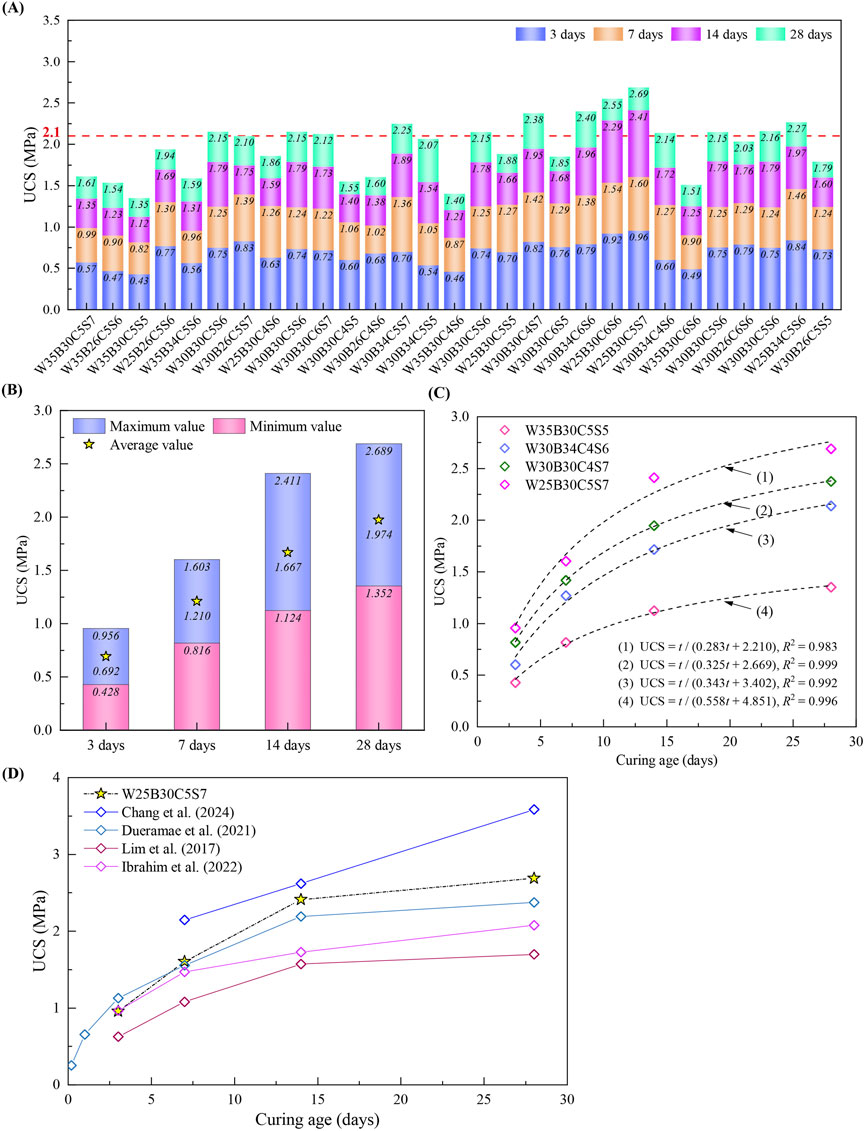
Figure 4. (A) UCS of samples with different mix proportions at various ages; (B) statistical analysis of UCS at different curing ages; (C) strength‒time relationship; (D) comparison of strength‒time relationships.
ACI 229 recommends using the 28-day UCS as the primary criterion for evaluating the excavability of CLSM. Generally, when the 28-day UCS is less than 2.1 MPa, the material is considered to have good excavability and can be removed using conventional mechanical equipment without the need for specialized breaking tools. If the UCS exceeds this threshold, the material becomes significantly harder, making excavation more challenging and failing to meet the ideal requirements for excavability. In this study, the developed CLSM can be tailored to be either excavatable or nonexcavatable by adjusting the mix proportion parameters, thereby flexibly accommodating different engineering application needs.
UCS tests were conducted on each mixture at four different curing ages (3, 7, 14, and 28 days), and the maximum, minimum, and average values at each age were statistically analysed, as shown in Figure 4B. The results indicate that the strength gradually increases with increasing curing time, but the rate of increase is staged. The strength increases rapidly within the first 7 days, with the most significant improvement occurring in the first 3 days. Statistical analysis revealed that the 7-day strength reached 50.6%–69.5% of the 28-day strength, indicating that the CLSM possesses relatively high early-age bearing capacity and can meet the early strength requirements of certain engineering applications. As the curing time increases, the rate of strength gain gradually decreases, with the increase from 14 to 28 days tending to stabilize and the late-stage growth being significantly slower than that in the early stage.
Fitting analysis of the relationship between CLSM strength and curing age was performed, and the hyperbolic model outperformed the other models, with coefficients of determination (R2 values) above 0.98, as shown in Figure 4C. The goodness of fit of this model is significantly better than that of the power and logarithmic models, making it an effective tool for predicting the CLSM strength development.
As shown in Figure 4D, the strength development over time of the developed CLSM is compared with that of other materials. The strength–time profile of the developed CLSM closely aligns with findings from previous studies (Dueramae et al., 2021; Ibrahim et al., 2022; Lim et al., 2017), which revealed similar evolution characteristics. Specifically, the strength increases rapidly during the early curing period and then gradually stabilizes, with the 7-day strength exceeding 50% of the 28-day strength. This pattern is consistent with the hyperbolic model and clearly demonstrates the synergistic effects of cement hydration and the pozzolanic reaction of fly ash. In particular, early strength is primarily attributed to cement hydration, whereas the pozzolanic activity of fly ash becomes more pronounced in the later stages, resulting in a slower rate of strength gain.
Compared with the stabilized soil curve reported by Chang et al. (2024), CLSM results in markedly different strength–time characteristics. As a flowable backfill material, CLSM typically requires lower strength (generally ranging from 0.3 to 2.1 MPa) and rapid early strength development to meet construction schedule requirements. In contrast, stabilized soil—particularly when used in subgrade engineering—often demands higher strength levels (up to 3.0–5.0 MPa or more) to adequately support the loads from overlying structures. However, its strength development is relatively slow, necessitating a longer curing period to reach the design strength. These differences primarily stem from the distinct mix design philosophies and engineering application scenarios of the two materials.
3.6 Strength development mechanism
Figure 5 presents SEM images of typical samples at different curing ages. With increasing curing time, the hydration product types become more diverse, and many needle-like ettringite, reticular and fibrous calcium silicate hydrate (C-S-H) gels are distributed throughout the microstructure, whereas soil and sand particles are difficult to distinguish within the field of view. As curing progresses, fly ash particles gradually lose their original regular morphology, indicating their ongoing participation in hydration reactions; however, partially hydrated or unreacted fly ash particles can be observed in some samples.
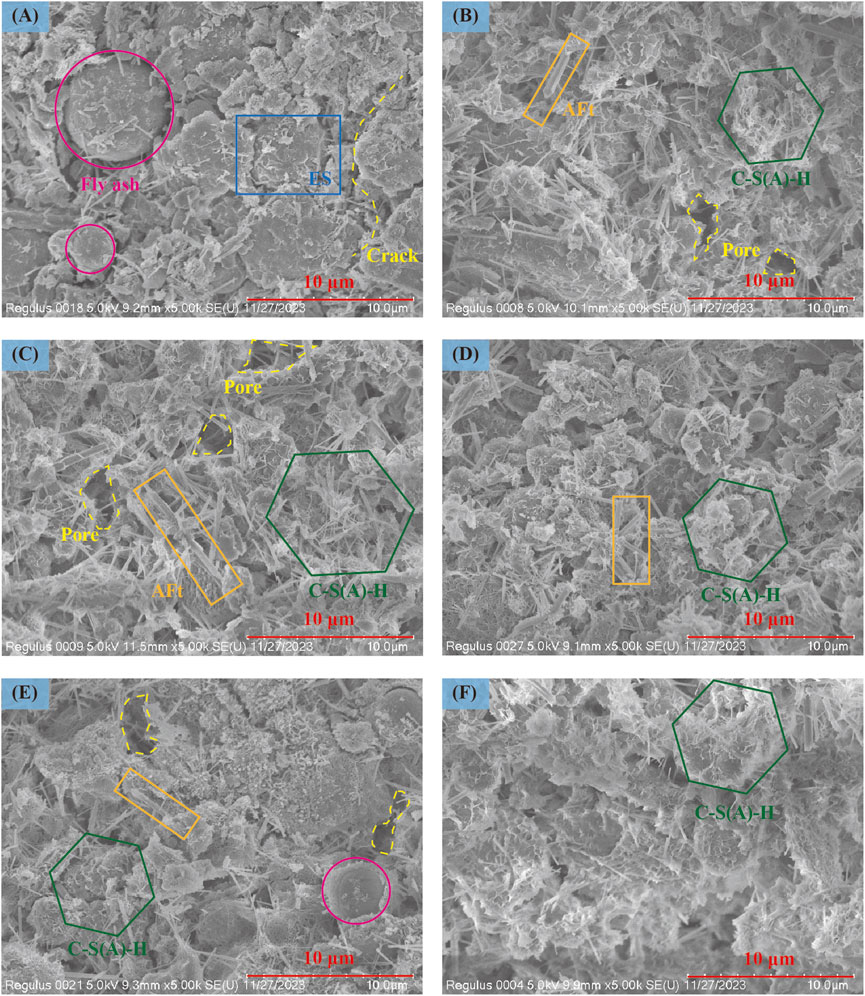
Figure 5. SEM images of typical samples: (A) 3 days, C/B = 50%; (B) 7 days, C/B = 50%; (C) 14 days, C/B = 50%; (D) 28 days, C/B = 50%; (E) 28 days, C/B = 40%; (F) 28 days, C/B = 60%.
At the early curing stage (Figure 5A), the sample structure is relatively loose, with obvious cracks and pores. Preliminary hydration reactions have occurred in some regions, but the hydration products are not yet prominent. Unreacted or partially reacted fly ash particles are still observable. By day 7 (Figure 5B), the main hydration products of the cement have formed, with a large quantity of needle-like ettringite and granular, reticular, and fibrous gel substances generated. These gels interweave with each other, effectively binding soil and sand particles and filling pores, thereby promoting strength development. Compared to the initial reaction stage, the pores in the material become smaller and fewer in number, and the structure gradually becomes denser; the rapid formation of cementitious products also leads to a rapid increase in material strength. In the later stages (Figure 5C), the rate of hydration gradually slows, and various hydration products progressively fill the spaces previously occupied by water. Large amounts of reticular and fibrous gel substances interweave and adhere, connecting dispersed particles and their hydration products into a dense, three-dimensional structure, which forms the basis of CLSM strength. However, owing to the slower generation of cementitious products, the strength increase rate decreases. This observation is consistent with the early findings of Salini et al. (2023), which indicated that the presence of fly ash delays the pozzolanic reaction in cement. After 28 days of curing (Figure 5D), the microstructure is highly dense, with the field of view almost entirely occupied by interwoven cementitious products, and the pores and cracks have completely disappeared. Although the amount of C-S-H gel may have decreased slightly due to evaporation or carbonation, the impact on material strength was limited, which is consistent with related research findings (Li et al., 2023; Maghomi et al., 2022).
In the CLSM system, the hydration rate of the cement is significantly faster than that of the fly ash. As a result, after 3 days of curing, a substantial amount of unhydrated fly ash particles remains within the material, whereas the number of unreacted cement particles is relatively low. Furthermore, as the proportion of fly ash in the cementitious materials increases (i.e., as the C/B ratio decreases), the early strength decreases markedly, with a higher fly ash content leading to a greater reduction in strength.
As shown in Figures 5E,F, the SEM images correspond to samples with cement dosages (C/B) of 40% and 60%, respectively. The analysis reveals that at lower cement contents, the quantity of cementitious products is relatively limited, and these products predominantly exhibit a needle-like morphology with fewer reticular and fibrous structures. Additionally, unreacted or partially hydrated fly ash particles are observed, resulting in increased porosity and a relatively loose overall structure. As the cement content increases, the alkalinity of the system is enhanced, which further promotes the hydration of fly ash and leads to the formation of more abundant cementitious products. These products primarily form interlaced reticular and fibrous structures, significantly reducing porosity and improving the overall integrity and compactness of the samples, thereby enhancing their mechanical strength.
As shown in the XRD patterns in Figure 6A, in the cement–fly ash binder system, the dicalcium silicate and tricalcium silicate in the cement react with water to form C-S-H gel and calcium hydroxide (CH), whereas tricalcium aluminate and tetracalcium aluminoferrite rapidly generate calcium aluminate hydrate (C-A-H). In the early curing stage, the characteristic peak of CH is prominent in the XRD spectra, whereas the peaks corresponding to the C-S-H and C-A-H gels are not significant. The Class F low-calcium fly ash used in this study is a pozzolanic material that, although not self-cementing, contains SiO2 and Al2O3, which can react with CH in alkaline environments to form additional C-S-H and C-A-H gels. With prolonged curing time, the content of CH gradually decreases, and its characteristic peak weakens or even disappears, while the peaks of the C-S-H and C-A-H gels become more pronounced. Moreover, the diffraction peaks of dicalcium silicate and tricalcium silicate (indicated by the blue dashed lines) also gradually diminish as hydration progresses.
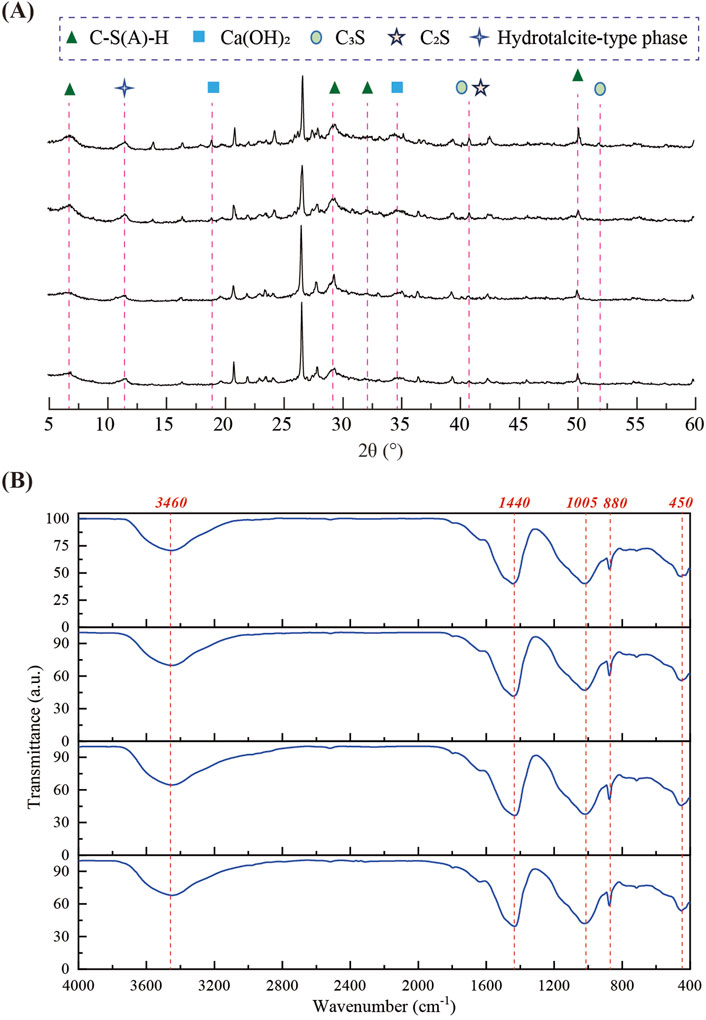
Figure 6. (A) XRD patterns and (B) FTIR spectra of representative samples.
The hydrotalcite-type phase observed in the figure exhibits distinct diffraction characteristics, primarily originating from fly ash, with a small portion derived from cement. As the curing age increases, the intensity of its characteristic peaks gradually decreases, and peak broadening occurs. This phenomenon is attributed mainly to ion exchange between the hydrotalcite phase and other anions in the surrounding environment (especially CO32-) during the curing process. Such exchange and rearrangement disrupt the original periodic arrangement of the interlayer channels, thereby reducing the structural order of the crystals. Additionally, the accompanying carbonation process further leads to the weakening, broadening, and even splitting of the characteristic peaks. This inference is consistent with the subsequent FTIR test results.
As shown in the FTIR spectra in Figure 6B, characteristic absorption peaks appear at approximately 3,460 cm−1, 1,440 cm−1, 1,005 cm−1, 880 cm−1, and 450 cm−1 for samples cured for different times. The specific analysis results are as follows. (1) The absorption peak at 3,460 cm−1 corresponds to structural water, physically adsorbed water, and the stretching vibration of hydroxyl (–OH) groups. With increasing curing time, the peak intensity increases, indicating the gradual transformation of –OH groups from free water to bound water, reflecting the ongoing hydration reaction. (2) The absorption peaks at 1,440 cm−1 and 880 cm−1 are attributed to the symmetric stretching and out-of-plane bending vibrations of CO32− in calcite, respectively. The calcite diffraction peaks in the XRD spectra indicate that carbonation occurred during curing and that the peak intensities increased with increasing curing time. (3) The absorption peak at 1,005 cm−1 is ascribed to the stretching vibration of Si–O bonds in the hydrated gel, and its intensity increases significantly with increasing age, indicating the continuous formation of gel products and serving as direct evidence of the ongoing hydration of active minerals. (4) The absorption peak at 450 cm−1 corresponds to the vibration modes of metal oxides, reflecting the increasing number of Ca–O, Si–O, and Al–O bonds, which further confirms the continuous development of amorphous C-S-H and C-A-H gel networks.
3.7 Discussion of several issues
3.7.1 Challenges arising from the variability of ES
During large-scale excavation, soils from different regions and depths often exhibit significant variations in particle size distribution, plasticity index, and organic matter content, resulting in a certain degree of variability in soil properties. When such soils are used in CLSM, this variability can lead to fluctuations in workability, strength development, and uniformity, making it challenging to ensure stable material performance. Consequently, the preparation and construction of CLSM become more complex in terms of mix design and onsite adjustments, posing challenges for quality control and potentially impacting the overall quality of the project.
To address the issue of soil variability, the following strategies can be adopted: screening, impurity removal, and homogenization of ESs to effectively reduce extreme differences in particle size distribution and organic matter content, thereby improving the uniformity and consistency of raw materials. Additionally, implementing zonal management based on the characteristics of soils from different regions and depths and developing specific CLSM mix designs for each soil type can help avoid mixing soils with significant performance differences and ensure the stability of material properties.
3.7.2 Superplasticizer dosing for field implementation
In the experiments conducted in this study, the maximum recommended dosage of 2% provided by the supplier was selected under conditions of material uniformity, resulting in favourable outcomes. However, during onsite CLSM preparation, fluctuations in raw material properties and environmental conditions may necessitate adjustments to the dosage of the water reducer. This is essential for preventing poor workability because of insufficient dosage, as well as segregation and excessively prolonged setting times caused by excessive dosage.
A stepwise addition approach is recommended: initially, the water reducer is added at a lower dosage, and the workability of the mixture is observed; then, the dosage is gradually increased on the basis of actual performance until the desired consistency is achieved. This method helps to avoid adverse effects associated with excessive one-time addition.
3.7.3 Potential impact of fine-grained soils on long-term shrinkage
Fine-grained soils have a pronounced influence on the long-term shrinkage behaviour of CLSM. Their higher water retention and plasticity can delay moisture evaporation and slow the rate of shrinkage development but may also increase the ultimate shrinkage and the risk of drying shrinkage. The fine particles contribute to improving the microstructure of the material and reducing early-age shrinkage; however, as curing progresses and moisture gradually dissipates, the shrinkage effects of fine-grained soils become more pronounced, potentially resulting in volumetric changes and the formation of microcracks. Therefore, the dosage of fine-grained soils should not be excessively high. Proper control of their content and optimization of the mix design are essential measures to mitigate long-term shrinkage risks in CLSM and to enhance its volumetric stability and durability.
4 Machine learning-based strength prediction
4.1 Light gradient boosting machine (LightGBM) model
Light gradient boosting machine (LightGBM) is an efficient, distributed machine learning framework based on gradient boosting decision trees (GBDTs). Its core concept involves integrating multiple weak learners (typically decision trees) to iteratively optimize the loss function, thereby enhancing the overall predictive capability of the model (Ke et al., 2017).
LightGBM offers numerous advantages for predicting the strength of CLSMs. First, LightGBM possesses strong nonlinear modelling capabilities, enabling it to automatically capture complex feature interactions and nonlinear relationships between strength and factors such as raw material proportions and curing conditions, thus significantly improving prediction accuracy. Second, LightGBM is highly adaptable to the scale and type of features and efficiently manages high-dimensional and categorical variables without the need for extensive data preprocessing, making it suitable for the diverse material parameters involved in CLSM strength prediction. In addition, LightGBM is characterized by fast training speed and low resource consumption, which is particularly advantageous when applying large datasets, allowing for rapid model training and parameter tuning to meet the efficiency requirements of engineering practice. Furthermore, LightGBM incorporates built-in regularization mechanisms and pruning strategies to effectively prevent overfitting and enhance the generalizability of the model. Finally, LightGBM can determine the importance of each feature, helping engineers better understand the key factors influencing CLSM strength and providing a scientific basis for material proportioning and process optimization. In summary, LightGBM, with its efficiency, flexibility, and powerful nonlinear modelling capabilities, is highly suitable for predicting CLSM strength. It can not only improve prediction accuracy but also accelerate model development and deployment, providing robust data support for practical engineering applications.
4.2 Newton‒Raphson-based optimizer (NRBO) method
The predictive performance of LightGBM largely depends on the setting of its hyperparameters, such as the learning rate, number of trees, maximum depth, number of leaves, and number of feature splits. A reasonable combination of parameters can significantly enhance the model’s fitting and generalization capabilities, whereas inappropriate parameter settings may lead to underfitting or overfitting. Therefore, optimizing the hyperparameters of LightGBM is crucial for improving the prediction accuracy of the model.
The Newton‒Raphson-based optimizer (NRBO) is a novel metaheuristic optimization algorithm inspired by the classical Newton–Raphson numerical iteration method. NRBO ingeniously integrates the Newton‒Raphson search rule (NRSR) with the trap avoidance operator (TAO) and models and guides the search process through multiple sets of matrices, achieving an efficient balance between global and local searches and significantly enhancing the global exploration capability and convergence speed (Cheng et al., 2024; Li and Zhu, 2024).
NRBO differs significantly from mainstream optimization algorithms such as particle swarm optimization (PSO), genetic algorithms (GA), and grid search (GS) in terms of optimization mechanisms and application performance. NRBO is based on the Newton–Raphson iterative method, which fully utilizes both the gradient and second-order information of the objective function (Yousef et al., 2025). In contrast, the PSO and GA are population-based intelligent optimization methods that rely primarily on collective cooperation and stochastic search, making them suitable for handling complex, nonlinear, or nondifferentiable problems. GS is an exhaustive search method that sets grid points within the parameter space and traverses all possible parameter combinations; although it is simple and easy to implement, it becomes computationally intensive and inefficient in high-dimensional spaces.
In practical applications, the NRBO algorithm generally achieves faster convergence and higher solution accuracy because of its effective use of mathematical information from the objective function (Cheng et al., 2024). While PSO and the GA demonstrate superior global search capabilities and adaptability to complex problems, they may lag behind NRBO in terms of convergence speed and solution precision and are often sensitive to parameter settings. Although GS can guarantee finding the global optimum, its computational cost becomes extremely high when the parameter space is large or the dimensionality is high, thus limiting its practical application. On the basis of these considerations, NRBO was selected as the optimizer in this study to enhance the efficiency and accuracy of model optimization.
Applying NRBO to LightGBM hyperparameter optimization can fully leverage its advantages in global searching, local fine-tuning, and trap avoidance, helping to obtain better parameter combinations and thus improving the accuracy and stability of LightGBM in prediction tasks such as CLSM strength.
The development process of the machine learning model is shown in Figure 7.
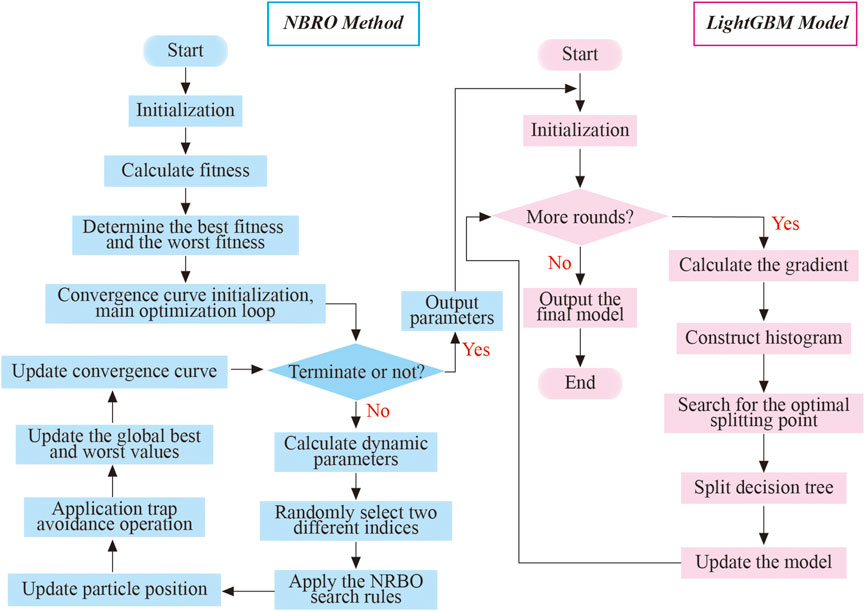
Figure 7. Schematic of the model algorithm implementation process.
4.3 Dataset description
4.3.1 Input and output variables
In this study, the quantities of each component per cubic metre of the material system, including ES, sand, cement, fly ash, water, and superplasticizer, were used as the main input variables. In addition, the curing age, a key factor affecting the development of strength, was also incorporated into the dataset for analysis, with compressive strength as the output variable.
A complete dataset was constructed by integrating the quantities of the components and curing age with the corresponding compressive strength data. To further investigate the relationships between each variable and strength, the Pearson correlation coefficient was employed to quantitatively analyse the correlation between each variable and compressive strength (Zhao et al., 2024a), as shown in Figure 8.
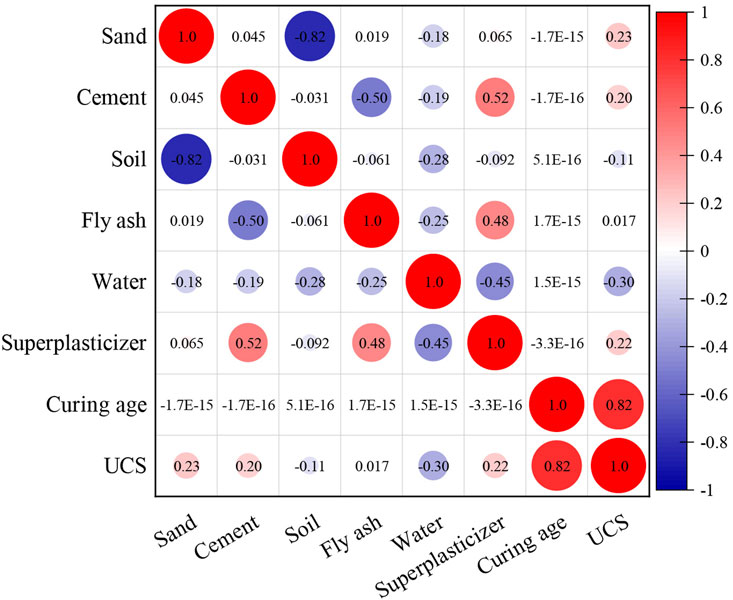
Figure 8. Heatmap of the correlation between the mix proportion parameters and strength.
In this figure, the colour intensity represents the strength of the correlation: red indicates a strong positive correlation, blue indicates a strong negative correlation, and neutral colours represent weak or no correlation. The correlation coefficient ranges from −1 to +1, with values close to ±1 indicating a strong correlation and values near 0 indicating a weak correlation. The results of the analysis reveal that the curing age and UCS are significantly positively correlated, with a coefficient of 0.82, suggesting that the time factor plays a decisive role in the development of UCS, which is consistent with the time-dependent mechanism of cement hydration. The water content is moderately negatively correlated with the UCS (correlation coefficient: −0.30), indicating that excessive water reduces the UCS. Sand content, superplasticizer content, and cement content each display weak positive correlations with UCS, with coefficients of 0.23, 0.22, and 0.20, respectively, suggesting that moderate increases in these components can enhance UCS, although the effect is limited. ES content is very weakly negatively correlated with UCS (correlation coefficient: −0.11), indicating a minor and slightly adverse effect. The fly ash content shows the weakest correlation, with a coefficient of only 0.017, which is almost negligible; this may be related to the insufficient pozzolanic activity of the fly ash at early stages. To ensure that the model fully explores the potential information in the data and enhances its scientific and engineering applicability, all relevant factors were incorporated as features during model construction to determine the composition of the dataset.
After the dataset was compiled, descriptive statistical analysis was conducted on each variable to reflect the distribution characteristics and dispersion of the data. These results are shown in Table 4. To ensure the scientific validity of model training and generalizability, the dataset was randomly divided into a training set and a test set, with the training set, used for model training and parameter optimization, accounting for 80% of the data and the test set, used for evaluating the predictive performance of the model, accounting for 20% of the data.
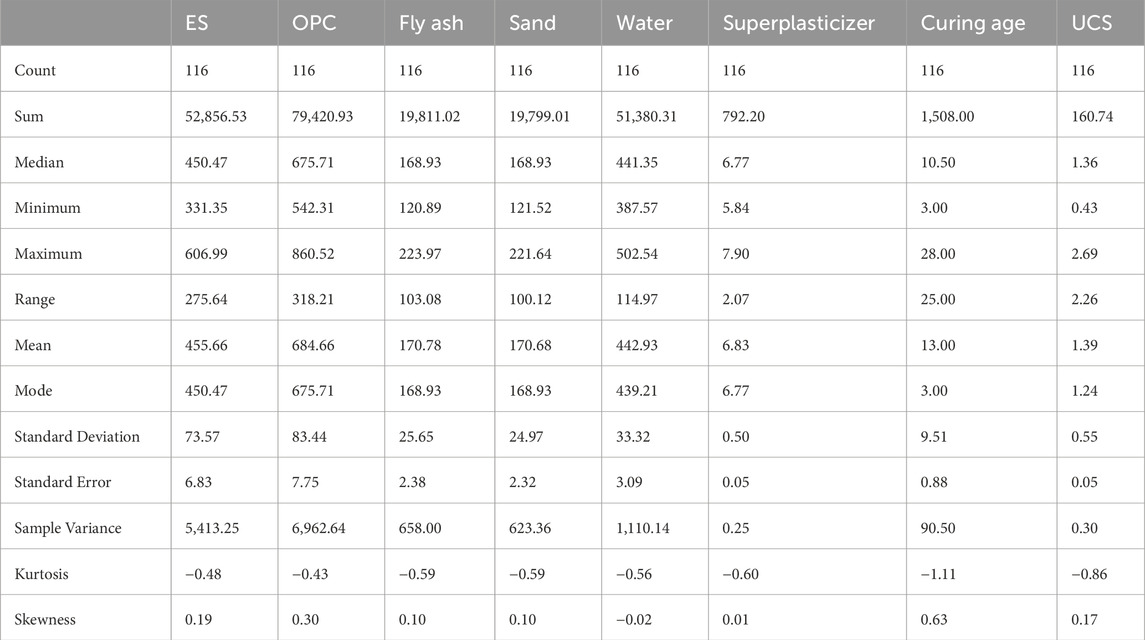
Table 4. Descriptive analysis of the parameters of the experimental dataset.
In addition, during data preprocessing, outliers and missing values were identified and addressed, and all variables were standardized to eliminate the impact of differing units on model training.
4.3.2 Evaluation criteria
The following five metrics were used to evaluate the performance of the model: correlation coefficient (R2), mean square error (MSE), root mean square error (RMSE), mean absolute error (MAE), and mean absolute percentage error (MAPE). Their expressions are as follows (Jueyendah et al., 2021; Nguyen et al., 2022; Adel et al., 2022):
where
4.4 Model parameter setting and optimization
The NRBO algorithm was employed to optimize the key parameters of the LightGBM model, including the number of leaves (num_leaves), learning rate (learning_rate), feature sampling ratio (feature_fraction), data subset sampling ratio (bagging_fraction), and maximum tree depth (max_depth). The specific settings are as follows: the parameter dimension is 5, and the ranges of the five parameters are 1–100, 0.01–0.8, 0.1–1.0, 0.1–1.0, and 1–50, respectively. The number of iterations is 100. The fitness value is subsequently calculated, and the optimal values of the five parameters are determined. The fitness variation curve is shown in Figure 9A.
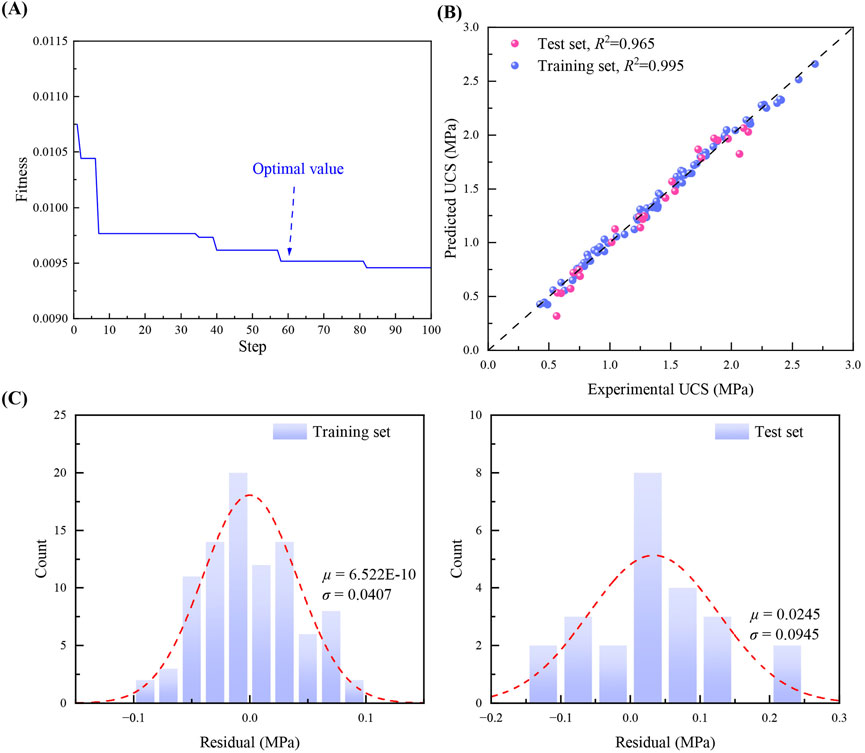
Figure 9. Implementation effectiveness on the dataset of this study: (A) fitness variation curve of the NRBO algorithm on this study dataset; (B) predicted versus experimental values; (C) distribution histogram of the predicted residuals.
After optimization by the NRBO algorithm, the optimal hyperparameter combination for the LightGBM model was obtained as follows: the num_leaves is 98, the learning_rate is 0.7537, the feature_fraction is 0.9998, the bagging_fraction is 0.1785, and the max_depth is 5. The LightGBM model was retrained, and prediction analysis was conducted using this optimized parameter configuration.
4.5 Performance evaluation and analysis of the NRBO-LightGBM model
The developed NRBO-LightGBM hybrid model was used for training and prediction analysis on the dataset, and the prediction results for both the training and test sets were evaluated. Figure 9B shows the comparison between the actual UCS values and the values predicted by the NRBO-LightGBM model, while Figure 9C presents the histogram distribution of the residuals.
The results indicate that the R2 value of best-fit line for the training set reached 0.995, with residuals mainly distributed within the range of [-0.1, 0.1], demonstrating excellent fitting performance and minimal prediction error. For the test set, the R2 value of the best-fit line is 0.966, and the residuals are primarily concentrated in the range of [-0.15, 0.25], indicating that the model also exhibits outstanding generalizability and low prediction error on unseen data.
As shown by the error metrics in Figure 10A, the MSE, RMSE, MAE, and MAPE for the training set are 0.002, 0.040, 0.033, and 2.66%, respectively; the corresponding values for the test set are 0.009, 0.097, 0.074, and 6.92%, respectively. These metrics all demonstrate that the NRBO-LightGBM model exhibits high accuracy and stability in UCS prediction tasks, with prediction errors remaining at low levels for both the training and test sets, effectively meeting the requirements of practical engineering applications.
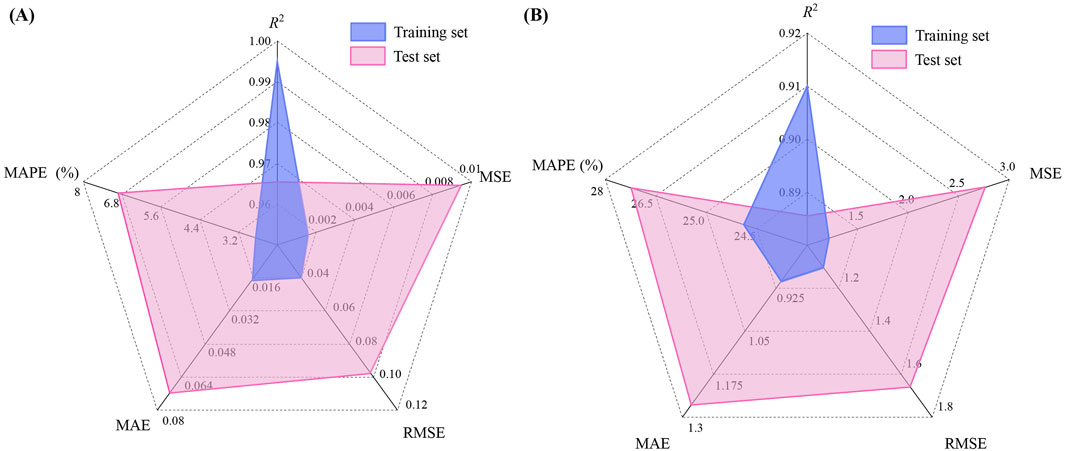
Figure 10. Radar plot of performance metrics for training and test sets: (A) dataset of this study; (B) dataset from the literature.
4.6 Further validation of generalization capability
For further evaluation and verification, the strength data of the CLSMs at 1, 3, 7, and 28 days for 27 different mix proportions, as detailed in Hwang et al. (2017), were collected. In their study, Hwang et al. (2017) utilized wastewater treatment sludge (WTS) as the fine aggregate, with ground granulated blast furnace slag (GGBFS) and fly ash serving as cementing materials and a NaOH solution as the activator. This methodology differs significantly from the present study, particularly in terms of the fine aggregate and mix proportions employed.
The developed NRBO-LightGBM model was applied to this dataset for training and testing. During this process, the optimal hyperparameters identified through NRBO optimization were as follows: num_leaves = 8, learning_rate = 0.2355, feature_fraction = 0.4021, bagging_fraction = 0.3384, and max_depth = 49. The performance of the model is illustrated in Figure 11.
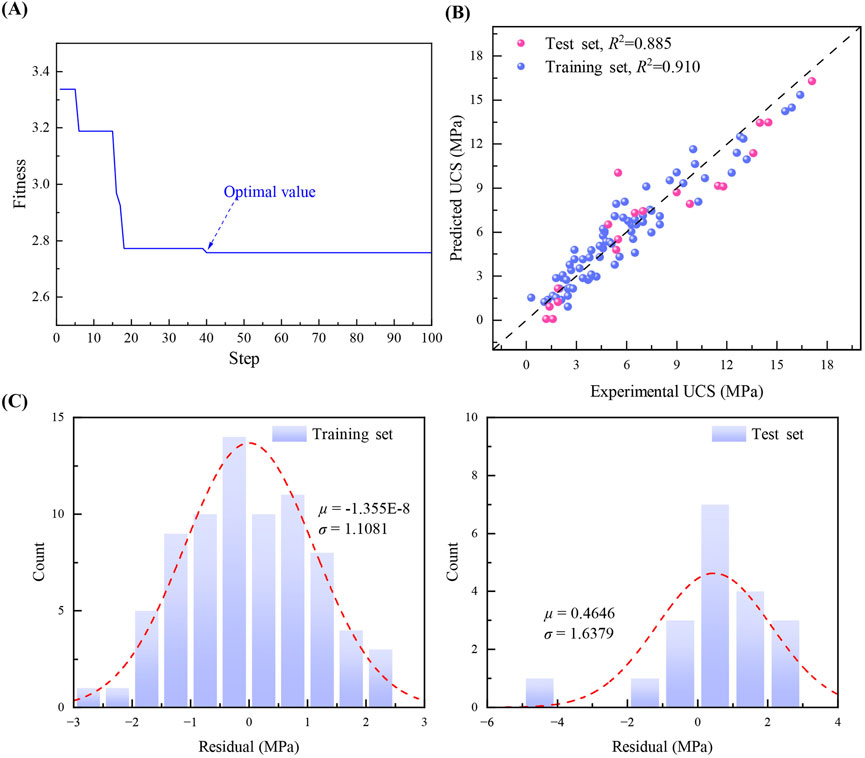
Figure 11. Implementation effectiveness on the dataset from the literature: (A) fitness variation curve of the NRBO algorithm; (B) predicted versus experimental values; (C) distribution histogram of the predicted residuals.
The results show that the R2 value for the training set reached 0.910, with residuals distributed mainly within the range of [−3, 3], indicating excellent fitting performance and relatively small prediction errors. For the test set, the R2 value was 0.885, with residuals primarily concentrated within the range of [−5, 3]. As shown in Figure 10B, the MSE, RMSE, MAE, and MAPE for the training set were 1.212, 1.101, 0.905, and 23.91%, respectively, while the corresponding values for the test set were 2.757, 1.660, 1.263, and 27.24%, respectively. These results indicate that the model’s errors are within an acceptable range and demonstrate good stability and strong generalization capability when tested on data from different sources and backgrounds, suggesting broad application potential.
5 Conclusion
In this study, an easy-to-implement and widely applicable CLSM preparation process was developed, which innovatively utilizes engineering ES in combination with sand, cement, fly ash, and a superplasticizer to prepare CLSMs, thereby efficiently utilizing waste resources. The engineering properties of the developed CLSM were evaluated, the strength development mechanism was elucidated from the perspectives of hydration product evolution and microstructural changes, and a machine learning strength prediction model based on NRBO-LightGBM was established. The main conclusions are as follows:
The CLSM material developed in this study exhibits excellent workability: the flowability ranges from 165 to 257 mm, effectively ensuring the material’s self-compacting and self-levelling properties. The setting time is controlled within 4.6–7.48 h, meeting the requirements for rapid construction. The bleeding rate is only 0.33%–1.28%, which is significantly lower than the standard limit of 5%. The fresh density ranges from 1,880 to 2,005 kg/m3, in compliance with the ACI 229 standard for CLSM fresh density. These results indicate that the CLSM possesses outstanding workability.
The 28-day compressive strength of the CLSM ranges from 1.35 to 2.69 MPa, meeting the requirements of the ACI 229-13 standard. Among them, mixtures with a compressive strength below 2.1 MPa can be used as an excavatable CLSM. The strength development exhibits a distinct staged characteristic, with the 7-day strength reaching 50.6%–69.5% of the 28-day strength, indicating good early-age strength development. Fitting analysis of the relationship between CLSM strength and curing age shows that the hyperbolic model achieves determination coefficients (R2) above 0.98, demonstrating extremely high fitting accuracy for the strength development law.
The microstructure and hydration products of CLSMs undergo significant evolution at different curing ages. In the early curing stage, the structure is loose with numerous cracks and pores, and the formation of hydration products is limited. As the curing time increases, continuous hydration of the cement and fly ash generates large amounts of cementitious substances, which effectively fill the pores and bind the particles, significantly increasing the compactness and strength of the material. XRD and FTIR analyses confirmed the continuous increase in hydration products such as C-S-H and C-A-H gels, leading to a progressively denser structure. Although a higher fly ash content results in a lower early strength, its impact on the compactness and strength in the later stages is minimal. After 28 days, the CLSM exhibited a highly dense structure and significantly improved strength.
The NRBO-LightGBM model achieved an R2 value of 0.995 on the training set, with residuals concentrated in the range of [−0.1, 0.1], indicating excellent fitting performance. For the test set, the R2 value was 0.966, with residuals in the range of [−0.15, 0.25], demonstrating outstanding generalizability. The MSE, RMSE, MAE, and MAPE values for the training set were 0.002, 0.040, 0.033, and 2.66%, respectively, whereas those for the test set were 0.009, 0.097, 0.074, and 6.92%, respectively. Overall, these results indicate that the model has high accuracy and stability for UCS prediction, effectively meeting the requirements of practical engineering applications.
Data availability statement
The original contributions presented in the study are included in the article/supplementary material, further inquiries can be directed to the corresponding author.
Author contributions
HaS: Conceptualization, Methodology, Investigation, Writing – original draft, Resources. XiS: Funding acquisition, Conceptualization, Formal Analysis, Writing – review and editing. XX: Writing – original draft, Investigation. QyZ: Writing – original draft, Investigation. GZ: Writing – original draft, Software, Validation, Visualization, Data curation. YW: Writing – original draft, Validation. QlZ: Writing – original draft, Validation.
Funding
The author(s) declare that financial support was received for the research and/or publication of this article. This research was funded by the university-industry collaborative project titled “Study on the Salt-Frost Resistance and Durability of Composite Green Concrete in Complex Soil Environments of the Northeast Asia Permafrost Region” (Project No. DJ-ZDXM-2023-35).
Conflict of interest
Authors HaS, XX, and QyZ were employed by Ltd.
The remaining authors declare that the research was conducted in the absence of any commercial or financial relationships that could be construed as a potential conflict of interest.
Generative AI statement
The author(s) declare that no Generative AI was used in the creation of this manuscript.
Any alternative text (alt text) provided alongside figures in this article has been generated by Frontiers with the support of artificial intelligence and reasonable efforts have been made to ensure accuracy, including review by the authors wherever possible. If you identify any issues, please contact us.
Publisher’s note
All claims expressed in this article are solely those of the authors and do not necessarily represent those of their affiliated organizations, or those of the publisher, the editors and the reviewers. Any product that may be evaluated in this article, or claim that may be made by its manufacturer, is not guaranteed or endorsed by the publisher.
References
ACI 229-13 (2013). Report on controlled low-strength materials. Farmington Hills, MI, USA: American Concrete Institute.
Adel, H., Palizban, S. M. M., Sharifi, S. S., Ghazaan, M. I., and Korayem, A. H. (2022). Predicting mechanical properties of carbon nanotube-reinforced cementitious nanocomposites using interpretable ensemble learning models. Constr. Build. Mater. 354, 129209. doi:10.1016/j.conbuildmat.2022.129209
ASTM C150/C150M-17 (2017). Standard specification for Portland cement. West Conshohocken, PA, USA: ASTM International.
ASTM C403-23 (2023). Standard test method for time of setting of concrete mixtures by penetration resistance. West Conshohocken, PA, USA: ASTM International.
ASTM C618-19 (2019). Standard specification for coal fly ash and raw or calcined natural pozzolan for use in concrete. West Conshohocken, PA, USA: ASTM International.
ASTM C940-22 (2022). Standard test method for expansion and bleeding of freshly mixed grouts for preplaced-aggregate concrete in the laboratory. West Conshohocken, PA, USA: ASTM International.
ASTM D6023-16 (2016). Standard test method for density (unit weight), yield, cement content, and air content (gravimetric) of controlled low-strength material (CLSM). West Conshohocken, PA, USA: ASTM International.
ASTM D6103-17 (2017). Standard test method for flow consistency of controlled low Strength Material (CLSM). West Conshohocken, PA, USA: ASTM International.
Chang, J., Li, J., Wang, Y., and Zhang, H. (2024). Mechanical characteristics and microstructural changes in phosphogypsum-cement-lime composite modified loess. Case Stud. Constr. Mater. 21, e03881. doi:10.1016/j.cscm.2024.e03881
Cheng, S., Yin, J., and Liu, T. (2024). “Multi strategy improvement of newton-raphson-based optimizer and engineering application,” in 2024 6th international conference on machine learning, big data and business intelligence (MLBDBI), 219–227.
Dalal, P. H., Patil, M., Iyer, K. K. R., and Dave, T. N. (2023). Sustainable controlled low strength material from waste materials for infrastructure applications: State-of-The-art. J. Environ. Manage. 342, 118284. doi:10.1016/j.jenvman.2023.118284
Do, T. M., and Kim, Y. S. (2016). Engineering properties of controlled low strength material (CLSM) incorporating red mud. Int. J. Geo-Eng. 7, 7–17. doi:10.1186/s40703-016-0022-y
Do, T. M., Kim, Y. S., and Ryu, B. C. (2015). Improvement of engineering properties of pond ash based CLSM with cementless binder and artificial aggregates made of bauxite residue. Int. J. Geo-Eng. 6, 8–10. doi:10.1186/s40703-015-0008-1
Du, J., Zhang, L., Hu, Q., Luo, Q., Connolly, D. P., Liu, K., et al. (2024). Characterization of controlled low-strength materials from waste expansive soils. Constr. Build. Mater. 411, 134690. doi:10.1016/j.conbuildmat.2023.134690
Dueramae, S., Sanboonsiri, S., Suntadyon, T., Aoudta, B., Tangchirapat, W., Jongpradist, P., et al. (2021). Properties of lightweight alkali activated controlled low-strength material using calcium carbide residue–fly ash mixture and containing EPS beads. Constr. Build. Mater. 297, 123769. doi:10.1016/j.conbuildmat.2021.123769
Fauzi, M. A., Arshad, M. F., and Nor, N. M. (2021). Statistical models to develop optimised controlled low-strength materials with wastepaper sludge ash. Constr. Build. Mater. 286, 122816. doi:10.1016/j.conbuildmat.2021.122816
Finney, A. J., Shorey, E. F., and Anderson, J. (2008). Use of native soil in place of aggregate in controlled low strength material (CLSM). Int. Pipelines Conf. Atlanta, Ga., 124. doi:10.1061/40994
GB/T 14684-2022 (2022). Sand for construction. Beijing, P.R. China: State Administration for Market Regulation and Standardization Administration of the People's Republic of China.
Ho, L. S., Jhang, B. J., Hwang, C. L., and Huynh, T. P. (2022). Development and characterization of a controlled low-strength material produced using a ternary mixture of Portland cement, fly ash, and waste water treatment sludge. J. Clean. Prod. 356, 131899. doi:10.1016/j.jclepro.2022.131899
Hwang, C. L., Chiang, C. H., Huynh, T. P., Vo, D. H., Jhang, B. J., and Ngo, S. H. (2017). Properties of alkali-activated controlled low-strength material produced with waste water treatment sludge, fly ash, and slag. Constr. Build. Mater. 135, 459–471. doi:10.1016/j.conbuildmat.2017.01.014
Ibrahim, M., Rahman, M. K., Najamuddin, S. K., Alhelal, Z. S., and Acero, C. E. (2022). A review on utilization of industrial by-products in the production of controlled low strength materials and factors influencing the properties. Constr. Build. Mater. 325, 126704. doi:10.1016/j.conbuildmat.2022.126704
Indraratna, B., Rujikiatkamjorn, C., and Sathananthan, I. (2005). Radial consolidation of clay using compressibility indices and varying horizontal permeability. Can. Geotech. J. 42, 1330–1341. doi:10.1139/t05-052
JGJ/T 70-2009 (2009). Standard for test method of performance on building mortar. Beijing, P.R. China: Ministry of Housing and Urban-Rural Development of the People's Republic of China.
Jueyendah, S., Lezgy-Nazargah, M., Eskandari-Naddaf, H., and Emamian, S. A. (2021). Predicting the mechanical properties of cement mortar using the support vector machine approach. Constr. Build. Mater. 291, 123396. doi:10.1016/j.conbuildmat.2021.123396
Kaliyavaradhan, S. K., Ling, T. C., and Guo, M. Z. (2022). Upcycling of wastes for sustainable controlled low-strength material: a review on strength and excavatability. Environ. Sci. Pollut. Res. 29, 16799–16816. doi:10.1007/s11356-022-18511-9
Ke, G., Meng, Q., Finley, T., Wang, T., Chen, W., Ma, W., et al. (2017). Lightgbm: a highly efficient gradient boosting decision tree. Adv. Neural Inf. Process. Syst. 30. Available online at: https://papers.nips.cc/paper/2017/hash/6449f44a102fde848669bdd9eb6b76fa-Abstract.html.
Kim, Y. S., Do, T. M., Kim, H. K., and Kang, G. (2016). Utilization of excavated soil in coal ash-based controlled low strength material (CLSM). Constr. Build. Mater. 124, 598–605. doi:10.1016/j.conbuildmat.2016.07.053
Kuo, W. T., Wang, H. Y., Shu, C. Y., and Su, D. S. (2013). Engineering properties of controlled low-strength materials containing waste oyster shells. Constr. Build. Mater. 46, 128–133. doi:10.1016/j.conbuildmat.2013.04.020
Li, C., and Zhu, Y. (2024). A hybrid butterfly and newton-raphson swarm intelligence algorithm based on opposition-based learning. Clust. Comput. 27, 14469–14514. doi:10.1007/s10586-024-04678-y
Li, Y., Liu, L., Deng, Y., Chen, Y., Li, Y., and Wu, J. (2023). Unlocking the potential of iron ore tailings in controlled low-strength material: feasibility, performance, and evaluation. J. Clean. Prod. 423, 138772. doi:10.1016/j.jclepro.2023.138772
Lim, S., Lee, W., Choo, H., and Lee, C. (2017). Utilization of high carbon fly ash and copper slag in electrically conductive controlled low strength material. Constr. Build. Mater. 157, 42–50. doi:10.1016/j.conbuildmat.2017.09.071
Ling, T. C., Kaliyavaradhan, S. K., and Poon, C. S. (2018). Global perspective on application of controlled low-strength material (CLSM) for trench backfilling-an overview. Constr. Build. Mater. 158, 535–548. doi:10.1016/j.conbuildmat.2017.10.050
Liu, Y., Mo, Z., Su, Y., and Chen, Y. (2022). State-of-the-art controlled low-strength materials using incineration industrial by-products as cementitious materials. Constr. Build. Mater. 345, 128391. doi:10.1016/j.conbuildmat.2022.128391
Maghomi, A., Bakhtiari, M., and Heidari, M. (2022). Stabilization and improvement soils characteristics using natural and industrial additives. Bull. Eng. Geol. Environ. 81, 218. doi:10.1007/s10064-022-02715-x
Nguyen, M. S. T., Trinh, M. C., and Kim, S. E. (2022). Uncertainty quantification of ultimate compressive strength of CCFST columns using hybrid machine learning model. Eng. Comput. 38, 2719–2738. doi:10.1007/s00366-021-01339-1
Pu, S., Zhu, Z., Song, W., Wan, Y., Wang, H., Song, S., et al. (2020). Mechanical and microscopic properties of cement stabilized silt. KSCE J. Civ. Eng. 24, 2333–2344. doi:10.1007/s12205-020-1671-0
Qian, J., Hu, Y., Zhang, J., Xiao, W., and Ling, J. (2019). Evaluation the performance of controlled low strength material made of excess excavated soil. J. Clean. Prod. 214, 79–88. doi:10.1016/j.jclepro.2018.12.171
Salini, U., Parayil, A., Diya, B., and Dev, L. (2023). Use of fly ash and quarry waste for the production of the controlled low strength material. Constr. Build. Mater. 392, 131924. doi:10.1016/j.conbuildmat.2023.131924
Sheen, Y. N., Zhang, L. H., and Le, D. H. (2013). Engineering properties of soil-based controlled low-strength materials as slag partially substitutes to Portland cement. Constr. Build. Mater. 48, 822–829. doi:10.1016/j.conbuildmat.2013.07.046
Wang, C. H., Li, Y. D., Wen, P. H., Zeng, W., and Wang, X. Q. (2023). A comprehensive review on mechanical properties of green controlled low strength materials. Constr. Build. Mater. 363, 129611. doi:10.1016/j.conbuildmat.2022.129611
Yan, D. Y. S., Tang, I. Y., and Lo, I. M. C. (2014). Development of controlled low-strength material derived from beneficial reuse of bottom ash and sediment for green construction. Constr. Build. Mater. 64, 201–207. doi:10.1016/j.conbuildmat.2014.04.087
Yousef, A., Siam, A. I., Barakat, S. I., and Mostafa, R. R. (2025). A novel newton raphson based optimizer for tomato image segmentation. Mansoura J. Comput. Inf. Sci. 20 (1), 23–50. doi:10.21608/mjcis.2025.326655.1008
Zhang, Y., Johnson, A. E., and White, D. J. (2019). Freeze-thaw performance of cement and fly ash stabilized loess. Transp. Geotech. 21, 100279. doi:10.1016/j.trgeo.2019.100279
Zhao, G., Pan, X., Yan, H., Tian, J., Han, Y., and Guan, H. (2024a). Predicting engineering properties of controlled low-strength material made from waste soil using optimized SVR models. Case Stud. Constr. Mater. 20, e03325. doi:10.1016/j.cscm.2024.e03325
Zhao, G., Pan, X., Yan, H., Tian, J., Han, Y., Guan, H., et al. (2024b). Utilization of high fine-grained shield tunnel spoil in CLSM and effect of foam agent content on properties. Constr. Build. Mater. 423, 135836. doi:10.1016/j.conbuildmat.2024.135836
Zhao, G., Pan, X., Yan, H., Tian, J., Han, Y., Guan, H., et al. (2024c). Optimization and characterization of GGBFS-FA based alkali-activated CLSM containing Shield-discharged soil using box-behnken response surface design method. Case Stud. Constr. Mater. 21, e03800. doi:10.1016/j.cscm.2024.e03800
Keywords: controlled low-strength material (CLSM), excavated soil, strength mechanism, flowability, machine learning, hydration products
Citation: Sun H, Su X, Xi X, Zhao Q, Zhao G, Wei Y and Zhang Q (2025) Engineering properties, strength mechanisms, and machine learning-based strength prediction of controlled low-strength materials prepared with excavated soil. Front. Mater. 12:1673682. doi: 10.3389/fmats.2025.1673682
Received: 26 July 2025; Accepted: 09 September 2025;
Published: 19 September 2025.
Edited by:
Jie Xu, Tianjin University, ChinaCopyright © 2025 Sun, Su, Xi, Zhao, Zhao, Wei and Zhang. This is an open-access article distributed under the terms of the Creative Commons Attribution License (CC BY). The use, distribution or reproduction in other forums is permitted, provided the original author(s) and the copyright owner(s) are credited and that the original publication in this journal is cited, in accordance with accepted academic practice. No use, distribution or reproduction is permitted which does not comply with these terms.
*Correspondence: Xiaoping Su, dG1fc3hwQGNjaXQuZWR1LmNu