 Yi Guo1,2*
 Rong Wang3
- 1Yibin Housing and Urban-Rural Development Administration of Sichuan Province, Yibin, China
- 2College of Resources and Environment, Southwest University, Chongqing, China
- 3Yibin Xuzhou District Natural Resources and Planning Bureau of Sichuan Province, Yibin, China
As excellent peroxydisulfate (PDS) activators to degrade antibiotics, metallic nanoparticles (NPs) suffer from continuous ion leakage and declined efficiency. Herein, graphene coated nickel (Ni@G) NPs with 23.9–28.5 nm of Ni core and 7.9–2.1 layers of graphene shell were regulated via laser ablation in ammonia solution. Ni@G-loaded biochars (Ni@G/Bs) with developed porosity (23.8–145.7 m2/g) were prepared via crosslinking Ni@G with biochars derived from the pyrolysis of rice hull at 300 °C, 450 °C and 600 °C. By investigating the effects of catalyst species and dosage, PDS dosage, tetracycline concentration, circumstance temperature and coexisting anions, Ni@G/Bs presented k values of 0.0094–0.0301 min−1 for tetracycline degradation which were 47.0–81.5 fold enhancement than biochars. 7.26–3.61 μg/L of nickel ion leakage for 1st-5th cycles verified the excellent stability of Ni@G/Bs. Paracetamol (72.4%), ciprofloxacin (76.7%) and aureomycin (68.2%) could be degraded, showing a superior versatility of Ni@G/Bs. Free radical degradation pathway involving •OH, •SO4− and •O2− governed the degradation mechanism. While the non-free radical pathway mediated by 1O2 should not be ignored. This study paved a way for adjusting laser-ablated core/shell NPs and provided a new insight for integrating metal NPs and biochars to efficiently degrade antibiotics.
1 Introduction
With the continuous improvement of people’s living standards, antibiotics have been widely used in human medical care, livestock and poultry and aquaculture (Danner et al., 2019). A large amount of antibiotics are discharged into water and soil systems in their original state and metabolites. Antibiotics also lead to the drug resistance of pathogenic microorganisms. It poses a serious threat to the ecological environment and human health. Antibiotics can not only cause drug resistance of bacteria, but also have potential toxicity to other organisms (Lyu et al., 2020; Shao et al., 2021; Andersson and Hughes, 2012). Among various types of antibiotics, tetracycline (TC) in the form of prototype or metabolite is easy to migrate, spread and accumulate. Traditional treatment strategies for tetracycline include physical approach (e.g., physical adsorption, coagulation, and membrane filtration), chemical approach (e.g., electrolysis, reduction and oxidation) and biological approach (e.g., anaerobic or aerobic biodegradation via biologically interaction with microorganisms) (Choi et al., 2008; Zikalala et al., 2023; Abazari et al., 2019; Jeon et al., 2018; Vatanpour et al., 2025). Among these strategies, physical ones suffer from the incomplete removal efficiency, while biological ones are restricted by the damped degradation efficiency and large amounts of sludge (Lu and Liu, 2024; Ishaque et al., 2024).
Advanced oxidation methods including Fenton, ozonation, electrochemistry, photocatalysis and activated persulfate are significant superiority in the degradation of TC and its multiple intermediates (Liu et al., 2023; Merel et al., 2017; Zammit et al., 2020; Cai et al., 2021; Vaz-Moreira et al., 2022). Fenton method is usually used in homogeneous and heterogeneous systems, and combined with UV radiation to enhance the oxidation process. However, the narrow pH range of operation and the large amount of iron sludge produced limit its wide application (Haider et al., 2023). Although ozone oxidation method does not produce a large number of secondary pollution products, it is not suitable for the large-scale application because of high cost of equipment maintenance and operation, the large amount of energy required, the low mass transfer, the extreme pH dependence and the potential ecological toxicity of wastewater (Brillas, 2025). Electrochemical degradation is an effective, universal, economical, simple and clean technology, which is suitable for treating toxic wastewater containing high concentrations of antibiotics. However, its degradation efficiency depends on the properties and structure of electrode materials, electrolyte composition, applied current and diffusion rate of substrate to anode active site. Low flow rate and high operating cost limit the application of electrochemical methods (Bunnasit et al., 2024). Photocatalytic operation is simple and energy-saving. Whereas, existed mass transfer limitation is affected by catalyst dosage, light wavelength, radiation intensity, pH value and water quality (Kaur et al., 2025). Moreover, the consumed catalyst needs a special treatment or recovery, resulting in higher total cost. Activated persulfate has an excellent oxidation ability. Compared with the active substances (such as •OH) produced by conventional advanced oxidation process, •SO4− produced by persulfate presents higher oxidation-reduction potential and longer half-life, which enables it to deeply mineralize refractory pollutants in water with relatively low operating cost and strong adaptability to operating environment (Matzek et al., 2018). Therefore, persulfate oxidation technology has the potential for further development in practical application.
Metal nanoparticles (NPs) are the most commonly used activators for the heterogeneous activation of persulfate. However, the leakage and agglomeration of metal NPs would reduce the catalytic efficiency (Sotiriou et al., 2014). Encapsulation of these metal NPs via separating shells is highly desirable. For various coating shell materials including oxides and polymers, graphene has attracted more attention due to its excellent electron conduction and chemical/thermal stability. Compared with other encapsulation systems including oxides and polymers, graphene has extremely low resistivity, and electrons can move efficiently in it, making it an ideal conductive coating material (Xiao et al., 2024; Amendola and Meneghetti, 2009). This characteristic makes graphene shell have a wide application potential in electric and electronic components with a lowest impact on catalysis. Graphene shells can function as (electro) chemically protective layers on metallic active sites to prevent the oxidation and maintain the intrinsically superior activity during long-term catalysis (Xie et al., 2021). Among multiple types of techniques applied for the preparation of core/shell nanostructure, it is challenging to regulate the core/shell NPs with desirable nanostructure and property. Laser ablation in liquid provides an easy way to produce NPs in solution, decreasing experimental complexity while simultaneously increasing the integrity and stability of the pure NPs. Laser ablation in liquid is a green method, which means it is in accordance with the 12 principles of sustainable green chemistry (Riedel et al., 2020). Even the greenest method of wet chemistry nanoparticle synthesis requires complex purification and separation from the remaining metal salts in solution. Stabilizers are needed to avoid aggregation and agglomeration and can influence the properties and behavior of the NPs, especially in biological systems. Whereas, laser ablation in liquid provides a simple one-step synthesis of NPs in a clean solution without heavy-metal salts and the addition of stabilizers. Moreover, the shape and average particle size of laser ablated NPs could be well controlled in recent years (Amendola and Meneghetti, 2009). Although laser ablation technique has shown great advantages in the field of nanoparticle generation, it still faces many challenges in practical applications. For instance, the sharp rise of local temperature during laser ablation causes problems such as heat loss and thermal stress of materials, which affects the stable preparation of nanomaterials (Shaheen and Abdelwahab, 2025). In the mass production and industrial application, many variables in laser ablation such as the stability of laser beam and the uniformity of different material batches would affect the consistency of synthesis quality (Naser et al., 2019). Although the research of laser ablation technology in laboratory scale has made remarkable progress, how to extend it to large-scale high-quality production while maintaining cost-effectiveness and synthesis efficiency is still a problem to be solved. Taken together, laser ablation is one of the fastest, cheapest and cleanest synthesis methods among all the nanoparticle production techniques. So far, the preparation of graphene-coated metal NPs via laser ablation has seldom reported. Besides the stabilization of metal NPs via the encapsulation, the combination metal NPs with porous carriers to prevent the agglomeration and promote the capture efficiency of TC is also crucial. Among different carriers including carbon nanotubes, graphene and activated carbon, biochars (Bs) derived from agricultural and forest residuals have obtained considerable attention due to their much lower cost and larger production amount (Oleszczuk et al., 2016).
The combustion of rice hulls is usually an incomplete oxidation process due to its high ash content. The efficiency of C conversion in the pyrolysis process is as low as 55% (Pode, 2016). Therefore, the residue is a mixture of ash and a high carbon biochar. The yield and C content of produced biochar from rice hull combustion are both around 35%. Some common properties of rice hull-biochars are compared to properties of biochars derived from rice straw, corn cob, wood, bagasse, tea waste and grape pomace under the same pyrolysis conditions such as peak temperature (Asadi et al., 2021). Rice hull-biochar has higher content of silicon compared to corn cob biochar. Rice hull-biochars have lower pH values compared to most of other biochars (i.e., biochars produced from rice straw, corn cob, wood and grape pomace). Ash contents of rice hull-biochars are significantly higher than other biochars, while C contents of rice hull-biochars are lower than other investigated biochars. Rice hull, as the main byproduct of the rice milling process, is produced in huge quantities in a global scale, especially in Asia. Considering that rice hull on average contributes to around 20% of paddy rice weight, the annual global production of rice hull is a huge amount. Burning of rice hull in open fields is a common land management practice used by farmers. This would result in the loss of nearly all C, around 80% of sulphur and N, and 10%–20% of phosphorus and potassium contents of rice hull (Kordi et al., 2024). Since the biochar production from underutilized wastes is regarded as an efficient approach to achieve sustainable agriculture and environment in recent years, rice hull has been recognized as a valuable resource for the production of biochar as a soil amendment. Thus, rice hull was applied as the precursor of biochar matrix in this work from the view of rice hull waste usage.
In this work, multilayered graphene coated nickel (Ni@G) NPs were fabricated with the regulation of core/shell nanostructure using pulsed laser ablation in ammonia-containing solution. Bs were prepared from the pyrolysis of ammonia-soaked rice hull at three temperatures including 300 °C, 450 °C and 600 °C, respectively. Then Ni@G NPs-loaded Bs (Ni@G/Bs) were prepared using the crosslink of glutaraldehyde. The morphology, elemental distribution, crystalline structure, porous structure of Ni@G NPs and Ni@G/Bs were characterized. Effects of catalyst species, catalyst dosage, peroxydisulfate (PDS) dosage, TC concentration, circumstance temperature and coexisting anions on the degradation behaviors of TC were systematically evaluated. Reusability for 5 cyclic usage were studied. Degradation of TC in four water systems as well as of three other pharmaceuticals were carried out to evaluate the versatility. By analyzing free radical quenching and determining active free radical, the degradation mechanism was clarified.
2 Materials and methods
2.1 Materials
Ammonia solution, urea, graphite powder, nickel powder, TC, L-histidine, methanol (MeOH), tertiary butyl alcohol (TBA), tempol and PDS were purchased from Sigma-Aldrich Co., Ltd. Rice hull was collected from a local rice field. All the chemicals were used as received without any further purification.
2.2 Fabrication of Ni@G/Bs
Fabrication of laser ablated Ni@G NPs: nickel powder (i.e., 10, 20 and 30 g) were mixed with graphite powder (i.e., 10 g) respectively via a ball milling at 350 rpm for 12 h. The obtained three powder mixtures were filled in plate moulds with a pressure of 10 MPa to achieve three composite plates respectively. The fabrication process was in Figure 1. Composite plate was set onto a rotating platform (10 rpm continuously) in a vessel filled with ammonia solution (100 mL). Pulsed laser (Nd:YAG, INNOLAS) was focused onto the plate (5 cm to the surface of water). The pulse energy was 100 mJ, the repetition rate was 10 Hz, the pulse duration was 7 ns, the spot size was 2 mm, and the wavelength was 1,064 nm. After 10 min of ablation, aminated Ni@G NPs were fabricated and separated from solution through centrifuge at 14,000 rpm. Ni@G-1, Ni@G-2, and Ni@G-3 were derived from the laser ablation of the above three pressed plates, respectively.

Figure 1. Scheme for the preparation of Ni@G/Bs. Fabrication of Ni@G NPs by pulsed laser ablation in solution (a). Preparation of Bs via pyrolysis (b). Preparation of Ni@G/Bs via crosslinking (c).
Synthesis of Ni@G/Bs: After thorough wash and dry, collected rice hull was crushed and pass through sieve (200 mesh), and then immersed into urea-containing solution (1.0 g/L) overnight. Rice hull separated from urea-solutions were dried at 80 °C and heated in a tube furnace at 300 °C, 450 °C and 600 °C for 2 h with a heating rate of 5 °C/min under nitrogen atmosphere. As-prepared products were termed as Bs including B300, B450 and B600 respectively according to their pyrolysis temperature. Bs were grinded and sieved through 200 mesh, and blended with Ni@G-3 NPs with the mass ratio of 9:1. Then glutaraldehyde (1.0 mol%) was added to the above dispersed solution and heated at 40 °C for 6 h. Obtained products were rinsed thoroughly to remove residual glutaraldehyde and named as Ni@G/B300, Ni@G/B450, and Ni@G/B600, respectively.
2.3 Characterization
Scanning electron microscopy (SEM, Zeiss Ultra55 system, Carl Zeiss NTS GmbH, Oberkochen, Germany) and transmission electron microscopy (TEM, Hitachi H7000) were applied to observe the morphology of Ni@G NPs and NiFe@G/Bs. Energy-dispersive X-ray spectroscopy equipped on a TEM (Hitachi SU8600) was sued to determine the elemental species and ratios. X-ray diffraction (XRD) instrument (D6 Advance X-ray diffractometer, Bruker, Germany) was applied to analyze the crystalline structures of samples. Magnetic properties of samples were investigated at via a Physical Property Measurement System (PPMS-6) (Quantum Design, United States) with a vibrating sample magnetometer (VSM). Specific surface area (SA) and porosity were measured via a 3H-2000PM (Beishide Instrument Technology (Beijing) Co., Ltd.) at 77 K. Raman spectra were analyzed via a NRS-104 (JASCO) at the excitation wavelength of 532 nm. X-ray photoelectron spectroscopy (XPS) were recorded via an ESCALAB Mark II system (VG Scientific). Electron paramagnetic resonance (EPR) was applied to identify the species of free radicals.
2.4 Degradation experiments
Ni@G/Bs composed of Ni@G-3 NPs and Bs (i.e., B300, B450 and B600) were used in the subsequent catalytic experiments. Degradation behaviors of Ni@G ()/Bs were investigated under multiple conditions including catalyst species (B300, B450, B600, Ni@G/B300, Ni@G/B450 and Ni@G/B600), catalyst dosage (0.02, 0.04, 0.06 and 0.08 g/L), PDS dosage (0.2, 0.5, 1.0 and 2.0 g/L), TC concentration (10, 20, 30, 40 and 50 mg/L), circumstance temperature (15o, 25o, 35o, and 45o) and coexisting anions (Cl−, SO42−, HCO3−, H2PO4−, and NO3−). Pre-dispersion of Ni@G/Bs were added to the mixed solution of TC and PDS. During the degradation process, solid/liquid mixture of 3 mL was moved from the above mixed solution and filtered via a nylon filter (0.45 μm) rapidly. Quencher Na2S2O3 solution (0.1 mol/L) was added fast to the filtered suspension. Concentration of TC was measured via UV–vis spectrophotometer at 357 nm. Degradation ratio (η, %) was calculated as: η = (C0-Ct) V/m × 100%. Moreover, the recycling usage of Ni@G/B600 for 5 cycles was carried out. Degradation performances in various water systems deionized water, tap water, Yangtze river water and Dongting lake water were also performed.
3 Results and discussion
3.1 Characterization of Ni@G NPs
As SEM images illustrated in Figures 2a–c, laser-ablated Ni@G NPs were distributed uniformly. From Ni@G-1 NPs to Ni@G-3 NPs, the sizes of NPs presented a declined trend roughly. TEM images of Ni@G NPs were shown in Figures 2d–f to observe the detailed core/shell nanostructure more clearly. Each particle was spherical in shape and separated with each other by a well-coated shell without any exposure of cores. EDS mappings of Ni@G-3 NPs in Figures 2j–m exhibited a clear carbon shell coated nickel core nanostructure.
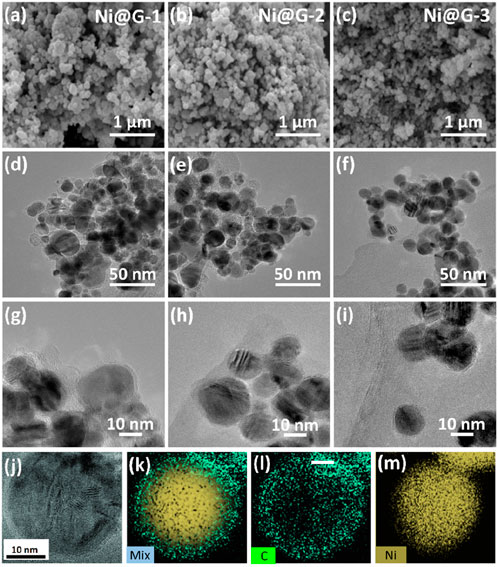
Figure 2. SEM images and TEM images of Ni@G-1 (a,d,g), and Ni@G-2 (b,e,h) and Ni@G-3 (c,f,i). EDS mappings of Ni@G-3 NPs (j–m).
Distributions of nickel core diameter and graphite shell thickness were fitted using a Gauss function. The typical fitting regions of Ni@G-1, Ni@G-2 and Ni@G-3 were shown in Figures 2d–f. The fitted average core diameters of nickel were 23.9 ± 0.5 nm for Ni@G-1 NPs, 25.2 ± 0.7 nm for Ni@G-2 NPs, and 28.5 ± 0.8 nm for Ni@G-3 NPs (Figure 3a). The fitted average shell thicknesses of carbon were 2.66 ± 0.04 nm for Ni@G-1 NPs, 2.01 ± 0.03 nm for Ni@G-2 NPs, and 1.03 ± 0.05 nm for Ni@G-3 NPs (Figure 3b). Divided by the theoretical distance of graphite layers of 0.335 nm, the average layer number of coating shells were 7.9 for Ni@G-1 NPs, 6.0 for Ni@G-2 NPs and 2.1 for Ni@G-3 NPs. Thus, laser ablated Ni@G NPs could be named as multilayered graphene coated nickel NPs. Diffraction peaks of Ni@G NPs in Figure 3c exhibited a peak at 26.5o, which was attributed to the (002) reflection of graphite. Typical peaks located at 45.1o, 52.3o and 77.4o were attributed to the (110), (200) and (220) reflections of nickel (JCPDS No.03-1051) (Ahghari et al., 2020). SA values of Ni@G NPs fabricated by pulsed laser ablation in liquid were 52.6, 46.2 and 42.5 m2/g (Figure 3d), presenting sufficient which could provide abundant surface available positions to participate catalytic reactions. The saturation magnetization values were 55.8 emu/g for Ni@G-1, 71.8 emu/g for Ni@G-2 and 87.7 emu/g for Ni@G-3 (Figure 3e). The increasing saturation magnetization values should be due to the decreasing thickness of multilayered graphene shells over nickel cores. Moreover, aminated Ni@G NPs presented an excellent dispersion property in aqueous solutions with the assistance of sonication as illustrated in the inset image of Figure 3e. Dispersed Ni@G NPs could be separated from aqueous solutions within 20 s with an applied external magnetic field, exhibiting a favorable magnetic property. Since the intensity ratio of D band and G band (ID/IG) in Raman spectrum is commonly used to determine the quality of carbonaceous materials, ID/IG values of Ni@G NPs were 0.894 for Ni@G-1, 0.827 for Ni@G-2 and 0.787 for Ni@G-3 (Figure 3f). It is indicated that the extent of defectives in Ni@G NPs tended to be less as the graphite mass ratio in precursors decreased.
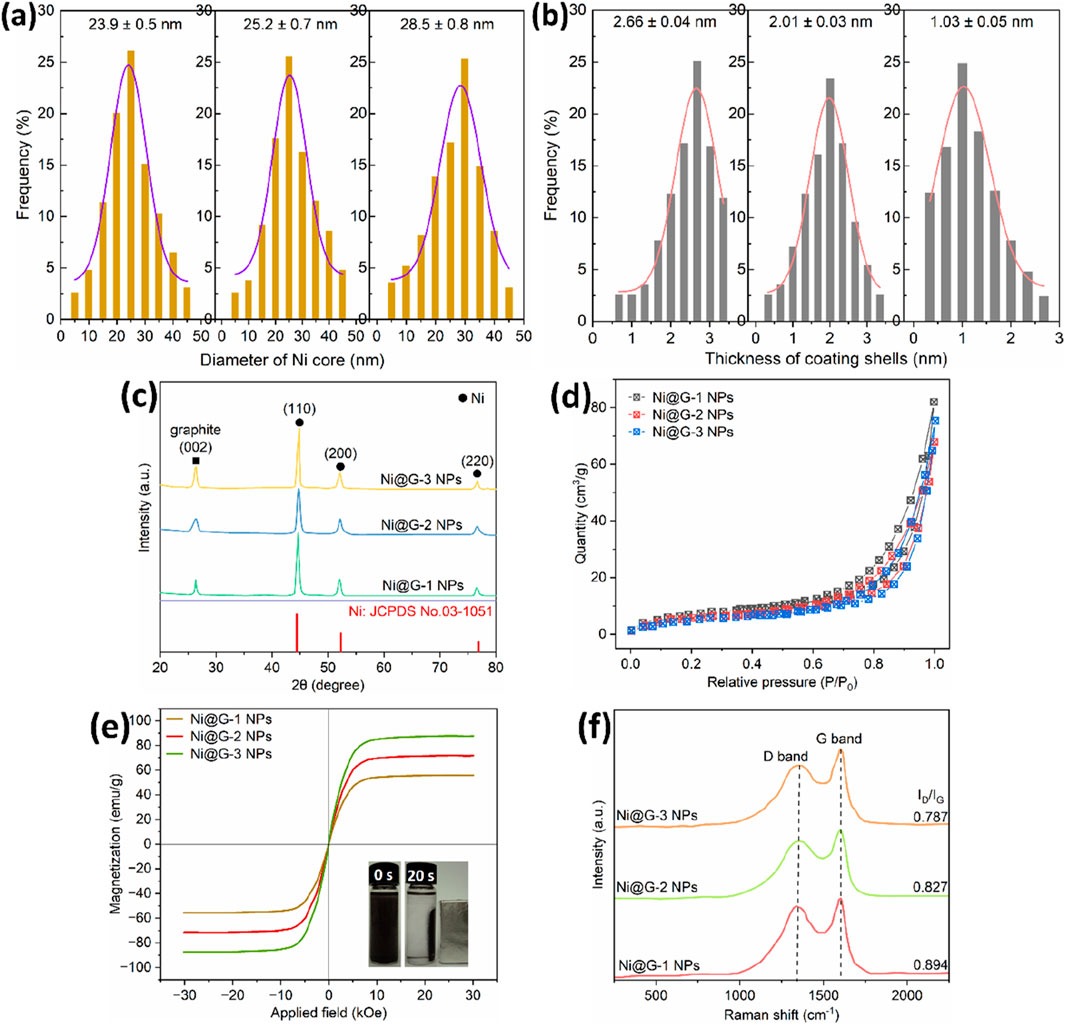
Figure 3. Distribution diagrams of Ni core diameter (a) and shell thickness (b). XRD pattern (c). N2 adsorption/desorption isotherms (d). Magnetic hysteresis loop (e). Raman spectrum (f).
Regulation of core diameter and shell thickness of Ni@G NPs was explained as following. Firstly, as the laser arrived to the surface of plate precursors, the mixtures of nickel and graphite would be gasified instantaneously. During the full collision of gasified atoms, carbon atoms would dissolve into the nickel crystals because of the high dissolution of carbon in nickel in high temperature region. Secondly, as the NPs entered the cooling region, carbon atoms would be precipitate from nickel crystals because of the declined dissolubility of carbon in nickel crystals. Thirdly, the precipitated carbon atoms would form graphene coating shell over nickel carbide due to the catalysis of nickel. Then multilayered graphene coating shells would be produced with the continuous precipitation/catalysis process. Meanwhile, ammonia molecules would be dissociated and activated by high-energy laser to form a NH3 plasma region as NH3 + e → NH2 + H + e, and NH3 + e → NH + H + H + e (Zang et al., 2023). Finally, Ni@G NPs entered this plasma region would be grafted with activated NH2 and NH onto the surface of Ni@G NPs as amino groups.
As shown in Supplementary Figure S5a, k values for Ni@G NPs in the presence of PDS were 0.0045 min−1 for Ni@G-1, 0.0061 min−1 for Ni@G-2, 0.0078 min−1 Ni@G-3, respectively. As the thickness of Ni@G NPs from 7.6 graphene layers to 2.1 graphene layers, Ni@G presented a enhanced catalytic activity. A graphene-coated metallic catalyst consists of two parts: the coating shell and the encapsulated metallic core. The catalytic activity depends on how much the surface is activated by the encapsulated inner NPs and also how much the surface is enriched with electrons coming from the inner NPs. This is strongly related to the thickness of the coating shell. A simple DFT calculation of the thickness effect of a graphene layer showed that the electrons of the inner NPs can traverse up to three carbon layers before the effect becomes too weak (Yu et al., 2020; Deng et al., 2017). Thus, the shell surface is not likely to be activated if the layer number is greater than three. A better choice is to reduce the thickness of the coating shell to below three layers. If the coating shell is too thin it may also bring the risk of low catalytic durability in harsh reaction environments. The catalytic durability of Ni@G NPs was evaluated by rinsing Ni@G NPs with ethonal as shown in Supplementary Figures S5b–d. k values for the degradation of TC by Ni@G-1 NPs decreased as 24.2% (1st cycle)-18.3% (5th cycle) for Ni@G-1, 31.2% (1st cycle)-24.8% (5th cycle) for Ni@G-2 and 42.5% (1st cycle)-36.7% (5th cycle) for Ni@G-3. In such cases, a layered graphene shell less than three graphene layers would provide a good balance of the catalytic activity and durability. Therefore, Ni@G-3 NPs would be more appropriate to present an efficient catalytic performance.
3.2 Characterization of Ni@G/Bs
Figure 4 exhibited the morphologies of Ni@G/Bs. For B300 (Figures 3a,b), the pristine structure of rice hull was remained well and the surface was intact. As the pyrolysis temperature increased from 300 °C to 600 °C, the pyrolysis content of rice hull increased (Figures 3e,f,i,j). The pristine morphology of rice hull tended to be less kept and the surface tended to be less smooth with more voids. With the addition of Ni@G NPs before the pyrolysis of rice hull, nano-sized NPs were clearly presented on the surface as well as the holes of Bs. Moreover, the particle of Ni@G/Bs tended to be less agglomerated, which may be attributed to the more developed surface area and porosity of Bs with increasing pyrolysis temperature.
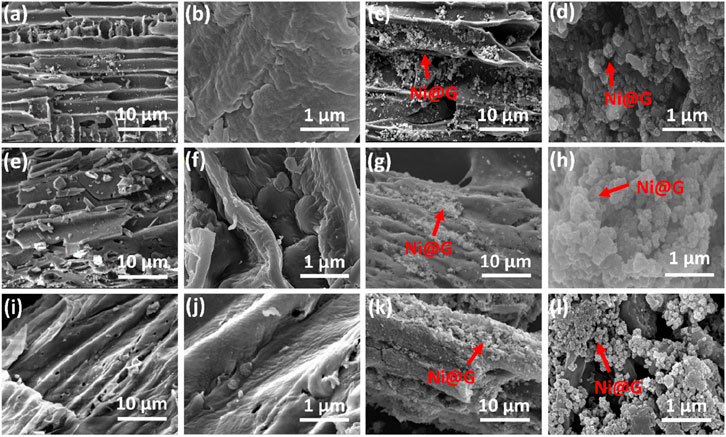
Figure 4. SEM images of B300 (a,b), Ni@G/B300 (c,d), B450 (e,f), Ni@G/B450 (g,h), B600 (i,j), and Ni@G/B600 (k,l).
As shown in Figure 5a, diffraction peaks at 45.1o, 52.3o and 77.4o attributed to the (110), (200) and (220) reflections of Ni were clearly observed, which was attributed to the attached Ni@G-3 NPs on the surface of Bs. A broad peak located from 10o to 30o was displayed in the XRD patterns of Ni@G/Bs, which was ascribed to Bs. It is worth noting that the intensities or areas of these broad peaks decreased as the pyrolysis temperature increased from 300 °C to 600 °C. Higher pyrolysis content of rice hull with higher temperature would remove more aromatic substance in precursor. Specific SA values of Ni@G/Bs were 23.8 m2/g for Ni@G/B300, 63.1 m2/g for Ni@G/B450 and 145.7 m2/g for Ni@G/B600 (Figure 5b).
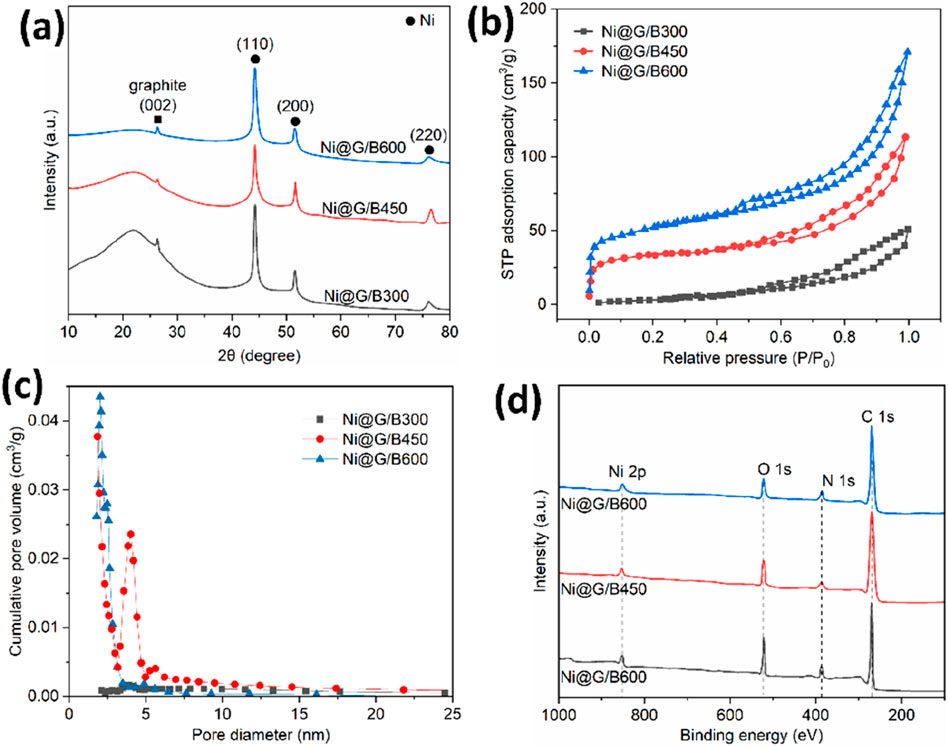
Figure 5. XRD curves (a), N2 adsorption/desorption isotherms (b), pore size distribution curves (c) and XPS curves (d) of Ni@G/Bs.
The average pore size of Ni@G/Bs decreased with the pyrolysis temperature of rice hull as shown in Figure 5c. As the pyrolysis temperature of rice hull increased from 300 °C to 600 °C, the volume of micropores increased as 0 cm3/g for Ni@G/B300, 0.0324 cm3/g for Ni@G/B450, and 0.1346 cm3/g for Ni@G/B600. This enhancement should be attributed to the enhancement of micropore volume from 0 cm3/g for Ni@G/B300, 0.0351 cm3/g for B450, and 0.1415 cm3/g for B600. More micropores would be produced in biochar matrix pyrolyzed at higher temperature. The average diameter of particles decreased significantly from 14.9 nm to 7.9 nm as listed in Table 1. The total pore volumes of Ni@G/Bs presented an obvious enhancement from 0.0416 cm3/g to 0.2795 cm3/g. Elements on the surface of Ni@G/Bs determined using XPS exhibited four typical elements including C, O, N and Ni on the XPS survey spectra of Ni@G/Bs (Figure 5d). Thus, the above results showed that Ni@G NPs were successfully integrated on the surface of Bs as Ni@G/B composites.
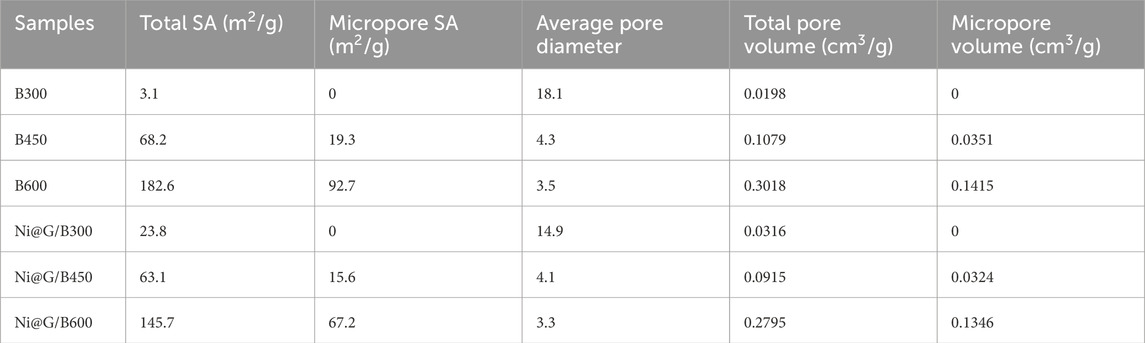
Table 1. SA, pore volume and pore diameter of Ni@G/Bs.
3.3 Degradation behavior study
3.3.1 Effect of catalyst species on degradation
As shown in Figure 6a, k values of Bs were 0.0002 min−1 for B300, 0.0002 min−1 for B450, and 0.0004 min−1 for B600. Compared with the degradation of B300, B450 and B600, Ni@G/Bs presented higher efficiencies for the degradation of TC as well as more distinctive activation abilities of PDS. k values of Ni@G/Bs were 0.0094 min−1 (Ni@G/B300), 0.0163 min−1 (Ni@G/B450) and 0.0301 min−1 (Ni@G/B600), which were 47.0- to 81.5-fold enhancement than those of Bs. The combination of Ni@G-3 NPs with porous Bs could achieve the efficient degradation of TC. Thus, the effective carry of Ni@G-3 NPs on Bs with developed SA and porosity would promote the degradation efficiency significantly. Ni@G/B600 was applied as the typical catalyst in following experiments.
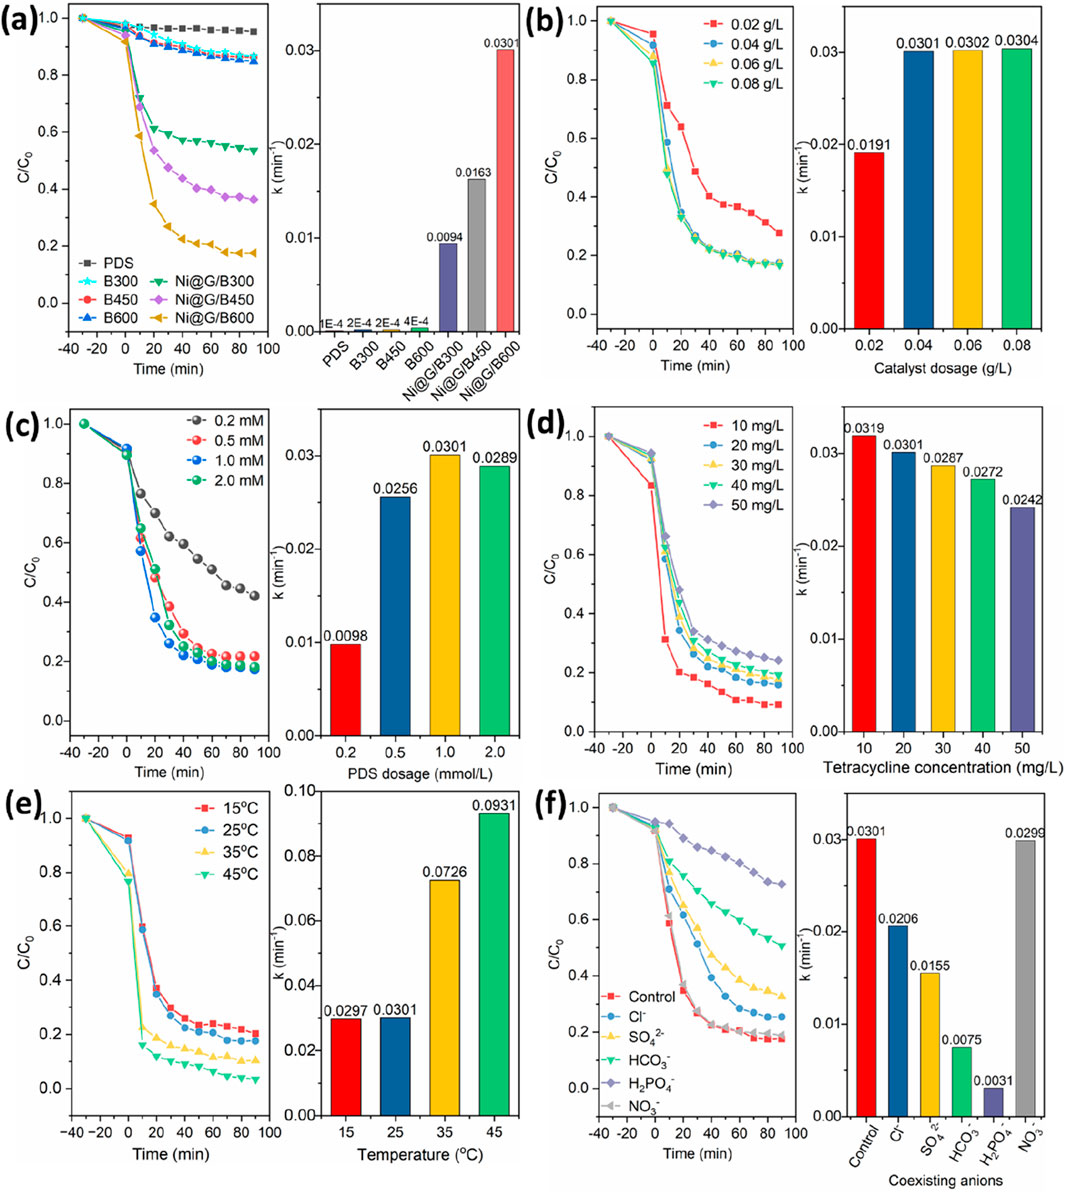
Figure 6. Effects of catalyst species (a), catalyst dosage (b), PDS dosage (c), TC concentration (d), temperature (e), and coexisting anions (f) on the degradation behaviors of Ni@G/Bs.
As shown in Supplementary Figure S6, the removal ratios of TC by physically mixed Ni@G-3 + B300, Ni@G-3 + B450 and Ni@G-3 + B600 with a mass ratio of 9:1 for Ni@G-3:Bs were 18.1%, 24.4% and 31.8%, respectively. k values for Ni@G-3/PDS + Bs/PDS were 0.0036 min−1 for Ni@G-3 + B300, 0.0040 min−1 for Ni@G-3 + B450, 0.0053 min−1 Ni@G-3 + B600, respectively. k values for Ni@G-3/PDS were 0.078. It is indicated that the catalytic degradation performances of physically mixed Ni@G + Bs were obviously lower than those of Ni@G/Bs in the presence of PDS. Therefore, it is believed that the synergistic integration of Ni@G NPs and Bs with developed porosity enabled the high-efficiency degradation of TC.
The catalytic degradation performances of TC by Ni@B300, Ni@B450 and Ni@B600 were shown in Supplementary Figure S2. k values of Ni/Bs were 0.0104 min−1 for Ni/B300, 0.0213 min−1 for Ni/B450, and 0.0383 min−1 for Ni/B600. Compared with the degradation of B300, B450 and B600, Ni/Bs presented higher efficiencies for the degradation of TC than Ni@G/Bs. However, the degradation ratio decreased to 3.9% after the degradation time of 90 min as shown in Supplementary Figure S3. The catalytic recycling stability of Ni@B600 was much weaker than that of Ni@G/B600. It was demonstrated that the graphene shell promoted the recycling usage performance of catalysts significantly.
3.3.2 Effect of catalyst dosage on degradation
Since more available reaction sites would be provided by catalysts with higher dosages, it is necessary to investigate the effect of Ni@G/B600 dosage on the degradation performances. As shown in Figure 6b, when the dosage of Ni@G/B600 increased from 0.02 g/L to 0.04 g/L, the degradation rate of TC increased obviously from 71.4% to 82.8%, and the corresponding rate constant k also increased from 0.0191 min−1 to 0.0301 min−1. This enhancement should be ascribed to the increasing catalytic active sites of reaction with increased dosage of Ni@G/B600. However, when the dosage of Ni@G/B600 was further increased from 0.04 g/L to 0.08 g/L, the reaction rate constant k kept stably with slight changes. The concentration of PDS in the system was limited and it was almost completely consumed within 10 min after the start of the reaction. Hence, the dosage of Ni@G/B600 was set to 0.04 g/L for subsequent experiments.
3.3.3 Effect of PDS concentration on degradation
As shown in Figure 6c, for the concentration of PDS of 0.2, 0.5, 1.0 and 2.0 mmol/L with the dosage of Ni@G/B600 of 0.04 g/L, the degradation efficiency of TC within 90 min was 59.3%, 78.4%, 83.3% and 80.2%, respectively. For 0.2–1.0 mmol/L of PDS, the corresponding rate constant increases from 0.0098 min−1 to 0.0301 min−1. When the concentration of PDS was low, the increase of PDS concentration would lead to the generation of more free radicals. However, as the concentration of PDS increased to 2.0 mmol/L, Ni@G/B600 + PDS system slightly inhibited the removal of TC. The number of free radicals would not be further increased with increasing PDS concentration because of the competitive inhibition when the concentration of PDS was high. The negative effect of excessive PDS may be that the number of active sites excited by PDS is limited. A large number of free radicals react with each other to produce •SO5− with weak oxidation ability as following: HSO5− + •SO4− → •SO5− + SO42− + H+, •SO4− + •SO4− → S2O82− (Wang et al., 2016).
The concentration of PDS was set to 1.0 mmol/L for subsequent experiments.
3.3.4 Effect of TC concentration on degradation
Effect of TC concentration on the degradation performance of Ni@G/B600 was illustrated in Figure 6d. For the initial TC concentration of 10 mg/L, the degradation efficiency of TC was as high as 91.4% within 30 min. As the initial TC concentration increased to 50 mg/L, the degradation efficiency decreased to 74.3%. The degradation rate of TC decreased with the increasing TC initial concentration due to the limited active sites of Ni@G/B600. Lower initial concentration of TC would induce a larger proportion of TC molecules to occupy the active sites, resulting in a higher degradation efficiency. Thus, 20 mg/L of the initial TC concentration was applied to carry out the following degradation study.
3.3.5 Effect of temperature on degradation
Figure 6e illustrated the effect of solution temperatures on the degradation of TC by Ni@G/B600 activated PDS. With the increase of temperature from 15 °C to 45 °C, the degradation efficiency of TC by Ni@G/B600 activated PDS within 90 min was 83.3%, 85.3%, 90.2% and 96.4%, respectively. The degradation ratio of TC was accelerated with the increase of temperature. Increasing temperature would promote the activation of PDS by Ni@G/B600, thus accelerating the degradation of TC.
The effect of initial concentration of reactants on initial reaction rate in the catalytic degradation of most organic compounds can be described by Langmuire-Hinshelwood model. Langmuire-Hinshelwood model is r0 = -dc/dt = kr K Ceq/(1 + K ceq), where r0 (mg/(Ls)) is the initial reaction rate, ceq (mg/L) is the concentration of reactants in solution at the sorption equilibrium, K is the equilibrium constant, kr (s−1) is the apparent reaction rate constant of catalytic reaction. This equation could be expressed as 1/r0 = 1/krK·1/ceq + 1/kr. The initial rate of the whole reaction process could be obtained using the sorption equilibrium constant (K = 0.0313) and catalytic degradation reaction rate constant (kr = 0.0301). K and kr were obtained from sorption experiment and catalytic degradation experiment. The relation of initial TC concentration with initial reaction rate was shown in Supplementary Figure S7. Firstly, the reaction rate increased with the increase of initial concentration. When the initial concentration increased to 60 mg/L, the increase of equilibrium sorption capacity and degradation rate began to slow down. It is indicated that the reaction rate did not change much when Ni@G/B600 approached the maximum sorption capacity. It could be inferred that the whole catalytic reaction was actually controlled by the amount of TC adsorbed on the catalyst surface.
3.3.6 Effect of coexisting anions on degradation
Inorganic anions exist in the actual water environment inevitably. These anions can react with generated active free radicals quickly, affecting the degradation efficiency of TC. Effect of several common coexisting inorganic anions (including Cl−, SO42−, HCO3−, H2PO4− and NO3−) on the degradation of TC was exhibited in Figure 6f. The inhibition degree of various inorganic anions on the removal of TC was in the order of H2PO4− > HCO3− > SO42− > Cl−. The existence of Cl− partially inhibited the degradation of TC in Ni@G/B600 + PDS system. The degradation ratio decreased to 15.4%, which may be due to the consumption of free radicals by Cl− and the generation of weakly oxidizing substances. For the addition of SO42−, the degradation efficiency of TC decreased to 60.3%, which may be mainly due to the existence of SO42− leading to the reduction of the oxidation-reduction potential of •SO4−/SO42−. It is worth noting that Ni@G/B600 activated PDS only removed 41.2% of TC within 90 min in the presence of HCO3−, which showed an obvious inhibition. HCO3− could react with •SO4− and •OH produced by PDS to generate CO3−, which leads to the decrease of •SO4− and •OH in the system, and further reduces the ability of the system to degrade TC. For the addition of H2PO4−, the removal ratio of TC decreased to 22.2%, because H2PO4− occupied the active center of Ni@G/B600 and produced •H2PO4− with low redox potential.
3.4 Recycling stability and generality evaluation
Recycling usage of catalyst is a crucial factor to assess the potential ability in real applications. The catalysts were regenerated via the rinse with ethanol to recover and prolong their catalytic activity. As shown in Figure 7a, Ni@G/B600 showed a good degradation performance in its initial use with a degradation ratio of 75.9%. Its degradation efficiency gradually decreased with the increase of cycle times, i.e., 75.9% for the second cycle, 75.3% for the third cycle, 74.5% for the fourth cycle, 74.2% for the fifth cycle, 73.1% for the sixth cycle, 71.2% for the seventh cycle, 70.8% for the eighth cycle, 69.8% for the ninth cycle, and 68.7% for the tenth cycle. Thus, Ni@G/B600 exhibited a good reusability for the degradation of TC. The reduced recycling performance of Ni@G/B600 may be due to the lack of activity of some active centers and the accumulation of intermediate products on the catalyst surface. In addition, the dosage of Ni@G/B600 was small (i.e., 0.04 g/L) in this study, which would induce a weight loss in the recovery, leading to the decrease of active sites. Therefore, the reduction of these active sites during the degradation of TC by Ni@G/B600 activated PDS leads to the decrease of TC removal rate. Moreover, the characterizations of Ni@G/B600 including TEM, XPS, and Raman after 10 cycles were presented in Supplementary Figure S4. Ni@G/B600 after 10 cycles still presented typical spherical shape with few-layered graphene shell and spherical Ni core. The chemical state of Ni after 10 cycles confirmed by XPS was still Ni0. Moreover, the defects or disordered content (ID/IG) of Ni@G-3 NPs increased slightly from 0.787 to 0.795. The above results would verify that the graphene shell effectively prevented the oxidation of Ni core during the degradation, presenting an excellent structural and compositional stability.
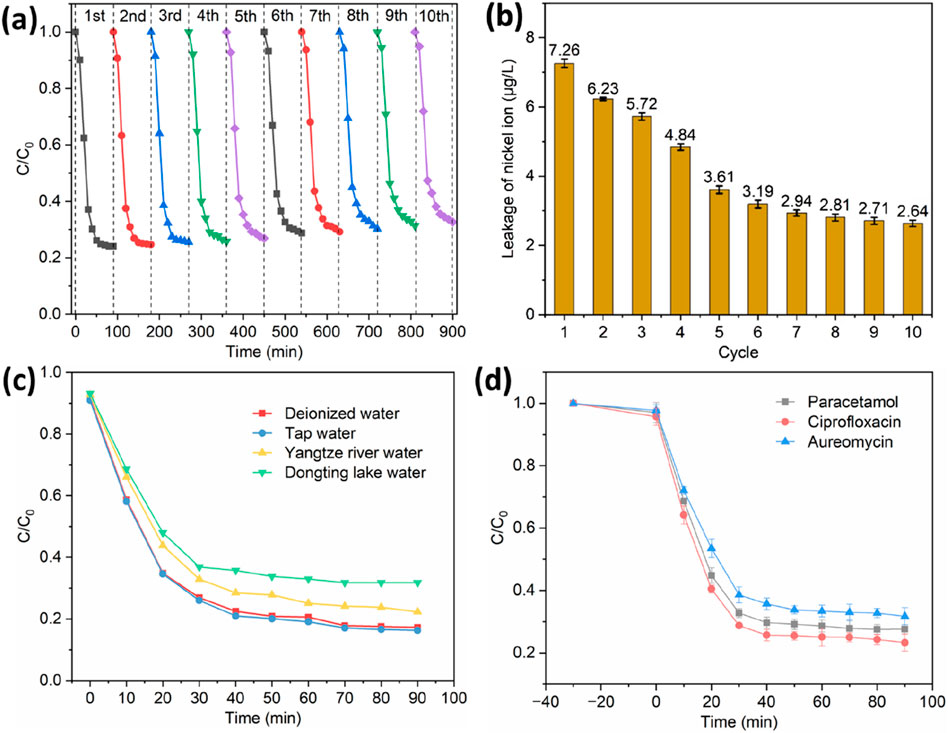
Figure 7. Reusability for the degradation of TC by Ni@G/B600 (a). Leakage of nickel ion of Ni@G/B600 for 10 cyclic usage (b). Degradation of TC by Ni@G/B600 in various background waters (c). Degradation of paracetamol, ciprofloxacin and aureomycin by Ni@G/B600 (d).
Leakage of nickel ions during 10 cycles was shown in Figure 7b. The concentrations of existed nickel ions were low (7.26–2.64 μg/L), which were obviously lower than 1.0 mg/L (the safety standards of Chinese national standard GB 5749-2022 for industrial wastewater). Ni would interfere with the life process of aquatic plants, and then may cause the species structure changes of aquatic plant communities in polluted waters. When aquatic plants such as duckweed, potamogeton crispus, elodea nuttallii and ceratophyllum were cultured at the concentration of 0.25 mg/L Ni2+, the potential photosynthetic rate of these plants decreased by 1.3–2.2 times on the fifth day (Maleva et al., 2004). The toxicity of zooplankton in Ni exposure experiment showed that the reproduction rate decreased and the mortality of offspring increased (Pereira et al., 2018). Ni could also inhibit the growth and development of benthos (Crémazy et al., 2020). The physiological function of fish would also be affected by the exposure of Ni. Its toxicity was mainly manifested in growth inhibition (skeletal deformity), organ failure and increased incidence of cancer (Flipkens et al., 2021).
Since the compounds with lower ionization potential values were more vulnerable to ROS attack, the lowest ionization potential of TC suggested that it was the easiest to be degraded among the three target compounds. Gaussian calculations predicted that the chemical bonds with low energies were susceptible for oxidation (Li et al., 2020). Integrating the results of theoretical calculation and those of UV–vis spectra, three-dimensional fluorescence spectroscopy, gas chromatography-mass spectrometry and ion chromatography, the degradation pathways of antibiotics were figured out, mainly including hydroxylation, decarboxylation, dealkylation, and ring-opening reactions (Ling et al., 2022). Moreover, for the degradation of paracetamol, several intermediate compounds including hydroquinone, benzoquinone, p-aminophenol and p-nitrophenol were formed (Rosman et al., 2018). Upon catalytic degradation of aromatic amide (PAM), some aromatic compounds (p-aminophenol and p-nitrophenol) were produced and eventually mineralized. PAM oxidation occured also through an alternative deacylation mechanism involving the formation of p-aminophenol that was easily oxidized to p-nitrophenol, which in turn was converted into hydroquinone and nitrocatechol. These latter intermediates were oxidized to low molecular weight carboxylic acids with some alkane and alkene character (Moctezuma et al., 2012).
The degradation performances of Ni@G/B600 in deionized water, tap water, Yangtze river water and Dongting lake water were determined as illustrated in Figure 7c. 77.7% and 68.2% of TC were degraded in Yangtze River water and Dongting lake water, which were lower than those in other two water systems (82.7% and 83.7%). This decrease of degradation efficiency in Yangtze River water and Dongting lake water should be attributed to the wide presence of HCO3− and H2PO4− in these natural waters. Since antibiotics have been widely exited in clinical medicine wastewater, animal husbandry wastewater and aquaculture wastewaters, HCO3− and H2PO4− are commonly existed in these wastewaters, showing an inhibition effect for the degradation of TC.
The potential of Ni@G/B600 in real applications was evaluated by degrading paracetamol, ciprofloxacin and aureomycin. As shown in Figure 7d, 72.4% of paracetamol, 76.7% of ciprofloxacin and 68.2% aureomycin were removed at 90 min. It is demonstrated that Fe@G/B600 + PDS system exhibited an excellent versatility in the degradation of pharmaceuticals and personal care products.
3.5 Mechanism elucidation
Quenching experiment of free radicals was performed to analyze the active oxygen species in the degradation process as shown in Figure 8a. The type of active free radicals including surface-bound free radicals, surface-bound oxides, •O2−, 1O2, •OH, and •SO4− can be recognized via inhibiting of added quencher. Specifically, •OH was quenched by TBA, •OH and •SO4− were quenched by MeOH, and 1O2 was quenched by Tempol (Wang et al., 2021). For the addition of MeOH into the system, the degradation rate of TC decreased from 83.3% to 42.2%. For the addition of TBA, the degradation rate of TC decreased to 72.2%, which indicated that •SO4− played a more crucial role then •OH in the in the degradation of TC in PDS activated by Ni@G/B600. For the addition of Tempol, the degradation rate of TC decreased to 52.85%, indicating that the formation of •O2− promoted the degradation of TC in the reaction system of Ni@G/B600 and PDS. Thus, the reactivity of electron-rich center of •O2− was limited, which leaded to the poor effect of direct degradation of pollutants by •O2−. It is deduced that •O2− may not directly affect the degradation of TC, but participate in the process of producing 1O2. Therefore, the decrease of degradation efficiency after adding Tempol may be caused by inhibiting the formation of 1O2 in the reaction system, which further affected the degradation process of TC (Fang et al., 2023). For the addition of L-histidine, the degradation efficiency of Ni@G/B600 activated PDS was only 33.1%, proving the crucial role of 1O2 for the degradation of TC. The above results demonstrated that the degradation of TC by Ni@G/B600-activated PDS was mainly attributed to non-free radicals even both free radicals and non-free ones acted together.
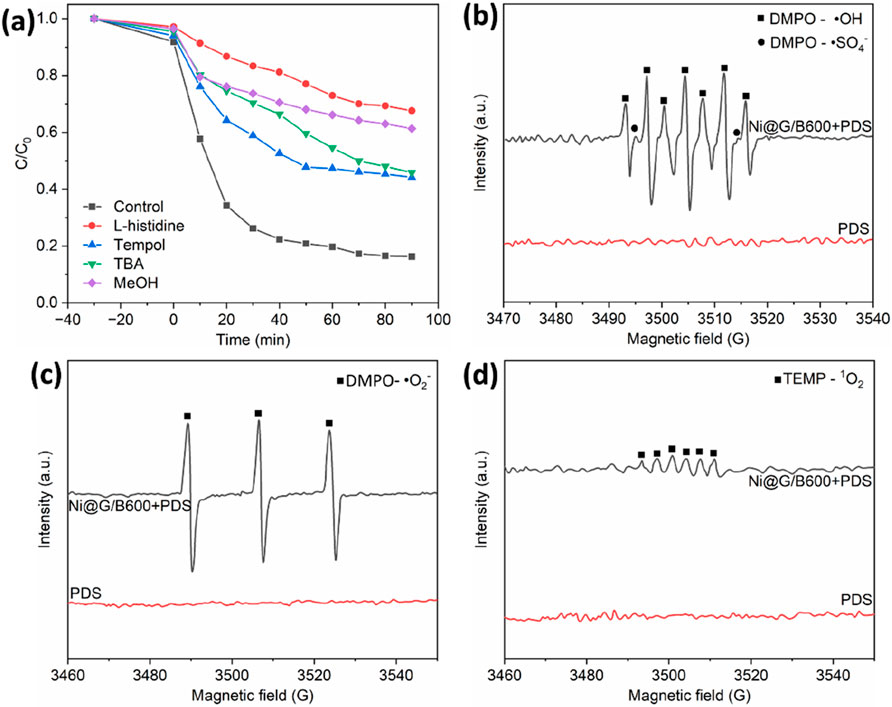
Figure 8. Free radical scavenging experiment (a). EPR spectra of different experimental conditions: DMPO (H2O)-•SO4− and •OH (b), DMPO-•O2− (c) and TEMP-1O2 (d).
To further confirm the scavenging results, DMPO was used as the spin trapping agent for •O2−, •OH, and •SO4−, and TEMP was used as the spin trapping agent for 1O2. The species of reactive oxygen species were further detected by EPR. As shown in Figure 8b, EPR signal was not detected for the addition of DMPO to the coexistence system of PDS and TC. On the contrary, two obvious EPR signals were observed for the coexistence system of Ni@G/B600, TC and PDS, which were attributed to DMPO-•OH and DMPO-•SO4−. Degradation efficiency was significantly enhanced within 10 min, indicating that Ni@G/B600 could activate PDS to produce •OH and •SO4−.
As displayed in Figure 8c, the effect of •O2− should not be ignored due to the weak DMPO-•O2− signal intensity. Moreover, a strong triple peak of characteristic signal of TEMP-1O2 was clearly presented (Figure 8d), which further proved the main reaction substance of 1O2 in the degradation process of TC. EPR results show that Ni@G/B600 activated PDS system involved three free radical (i.e., •O2−, •OH, and •SO4−) and one non-free radical (1O2) pathway. The role of non-free radical pathway was emphasized, which was mutually confirmed with the experimental results of free radical capture. Semi-quantitative analysis of the types, contribution ratios and reaction pathways of reactive oxidants (ROS) in advanced oxidation reaction system is crucial for exploring the degradation process and specific mechanism of organic pollutants. Wang et al. applied the probe-based kinetic model to evaluate the contributions of •OH, •SO4−, •O2− and 1O2 in Co3O4@CNTs activated peroxymonosulfate as an example (Wang et al., 2023). Iit is unlikely that 1O2 will overwhelm •SO4− for sulfonamide abatement unless the concentrations (or exposures) of 1O2 are many orders of magnitude higher than those of •SO4−. However, this condition is possibly unrealistic in most persulfate-based advanced oxidation processes (PS-AOPs). Although significant 1O2 can be generated from carbon material catalyzed PDS decomposition, 1O2 will be quickly quenched back to the ground state by water. The rate constant for 1O2 decay in water is ∼3.0 × 10⁵ s− 1 (Wilkinson et al., 1995), leading to an extremely short lifetime of 1O2 in water (∼4 μs). Therefore, accumulation of 1O2 to high concentrations during the PS-AOPs is unlikely. Besides carbon material catalyzed PMS decomposition, some studies have suggested that 1O2 can be generated from the oxidation or disproportionation of •O2− during the PS-AOPs. However, the concentrations of •O2− in water are typically very low due to the rapid disproportionation of •O2−. Moreover, the disproportionation of •O2− actually does not generate 1O2, but the ground state O2 (Wunsch et al., 2021). Therefore, the formation of 1O2 from •O2− may not be significant in PS-AOPs. Although the concentrations of 1O2 can be 101–102 times higher than those of •SO4− and •OH during the PS-AOPs, second-order rate constants for the reaction of 1O2 with most pollutants are several orders of magnitude lower than those of •SO4− and •OH.
4 Conclusion
In summary, the core/shell nanostructure of laser-ablated Ni@G NPs were successfully regulated as 23.9–28.5 nm for nickel core and 7.9–2.1 layers for multilayered graphene shell by changing the mass ratio of nickel/graphite in plate precursor. Aminated Ni@G NPs exhibited less defects (0.894–0.787 of ID/IG), improved magnetic properties (55.8–87.7 emu/g), high SA (52.6–42.5 m2/g), and dispersion property. Ni@G/Bs with developed porosity (23.8–145.7 m2/g) were prepared via crosslinking Ni@G NPs and Bs. k values of Ni@G/Bs were 0.0094 min−1 (Ni@G/B300), 0.0163 min−1 (Ni@G/B450) and 0.0301 min−1 (Ni@G/B600), which were 47.0- to 81.5-fold enhancement than those of Bs under the conditions including 0.04 g/L of catalyst dosage, 1.0 mmol/L of PDS dosage, 20 mg/L of TC concentration, and 25 °C of circumstance temperature. Ni@G/B600 presented a favorable reusability with a reduced degradation ratio of 75.9%–43.3% for 5 cycles. 7.26–3.61 μg/L of nickel ion leakage for the 1st-5th cycles verified the excellent stability of Ni@G/B600. Moreover, 72.4% of paracetamol, 76.7% of ciprofloxacin and 68.2% aureomycin could be degraded by Ni@G/B600, showing a superior versatility. Free radical degradation pathway involving •OH, •SO4− and •O2− was the dominant mechanism in Ni@G/Bs-activated PDS system. Non-free radical pathway mediated by 1O2 in the degradation of TC should not be ignored. This study broadened the regulation of laser-ablated core/shell NPs as well as the integration of NPs and biochar for the efficient degradation of antibiotics.
Data availability statement
The raw data supporting the conclusions of this article will be made available by the authors, without undue reservation.
Author contributions
YG: Writing – original draft, Validation, Data curation, Writing – review and editing, Investigation, Methodology, Conceptualization. RW: Writing – review and editing, Resources.
Funding
The author(s) declare that financial support was received for the research and/or publication of this article. We acknowledge the support from the Sichuan Provincial Key Research and Development Project (grant number 23JBGS3706).
Conflict of interest
The authors declare that the research was conducted in the absence of any commercial or financial relationships that could be construed as a potential conflict of interest.
Generative AI statement
The author(s) declare that no Generative AI was used in the creation of this manuscript.
Any alternative text (alt text) provided alongside figures in this article has been generated by Frontiers with the support of artificial intelligence and reasonable efforts have been made to ensure accuracy, including review by the authors wherever possible. If you identify any issues, please contact us.
Publisher’s note
All claims expressed in this article are solely those of the authors and do not necessarily represent those of their affiliated organizations, or those of the publisher, the editors and the reviewers. Any product that may be evaluated in this article, or claim that may be made by its manufacturer, is not guaranteed or endorsed by the publisher.
Supplementary material
The Supplementary Material for this article can be found online at: https://www.frontiersin.org/articles/10.3389/fmats.2025.1683737/full#supplementary-material
References
Abazari, R., Mahjoub, A. R., Sanati, S., Rezvani, Z., Hou, Z., and Dai, H. (2019). Ni–Ti layered double hydroxide@graphitic carbon nitride nanosheet: a novel nanocomposite with high and ultrafast sonophotocatalytic performance for degradation of antibiotics. Inorg. Chem. 58, 1834–1849. doi:10.1021/acs.inorgchem.8b02575
Ahghari, M. R., Soltaninejad, V., and Maleki, A. (2020). Synthesis of nickel nanoparticles by a green and convenient method as a magnetic mirror with antibacterial activities. Sci. Rep. 10, 12627. doi:10.1038/s41598-020-69679-4
Amendola, V., and Meneghetti, M. (2009). Laser ablation synthesis in solution and size manipulation of noble metal nanoparticles. Phys. Chem. Chem. Phys. 11, 3805–3821. doi:10.1039/b900654k
Andersson, D. I., and Hughes, D. (2012). Evolution of antibiotic resistance at non-lethal drug concentrations. Drug Resist. Updat. 15, 162–172. doi:10.1016/j.drup.2012.03.005
Asadi, H., Ghorbani, M., Rezaei-Rashti, M., Abrishamkesh, S., Amirahmadi, E., Chen, C., et al. (2021). Application of rice husk biochar for achieving sustainable agriculture and environment. Rice Sci. 28, 325–343. doi:10.1016/j.rsci.2021.05.004
Brillas, E. (2025). Degradation/mineralization of bisphenol A from aqueous matrices by single and combined electrochemical advanced oxidation processes. A review. Sep. Purif. Technol. 357, 130170. doi:10.1016/j.seppur.2024.130170
Bunnasit, S., Thamsirianunt, K., Rakthabut, R., Jeamjumnunja, K., Prasittichai, C., and Siriwatcharapiboon, W. (2024). Sensitive portable electrochemical sensors for antibiotic chloramphenicol by tin/reduced graphene oxide-modified screen-printed carbon electrodes. ACS Appl. Nano Mater. 7, 267–278. doi:10.1021/acsanm.3c04388
Cai, Y., Sun, T., Li, G., and An, T. (2021). Traditional and emerging water disinfection technologies challenging the control of antibiotic-resistant bacteria and antibiotic resistance genes. ACS ES T Eng. 1, 1046–1064. doi:10.1021/acsestengg.1c00110
Choi, K. J., Kim, S. G., and Kim, S. H. (2008). Removal of antibiotics by coagulation and granular activated carbon filtration. J. Hazard. Mater. 151, 38–43. doi:10.1016/j.jhazmat.2007.05.059
Crémazy, A., Brix, K. V., Smith, D. S., Chen, W., Grosell, M., Schlekat, C. E., et al. (2020). A mystery tale: nickel is fickle when snails fail-investigating the variability in Ni toxicity to the great pond snail. Environ. Asses. 16, 983–997. doi:10.1002/ieam.4300
Danner, M. C., Robertson, A., Behrends, V., and Reiss, J. (2019). Antibiotic pollution in surface fresh waters: occurrence and effects. Sci. Total Environ. 664, 793–804. doi:10.1016/j.scitotenv.2019.01.406
Deng, J., Deng, D., and Bao, X. (2017). Robust catalysis on 2D materials encapsulating metals: concept, application, and perspective. Adv. Mater. 29, 1606967. doi:10.1002/adma.201606967
Fang, Q., Yang, H., Ye, S., Zhang, P., Dai, M., Hu, X., et al. (2023). Generation and identification of 1O2 in catalysts/peroxymonosulfate systems for water purification. Water Res. 245, 120614. doi:10.1016/j.watres.2023.120614
Flipkens, G., Blust, R., and Town, r.m. (2021). Deriving nickel (Ni(II)) and chromium (Cr(III)) based environmentally safe olivine guidelines for coastal enhanced silicate weathering. Environ. Sci. Technol. 55, 12362–12371. doi:10.1021/acs.est.1c02974
Haider, M. R., Jiang, W. L., Han, J. L., Mahmood, A., Djellabi, R., Liu, H., et al. (2023). Boosting hydroxyl radical yield via synergistic activation of electrogenerated HOCl/H2O2 in electro-fenton-like degradation of contaminants under chloride conditions. Environ. Sci. Technol. 57, 18668–18679. doi:10.1021/acs.est.2c07752
Ishaque, F., Manoharan, R. K., and Ahn, Y. H. (2024). Strategic implementation of upflow microbubble airlift photocatalytic process to control heavy metal resistant-MDR bacteria and the associated genes in wastewater. Chem. Eng. J. 489, 151240. doi:10.1016/j.cej.2024.151240
Jeon, T. H., Koo, M. S., Kim, H., and Choi, W. (2018). Dual-functional photocatalytic and photoelectrocatalytic systems for energy- and resource-recovering water treatment. ACS Catal. 8, 11542–11563. doi:10.1021/acscatal.8b03521
Kaur, K., Akhtar, T., Singh, G., Kaur, N., and Singh, N. (2025). Rapid detection and visible light driven photocatalytic degradation of chloramphenicol in aqueous medium using a CoAl2O4/rGO nanocomposite. New J. Chem. 49, 4668–4681. doi:10.1039/D4NJ05369A
Kordi, M., Farrokhi, N., Pech-Canul, M. I., and Ahmadikhah, A. (2024). Rice husk at a glance: from agro-industrial to modern applications. Rice Sci. 31, 14–32. doi:10.1016/j.rsci.2023.08.005
Li, H., Li, T., He, S., Zhou, J., Wang, T., and Zhu, L. (2020). Efficient degradation of antibiotics by non-thermal discharge plasma: highlight the impacts of molecular structures and degradation pathways. Chem. Eng. J. 395, 125091. doi:10.1016/j.cej.2020.125091
Ling, C., Wu, S., Han, J., Dong, T., Zhu, C., Li, X., et al. (2022). Sulfide-modified zero-valent iron activated periodate for sulfadiazine removal: performance and dominant routine of reactive species production. Water Res. 220, 118676. doi:10.1016/j.watres.2022.118676
Liu, Y., Dong, W., Jiang, X., Xu, J., Yang, K., Zhu, L., et al. (2023). Efficient degradation of intracellular antibiotic resistance genes by photosensitized erythrosine-produced 1O2. Environ. Sci. Technol. 57, 12105–12116. doi:10.1021/acs.est.3c03103
Lu, N., and Liu, F. (2024). Tempospatially confined catalytic membranes for advanced water remediation. Adv. Mater. 36, 2311419. doi:10.1002/adma.202311419
Lyu, J., Yang, L., Zhang, L., Ye, B., and Wang, L. (2020). Antibiotics in soil and water in China–a systematic review and source analysis. Environ. Pollut. 266, 115147. doi:10.1016/j.envpol.2020.115147
Maleva, M. G., Nekrasova, G. F., and Bezel, V. S. (2004). The response of hydrophytes to environmental pollution with heavy metals. J. Ecol. 35, 230–235. doi:10.1023/B:RUSE.0000033791.94837.9e
Matzek, L. W., Tipton, M. J., Farmer, A. T., Steen, A. D., and Carter, K. E. (2018). Understanding electrochemically activated persulfate and its application to ciprofloxacin abatement. Environ. Sci. Technol. 52, 5875–5883. doi:10.1021/acs.est.8b00015
Merel, S., Lege, S., Heras, J. E. Y., and Zwiener, C. (2017). Assessment of N-oxide formation during wastewater ozonation. Environ. Sci. Technol. 51, 410–417. doi:10.1021/acs.est.6b02373
Moctezuma, E., Leyva, E., Aguilar, C. A., Luna, R. A., and Montalvo, C. (2012). Photocatalytic degradation of paracetamol: intermediates and total reaction mechanism. J. Hazard. Mater. 243, 130–138. doi:10.1016/j.jhazmat.2012.10.010
Naser, H., Alghoul, M. A., Hossain, M. K., Asim, N., Abdullah, m.f., Ali, M. S., et al. (2019). The role of laser ablation technique parameters in synthesis of nanoparticles from different target types. J. Nanopart. Res. 21, 249. doi:10.1007/s11051-019-4690-3
Oleszczuk, P., Cwikta-Bundya, W., Bogusz, A., Skwarek, E., and Ok, Y. S. (2016). Characterization of nanoparticles of biochars from different biomass. J. Anal. Appl. Pyrolysis 121, 165–172. doi:10.1016/j.jaap.2016.07.017
Pereira, C. M. S., Everaert, G., Blust, R., and De Schamphelaere, K. A. C. (2018). Multigenerational effects of nickel on Daphnia magna depend on temperature and the magnitude of the effect in the first generation. Environ. Toxicol. Chem. 37, 1877–1888. doi:10.1002/etc.4135
Pode, R. (2016). Potential applications of rice husk ash waste from rice husk biomass power plant. Renew. Sust. Energy Rev. 53, 1468–1485. doi:10.1016/j.rser.2015.09.051
Riedel, R., Mahr, N., Yao, C., Wu, A., Yang, F., and Hampp, N. (2020). Synthesis of gold–silica core–shell nanoparticles by pulsed laser ablation in liquid and their physico-chemical properties towards photothermal cancer therapy. Nanoscale 12, 3007–3018. doi:10.1039/c9nr07129f
Rosman, N., Salleh, W. N. W., Mohamed, M. A., Jaafar, J., Ismail, A. F., and Harun, Z. (2018). Hybrid membrane filtration-advanced oxidation processes for removal of pharmaceutical residue. J. Colloid Interface Sci. 532, 236–260. doi:10.1016/j.jcis.2018.07.118
Shaheen, M. E., and Abdelwahab, A. Y. E. (2025). Laser ablation in liquids: a versatile technique for nanoparticle generation. Opt. Laser Technol. 186, 112705. doi:10.1016/j.optlastec.2025.112705
Shao, Y., Wang, Y., Yuan, Y., and Xie, Y. (2021). A systematic review on antibiotics misuse in livestock and aquaculture and regulation implications in China. Sci. Total Environ. 798, 149205. doi:10.1016/j.scitotenv.2021.149205
Sotiriou, G. A., Starsich, F., Dasargyri, A., Wurnig, M. C., Krumeich, F., Boss, A., et al. (2014). Photothermal killing of cancer cells by the controlled plasmonic coupling of silica-coated Au/Fe3O4 nanoaggregates. Adv. Func. Mater. 24, 2818–2827. doi:10.1002/adfm.201303416
Vatanpour, V., Rezania, H., Al-Shaeli, M., and Khataee, A. (2025). Advances in self-cleaning membranes for effective water and wastewater treatment. Sep. Purif. Technol. 373, 133539. doi:10.1016/j.seppur.2025.133539
Vaz-Moreira, I., Harnisz, M., Abreu-Silva, J., Rolbiecki, D., Korzeniewska, E., Luczkiewicz, A., et al. (2022). Antibiotic resistance in wastewater, does the context matter? Poland and Portugal as a case study. Crit. Rev. Environ. Sci. Technol. 52, 4194–4216. doi:10.1080/10643389.2021.2000828
Wang, Z., Chen, J., Zhang, L., Li, W., and Huang, T. (2016). Activated carbon supported Co3O4 catalysts to activate peroxymonosulfate for orange G degradation. Environ. Sci. 37, 2591–2600. doi:10.13227/j.hjkx.2016.07.023
Wang, L., Lan, X., Peng, W., and Wang, Z. (2021). Uncertainty and misinterpretation over identification, quantification and transformation of reactive species generated in catalytic oxidation processes: a review. J. Hazard. Mater. 408, 124436. doi:10.1016/j.jhazmat.2020.124436
Wang, H., Gao, L., Xie, Y., Yu, G., and Wang, Y. (2023). Clarification of the role of singlet oxygen for pollutant abatement during persulfate-based advanced oxidation processes: Co3O4@CNTs activated peroxymonosulfate as an example. Water Res. 244, 120480. doi:10.1016/j.watres.2023.120480
Wilkinson, F., Helman, W. P., and Ross, A. B. (1995). Rate constants for the decay and reactions of the lowest electronically excited singlet state of molecular oxygen in solution. An expanded and revised compilation. J. Phys. Chem. Ref. Data 24, 663–677. doi:10.1063/1.555965
Wunsch, R., Mayer, C., Plattner, J., Eugster, F., Wulser, R., Gebhardt, J., et al. (2021). Micropollutants as internal probe compounds to assess UV fluence and hydroxyl radical exposure in UV/H2O2 treatment. Water Res. 195, 116940. doi:10.1016/j.watres.2021.116940
Xiao, J., Masana, J. J., Qiu, M., and Yu, Y. (2024). Cu−based bimetallic sites' p-d orbital hybridization promotes CO asymmetric coupling conversion to C2 products. Mater. Today Phys. 48, 101565. doi:10.1016/j.mtphys.2024.101565
Xie, H., Liu, Y., Li, N., Li, B., Kline, D. J., Yao, Y., et al. (2021). High-temperature-pulse synthesis of ultrathin-graphene-coated metal nanoparticles. Nano Energy 80, 105536. doi:10.1016/j.nanoen.2020.105536
Yu, L., Deng, D., and Bao, X. (2020). Chain mail for catalysts. Angew. Chem. Int. Ed. 59, 15294–15297. doi:10.1002/anie.202007604
Zammit, I., Marano, R. B. M., Vaiano, V., Cytryn, E., and Rizzo, L. (2020). Changes in antibiotic resistance gene levels in soil after irrigation with treated wastewater: a comparison between heterogeneous photocatalysis and chlorination. Environ. Sci. Technol. 54, 7677–7686. doi:10.1021/acs.est.0c01565
Zang, C., Liu, W., Zeng, M., Liu, X., Jie, C., and Lu, Z. (2023). The influence of NH3 plasma treatment on microstructure and mechanical property of AlSi10Mg alloy fabricated by selective laser melting. Mater. Today Commun. 34, 105274. doi:10.1016/j.mtcomm.2022.105274
Zikalala, N. E., Zikalala, S. A., Azizi, S., Kamika, I. A., Nxumalo, E. N., Zinatizadeh, A. A., et al. (2023). The role of inorganic and carbon nanomaterials in surface modification to attain antibiofouling polymeric membranes for water treatment─a review. Industrial Eng. Chem. Res. 62, 9354–9380. doi:10.1021/acs.iecr.3c00400
Keywords: nickel nanoparticle, core/shell, porous biochar, tetracycline degradation, mechanism
Citation: Guo Y and Wang R (2025) Tailoring of carbon-encapsulated nickel nanoparticles/biochars for efficient degradation of tetracycline. Front. Mater. 12:1683737. doi: 10.3389/fmats.2025.1683737
Received: 11 August 2025; Accepted: 09 October 2025;
Published: 20 October 2025.
Edited by:
Chuangang Hu, Beijing University of Chemical Technology, ChinaReviewed by:
Sharanabasava V. Ganachari, KLE Technological University, IndiaChuangang Hu, Beijing University of Chemical Technology, China
Copyright © 2025 Guo and Wang. This is an open-access article distributed under the terms of the Creative Commons Attribution License (CC BY). The use, distribution or reproduction in other forums is permitted, provided the original author(s) and the copyright owner(s) are credited and that the original publication in this journal is cited, in accordance with accepted academic practice. No use, distribution or reproduction is permitted which does not comply with these terms.
*Correspondence: Yi Guo, eWlfZ3VvMjAyNUAxNjMuY29t