 Xinggang Shen1
 Xia Li1Zhiming Xiong2
 Jun Du1
 Rui Shen3,4,5*Haoran Jin6Mingjie Jiang3,4,5Qixun Luo7Chun Wang8
- 1College of Architecture and Civil Engineering, Kunming University, Kunming, Yunnan, China
- 2Yunnan Communications Investment & Construction Group Co., LTD., Dali Management Office, Dali, Yunnan, China
- 3College of Civil Engineering and Architecture, Guangxi University, Nanning, Guangxi, China
- 4Key Laboratory of Disaster Prevention and Structural Safety of Ministry of Education, Guangxi University, Nanning, Guangxi, China
- 5Key Laboratory of Disaster Prevention and Mitigation and Engineering Safety of Guangxi, Nanning, Guangxi, China
- 6Inner Mongolia Traffic Design and Research Institute Limited Liability Company, Huhhot, Inner Mongolia, China
- 7Chengdu Engineering Corporation Limited, PowerChina, Chengdu, Sichuan, China
- 8Yalong River Hydropower Development Company, LTD., Luzhou, Sichuan, China
The influence of scale effect on the deformation parameters of the Duncan–Chang E–μ model (hereinafter abbreviated as D–C E–μ M) for coarse-grained soils remains challenging to quantify. These parameters play a critical role in predicting deformations in earth-rock dams, which in turn directly affect the safety and durability of such structures. Therefore, mitigating the impact of the scale effect on the deformation parameters of the D–C E–μ M is essential for the safe design of earth-rock dam projects. Previous studies suggest that variations in the maximum particle diameter dmax and the gradation structure are the primary factors contributing to the scale effect. In this study, the influence of scale effect on the mechanical behavior of coarse-grained soils is systematically investigated. Using a continuous gradation equation, 21 sets of specimens with different gradations were prepared by controlling dmax and the gradation area S. A series of triaxial consolidated-drained tests were conducted to analyze the effects of dmax and S on the deformation parameters of the D–C E–μ M. The experimental results indicate that parameters G, K, F, and Rf decrease as the gradation area S increases. In contrast, parameters n and D first increase and then decrease with increasing S, eventually stabilizing beyond a certain threshold. Empirical relationships between each model parameter and S were established. With increasing dmax, the parameters Rf, lgK, n, F, and D increase, whereas G decreases. All parameters exhibit logarithmic relationships with dmax. Based on the similar gradation method, an empirical formula is proposed to predict the deformation parameters of the D–C E–μ M under the influence of scale effect. The applicability of this formula to various types of coarse-grained soils is validated using test data from existing literature. Finally, a method is presented for predicting in situ deformation parameters of the D–C E–μ M based on scaled laboratory test results using the similar gradation approach.
1 Introduction
The deformation parameters of the D-C E-μ M are basic parameters in the engineering design of earth-rock dams. The values of these parameters need to be determined by conventional triaxial tests. Because of its simplicity and clarity, it is often used to calculate the stress-strain relationship of coarse-grained soils, thus providing guidance for the construction design of earth-rock dams. Coarse-grained soils are widely used as a dam construction material in earth-rock dam projects, and the rockfill materials used for dam construction can be more than 1 m in diameter. Due to the size limitations of the indoor instruments, the parameters of the prototype rockfill dam model cannot be measured directly. Therefore, it is necessary to downsize the original gradation to obtain scaled specimens for testing. However, due to the change in pore size and connectivity between soil particles after scaling, the test results of scaled specimens often fail to accurately reflect the true condition of the original gradation, a phenomenon known as the scale effect (Wang, 1994; Li et al., 2022). Previous studies showed that coarse-grained soil has an obvious scale effect (Wang, 1994; Yuan et al., 2024a; Liang et al., 2022; Yuan et al., 2024b; Pan and Sun, 2023; Li et al., 2022; Liu et al., 2021; Zhu et al., 2022; Fu et al., 2015), and the deformation parameters of the D-C E-μ M obtained by scaling test could not accurately calculate the deformation of the dam, which in turn affected the safety of the earth-rock dam project. Therefore, it is necessary to study the influence of scale effect on the deformation parameters of the D-C E-μ M for coarse-grained soils.
Researchers have investigated the scale effect on deformation parameters of coarse-grained soils. Ramamurthy and Donaghe (Wang, 1994) suggested that the scale effect significantly influenced the axial strain, volumetric strain, and elastic compression modulus but hardly impacted the peak material strength. Zhu et al. (2012) performed triaxial consolidated-drained tests on three specimens with different diameters. The results showed that after unifying the relative densities, the cohesion and internal friction angle of the coarse granular material tended to decrease with increasing specimen diameter. The variation of deformation modulus with specimen diameter was not significant. By studying the scale effect of rockfill materials by super-large and large triaxial testing machines, Kong et al. (2019) concluded that the cut-line modulus of elasticity and cut-line bulk modulus at 50% of the stress level of the large triaxial test were larger than those of the super-large triaxial test. The parameters K and Kb of the D-C E-B model for the large triaxial test were 1.22 and 1.38 times higher than those for the super-large triaxial test, respectively. Based on a series of triaxial tests with different maximum particle diameters, Li et al. (2001) inferred the parameter values of the prototype model by analyzing the relationship between the variation of the D-C E-μ M parameters and the scaled particle diameter ratio. Meanwhile, other researchers have also analyzed the impact of scale effects from different perspectives (Zhu et al., 2011; Qing et al., 2023; Zhou et al., 2021). Shao and Chi (2020) derived the correlation between each parameter of the D-C E-B M and particle diameter based on the stress-strain relationship between specimens of different diameters. Wang et al. (2013) conducted several sets of numerical experiments on scaled gradation using the PFC2D software. The results showed that the scaling relationship was correlated with the compactness control criteria. At the same relative density, the internal friction angle, bulk elastic modulus, and initial elastic modulus of the specimen with the largest particle diameter tended to increase. At the same dry density, the internal friction angle, bulk elastic modulus, and initial elastic modulus decreased and then increased.
Based on the above analysis, existing studies were mainly regularity studies focusing on the influence of scale effect on deformation parameters. The influence of gradation changes before and after scaling was neglected in these studies, and the influence of scale effect on model deformation parameters was studied only by one or a few gradation parameters, making it difficult to reflect the complete gradation changes. As a result, quantifying the influence of the scale effect on the deformation parameters of the D-C E-μ M became challenging. Moreover, the variation patterns of the D-C E-μ M parameters with gradation for coarse-grained soils after scaling are still insufficiently explained, remaining in the exploratory stage of in-depth qualitative research. Considering the grade changes before and after scaling, it is necessary to perform a quantitative experimental study on the influence of scale effect on the parameters of the D-C E-μ M.
Based on the grading equation proposed by Zhu et al. (2018) for applicable coarse-grained soils, 21 sets of specimens with different gradations were prepared by varying the gradation area S and the maximum grain diameter dmax. Large-scale triaxial consolidated-trained tests were conducted on specimens under the same relative compactness to analyze the effects of maximum grain diameter and gradation structure (gradation area) of coarse-grained soils on the parameters of the D-C E-μ M. Furthermore, the empirical formula for predicting the deformation parameters of the D-C E-μ M under the influence of the scaling effect was proposed based on the similar gradation method. In order to eliminate the influence of the scale effect, a method for predicting the deformation parameters of the D-C E-μ M for soils with original gradations is proposed based on indoor test results, and the reliability was verified with the data from previous studies. The findings of this study can provide a reference for organizing the parameters of the intrinsic model for high earth-rock dams and other similar projects.
2 Indoor triaxial test
2.1 Test equipment
DJSZ-150 large-scale dynamic and static triaxial testing machine for coarse-grained soil from the Geotechnical Engineering Experiment Center of Kunming College was used (Figure 1). The testing machine can accomplish dynamic and static loading for soil samples of Ф300 × 600 mm. It has an axial loading system, peripheral pressure loading system, and servo loading control system, enabling the realization of different stress path conditions. The maximum peripheral pressure of 3.0 MPa and static loading of 0–1,500 kN can be provided by the testing machine, and the test data can be automatically collected by computer. According to the Standard for Geotechnical Testing Method (GB/T50123-2019) (GT/T50123-2019, 2019), the particle diameter of the test soil should be less than 1/5 to 1/6 of the diameter of the instrument, i.e., this instrument can perform the triaxial consolidated-drained test on specimens with a maximum particle diameter of less than 60 mm. As determined by the pre-tests, the confining pressures for this test were 400, 800, and 1,200 kPa, and the loading rate was 1 mm/min.
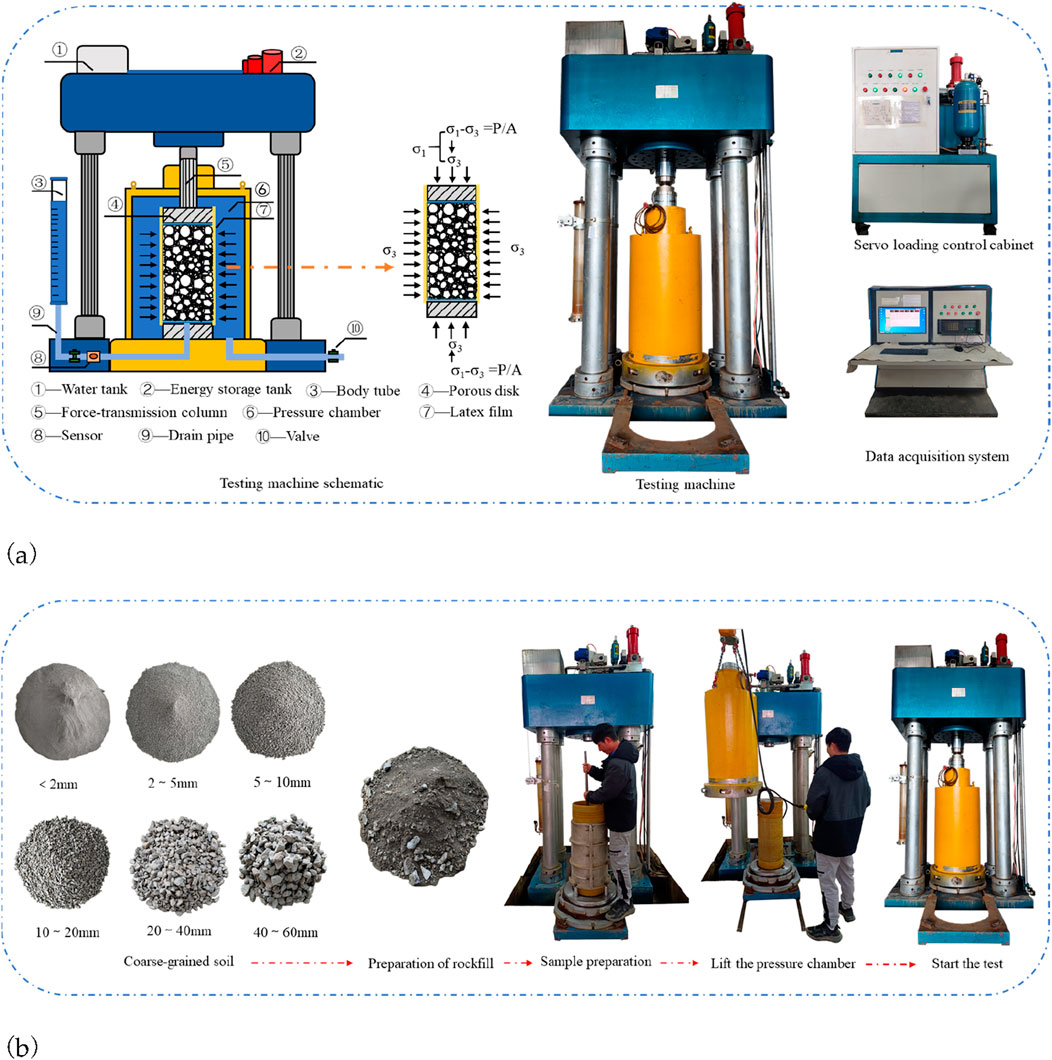
Figure 1. Large scale triaxial compression test of coarse-grained soil. (a) DJSZ-150 Three-axis compression test machine. (b) Triaxial compression test procedure of coarse-grained soil.
2.2 Test material
The test material was selected from the rockfill materials for the dam construction of Lincangdaqiaopo Reservoir in Yunnan Province. This material is artificially blasted and crushed rock with weakly weathered granite as its parent rock. The rock has an average saturated uniaxial compressive strength of 50 MPa, a softening coefficient of 0.79, and a specific gravity of 2.70. The specimens with original gradations were subjected to particle sieving using a vibratory sieving machine, and groups of specimens with diameters of 60 to 40 mm, 40 to 20 mm, 20 to 10 mm, 10 to 5 mm, 5 to 2 mm, and less than 2 mm were retained as specimen soils, as shown in Figure 2. According to the grading curves in Figure 3, separate compaction tests were performed. After measuring the maximun and minimum of dried-densities, the specimens were prepared at a relative compactness of 0.85. The specimens were filled in 5 layers to ensure uniformity and compactness of each layer and flatness of the top surface.
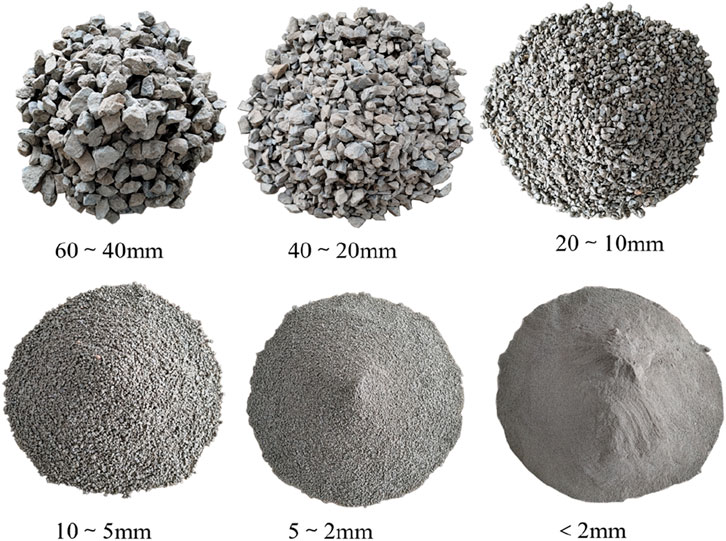
Figure 2. Different particle group test soil material.
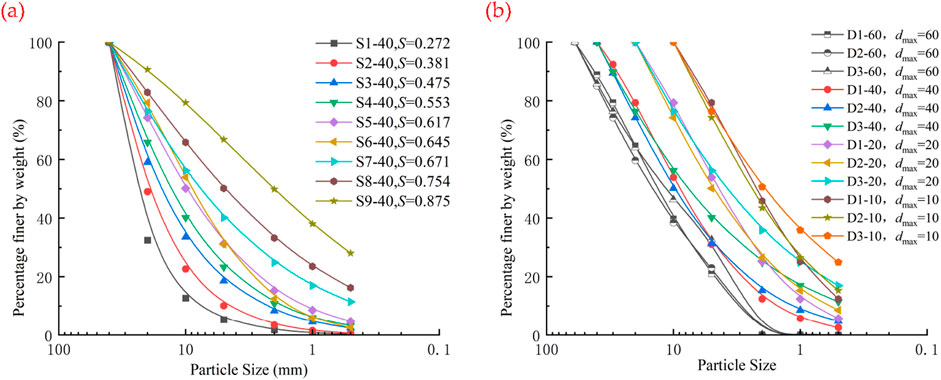
Figure 3. Particle gradation cumulative curve of rockfill material. (a) Grading curves for soil sample numbers 1 to 9. (b) Grading curves for soil sample numbers 10 to 21.
2.3 Test scheme
Zhu et al. (2018) proposed a gradation equation describing the continuous gradation of soils by studying the gradation of artificially blasted rockfill materials of typical earth-rock dams:
where P is the percentage of particles smaller than a certain diameter (%); dmax is the maximum particle diameter (mm); d is the particle diameter of the soil (mm); m and b are the parameters determining the morphology of the gradation curve, which determines the shape of the curve and the degree of inclination, respectively.
In this paper, 21 groups of graded specimens were designed by setting the values of parameters m and b. The corresponding gradation parameters are listed in Table 1. Among them, 12 groups are specimens with the same maximum particle diameter (dmax = 60 mm, 40 mm, 20 mm, and 10 mm) but with different gradations structures, and 9 groups are specimens with the same gradation area (S = 0.272, 0.381, 0.475, 0.533, 0.617, 0.645, 0.671, and 0.875) but with different maximum particle diameters. The corresponding gradation curves are shown in Figures 3a,b. P<5 refers to the percentage of particles with a diameter of less than 5 mm, i.e., the content of fine particles.
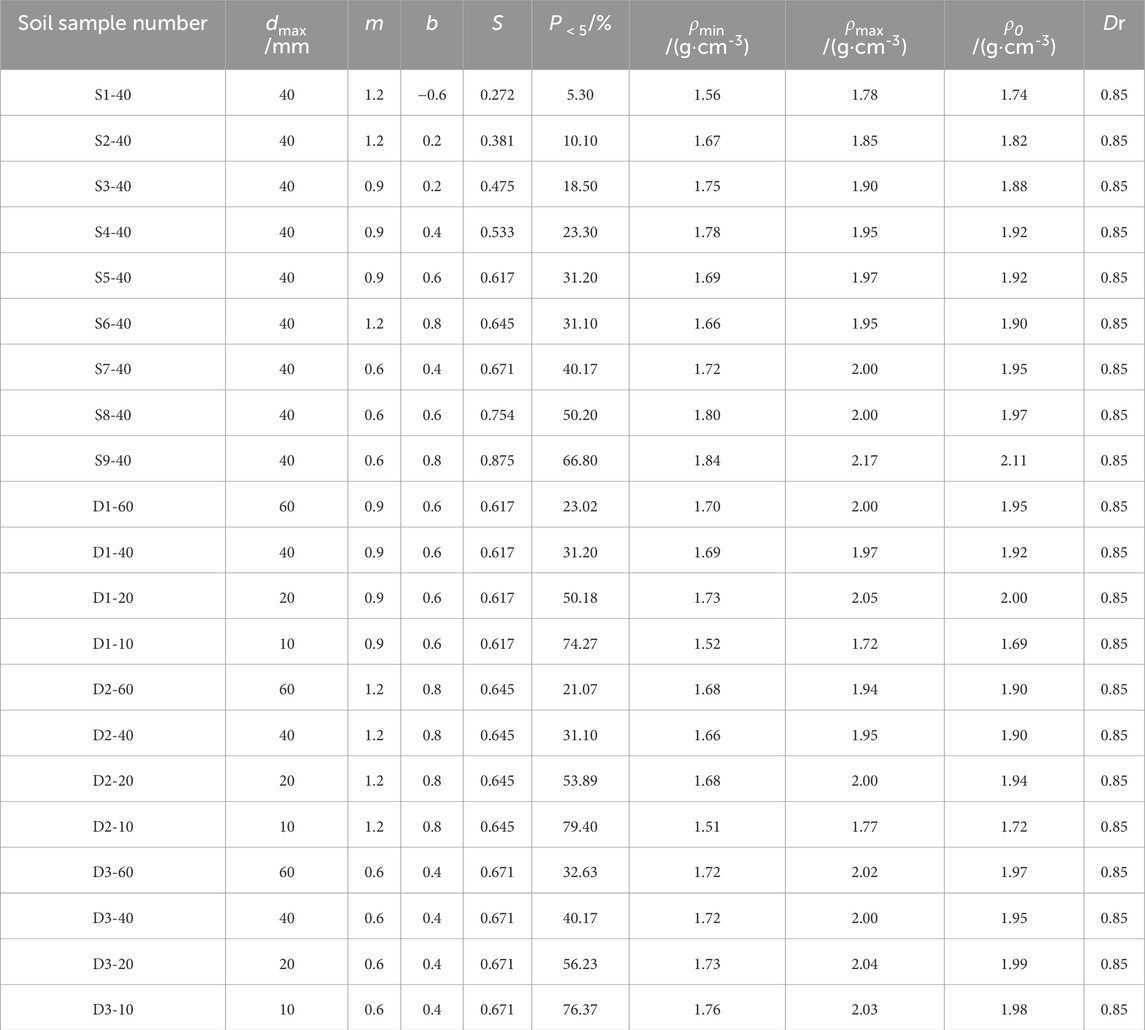
Table 1. Summary of gradation parameters, P5 content and aperture ratio.
By analyzing and summarizing the test data, no correlation was found between the gradation parameters m and b and the parameters of the D-C E-μ M. In contrast, these parameters were correlated with the gradation area S. As shown in Figure 4, the gradation area S is enclosed by the gradation equation curve, the coordinate horizontal axis, the line of d = dmax, and the line of d = dmax0 (Wu et al., 2019), which can be expressed as follows:
where
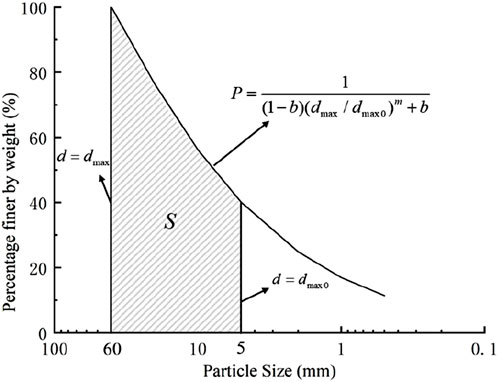
Figure 4. Area of gradation curve S.
Based on the above equation, the gradation curve area can be calculated by substituting the parameters m, b, and dmax/dmax0 into the equation. If dmax/dmax0 can be determined as a constant, the gradation curve area S can be determined by m and b, and the gradation structure is only related to m and b. Therefore, the gradation area can be used as a characteristic parameter to represent the change in gradation structure. Guo (2003) suggested using 5 mm as the criterion to distinguish sand and gravel. On this basis, this study sets dmax to 40 mm and dmax0 to 5 mm when calculating the gradation area S. Therefore, only the same area S of the gradation curve before and after scaling is required. On this basis, the univariate method can be used to study the effect of the maximum particle diameter on the parameters of the D-C E-μ M for coarse-grained soils. In summary, using a single-variable method to set a series of initial conditions with the same maximum particle diameter and different gradation areas (as well as the same gradation areas and different particle maximum sizes) to study the relationship between the maximum particle diameter, gradation structure, and the deformation parameters of the D-C E-μ M is feasible.
In each consolidated-drained triaxial test, the main outputs included the axial stress–strain relationship, volumetric strain, and pore pressure response under different confining pressures. These measured curves were used to determine the Duncan–Chang E-μ model parameters (K, G, n, D, Rf, F) following the standard fitting procedure: (i) the initial tangent and secant moduli were obtained from the stress–strain curves to derive K and G; (ii) the ultimate stress and corresponding strain were used to calibrate Rf; (iii) parameters n and D were back-calculated by nonlinear fitting of the stress–strain curve; and (iv) parameter F was derived from the bulk modulus–strain relationship. Once the parameter set was determined for each specimen, the values were correlated with the gradation descriptors (dmax and S).
3 Analysis of test results
3.1 Relationship between D-C E-μ M parameters and gradation area
Based on the results of the large-scale triaxial consolidated-drained tests of soil materials S1-40 to S9-40, the relationship between the gradation area S and the variation of the D-C E-μ M parameters was compiled, which is shown in Figure 5. The results indicate the gradation area S has a large influence on the parameter properties of the D-C E-μ M when the maximum particle diameter is the same. The parameters G, K, F, and Rf in the model all decrease with increasing area S. Among them, F decreases faster before the gradation area reaches 0.4 and tends to flatten after that. The parameter K has a more significant curve pattern in logarithmic coordinates. Parameters n and D first increase and then decrease with increasing gradation area S. Parameter n reaches its peak value when the gradation area S is 0.5, and parameter D reaches its peak value when the gradation area S is 0.6. The parameter n shows a slightly decreasing tendency after reaching the peak value.
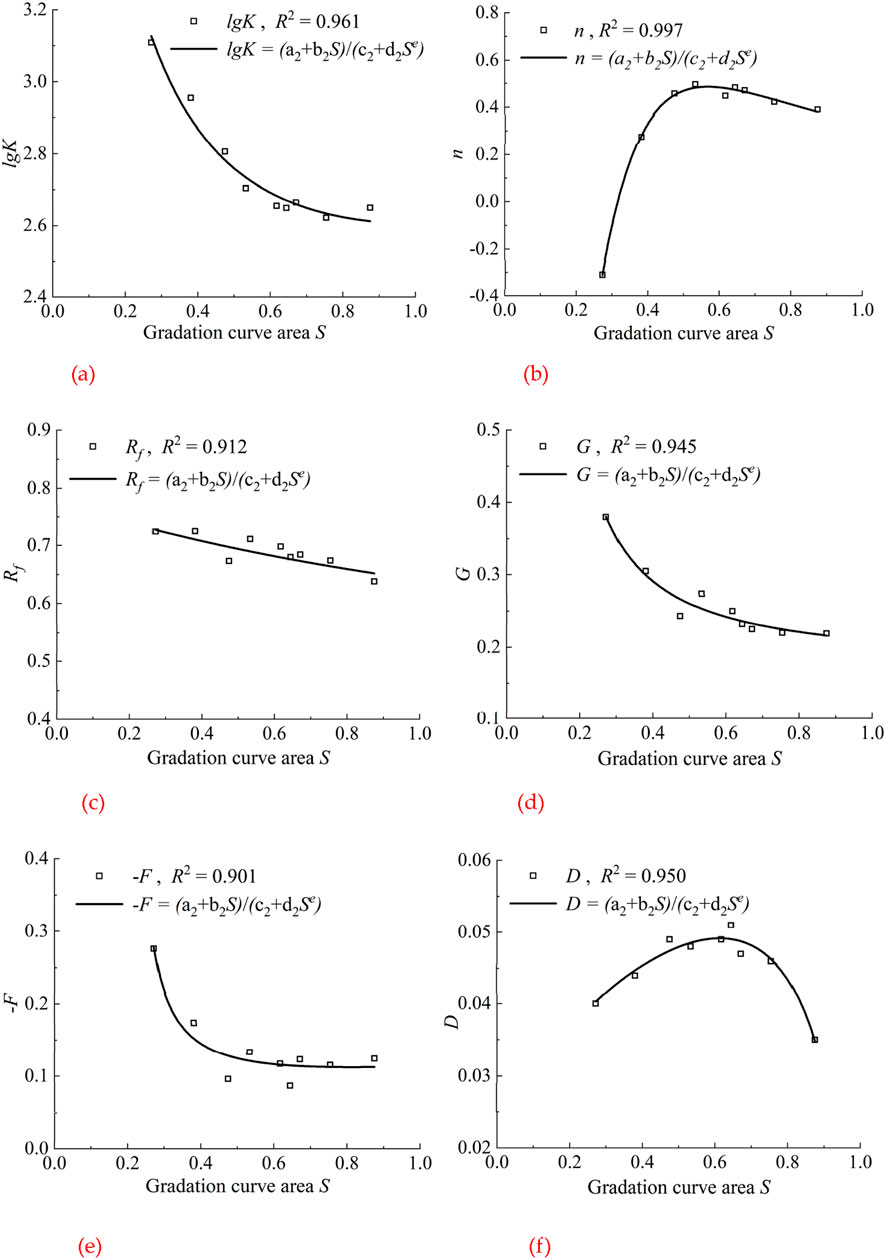
Figure 5. The relationship between gradation area S and Duncan-Chang E-μ model parameters. (a) The relationship between lgK and S. (b) The relationship between n and S. (c) The relationship between Rf and S. (d) The relationship between G and S. (e) The relationship between -F and S. (f) The relationship between D and S.
Equations 4–9 were obtained by performing nonlinear regression analyses on the experimental data of specimens S1-40 to S9-40. Based on the observed variation trends in Figure 5, logarithmic and exponential functions were selected as the most suitable forms to capture the relationships between the gradation curve area (S) and the Duncan–Chang E-μ model parameters (K, n, Rf, G, F, D). In these equations, the coefficients (ai, bi, ci, di, ei) are purely empirical fitting parameters without direct physical meaning, but they quantitatively describe the sensitivity of each model parameter to changes in S. The derivation assumes that the influence of gradation structure can be represented by a single descriptor (S), while the effect of maximum particle size (dmax) is considered separately in Section 3.2. This simplification ensures that the correlations reflect the isolated effect of S on model parameters. With the help of computer software to fit the experimental data, the equation for K, n, Rf, G, F, D, and S can be expressed as:
where ai, bi, ci, di, and ei (values of i are from 1 to 6) are the equation parameters.
The test data for soil specimens S1-40 to S9-40 were fitted based on the above equation. The fitting results are shown in Table 2, and the fitting curve is plotted in Figure 5. It can be seen that the fitting curve for the deformation parameters of the D-C E-μ M agrees well with the test point, with an error basically less than 7.6% between them, a maximum error less than 9.12%, and the coefficient of determination above 0.901. Therefore, it can be assumed that the influence of the model parameter on the gradation area S in the scale effect can be quantitatively described by Equations 4–9.
Table 2. Fitting results of Equations 4–9 for sand and gravel materials.
3.2 Relationship between the D-C E-μ M parameters and maximum particle diameters
The result of the large-scale triaxial consolidated-drained test for soil materials D1-40 to D3-10 is summarized, and the change pattern of the D-C E-μ M parameters for coarse-grained soils with the same gradation area S and different maximum particle diameters dmax is shown in Figure 6. It can be seen that the D-C E-μ M parameters Rf, k, n, F, and D increase with the maximum particle diameter, and the parameter G decreases with the maximum particle diameter. Further analysis reveals that the maximum particle diameter dmax and the D-C E-μ M deformation parameters can be expressed as logarithmic functions. Therefore, the equation for the relationship between dmax of coarse-grained soils and model parameters can be expressed as:
where dmax0 is the value distinguishing sand and gravel, which is taken as 5 mm; Z1, Z2, Z3, Z4, Z5, Z6, lgK0, n0, Rf0, G0, F0, and D0 represent the parameters; lgK0, n0, Rf0, G0, F0, and D0 represent the D-C E-μ M deformation parameters of the specimen when the maximum particle diameter dmax is 5 mm; Z1, Z2, Z3, Z4, Z5, and Z6 represent the change rate of the D-C E-μ M parameters when the maximum particle diameter is 5 mm.
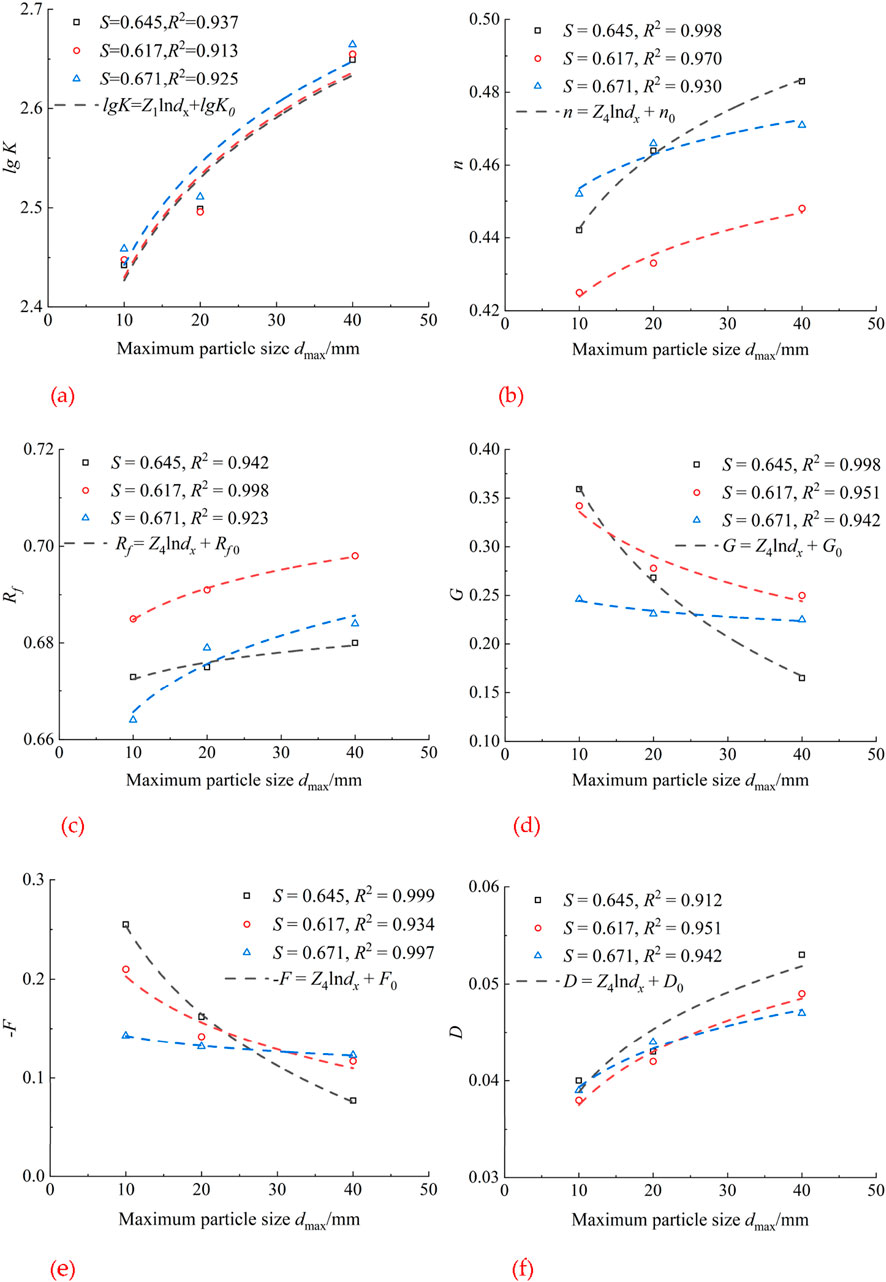
Figure 6. The relationship between maximum particle size dmax and Duncan-Chang E-μ model parameters. (a) The relationship between lgK and dmax. (b) The relationship between n and dmax. (c) The relationship between Rf and dmax. (d) The relationship between G and dmax. (e) The relationship between–F and dmax. (f) The relationship between D and dmax.
The D1-40 to D3-10 test data were fitted according to Equations 10–15. The fitting results are shown in Tables 3–5, and the fitted curves are shown in Figure 6. It can be seen that the fitted curves are in good agreement with the test points, and the fitted curves of the deformation parameters of the D-C E-μ M are significantly consistent with the test points. The error between the fitted values of the parameters and the corresponding test points is basically less than 9.4%, the maximum error is less than 10.08%, and the coefficient of determination is basically greater than 0.913. According to mathematical statistics, all fitting data have strong correlations.
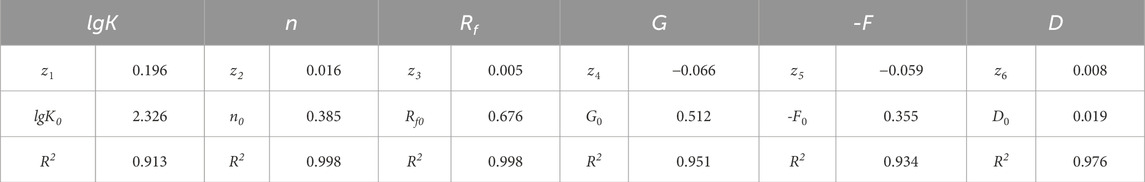
Table 3. Fitting results of Equations 10–15 for sand and gravel materials (S = 0.617).
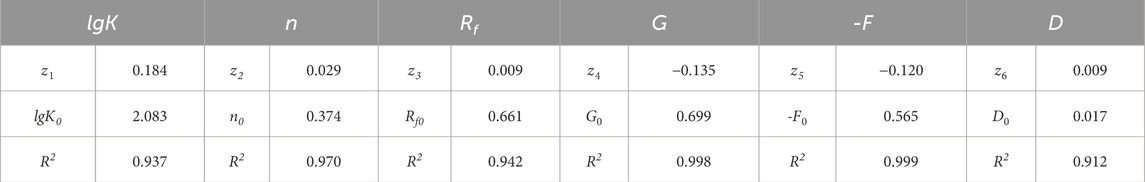
Table 4. Fitting results of Equations 10–15 for sand and gravel materials (S = 0.645).
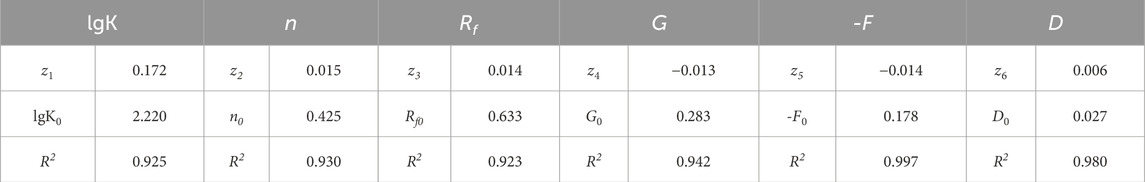
Table 5. Fitting results of Equations 10–15 for sand and gravel materials (S = 0.671).
3.3 Establishment of the empirical formula of the D-C E-μ M based on the similar gradation method
The effects of maximum particle diameter and gradation area on the parameters of the D-C E-μ M can be quantitatively described by the above equations. However, the model parameters are meaningless quantities, and the above two parameters cannot be coupled to deduce the influence of the scale effect on the model parameters. Scaling by the similar gradation method provides a scaled specimen that has the same gradation area S as the soil material with the original gradation. Therefore, this study established an empirical formula for the influence of scale effect on model parameters based on the similar gradation method. The formula was fitted with the test results obtained from specimens with particle diameters of 10–40 mm, and the experimental data obtained from specimens with a maximum particle diameter of 60 mm were verified. The validation results demonstrated the correctness of the empirical formula when using the similar gradation method for scaling.
Since the empirical formula of the D-C E-μ M based on the similar gradation method eliminates the effect of the gradation area, it can be expressed by Equations 10–15. Using the fitting results of Equations 10–15 and Tables 3–5, the deformation parameters of the D-C E-μ M for a specimen with a maximum particle diameter dmax of 60 mm were calculated, and the calculation values were compared with the measurement values. The calculation results are shown in Table 6, and the comparison is illustrated in Figure 7.
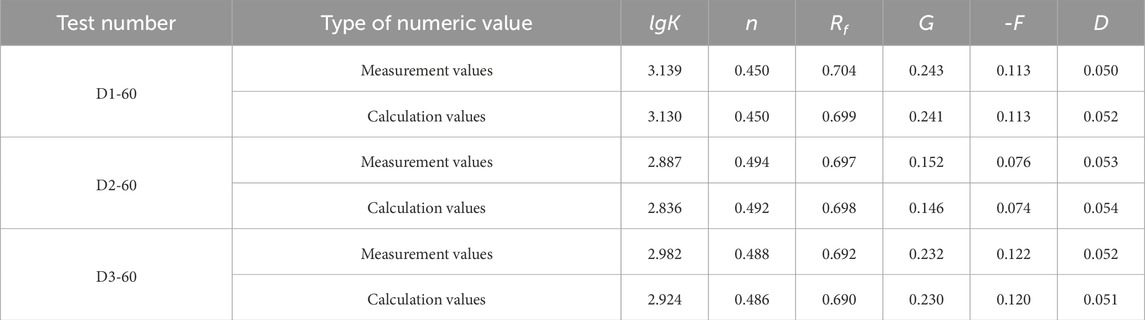
Table 6. Summary table of comparison between experimental and calculated values of deformation parameters in Duncan Zhang E-μ model.
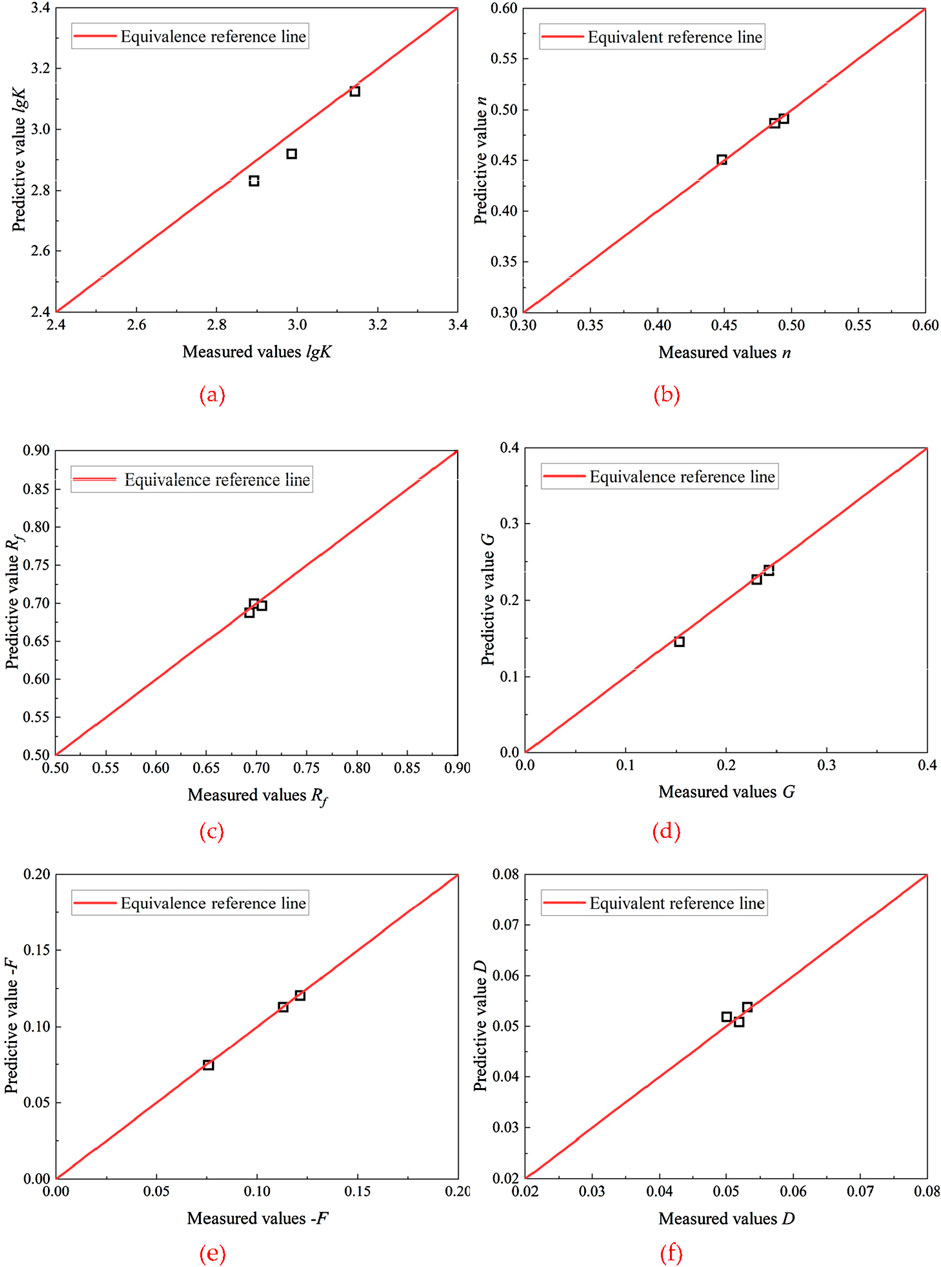
Figure 7. The measured and calculated values of deformation parameters for Duncan Zhang E-μ model for rockfill materials. (a) Parameter lgK. (b) Parameter n. (c) Parameter Rf . (d) Parameter. G. (e) Parameter -F. (f) Parameter D.
As can be seen from Figure 7, the error between the predicted and experimental values of gravel is not large. The error between the fitted values of the model parameters and the corresponding test points is basically less than 2.8%, the maximum error is less than 7.68%, and the coefficients of determination are all above 0.956, which is in an acceptable range. Therefore, the influence of scale effect on the deformation parameters of coarse-grained soils can be quantitatively described by Equations 10–15.
The use of the empirical formula to reflect the effect of the maximum particle diameter on the deformation parameters of the D-C E-μ M is of great application value. By determining the material parameters in Equations 10–15 from a series of large-scale triaxial consolidated-drained tests on scaled soils using the similar gradation method, the deformation parameters of the D-C E-μ M for the coarse-grained soils with the original gradation can be derived. In this way, the influence of scale effect on the deformation characteristics of coarse-grained soils can be eliminated, and the safety and reliability of geotechnical engineering design can be improved.
4 Validation of the empirical formula for the parameters of the D-C E-μ M based on the similar gradation methods
In this study, only large-scale triaxial consolidated-drained tests on sand and gravel were conducted. In order to verify the applicability of the proposed prediction formula to different types of coarse-grained soils, the above conclusions need to be supported with more experimental data. Varadarajan et al. (2006) conducted triaxial drainage tests using rockfill materials from the Purulia and Parbati dams and alluvial rockfill materials from the Kol dam, which had similar gradations. Table 7 summarizes the values of the E-μ model parameters for the three different materials, and the equation parameters are derived by fitting some of these experimental data using Equations 10–15 to derive the model parameters with original gradations. The comparison of the predicted values and measured values is shown in Figure 8.
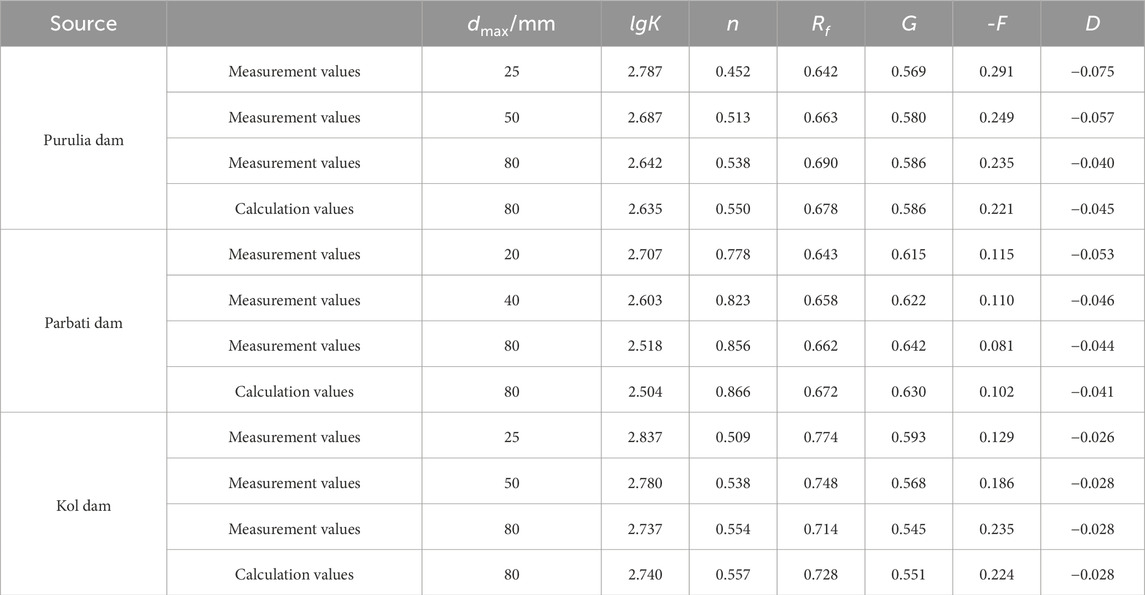
Table 7. Summary of Duncan Zhang E-μ model parameters for different materials.
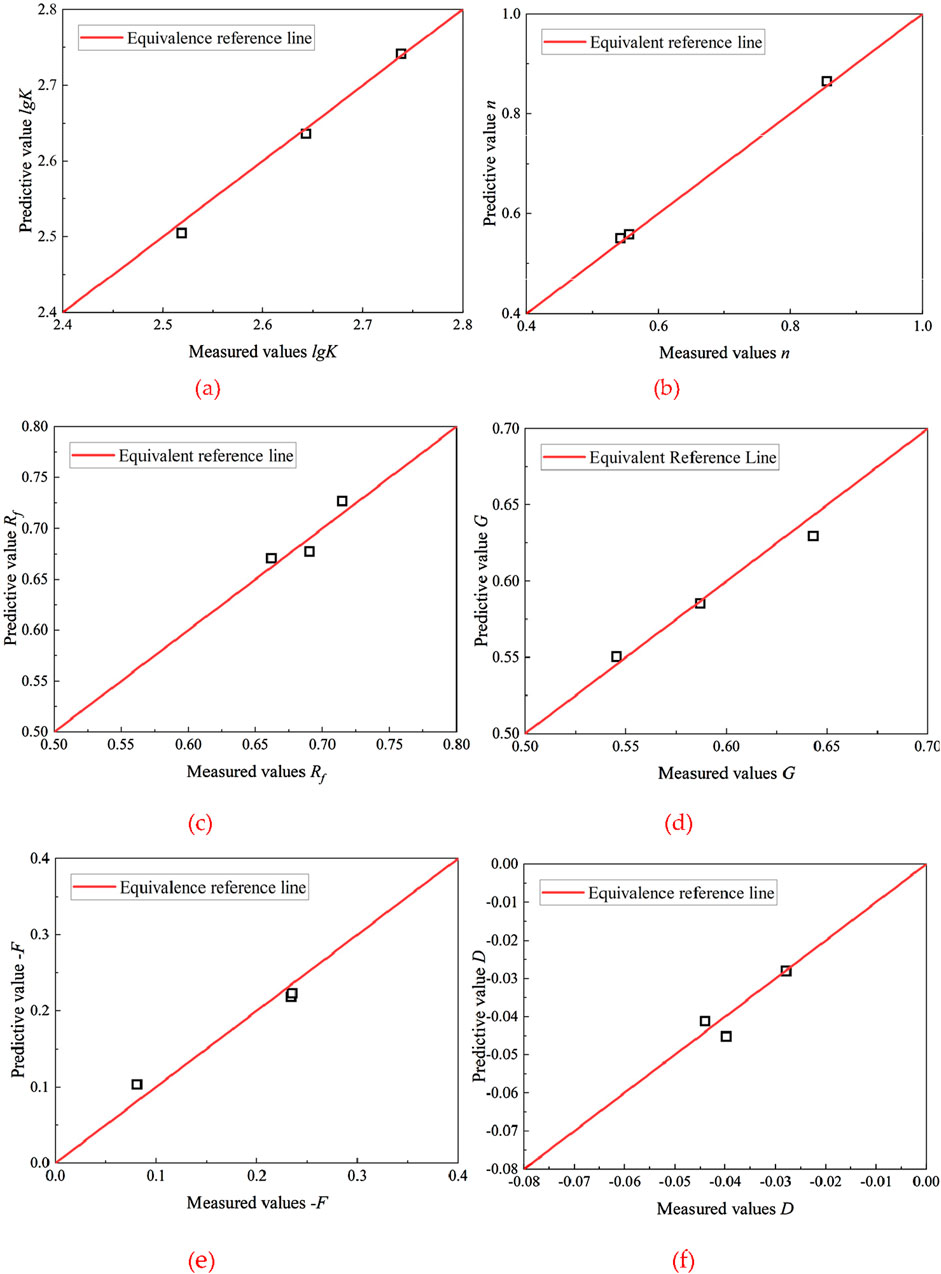
Figure 8. Measurement and calculation of deformation parameters of Duncan Zhang E-μ model for rockfill materials. (a) Parameter lgK. (b) Parameter n. (c) Parameter Rf. (d) Parameter G. (e) Parameter -F. (f) Parameter D.
It can be seen from Figure 8 that the data of predicted and measured values are in good agreement. The maximum error of 4.18% for the deformation parameters of the D-C E-μ M illustrates the reliability of the empirical formula for predicting model parameters and its applicability to different types of coarse-grained soils. Therefore, by performing triaxial tests on soils of similar gradation to obtain each parameter in Equations 10–15, the deformation parameters of the D-C E-μ M for coarse-grained soils of any gradation can be better predicted.
5 Conclusion
Based on the continuous gradation equation of soil, 21 groups of graded specimens with maximum particle diameters dmax of 60, 40, 20, and 10 mm were designed, and a series of consolidated-drained tests were performed on the coarse-grained soil using DJSZ-150 large-scale dynamic and static tri-axial testing machine. Furthermore, a quantitative study of the D-C E-μ M parameters for coarse-grained soils with different maximum particle diameters and gradation structures under the same relative compactness was performed. The conclusions of this study are as follows:
1. When the maximum grain size dmax is constant, the parameters G, lgK, F, and Rf in the D-C E-μ M decrease with increasing gradation area S. Parameters n and D increase and then decrease with the increasing gradation area S, followed by a decreasing trend after reaching a specific value. The equations between each model parameter and gradation area S are established.
2. When the gradation area S remains constant (i.e., the gradation structure is constant), the D-C E-μ M parameters Rf, lgK, n, F, and D increase with the maximum parameter diameter dmax. In contrast, the parameter G decreases as the maximum particle diameter dmax increases. All model parameters follow a logarithmic function with dmax.
3. An empirical prediction model of D-C E-μ parameters for coarse-grained soils was developed using the similar gradation method, explicitly incorporating the influence of maximum particle size.
4. The proposed empirical formula was validated against indoor test data and previous studies, confirming its capability to eliminate scale effects and its applicability to different types of coarse-grained soils.
Future research should extend the present work in several directions. First, the proposed empirical formula has only been validated for maximum particle sizes up to 60 mm and for weakly weathered granite; therefore, larger particle sizes and other lithologies, particularly soft or easily breakable rockfill, should be investigated to improve generality. Moreover, the current study mainly addresses geometric scale effects, while the role of particle breakage and its interaction with scale effects under high confining stresses remains to be clarified. In addition, although the gradation curve area (S) provides a useful single descriptor, future work should consider multiple indices such as uniformity coefficients or fractal dimensions to better capture complex gradation features. Finally, validation through DEM-based numerical simulations and field monitoring data is recommended to strengthen engineering applicability and to quantify improvements in deformation and stability predictions for earth–rock dams.
Data availability statement
The raw data supporting the conclusions of this article will be made available by the authors, without undue reservation.
Author contributions
XS: Funding acquisition, Project administration, Writing – review and editing, Methodology. XL: Funding acquisition, Resources, Writing – review and editing. ZX: Writing – review and editing, Supervision, Resources, Funding acquisition. JD: Investigation, Writing – review and editing, Resources, Funding acquisition. RS: Conceptualization, Methodology, Writing – original draft, Formal Analysis, Software. HJ: Validation, Supervision, Writing – review and editing. MJ: Visualization, Writing – review and editing, Validation, Methodology, Supervision. QL: Writing – review and editing. CW: Writing – review and editing.
Funding
The author(s) declare that financial support was received for the research and/or publication of this article. This work is supported by a project from Guangxi Natural Science Foundation (No. 2021GXNSFBA196091), a Special Basic Cooperative Research Programs of the Yunnan Provincial Undergraduate University’s Association (202301BA070001-012, 202101BA070001-137), a project from Inner Mongolia Transportation Department Construction Technology (No. NJ-2021-10).
Conflict of interest
Author ZX was employed by Yunnan Communications Investment & Construction Group Co., LTD. Dali Management Office. Author HJ was employed by Inner Mongolia Traffic Design and Research Institute Limited Liability Company.
The remaining authors declare that the research was conducted in the absence of any commercial or financial relationships that could be construed as a potential conflict of interest.
Generative AI statement
The author(s) declare that no Generative AI was used in the creation of this manuscript.
Any alternative text (alt text) provided alongside figures in this article has been generated by Frontiers with the support of artificial intelligence and reasonable efforts have been made to ensure accuracy, including review by the authors wherever possible. If you identify any issues, please contact us.
Publisher’s note
All claims expressed in this article are solely those of the authors and do not necessarily represent those of their affiliated organizations, or those of the publisher, the editors and the reviewers. Any product that may be evaluated in this article, or claim that may be made by its manufacturer, is not guaranteed or endorsed by the publisher.
Abbreviations
D-C E-μ M, Duncan-Chang E-μ model; dmax, Maximum particle size; dmax0, Boundary particle size of sand and gravel; d, soil particle size; p, percentage of particles smaller than a certain diameter; k, Calculate the gradation area parameters; m, Determine the morphological parameters of gradation curve; b, Determine the morphological parameters of gradation curve; S, Grading area; P < 5, The percentage of particle size less than 5 mm; ρmin, minimum dry density; ρmax, maximum dry density; ρ0, Dry density at relative density; Dr, relative density; lgK, D-C E-μ M parameter; Rf, D-C E-μ M parameter; G, D-C E-μ M parameter; n, D-C E-μ M parameter; D, D-C E-μ M parameter; -F, D-C E-μ M parameter.
References
Fu, W. X., Lei, X. Z., Sun, J. B., and Zhou, Q. S. (2015). Scale dependence of shear strength from direct shear test for a coarse granular material. Mater. Res. Innovations 19 (S5), S5-659–S5-665. doi:10.1179/1432891714z.0000000001171
Guo, Q. G. (2003). Engineering properties and application of coarse-grained soil. Zhengzhou: China Water Power Press.
Kong, X. J., Ning, F. W., Liu, J. M., Zou, D. G., and Zhou, C. G. (2019). Scale effect of rockfill materials using super-large triaxial tests. Chin. J. Geotechnical Eng. 41 (2), 255–261.
Li, N. H., Zhu, T., and Mi, Z. K. (2001). Strength and deformation properties of transition zone material of xiaolangdi dam and scale effect. Int. J. Hydroelect Ric Energy 19 (2), 39–42.
Li, S. Y., Wang, T. C., Wang, H., Jiang, M. J., and Zhu, J. G. (2022). Experimental studies of scale effect on the shear strength of coarse-grained soil. Appl. Sci. 12 (1), 447. doi:10.3390/app12010447
Liang, C. Y., Wu, Y. D., Liu, J., Zhang, L., Lin, L. H., and Chen, D. S. (2022). Influence of calcareous nodules content on scaling effect in shear strength of cohesive soil containing calcareous nodules. Sci. Rep. 12 (1), 361. doi:10.1038/s41598-021-04333-1
Liu, S. C., Wu, X. L., Xu, W. W., and Shi, B. X. (2021). Experimental study on scale effect of rockfill materials. Yangtze River 52 (01), 173–176+217.
Pan, J. G., and Sun, X. J. (2023). Research progress on scale method and scale effect of coarse-grained soil. J. Changjiang River Sci. Res. Inst. 40 (11), 1–8.
Qing, Y., Ma, A. J., Yang, S. B., Qiu, Z. F., and Deng, W. J. (2023). Compression test considering the influence of scale effect on particle breakage of rockfill materials. J. Changjiang River Sci. Res. Inst. 40 (12), 126–132.
Shao, X. Q., and Chi, S. C. (2020). Particle size correlation of deformation parameters for rockfill materials. Chin. J. Geotechnical Eng. 42 (9), 1715–1722.
Varadarajan, A., Sharma, K. G., Abbas, S. M., and Dhawan, A. K. (2006). The role of nature of particles on the behaviour of rockfill materials. Soils Found. 46 (5), 569–584. doi:10.3208/sandf.46.569
Wang, J. Z. (1994). Deformation characteristics and scale effect of coarse-grained materials. Chin. J. Geotechnical Eng. (04), 89–95.
Wang, Y. M., Zhu, S., Ren, J. M., Peng, P., and Xu, X. Y. (2013). Research on scale effect of coarse-grained materials. Rock Soil Mech. 34 (06), 1799–1806+1823.
Wu, E. L., Zhu, J. Q., Guo, W. L., and Chen, G. (2019). Experimental study on effect of scaling on compact density of coarse-grained soils. Chin. J. Geotechnical Eng. 41 (09), 1767–1772.
Yuan, B., Jingkang, L., Zhang, B., Chen, W., Huang, X., Huang, Q., et al. (2024a). Journal of rock mechanics and geotechnical engineering optimized reinforcement of granite residual soil via a cement and alkaline solution: a coupling effect. J. Rock Mech. Geotechnical Eng.
Yuan, B., liang, J., Lin, H., Wang, W., and Xiao, Y. (2024b). Experimental study on influencing factors associated with a new tunnel waterproofing for improved impermeability. J. Test. Eval. 52 (1), 344–363. doi:10.1520/jte20230417
Zhou, Y. F., Wang, J. J., Wang, A. G., and Yang, X. (2021). Compression test considering the influence of scale effect on particle breakage of rockfill materials. Water Resour. Power 39 (08), 165–168+65.
Zhu, S., Wang, Y. M., and Weng, H. Y. (2011). Study on the scale effect of the compactness of coarse-grained dam materials. Chin. J. Rock Mech. Eng. 30 (02), 348–357.
Zhu, J. G., Liu, Z., Weng, H. Y., Wu, Z. F., and Fu, H. Y. (2012). Study on effect of specimen size upon strength and deformation behaviour of coarse-grained soil in triaxial test. J. Sichuan Univ. Eng. Sci. Ed. 44 (6), 92–96.
Zhu, J. G., Guo, W. L., Wen, Y. F., Yin, J. H., and Zhou, C. (2018). New gradation equation and applicability for particle-size distributions of various soils. Int. J. Geomechanics 18 (2), 04017155. doi:10.1061/(asce)gm.1943-5622.0001082
Keywords: coarse-grained soil, scale effect, particle gradation, triaxial compression test, E-μ model
Citation: Shen X, Li X, Xiong Z, Du J, Shen R, Jin H, Jiang M, Luo Q and Wang C (2025) The influence of scale effect on the deformation parameters of the Duncan-Chang E-μ model for coarse-grained soils: an experimental study. Front. Mater. 12:1685690. doi: 10.3389/fmats.2025.1685690
Received: 14 August 2025; Accepted: 17 September 2025;
Published: 29 October 2025.
Edited by:
Miao Yu, Chongqing Jiaotong University, ChinaReviewed by:
Mohammad M. Karimi, Tarbiat Modares University, IranShaoyun Pu, Shaoxing University, China
Chuanfeng Fang, Hunan University of Science and Technology, China
Copyright © 2025 Shen, Li, Xiong, Du, Shen, Jin, Jiang, Luo and Wang. This is an open-access article distributed under the terms of the Creative Commons Attribution License (CC BY). The use, distribution or reproduction in other forums is permitted, provided the original author(s) and the copyright owner(s) are credited and that the original publication in this journal is cited, in accordance with accepted academic practice. No use, distribution or reproduction is permitted which does not comply with these terms.
*Correspondence: Rui Shen, MjIxMDM5MTA5NEBneHUuZWR1LmNu