 Jie Zhang1
 Hui Wang
- 1Affiliated Nantong Hospital of Shanghai University (The Sixth People’s Hospital of Nantong), Nantong, China
- 2Basic Medical Research Center, Medical School of Nantong University, Nantong, Jiangsu, China
- 3School of Mechanical Engineering, Nantong University, Nantong, China
- 4School of Mechanical, Materials, Mechatronic and Biomedical Engineering, University of Wollongong, Wollongong, NSW, Australia
Metal matrix composites have shown great application potential in biomedical materials due to their excellent integrated properties. The deformation behaviours of metal matrix composites during fabricating and service are complicated. In this study, bicrystals processed by accumulative roll-bonding (ARB) were used as a representative case, and the deformation behaviours were investigated using crystal plasticity finite element method (CPFEM). The used three bicrystals were {112}<111>−{112}<111> (C-C), {112}<111>−{123}<634> (C-S), and {112}<111>−{001}<110> (C-RoCube), and the initial misorientation angles at the interfaces were 0°, 19.4°, and 35.3°, respectively. Pole figures, crystal rotation angles, and misorientation angles were used to characterize the texture evolution, and through-thickness shear strain
1 Introduction
High-performance load-bearing biomedical implants (e.g., artificial joints and bone plates) are indispensable in modern medicine for repairing skeletal injuries and restoring joint function (Gao et al., 2019). These devices must withstand complex cyclic mechanical loads within the human body, requiring materials that simultaneously provide high strength, superior fatigue resistance, and excellent wear resistance (Bandyopadhyay et al., 2024).
Metal matrix composites with tunable microstructures show great promise in biomedical applications owing to their biocompatibility (Davis et al., 2022), high specific strength, and the advantage of eliminating secondary removal surgery (Chen et al., 2026). A comprehensive review of the preparation and performance of additively manufactured metal matrix composites is provided in Ref. (Chen et al., 2024). However, current metallic implant materials face persistent challenges. Conventional biomedical alloys often suffer from insufficient fatigue resistance and mismatched wear properties relative to bone tissue during long-term service (Davis et al., 2022; Delavar et al., 2023). Meanwhile, biodegradable alloys are hindered by non-uniform degradation rates and the premature loss of mechanical integrity (Zan et al., 2023). Therefore, addressing these limitations requires innovative material design strategies, with control of microtexture (crystallographic orientation distribution) emerging as a key pathway to optimize mechanical performance (Wu et al., 2024). The unique service environment of biomedical implants imposes stringent texture requirements. The alternating loads in joints demand specific texture orientations to mitigate stress concentration and extend fatigue life (Wang et al., 2022); the interfacial bonding performance between bone plates and bone depends strongly on the surface hardness and friction coefficient, which are governed by texture (Zan et al., 2023); and in biodegradable metallic alloys, texture further regulates the uniformity of corrosion rates in physiological environments through its influence on grain orientation (Gerashi et al., 2022). Furthermore, in biomedical metallic sheets (particularly cold-rolled FCC metals), the rolling texture, as a typical texture formed by the primary plastic processing technique of rolling (Ramkumar et al., 2024), poses additional challenges. Such textures not only hinder subsequent plastic deformation (Su et al., 2014) but also exacerbate the anisotropy of mechanical properties (Ramkumar et al., 2024). Consequently, the development of rolling texture control strategies tailored for biomedical metallic sheets represents a critical direction for overcoming the current performance bottlenecks of load-bearing implants.
Numerous techniques have been developed to optimize textures after rolling (Dabou et al., 2023). Among them, accumulative roll-bonding (ARB), a relatively recent rolling technique, has been widely employed to fabricate ultrafine-grained materials (Valiev et al., 2022). To a large extent, the through-thickness texture after ARB resembles that produced by conventional rolling (Ebrahimi and Wang, 2022). However, due to the absence of lubricants—commonly avoided in ARB to improve interfacial bonding—a significant fraction of shear-type texture forms at the surface (Semenchenko et al., 2024; Cantergiani et al., 2024). Consequently, shear-type texture typically develops near the surface, while rolling-type texture dominates at the centre (Ebrahimi and Wang, 2022). As deformation proceeds, the shear-type texture is gradually rotated and transformed into rolling-type texture once the surface layers are cycled into the centre (Ebrahimi and Wang, 2022). Because the directions of shear strain differ between the upper and lower surfaces, the shear-type textures on these two sides also differ, giving rise to a characteristic texture transition at the interface (Kashihara et al., 2014). This implies that differences in interfacial texture play a critical role in governing overall texture evolution.
Single crystals are the ideal materials for studying texture evolution during ARB, as they eliminate the complicating effects of grain interactions. Texture evolution has been investigated using both experimental approaches (Kashihara et al., 2014; Kashihara et al., 2013) and crystal plasticity modelling (Wang et al., 2019a). Direct experimental characterization of crystallographic orientations at the exact ARB surfaces remains challenging, whereas crystal plasticity modelling provides predictive insight into surface texture development. Modelling studies on ARB-processed single crystals revealed that the crystallographic orientations rotate in opposite directions on the upper and lower surfaces (Wang et al., 2019a), leading to large misorientation angles when these surfaces are stacked in the subsequent cycle. In later cycles, the misorientation angle may either increase or decrease, depending critically on both its initial magnitude and the layer’s thickness position (Wang et al., 2019a). Compared to single crystals, bicrystals have been used to examine the evolution of misorientation angles during plastic deformation, as the interfacial misorientation prior to deformation is well defined., where the misorientation angle at the interface before rolling was initially well-defined. Zaefferer et al. (2003) systematically examined the influence of misorientation on the deformation on grain boundaries (i.e., interface) during plane strain compression, covering small (8.7°), transition (15.4°), and large (31.5°) misorientation cases. They demonstrated that the plastic response within bicrystals strongly depends on the orientations of the constituent crystals (Zaefferer et al., 2003). Another study on compressed bicrystals and polycrystals showed that the deformation bands were closely related to crystallographic orientation (Luan et al.). To the best of the authors’ best, the ARB deformation behaviour of bicrystals has not yet been reported, forming the central motivation of this study.
In this study, bicrystals were deformed by ARB. The starting orientations of crystals corresponded to either rolling-type or shear-type textures. The texture evolution and plastic deformation behaviour were systematically analysed, with particular emphasis on the effect of interfacial misorientation angle. These insights contribute to a better understanding of the mechanisms underlying texture evolution during ARB.
2 Crystal plasticity modelling
The crystal plasticity finite element method (CPFEM) was employed to model the deformation behaviour of bicrystals during ARB (Figure 1). This CPFEM–ARB framework successfully reproduced the experimentally observed textures in ARB-processed single crystals for up to nine cycles (Wang et al., 2019a; Wang et al., 2019b), thereby demonstrating its predictive capability when applied to bicrystals.
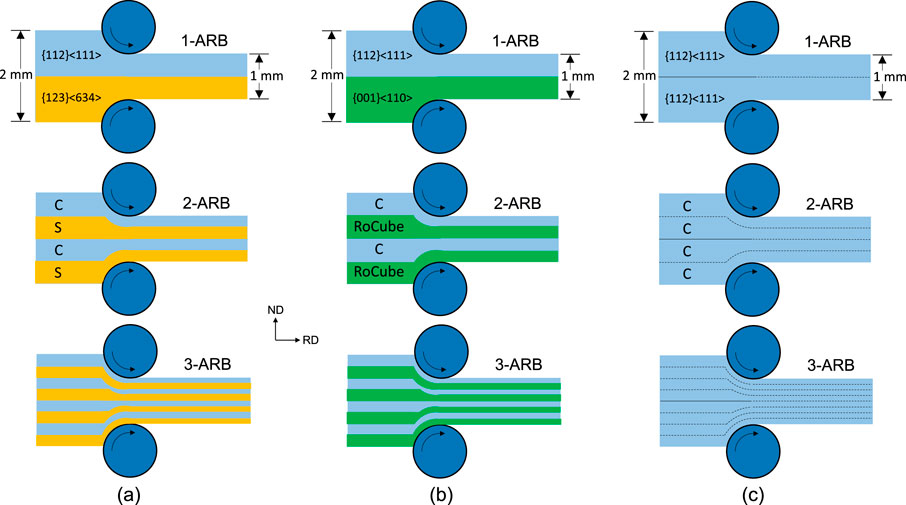
Figure 1. A schematic shows the ARB process. The bicrystals are (a) C-S, (b) C-RoCube, and (c) C-C.
Figure 1 illustrates the simulation model of three bicrystals during the ARB process. In the C-S bicrystal, the initial orientations of the upper and lower sheets are {1 1 2} <1 1 1> and {1 2 3} <6 3 4>, respectively (Figure 1a). For the C-RoCube bicrystal (Figure 1b), the starting orientation are {1 1 2} <1 1 1> and {0 0 1} <1 1 0>. The selection of these three orientations was based on their relevance to texture evolution in ARB. During ARB, shear textures formed at the surfaces are transported to mid-thickness, where they gradually transform into rolling textures. Accordingly, the orientations {1 1 2} <1 1 1> (C), {1 2 3} <6 3 4> (S), and {0 0 1} <1 1 0> (RoCube) were chosen, with the first two representing rolling-texture components and the last corresponding to a shear-to-rolling transition component. The adopted CPFEM model has previously been validated by reproducing the textures of C and S components after nine ARB cycles and the RoCube component after 90% reduction rolling. The initial misorientation angles at the interface in Figures 1a,b were 19.4° and 35.3°. Additionally, a C-C bicrystal, i.e., single crystal, was also considered for comparison (Figure 1c). The element type was CPE4R. Following mesh calibration, the sheet thickness was divided into 16 elements in the 1-ARB model, and this number was doubled in each subsequent cycle to approximate the stacking sequence of ARB. Prior to 1-ARB, crystal orientations were assigned to each element according to the bicrystal configuration. Crystal rotations in different directions, or in the same direction with different magnitudes, produced grain subdivision. For 2-ARB, the crystal orientations from the steady-rolling region of the 1-ARB sheet were mapped to the 2-ARB elements at corresponding positions. The stacking sequence was realized by combining two 1-ARB sheets into one 2-ARB sheet, ensuring continuity of texture evolution across cycles. The simulation was conducted up to three ARB cycles, as texture typically stabilizes within this range (Wang et al., 2019a; Wang et al., 2019b).
The initial thickness and length of sheets were 1.0 mm and 34.0 mm, respectively (Figure 1a). The length was chosen to ensure a sufficiently large steady-rolling region. To avoid convergence issues as the sheet entered the rolling bite, the front end was shaped into a wedge. The roll diameter was 310 mm, and the rolling speed was 196 mm/s. The rolls were modelled as analytical rigid bodies, with a nominal rolling reduction of 50%. A friction coefficient of 0.12 was used to approximate lubricated rolling conditions, consistent with the calibrated value reported in Ref. (Wang et al., 2019b).
As a full-field approach, CPFEM enables detailed prediction of texture evolution. In this method, the crystal plasticity constitutive model was implemented within the finite element framework (Abaqus/Standard 2018), ensuring full coupling between texture evolution and plastic deformation. This coupling, in turn, allows for accurate prediction of texture development under various strain conditions (Zaefferer et al., 2003; Luan et al., 2020; Wang et al., 2019b).
The crystal plasticity model in the current research follows the well-recognized kinematical scheme developed by Asaro and Peirce (Peirce et al., 1983). In this model, the spin tensor is decomposed lattice rotation (
The
where
The shear strain rate
The
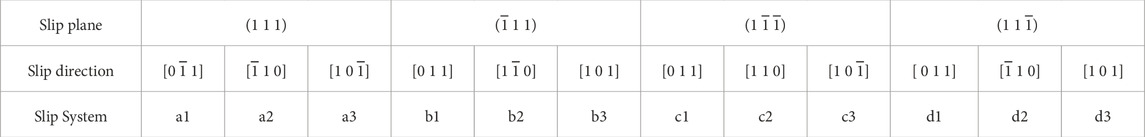
Table 1. Notation of 12 slip systems.
3 Results
Excluding the two ends, only the steady-rolling region was considered for calculating the simulation results.
3.1 Texture evolution
Simulations of the three bicrystals during the ARB process were carried out for up to three cycles. The initial and final textures of the steady-rolling region are presented as {1 1 1} pole figures in Figure 2, while the through-thickness crystal rotation angles (relative to the initial orientation) are shown in Figures 3, 4.
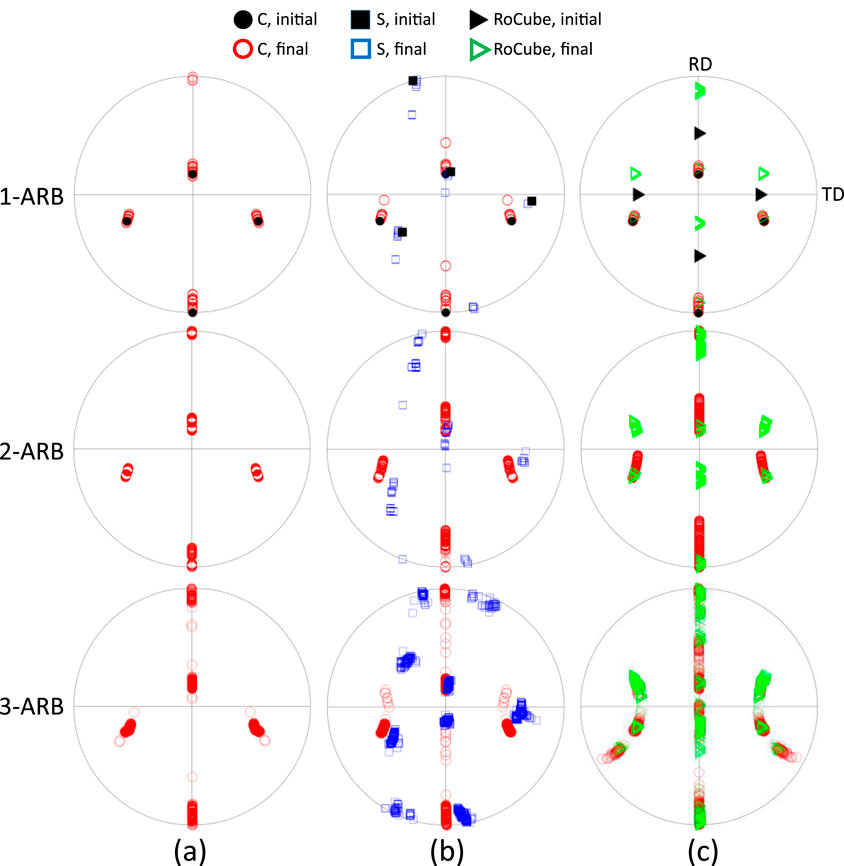
Figure 2. {1 1 1} pole figures after 1-ARB, 2-ARB, and 3-ARB of the (a) C-C, (b) C-S, and (c) C-RoCube bicrystals.
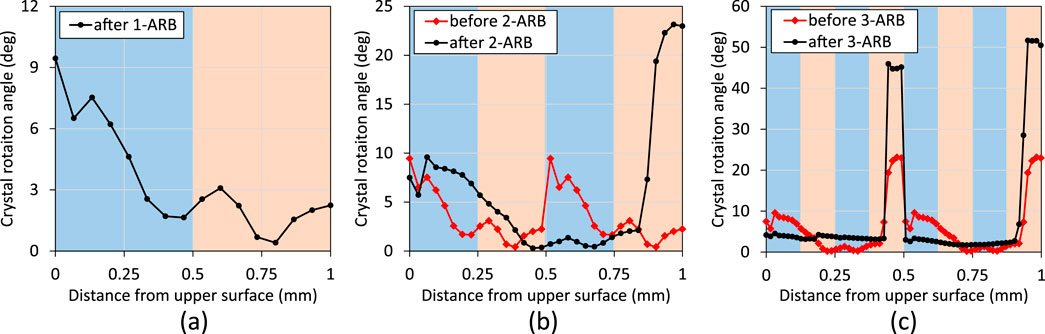
Figure 3. Distribution of crystal rotation angles along the thickness of C-C bicrystal after (a) 1-ARB, (b) before and after 2-ARB, and (c) before and after 3-ARB.
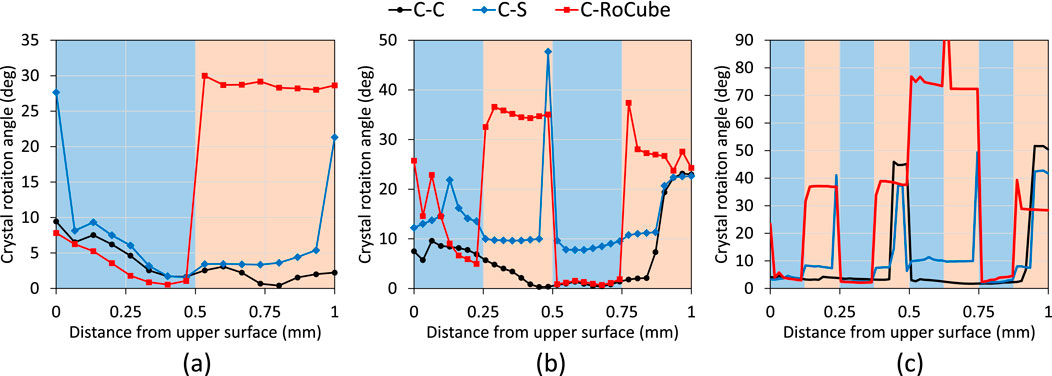
Figure 4. Distribution of crystal rotation angles along the thickness of C-C, C-S, and C-RoCube after (a) 1-ARB, (b) 2-ARB, and (c) 3-ARB.
For the C-C bicrystal (Figures 2a, 3), the crystal orientations rotated about the TD after 1-, 2-, and 3-ARB, with rotations occurring in both clockwise and anticlockwise directions (Figure 2a). The crystal rotation angles were very small after 1-ARB, with a maximum of 10° observed on the upper surface (Figure 3a). The distribution of crystal rotation angles was asymmetric about the mid-thickness because of the asymmetry of the C orientation. Because the crystal rotation angles on the upper and lower surfaces were different, a large misorientation angle developed at the interface before 2-ARB (Figure 3b). This interfacial misorientation angle, however, became negligible after 2-ARB. A different trend emerged in 3-ARB. A large misorientation angle developed at the mid-thickness interface before 3-ARB, and this angle increased sifnificantly after 3-ARB. This maximum rotation angle was located on the upper surface after 1-ARB but shifted to the lower surfaces after both 2-ARB and 3-ARB. This indicates that the previously developed texture strongly influenced subsequent textural evolution.
Figure 4 compares the through-thickness distribution of crystal rotation angles in the C-S and C-RoCube bicrystals with that of the C-C bicrystal. After 1-ARB (Figure 4a), the texture evolution behaviour of the C-S bicrystal was similar to that of the C-C bicrystal, except near the two surfaces. This similarity arose because the C orientation was close to the S orientation, with a misorientation angle of 19.4°. In the upper half of the sheet (Figure 4a), the initial orientation was C in all three bicrystals, and the crystal rotation angles exhibited similar distribution patterns. In contrast, the distributions of crystal rotation angles in the lower half of the sheet showed distinct differences among the three bicrystals, particularly in the RoCube region. The crystal rotation angles in the RoCube were significantly higher, reaching ∼30° (Figure 4a), with the final orientations closely aligning with the C orientation (Figure 2c). The misorientation angle between C and RoCube was 32.3°. Before 2-ARB, a small misorientation angle developed at the interface of the C-S bicrystal, and this misorientation increased substantially after 2-ARB. For the C-RoCube bicrystal after 2-ARB, the crystal rotation angles in the RoCube region were markedly higher than those in the neighbouring C layers (Figure 4b), resulting in large misorientation angles at all three interfaces. After 3-ARB, the distribution of crystal rotation angles in the C-S bicrystal resembled that of the C-C bicrystal, except for the large misorientation angles at the 1/4 and 3/4 thickness interfaces (Figure 4c), which originated form the previous mid-thickness interface after stacking. Additionally, the crystal rotation angles in the fifth layer (C) and sixth layer (RoCube) were unexpectedly high compared to the adjacent layers.
It is well known that RoCube is a component of shear-type texture, which remains unstable even on the surface under lubricated rolling in this study. In contrast, the C and S orientations are components of rolling-type texture and therefore exhibited smaller rotation angles during rolling. Interestingly, the crystal orientations of the C-C bicrystal were found to be close to the RoCube orientation at both the interface and lower surface (Figures 2a, 4c). This observation contradicts the fact that RoCube is generally unstable during rolling. This suggests that the RoCube orientation became stabilized under this bicrystal configuration, most likely due to the influence of interfaces.
Figure 5 illustrates the evolution of interface misorientation angles. In the C-C bicrystal (Figure 5a), the misorientation angles after 1-ARB were very small. Consequently, the initial misorientation angles at 0.25 mm and 0.75 mm in 2-ARB were also very low. During 2-ARB, the initial misorientation angle at the mid-thickness (0.5 mm) decreased dramatically from 11.7° to 0.5°. A large misorientation angle (30.5°) devleoped at the mid-thickness interface before 3-ARB, due to the substantial difference in crystal rotation angles between the upper and lower surfaces during 2-ARB. This misorientation angle further increased to 47.8° after 3-ARB. The evolution of misorientation angle in the C-S bicrystal (Figure 5b) was markedly different from that in the C-C bicrystal. The initial and final misorientation angles at the mid-thickness interface of 2-ARB were very high, and these high misorientation angles persisted at the 0.25 mm and 0.75 mm interfaces of 3-ARB. The changes in the misorientation angles at the other interfaces remained within the range of the initial misorientation angle (at the mid-thickness interface of 1-ARB).
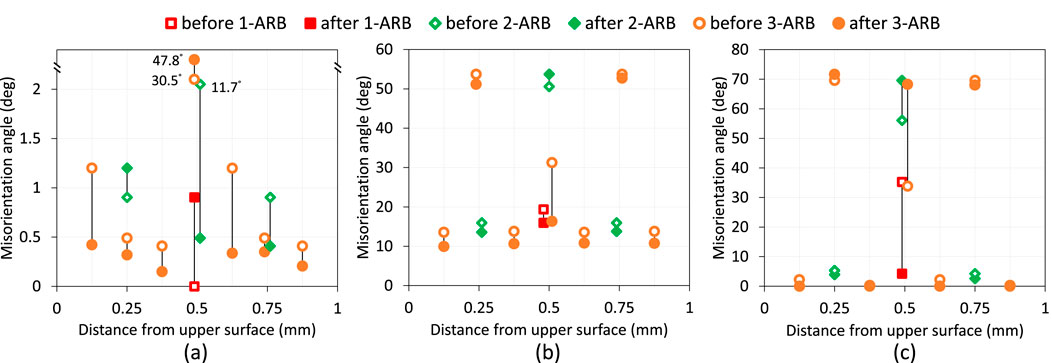
Figure 5. Misorientation angles at interface of (a) C-C, (b) C-S, and (c) C-RoCube bicrystals.
In the C-RoCube bicrystal (Figure 5c), the initial misorientation angle at the mid-thickness interface after 1-ARB dropped sharply from 35.3° to 4.2°, and this angle remained low after this interface was shifted to the 0.25 mm and 0.75 mm positions in 2-ARB, and to the 0.125 mm, 0.375 mm, 0.625 mm, and 0.825 mm interfaces of 3-ARB. A newly developed misorientation angle at the mid-thickness interface of 2-ARB increased from 56.1° to 69.6°, and this high misorientation angle was retained at the 0.25 mm and 0.75 mm interfaces of 3-ARB. Another newly developed misorientation angle at the mid-thickness interface of 3-ARB also increased substantially.
3.2 Plastic deformation
It is well known that plastic deformation and texture evolution are mutually interdependent. To correlate with the through-thickness crystal rotation angles in Figure 4, the distribution of shear strain
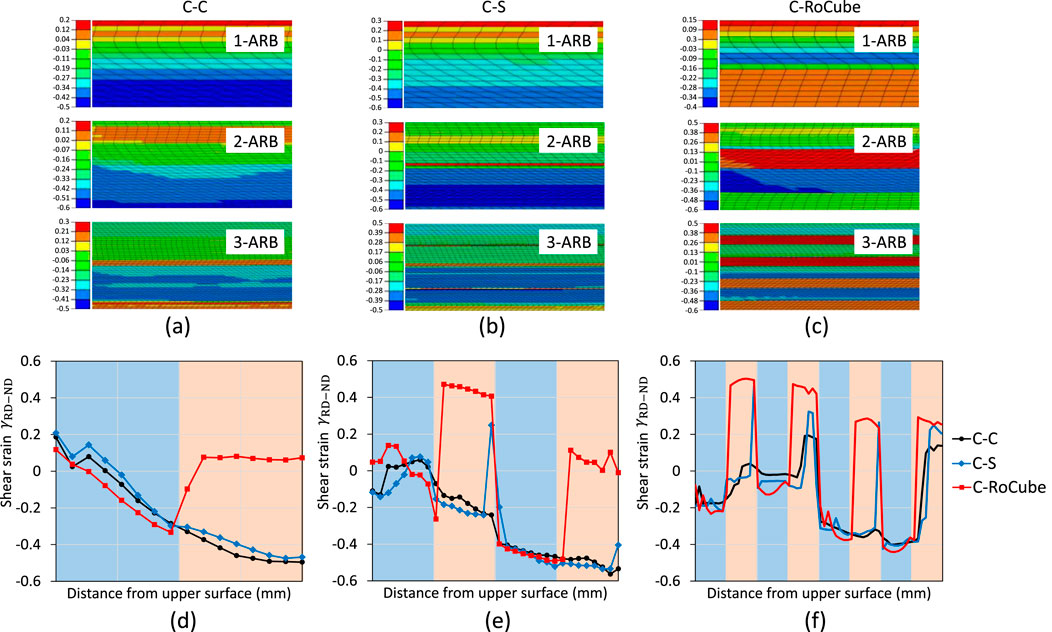
Figure 6. Contour of shear strain
It is known from the crystal plasticity theory (i.e., Equations 1 and 2) that the crystal rotation angles (Figure 4), macroscopic plastic deformation (shear strain in Figure 6), and slip activities (Figure 7) are correlated. In 1-ARB and 2-ARB of C-C bicrystals, only two sets of slip systems were activated, i.e., a1-a3 and b2-c2 (Figure 7a). The most highly activated slip system set alternated from the upper surface to the lower surface. Another slip system set, d1–d3, was activated at the mid-thickness interface and lower surface of 3-ARB (Figure 7a), where the local crystal orientation approached the RoCube component. In Figure 7b, the behaviour of slip activity in the C layer of the C-S bicrystals was similar to that in the corresponding layer of C-C bicrystals in 1-ARB and 2-ARB, while the slip activity in the S layer was markedly different. Due to the asymmetry of the S orientation, the shear strains on the four most highly activated slip systems differed significantly. In 1-ARB of C-S bicrystals, the shear strain on a1 slip system was exceedingly higher than that on the other three slip systems, and a similar behaviour occurred in the second S layer (0.75 mm–1 mm) of 2-ARB. The difference in shear strain between these four slip systems was small in the first S layer (0.25 mm–0.5 mm) of 2-ARB. The behaviours of slip activities became more complex in 3-ARB, with the dominant slip system alternating among the 4 S layers.
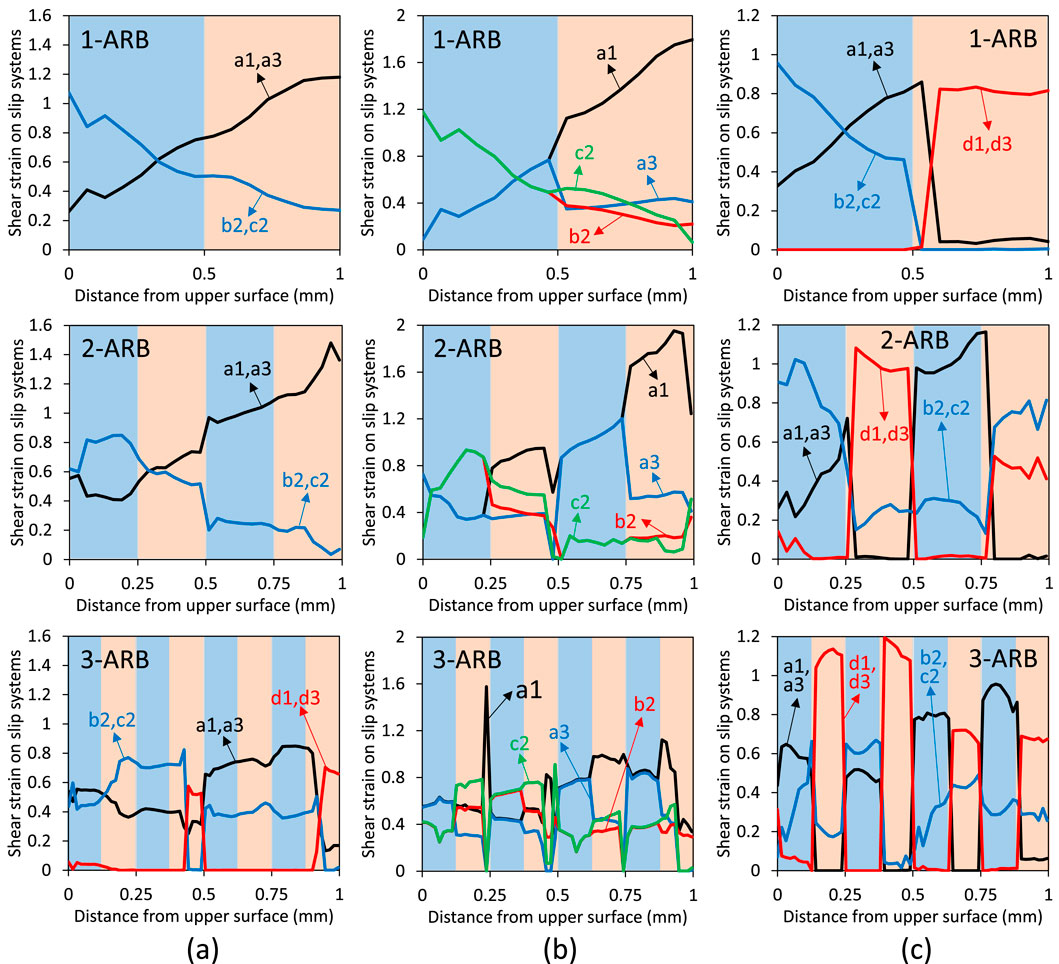
Figure 7. Distribution of shear strain on slip systems along the thickness after 1-ARB, 2-ARB, and 3-ARB of the (a) C-C, (b) C-S, and (c) C-RoCube bicrystals.
As for C-RoCube in Figure 7c, the slip activities in the C layers of 1-ARB, 2-ARB, and 3-ARB were similar to the corresponding layers of C-C bicrystals (Figure 7a), though slight deviations were observed near the interfaces. This indicates that the interface, and more specifically the misorientation angles across the interfaces, significantly influence slip activities. In the RoCube layer of C-RoCube bicrystals, the d1-d3 slip system set was exceedingly activated compared to the a1-a3 set, which clearly demonstrates the inherent instability of the RoCube orientation. The activated slip systems in the RoCube layer were the same as the interface and lower surface of C-C bicrystals in 3-ARB (Figure 7a). In addition to the d1-d3 slip system set, another slip system set, b2-c2, was also activated in the RoCube layer of C-RoCube during 2-ARB (Figure 7c), since the initial RoCube rotated toward the C orientation. After 3-ARB, three slip system sets (a1-a3, b2-c2, and d1-d3) were activated in the first C layer and the last RoCube layer, while only two sets of slip systems were activated in the other layers.
4 Discussion
The texture evolution and plastic deformation of three bicrystals after ARB were numerically investigated using CPFEM. The comparative study clearly demonstrates the effect of misorientation angles at grain interfaces on the deformation behavior.
The adopted CPFEM model is the so-called full-filed method, since no homogenization is theoretically assumed (Wang et al., 2019b). The crystal plasticity (CP) constitutive law was incorporated into FEM framework, where the FEM was used as the solver and the CP constitutive law was used to determine the deformation and texture in each element after every FEM increment (Feather et al., 2021). Therefore, the crystal orientations and plastic deformation are fully coupled in CPFEM, ensuring the strain compatibility and stress equilibrium are reached (Siddiq and Schmauder, 2024). The CPFEM model is well-suited for predicting deformation behavior of single crystals and bicrystals, which show significant anisotropy, because the textural anisotropy also influences the distribution of imposed strain (Wang et al., 2019a). Another factor determining the textural prediction accuracy is the choice of hardening model. In this study, the adopted Bassani-Wu model is a rate-dependent phenomenological model, which accurately describes the three-stage hardening behavior in FCC single crystals during straining (Siddiq and Schmauder, 2024). This hardening model was regarded the best texture predictors among the five compared hardening laws (Lin and Havner, 1996).
The coupling between plastic deformation and crystal rotation in CPFEM was investigated using the case of C-C during 3-ARB (Figure 8a). The evolved values of through-thickness shear strain
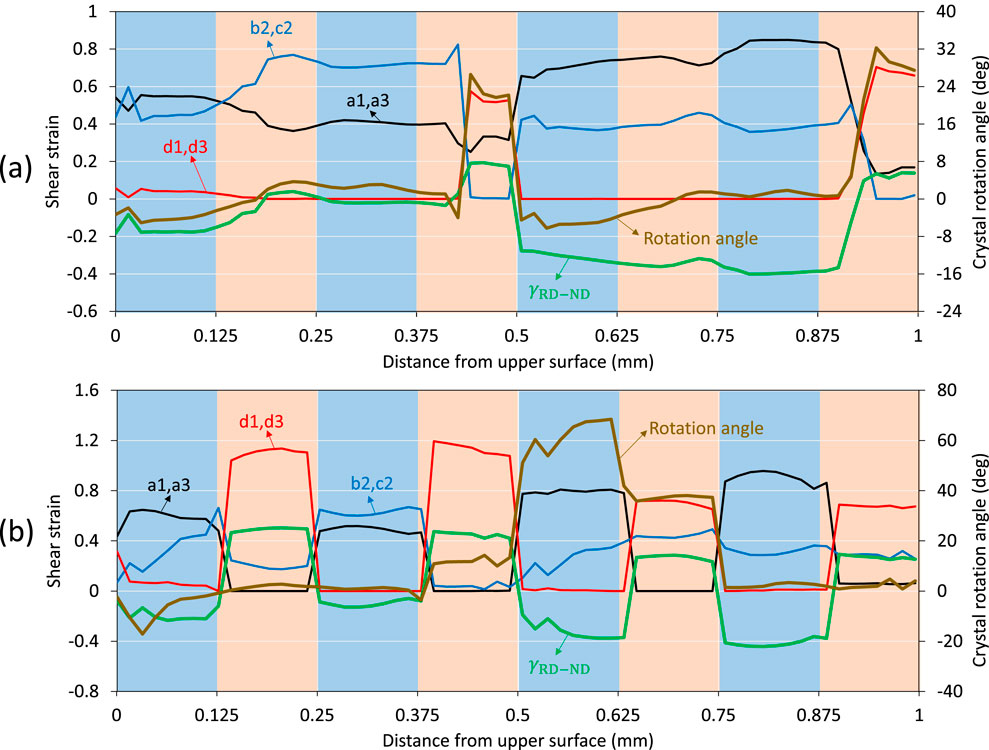
Figure 8. Distribution of shear strain
In Figure 8a, a sharp transition of deformation behaviour was observed in the fourth layer (0.375 mm–0.5 mm). In this layer, the primarily activated slip system set changed from b2-c2 to a1-a3, and large rotation angle and shear strain developed. This transition was due to the fact that a large misorientation angle developed at the mid-thickness interface before 3-ARB (Fig.a), which was caused by the different crystal rotation angles at the upper and lower surfaces of 2-ARB (Figure 3c). This pre-existing misorientation angle at the mid-thickness interface increased after 3-ARB. In contrast, the misorientation angles at all other interfaces were very low before and after 3-ARB, and thus the plastic deformation varied smoothly along the thickness at these interfaces. The large misorientation angle at the mid-thickness interface before and after 3-ARB altered the plastic deformation and crystallographic rotation in this region.
Unlike the C-C single crystal, the deformation behaviour of C-S and C-RoCube bicrystals exhibited alternating patterns across their interfaces (Figures 7b, 8b). The deformation behavior of C-S was similar to that of the C-C bicrystal except for sharp changes observed at the interfaces. This was due to the small initial misorientation angle between the C and S crystals, combined with the development of large misorientation angles at the interfaces during deformation. In contrast, the C-RoCube bicrystal initially possessed a large misorientation angle, and sharp transitions in deformation behaviour were also observed at its interfaces. However, within each layer of the C-RoCube bicrystal, the deformation behaviour was primarily governed by the initial crystallographic orientation of that layer.
5 Conclusion
1. CPFEM modelling of ARB-processed bicrystals was performed for the first time, covering three configurations: C-C, C-S, and C-RoCube.
2. Differences in crystal rotation between the upper and lower surfaces during an ARB cycle led to the development of misorientation angles at the mid-thickness in the subsequent cycle, even in the C-C bicrystal.
3. In the C-C bicrystal, the misorientation angles after each ARB cycle remained negligibly low, despite initially high misorientation angles before 2-ARB and 3-ARB.
4. For the C-S bicrystal, the pre-existing interface misorientation angles decreased after ARB, due to the initially low misorientation between the C and S orientations (19.4°).
5. Misorientation angles at interfaces significantly influenced the deformation behavior on either side of the interface, with the extent of alteration depending on the magnitude of the misorientation.
Data availability statement
The raw data supporting the conclusions of this article will be made available by the authors, without undue reservation.
Author contributions
JZ: Formal Analysis, Investigation, Methodology, Writing – original draft. JW: Conceptualization, Formal Analysis, Investigation, Writing – original draft. XJ: Methodology, Project administration, Resources, Writing – review and editing. CW: Formal Analysis, Investigation, Software, Writing – original draft. HW: Conceptualization, Investigation, Superivsion, Writing – original draft. GW: Conceptualization, Validation, Project administration, Writing – review and editing.
Funding
The author(s) declare that financial support was received for the research and/or publication of this article. This work was supported by the Key Research Program on Elderly Health of the Jiangsu Provincial Health Commission (LKZ2023018), and Nantong Science and Technology Bureau (JC2023044).
Conflict of interest
The authors declare that the research was conducted in the absence of any commercial or financial relationships that could be construed as a potential conflict of interest.
Generative AI statement
The author(s) declare that no Generative AI was used in the creation of this manuscript.
Any alternative text (alt text) provided alongside figures in this article has been generated by Frontiers with the support of artificial intelligence and reasonable efforts have been made to ensure accuracy, including review by the authors wherever possible. If you identify any issues, please contact us.
Publisher’s note
All claims expressed in this article are solely those of the authors and do not necessarily represent those of their affiliated organizations, or those of the publisher, the editors and the reviewers. Any product that may be evaluated in this article, or claim that may be made by its manufacturer, is not guaranteed or endorsed by the publisher.
References
Bandyopadhyay, A., Mitra, I., Ciliveri, S., Avila, J. D., Dernell, W., Goodman, S. B., et al. (2024). Additively manufactured Ti–Ta–Cu alloys for the next-generation load-bearing implants. Int. J. Extrem. Manuf. 6, 015503. doi:10.1088/2631-7990/ad07e7
Cantergiani, E., Riedel, M., Karhausen, K. F., Roters, F., Quadfasel, A., Falkinger, G., et al. (2024). Simulations of texture evolution in the near-surface region during aluminum rolling. Metall. Mater Trans. A 55, 3327–3350. doi:10.1007/s11661-024-07472-y
Chen, L.-Y., Qin, P., Zhang, L., and Zhang, L.-C. (2024). An overview of additively manufactured metal matrix composites: preparation, performance, and challenge. Int. J. Extrem. Manuf. 6, 052006. doi:10.1088/2631-7990/ad54a4
Chen, K., Dong, J., Putra, N. E., Fratila-Apachitei, L. E., Zhou, J., and Zadpoor, A. A. (2026). Additively manufactured function-tailored bone implants made of graphene-containing biodegradable metal matrix composites. Prog. Mater. Sci. 155, 101517. doi:10.1016/j.pmatsci.2025.101517
Dabou, O., Bensouilah, A., Baudin, T., Brisset, F., Perrière, L., Helbert, A.-L., et al. (2023). Evolution of the texture, microstructure, and magnetic properties of a Permimphy alloy after accumulative roll bonding and aging. J. Mater Sci. 58, 15884–15900. doi:10.1007/s10853-023-08994-3
Davis, R., Singh, A., Jackson, M. J., Coelho, R. T., Prakash, D., Charalambous, C. P., et al. (2022). A comprehensive review on metallic implant biomaterials and their subtractive manufacturing. Int. J. Adv. Manuf. Technol. 120, 1473–1530. doi:10.1007/s00170-022-08770-8
Delavar, H., Mostahsan, A. J., and Ibrahim, H. (2023). Corrosion and corrosion-fatigue behavior of magnesium metal matrix composites for bio-implant applications: a review. J. Magnesium Alloys 11, 1125–1161. doi:10.1016/j.jma.2023.04.010
Ebrahimi, M., and Wang, Q. (2022). Accumulative roll-bonding of aluminum alloys and composites: an overview of properties and performance. J. Mater. Res. Technol. 19, 4381–4403. doi:10.1016/j.jmrt.2022.06.175
Feather, W. G., Savage, D. J., and Knezevic, M. (2021). A crystal plasticity finite element model embedding strain-rate sensitivities inherent to deformation mechanisms: application to alloy AZ31. Int. J. Plasticity 143, 103031. doi:10.1016/j.ijplas.2021.103031
Gao, X., Fraulob, M., and Haïat, G. (2019). Biomechanical behaviours of the bone–implant interface: a review. J. R. Soc. Interface. 16, 20190259. doi:10.1098/rsif.2019.0259
Gerashi, E., Alizadeh, R., and Langdon, T. G. (2022). Effect of crystallographic texture and twinning on the corrosion behavior of Mg alloys: a review. J. Magnesium Alloys 10, 313–325. doi:10.1016/j.jma.2021.09.009
Kashihara, K., Tsujimoto, Y., Terada, D., and Tsuji, N. (2013). Texture evolution in {112} 〈111〉 aluminum single crystals processed by severe plastic deformation. Mater. Charact. 75, 129–137. doi:10.1016/j.matchar.2012.10.008
Kashihara, K., Komi, Y., Terada, D., and Tsuji, N. (2014). Stability of {4 4 11} <11 11 8> Orientation in a {123} 〈634〉 Aluminum Single Crystal Processed by Accumulative Roll Bonding, Mater. Trans 55, 1656–1661. doi:10.2320/matertrans.L-M2014833
Lin, G., and Havner, K. S. (1996). A comparative study of hardening theories in torsion using the Taylor polycrystal model. Int. J. Plasticity 12, 695–718. doi:10.1016/S0749-6419(96)00025-3
Luan, Q., Xing, H., Zhang, J., and Jiang, J. (2020). Experimental and crystal plasticity study on deformation bands in single crystal and multi-crystal pure aluminium. Acta Mater. 183, 78–92. doi:10.1016/j.actamat.2019.11.006
Peirce, D., Asaro, R. J., and Needleman, A. (1983). Material rate dependence and localized deformation in crystalline solids. Acta Metall. 31, 1951–1976. doi:10.1016/0001-6160(83)90014-7
Ramkumar, K. R., Dinaharan, I., Murugan, N., and Kim, H. S. (2024). Development of aluminum matrix composites through accumulative roll bonding: a review. J. Mater Sci. 59, 8606–8649. doi:10.1007/s10853-024-09682-6
Semenchenko, L. V., Mier, R. M., Muyanja, N. S., and Demkowicz, M. J. (2024). Near-Surface layer perforations as precursors to fracture in accumulative roll bonding of a multilayered metal composite. Metall. Mater Trans. A 55, 63–72. doi:10.1007/s11661-023-07222-6
Siddiq, A., and Schmauder, S. (2024). Crystal plasticity parameter identification procedure for single crystalline material during deformation.
Su, L., Lu, C., Gazder, A. A., Saleh, A. A., Deng, G., Tieu, K., et al. (2014). Shear texture gradient in AA6061 aluminum alloy processed by accumulative roll bonding with high roll roughness. J. Alloys Compd. 594, 12–22. doi:10.1016/j.jallcom.2014.01.125
Valiev, R. Z., Straumal, B., and Langdon, T. G. (2022). Using severe plastic deformation to produce nanostructured materials with superior properties. Annu. Rev. Mater. Res. 52, 357–382. doi:10.1146/annurev-matsci-081720-123248
Wang, H., Lu, C., Tieu, K., Deng, G., Wei, P., and Liu, Y. (2019a). A crystal plasticity FEM study of through-thickness deformation and texture in a {112} 〈111〉 aluminium single crystal during accumulative roll-bonding. Sci. Rep. 9, 3401. doi:10.1038/s41598-019-39039-y
Wang, H., Lu, C., Tieu, K., Wei, P., and Yu, H. (2019b). Texture Modeling of Accumulative Roll-Bonding Processed Aluminum Single Crystal {1 2 3}<6 3 4> by Crystal Plasticity FE. Adv. Eng. Mater 21, 1800827. doi:10.1002/adem.201800827
Wang, C., Tian, P., Cao, H., Sun, B., Yan, J., Xue, Y., et al. (2022). Enhanced biotribological and anticorrosion properties and bioactivity of Ti6Al4V alloys with laser texturing. ACS Omega 7, 31081–31097. doi:10.1021/acsomega.2c03166
Wu, M., Zhao, M., Cai, Y., Yao, J., Wang, P., and Atrens, A. (2024). Recent advances in bio-functional Ta-based bone materials: materials design and bioactivity. Int. J. Extrem. Manuf. 6, 062010. doi:10.1088/2631-7990/ad7b03
Zaefferer, S., Kuo, J.-C., Zhao, Z., Winning, M., and Raabe, D. (2003). On the influence of the grain boundary misorientation on the plastic deformation of aluminum bicrystals. Acta Mater. 51, 4719–4735. doi:10.1016/S1359-6454(03)00259-3
Keywords: biomaterial, metal matrix composite, crystal plasticity, accumulative roll-bonding, bicrystal
Citation: Zhang J, Wei J, Jiang X, Wang C, Wang H and Wu G (2025) A crystal plasticity FEM study on the deformation behaviours of bicrystals composites for potential use as load-bearing implants. Front. Mater. 12:1694117. doi: 10.3389/fmats.2025.1694117
Received: 29 August 2025; Accepted: 16 October 2025;
Published: 03 November 2025.
Edited by:
Mohammed Zikry, North Carolina State University, United StatesReviewed by:
Liang-Yu Chen, Jiangsu University of Science and Technology, ChinaMuh-Jang Chen, Los Alamos National Laboratory (DOE), United States
Copyright © 2025 Zhang, Wei, Jiang, Wang, Wang and Wu. This is an open-access article distributed under the terms of the Creative Commons Attribution License (CC BY). The use, distribution or reproduction in other forums is permitted, provided the original author(s) and the copyright owner(s) are credited and that the original publication in this journal is cited, in accordance with accepted academic practice. No use, distribution or reproduction is permitted which does not comply with these terms.
*Correspondence: Hui Wang, aHc3MzdudHVAMTYzLmNvbQ==; Guihua Wu, d3V1dWFAMTYzLmNvbQ==