 Fa Zhang1
 Mutian Jia
 Giuseppe Lacidogna
 Jie Xu
- 1Shandong Electric Power Engineering Consulting Institute Corp., Ltd., Jinan, China
- 2School of Civil Engineering, Tianjin University, Tianjin, China
- 3Department of Structural, Geotechnical and Building Engineering, Politecnico di Torino, Torino, Italy
Vertical cracks in prestressed high-strength concrete (PHC) pipe piles caused by internal frost heaving endanger the safety and operational efficiency of photovoltaic facilities in cold regions. However, the underlying failure mechanisms remain insufficiently understood. This study investigates the cracking process by combining laboratory experiments with finite-element analysis (FEA) using the concrete damage plasticity (CDP) model. The results reveal a distinct cracking mechanism. In the experiment of this article, initiated at a temperature threshold of −5 °C to −8 °C, cracks consistently originate at the projection of prestressed tendons on the inner wall. These locations act as structural weak points where the concrete’s tensile strength is first exceeded. The subsequent failure is brittle, characterized by synchronous axial propagation and a guided, inside-out radial development along the tendons. A parametric analysis further reveals that increasing the concrete strength, axial prestress level, and wall thickness are effective strategies for enhancing cracking resistance by delaying both crack initiation and propagation. Applying external radial prestress is also a highly effective protective measure. The findings of this study can provide a basis for optimizing the anti-freezing design and protection of PHC piles.
1 Introduction
Against the backdrop of global climate change, many countries are actively exploring low-carbon development pathways (Li et al., 2024), which has led to the rapid rise of the photovoltaic industry within the clean energy field. Prestressed high-strength concrete (PHC) pipe piles used to support photovoltaic panels are widely adopted for their high strength, good durability, convenient construction, and short construction period, gradually becoming an indispensable key component in photovoltaic support structures. In addition, PHC pipe piles are also extensively applied in such fields as industrial and civil construction, bridge engineering, photovoltaic supports, ports and wharves, expressways, and pile foundation engineering (Feng et al., 2025). Many scholars in the industry have carried out extensive research into the various mechanical properties of these pipe piles.
In terms of mechanical properties, ChoiYongkyu and KimMyunghak (2018) focused on different types of tip-deformed PHC piles and studied their vertical bearing characteristics through field tests. Wen et al. (2024) studied the flexural performance of non-autoclaved PHC pipe piles with different rubber contents and analyzed the influence of rubber content on the cracking moment, ultimate moment, and deformation capacity of the pipe piles. Xiao et al. (2023) studied the bearing performance and settlement characteristics of ultra-long PHC pipe piles under static and dynamic loads. Li and Li (2023) carried out high-strain dynamic tests and static load tests on PHC pipe piles and studied their bearing capacity. Oktiovan et al. (2021) analyzed the shear failure of PHC piles under different axial load ratios and studied their mechanical properties in the tests. In terms of the interaction between PHC pipe piles and soil, Islam et al. (2024) used three-dimensional finite-element analysis to study the lateral response and failure mechanism of single and group PHC piles in cement-improved soil and explored the influence of factors such as pile spacing, embedment depth, and improved soil thickness. Jun et al. (2024) studied the long-term settlement characteristics of PHC pipe pile foundations treated by the deep mixing method in soft clay by establishing a numerical model and analyzed the influence of factors such as load magnitude, modified creep index, DCM column radius, depth, and strength on the settlement of pipe piles.
However, if the production, design, construction, and service links are not properly handled, the pile body often cracks due to the poor ductility of PHC pipe piles, which seriously affects its bearing capacity and durability. Through research and analysis, many scholars have concluded that the cracking of pipe piles is generally due to the following reasons: (1) Production process reasons. Liu (2008) noted that in PHC pipe pile production, insufficient craftsmanship during spinning can cause vibration and quality risks, while sling length differences during lifting and unavoidable collisions when placing into curing tanks can lead to permanent damage and fine vertical cracks in unset concrete, with the latter more likely as the diameter increases. (2) Construction process reasons. Hu and Huang (2011) analyzed and found that due to the use of the centrifugal method to compact the concrete, the compactness of PHC pipe piles is worse than that of prestressed square piles (vibrated) and large pipe piles (vibrated and rolled), resulting in low hammer-resistant tensile capacity and easy occurrence of vertical cracks during construction. (3) Service environment reasons. Many of the cracks in PHC pipe piles develop during service, especially in cold regions, mostly as vertical splitting cracks. Tan et al. (2022) investigated this by means of theoretical calculation and numerical simulation and attributed this to water invading initial cracks: freezing expansion in cold environments expands initial cracks into through-cracks via frost heaving force, but the study lacked experimental data and further analysis of cracking characteristics. Zhang and Xin (2020) noted frost heave of internal fillers as a cause, citing low temperature and rich water in a reservoir photovoltaic pile case. Yueming et al. (2021) found that frost heaving force turns pipe piles’ circumferential stress from compression to tension, causing tensile cracking. Through numerical simulation based on Abaqus, Zhang and Xin (2019) explained that cold-season soil and water in piles enable frost heave, generating radial pressure that makes circumferential tensile stress; when exceeding concrete tensile strength, vertical cracks form and expand over freeze–thaw cycles, but the article lacked experimental results on real pipe piles. Kong et al. (2021) added that initial cracks in cold, water-rich environments let water penetrate via capillarity; subsequent freezing forms ice wedges, propagates cracks, and accelerates steel corrosion. Wang et al. (2023) found that periodic freeze–thaws damage the concrete’s meso-structure, reducing bearing capacity. Yueming et al. (2021) noted horizontal loads on photovoltaic support piles cause stress concentration at crack tips, accelerating crack development.
This vertical failure mode under the service environment, extensively discussed in existing literature, poses a tangible threat to infrastructure in cold regions. For instance, Figure 1a shows the pipe piles of a project located in Shandong Province, China. The area has a temperate monsoon climate, and the minimum temperature in winter can reach −10 °C. After investigation, 935 (7%) of the 13,851 pipe piles in an area of over 800,000 square meters, which have poor drainage, developed vertical split-shaped cracks as shown in Figure 1b after winter. Similar results were discovered by researchers such as Zhang and Xin (2020) and Yueming et al. (2021).
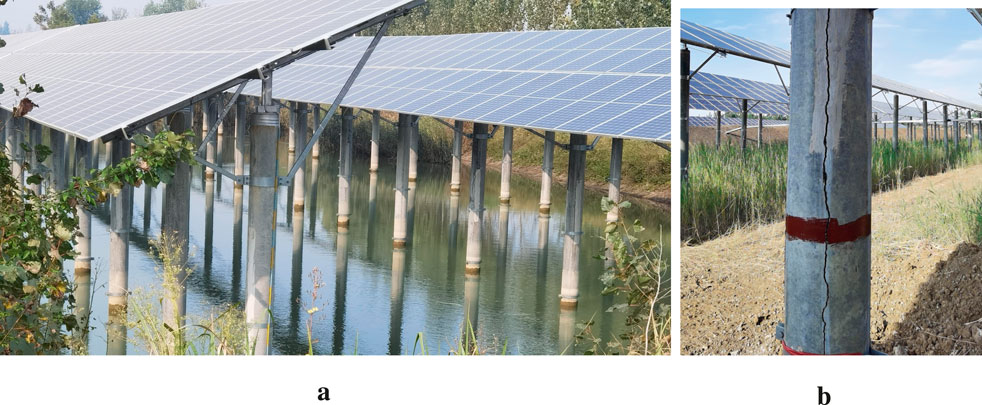
Figure 1. PHC pipe piles and the vertical cracking. (a) PHC pipe piles. (b) Vertical cracking of the pipe pile.
Previous research has attributed the vertically cracking of PHC piles to frost heave, often focusing on the cumulative damage from freeze–thaw cycles. However, these studies frequently rely on numerical simulations without direct experimental validation on pile components or provide only qualitative descriptions of the failure. Consequently, a clear and experimentally validated mechanical explanation for why cracks initiate specifically at the prestressed tendons and how they dynamically propagate through the pile wall during a single, critical freezing event has been missing.
This study bridges this critical gap by combining a controlled low-temperature experiment with a validated finite element model. The primary contributions of this work are as follows:
1. The dynamic process of cracking, which initiates at the inner wall and propagates radially outward, is experimentally captured and quantified, providing direct evidence for this failure progression.
2. The dual and conflicting roles of the steel reinforcement system are clarified. The longitudinal prestressed tendons are identified as the primary cause of crack initiation due to a stiffness mismatch that creates stress concentration, whereas the circumferential stirrups serve to restrain crack growth and maintain structural integrity post-cracking.
3. Practical design guidance is provided through parametric analysis, which demonstrates that increasing concrete strength, axial prestress levels, wall thickness, and external radial prestress are effective methods for retarding both crack initiation and propagation.
2 PHC pipe pile low-temperature experiment
2.1 Experimental design
A PHC pipe pile used for photovoltaic support in an actual project was selected. Figure 2a shows the structural form and dimension parameters of this support, and Figure 2b presents the dimension information of the PHC pipe pile. The specimens adopted the same model (PHC300-AB-70) as used in the project, with an outer diameter of 300 mm and a wall thickness of 70 mm. Internally, the pile contains six vertically arranged HPB300 prestressed tendons and circumferential stirrups (cold-drawn low-carbon steel wire, denoted as
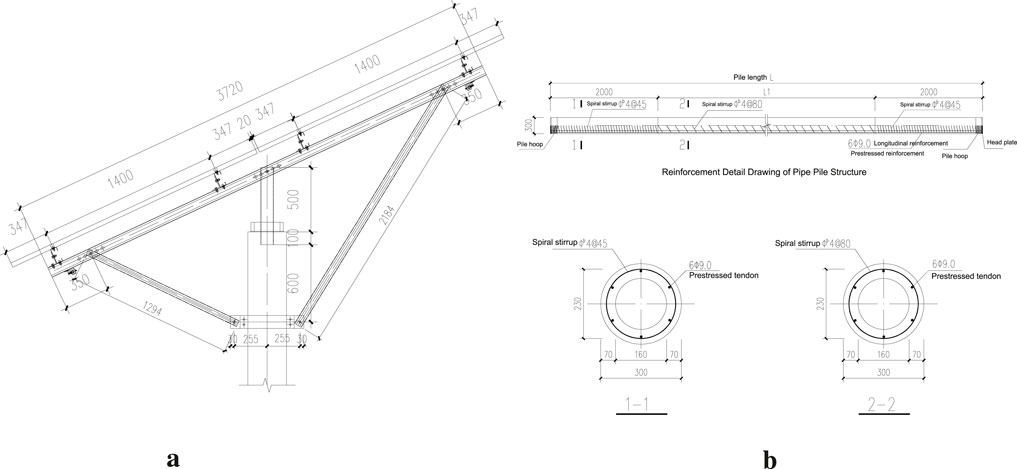
Figure 2. Elevation view of the photovoltaic support and PHC pipe pile structural information (dimensions in mm). (a) Elevation view of the photovoltaic support. (b) PHC pipe pile structural information.
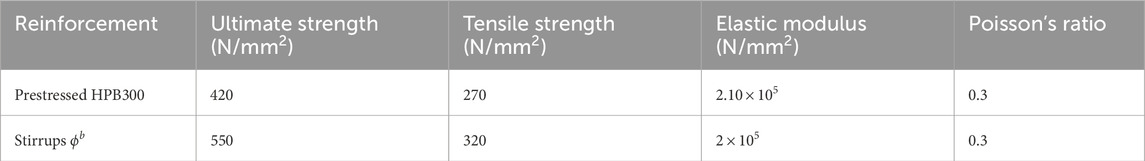
Table 1. Material parameters of prestressed tendons and stirrups.
The experiment utilized the ultra-low-temperature environmental chamber at Tianjin University for cooling, as shown in Figure 3a, which provides a precisely controllable low-temperature environment with a minimum temperature of −120 °C and a temperature control accuracy of
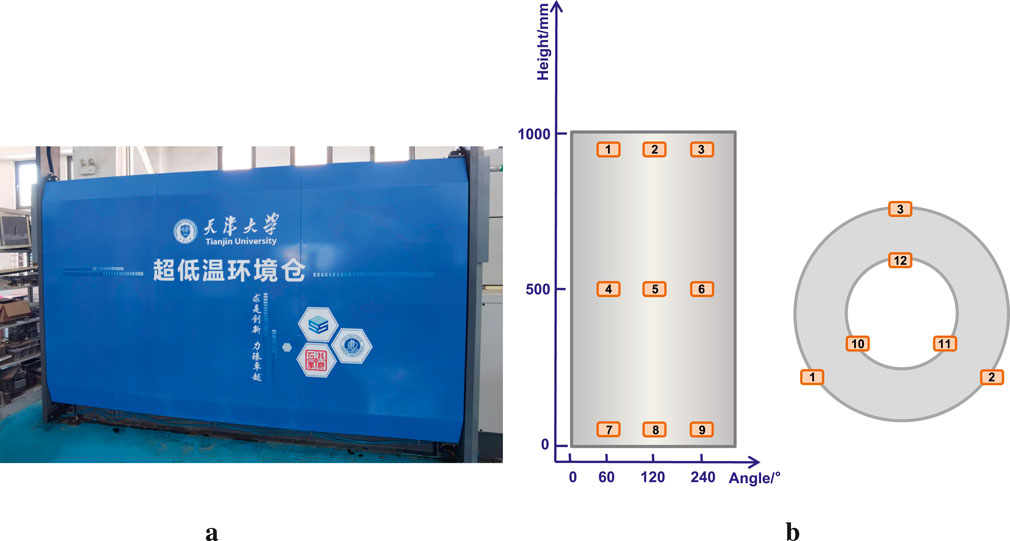
Figure 3. Ultra-low-temperature environment chamber and strain gauge arrangement. (a) Ultra-low-temperature environment chamber. (b) Strain gauge arrangement.
Three identical PHC300-AB-70 pipe piles (1 m in length) were tested, numbered Pipe Pile 1, 2, and 3. Each pile was sealed at the bottom with grouting material while leaving the top open; after being filled with water, they were placed in the chamber for cooling. The cooling protocol was set as follows: 5 °C /h from 20 °C to 0 °C, then 1.5 °C /h from 0 °C to −40 °C, with the final temperature maintained for a sufficient duration. To monitor strain variations, BFH120-50AA-R1-D150 strain gauges (sensitivity coefficient: 2.10
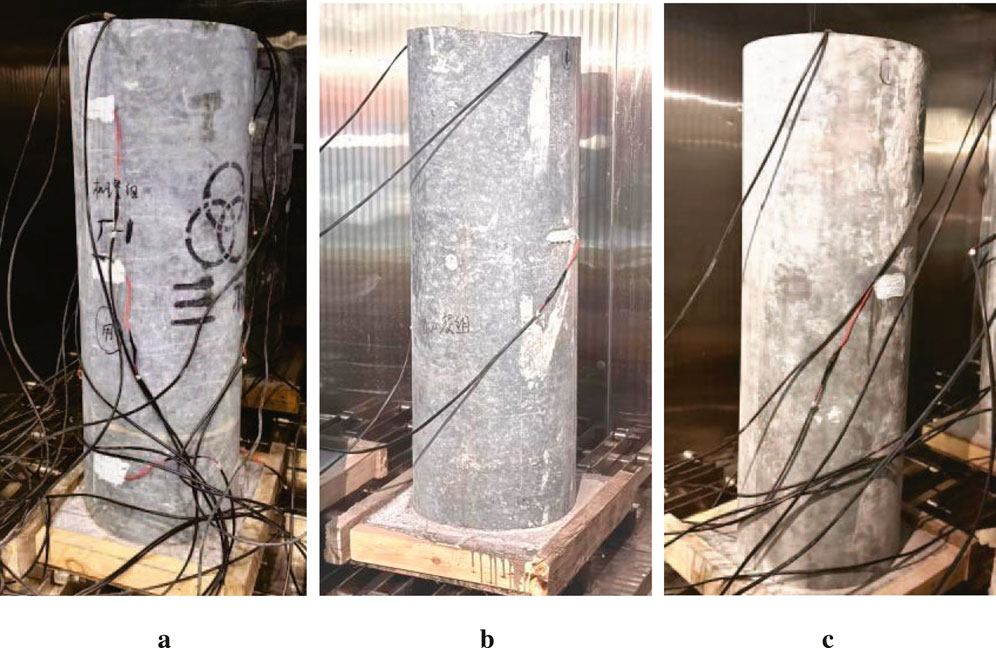
Figure 4. Pipe pile specimens. (a) Pipe Pile 1. (b) Pipe Pile 2. (c) Pipe Pile 3.
This experiment was conducted under working conditions where the interior of the PHC pipe piles was completely filled with water for the frost heave test. This working condition was set based on actual engineering scenarios and with the aim of obtaining the most conservative and safest results. In practical engineering, the height of water accumulated inside pipe piles may vary; however, our choice of completely filling the piles with water is based on the following two considerations: (1) Identifying the most unfavorable working condition: When the interior of a pipe pile is completely filled with water, it means the total volume expansion generated during the freezing process is maximized, thereby causing the frost heave pressure exerted on the pipe pile wall to reach the maximum possible value (i.e., the most severe/conservative working condition). By conducting the experiment under this most unfavorable load condition, the key parameters of the pipe piles that we can determine—such as crack initiation temperature, critical strain, and failure time—will serve as the upper safety limit for evaluating the frost heave resistance of the pipe piles. (2) Focusing on the core failure mechanism: Completely filling the pipe piles with water provides clear and controllable boundary conditions, ensuring that the frost heave force is applied uniformly along the height of the pipe piles. This enables us to more effectively explore and quantify the cracking mechanism of PHC pipe piles under the action of internal frost heave forces.
2.2 Experiment results
After the experiment was completed, the three pipe piles were taken out of the environmental chamber, drained of water, and inspected for cracks, as shown in Figure 5. Subsequently, an in-depth analysis was conducted on crack morphology, size, and strain data.
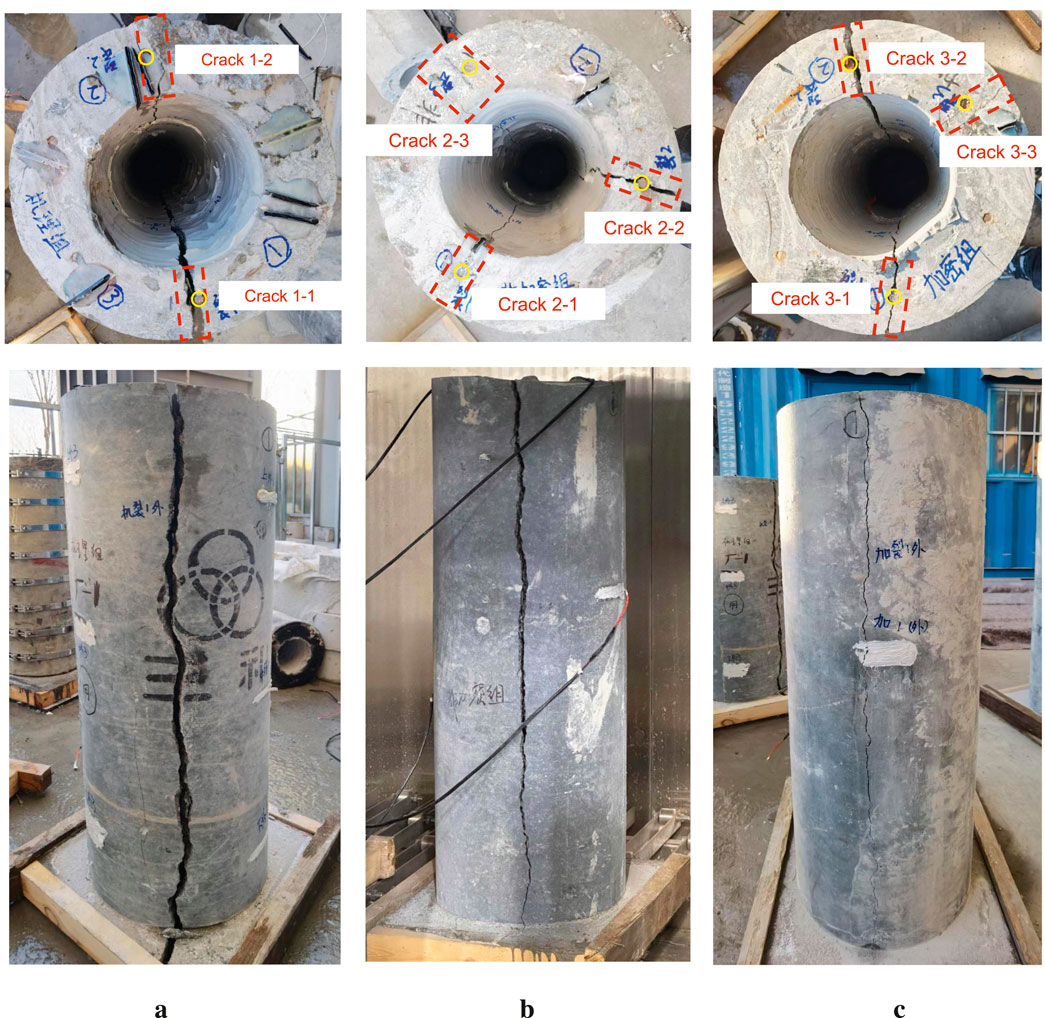
Figure 5. Cracking situations of pipe piles. (a) Cracking situation of Pipe Pile 1. (b) Cracking condition of Pipe Pile 2. (c) Cracking condition of Pipe Pile 3.
The experiment found that the locations where cracks occur show a high degree of regularity. As shown in Table 2, the three pipe piles produced a total of eight visible macroscopic cracks. Statistical data indicate that the “total number of cracks” in each pipe pile is exactly equal to the “number of cracks passing through the prestressed tendons;” all cracks initiated and propagated through the radial paths where the longitudinally distributed prestressed tendons are located. The positions of the prestressing tendons are marked with yellow circles in Figure 5. This phenomenon shows that under the action of internal frost heaving pressure, the interface area between the prestressed tendons and concrete is a weak link of the structure and is the preferred location for stress concentration and cracking.
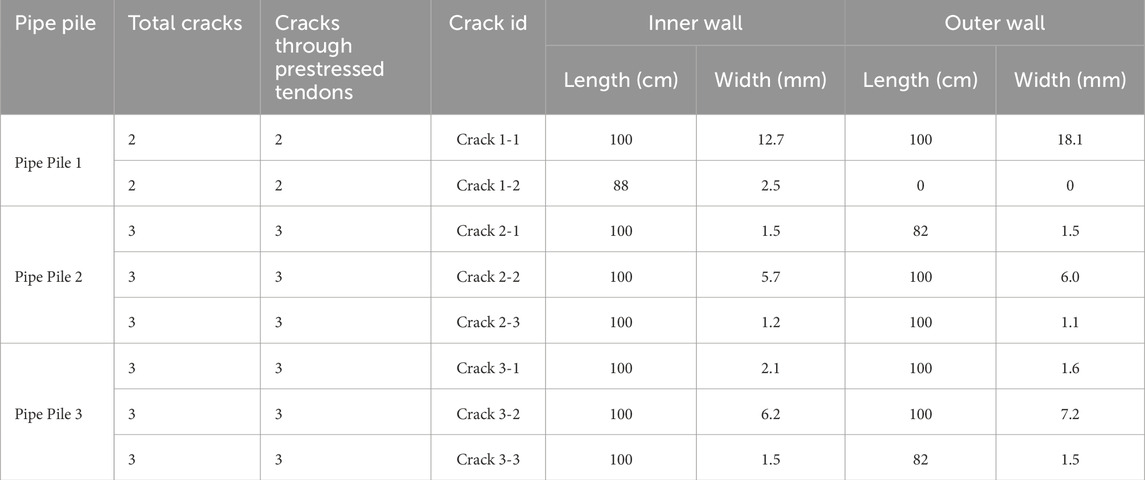
Table 2. Statistical characteristics of cracks in pipe piles.
Figure 6 shows the strain–time step curves of the inner and outer wall surfaces of a typical crack on each specimen. The dynamic propagation path of the cracks was captured by analyzing the monitoring data of the strain gauges throughout the entire experiment process.
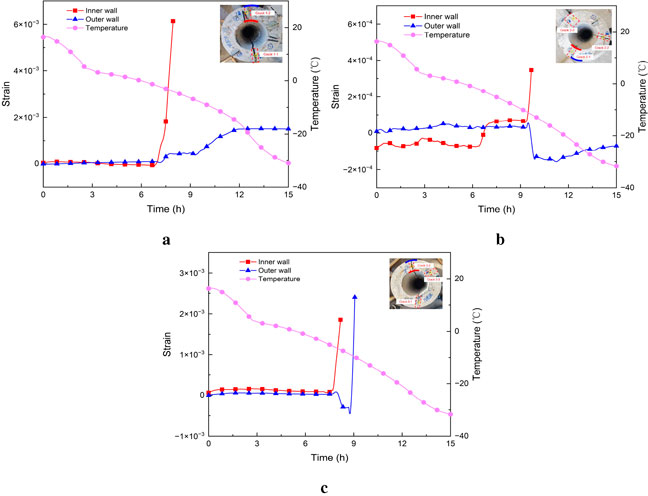
Figure 6. Strain curves of the inner and outer walls of the pipe pile. (a) Crack 1-2. (b) Crack 2-1. (c) Crack 3-2.
First, the inner wall fails before the outer wall. In all through-cracks, the failure time points of the inner wall strain gauges (red) are earlier than those of the outer wall strain gauges (blue). For example, in Crack 3-2 (Figure 6c), the inner wall strain gauge experienced data interruption due to failure at approximately 8.1 h, while the failure of the outer wall strain gauge occurred approximately 50 min later. This significant time difference reveals the dynamic process of cracks propagating from the inner wall to the outer wall.
Crack 1-2 (Figure 6a) is a non-penetrating crack. Its inner wall strain gauge failed at 7.9 h, while the outer wall strain gauge never failed, which is consistent with the macroscopic observation results in Table 2 that both the length and width of this crack on the outer wall of the pipe pile are zero. Crack 1-2 is a developing crack that has initiated but not yet propagated to the outer wall, further verifying the sequence of crack development from the inner wall to the outer wall.
In terms of the cracking speed, the failure process of all strain curves in Figure 6 is characterized by the data changing from a stable state to a sudden vertical rise and finally interruption. Take Crack 2-1 (Figure 6b) as an example: its inner wall strain suddenly reached the measurement limit and failed at 9.6 h. The duration from crack initiation (when the strain starts to increase sharply) to complete failure (data interruption) is extremely short. This phenomenon indicates that once the frost heaving pressure exceeds the tensile strength of concrete, the cracks will rapidly expand in an unstable manner, which confirms that PHC pipe piles exhibit typical brittle failure characteristics under this load condition.
To further explore the temporal and spatial development patterns of cracks, we selected the strain data from the upper, middle, and lower cross-sections of Pipe Pile 1 for comparative analysis (as shown in Figure 7). This analysis revealed several important temporal and spatial characteristics during the crack propagation process.
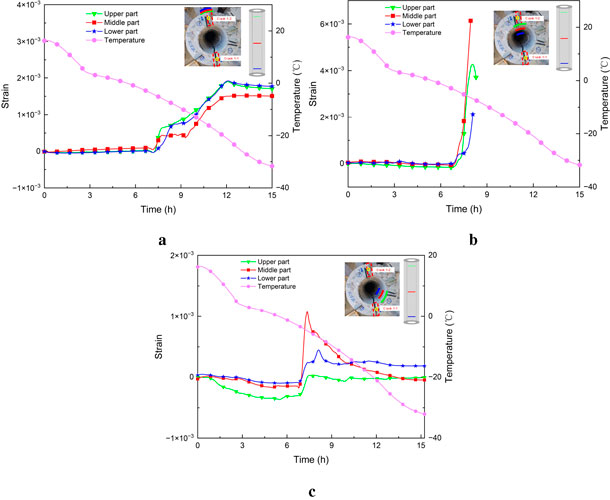
Figure 7. Strain curves of Pipe Pile 1. (a) Outer wall of Crack 1-2. (b) Inner wall of Crack 1-2. (c) Inner wall adjacent to Crack 1-1.
Experimental data show that once cracks start to initiate, they quickly penetrate along the axial direction (vertical direction) of the pipe pile. As can be seen in Figure 7b, the inner wall strain gauges arranged at the upper, middle, and lower positions of the pipe pile all experienced overload failure at approximately 8.0 h, with the time difference between their failures not exceeding 15 min. This almost synchronous failure phenomenon indicates that the radial frost heaving pressure in the water-accumulating section inside the pipe pile is relatively uniformly distributed in the axial direction. Once the tensile strength limit of concrete is reached, cracks will rapidly expand along the axial direction, rather than slowly expanding from top to bottom or from bottom to top.
The initiation of cracks is a result of local stress concentration, and at the same time, their formation also changes the distribution of the stress field around them. Analyzing the strain data of the uncracked areas near Crack 1-1 in Figure 7c, it can be observed that at approximately 6.8 h (Close to the initiation of Crack 1-1), the strain readings at these positions showed a brief and intense fluctuation, followed by a gradual decrease in strain values. This indicates that upon the initiation of Crack 1-1, the accumulated circumferential tensile stress was released, leading to a subsequent decrease in the stress level in the adjacent areas. The stress release phenomenon indirectly confirms that the initiation of cracks causes stress redistribution within the structure.
Comparison of the strain curves with the temperature curves shows that in all working conditions (as shown in Figure 7), cracking occurs when the internal temperature is between −5 °C and −8 °C. This indicates that after −5 °C, the ice generates frost heaving pressure sufficient to crack the concrete, and the accumulation of this pressure has a significant temperature dependence.
3 Analysis of the cracking process based on finite-element simulation
3.1 Overview of the finite-element model
To further analyze the cracking mechanism of pipe piles, Abaqus finite element software was used to establish a PHC pipe pile model. Considering the symmetry of the PHC pipe pile structure and loads, a quarter model with one longitudinal prestressed tendon was used for analysis, which improves computational efficiency without losing accuracy. Symmetric boundary constraints were applied to both sides of the model. The C3D8R hexahedral reduced integration solid element was used for concrete and prestressed tendons, and the frost heave force generated by water-ice phase change was simulated by applying pressure loads. As shown in Figure 8, the model is composed of concrete, prestressed tendons, and stirrups, using the millimeter unit system.
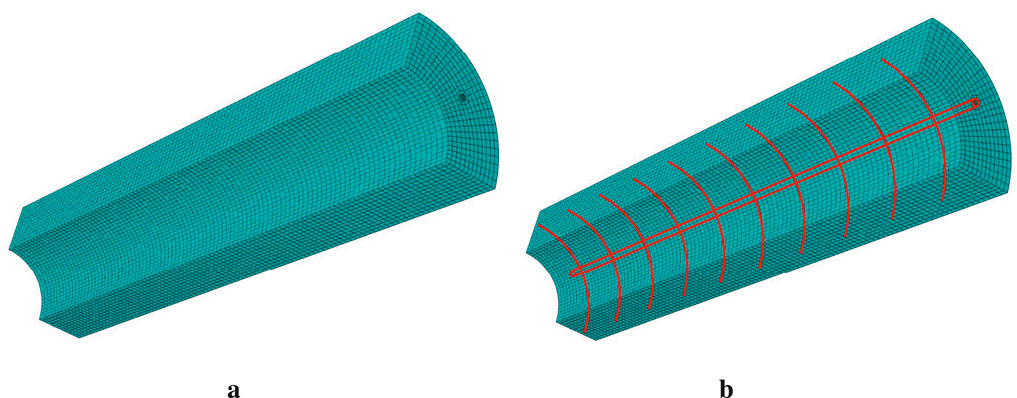
Figure 8. Finite-element model of PHC pipe pile. (a) Concrete model. (b) Reinforced concrete model.
C80 grade concrete is adopted, and its physico-mechanical parameters are taken in accordance with the relevant provisions of Section 4.1 in the Code for Design of Concrete Structures GB 50010–2010 (Author Anonymous, 2011). The density is 2400 kg/
The concrete damage plasticity (CDP) model, which is a plasticity-based continuous damage model, is employed as the concrete constitutive model. It comprehensively considers the stiffness degradation and irreversible deformation of materials and can relatively fully describe the nonlinear characteristics of concrete. It applies to the nonlinear tensile and compressive behaviors of concrete; therefore, this model is adopted for the pipe pile concrete in this study. The stress–strain relationship of concrete under uniaxial loading assumed by the CDP model is shown in Figure 9. Through this curve, the behavior of concrete under compression and tension is divided into elastic behavior and plastic behavior. The elastic behavior is mainly defined by the elastic parameters
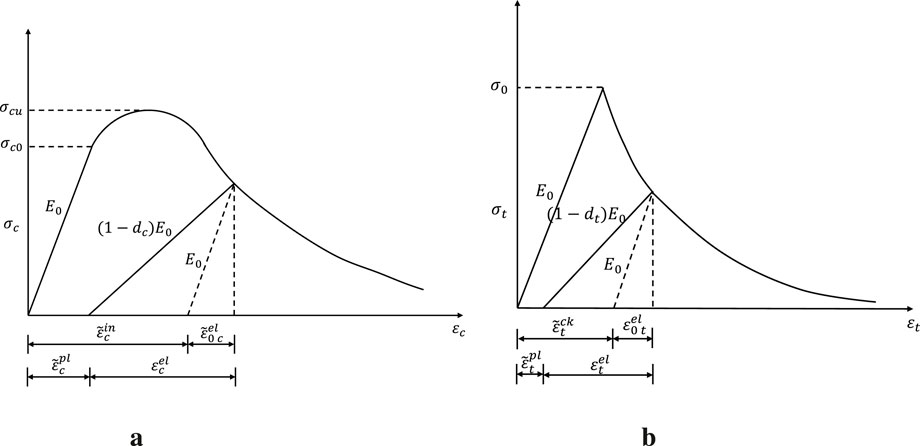
Figure 9. Stress–strain relationship of concrete under uniaxial load (Gu, 2025). (a) Compression curve. (b) Tensile curve.
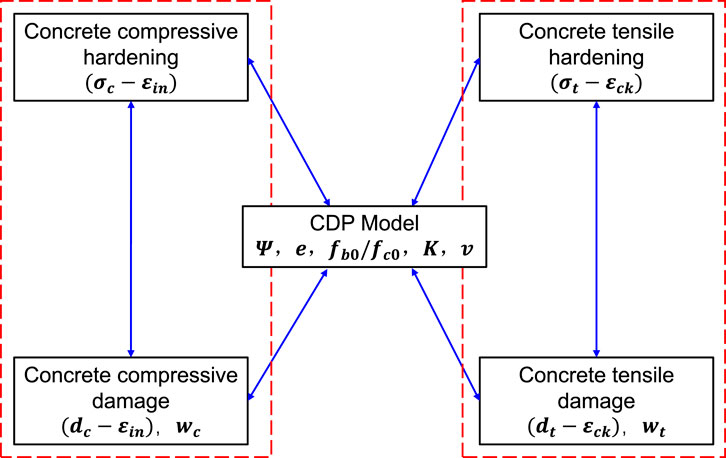
Figure 10. Plastic behavior parameters of the CDP model (Zhang, 2020).
In Figure 9,
In Figure 10,
In the formula,
When using the Abaqus CDP model for calculation, it is necessary to input the tensile and compressive stress–inelastic strain curves of the material, as well as the damage factor–inelastic strain curves of the material under tension and compression, respectively. The calculation method of CDP model parameters in Abaqus, given by Zhang (2020), is combined with the concrete constitutive relationship given in the GB50010–2010 code (Author Anonymous, 2011). The CDP model parameters of C80 concrete for pipe piles, along with the parameters of characteristic points of the concrete stress–strain curve and both the compression and tension characteristic curves of concrete, are shown in Tables 3, 4, and Figure 11, respectively.

Table 3. Concrete plastic parameters.
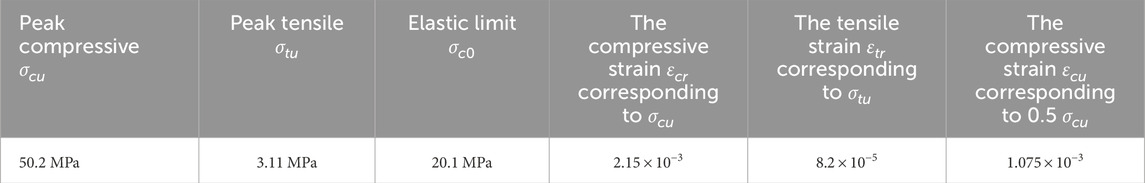
Table 4. Parameters of concrete stress and strain.
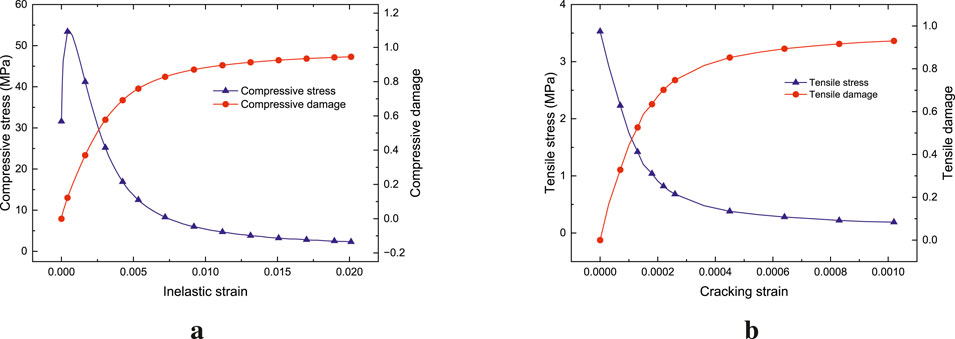
Figure 11. Material parameter definition of the CDP model. (a) Compression hardening and damage parameters. (b) Tensile strengthening and damage parameters.
When modeling the prestressed tendons of PHC pipe piles in Abaqus, the uniaxial loading stress–strain constitutive relationship curve with a yield point in GB50010–2010 is adopted for the steel bar constitutive, that is, the three-segment line model curve. See Figure 12a for details. The constitutive model parameters of HPB300 steel bars are shown in Table 5. When modeling the cold-drawn low-carbon steel wire stirrups of PHC pipe piles, a bilinear elastoplastic model is used to describe their mechanical behavior. The stress–strain curve is shown in Figure 12b. This model simplifies the stress–strain relationship of the stirrups into two stages: elastic and plastic, taking into account both computational efficiency and engineering applicability. The ultimate strain of the stirrups is based on the engineering experience value of the cold-drawn steel wire. The constitutive model parameters of stirrups are shown in Table 6.
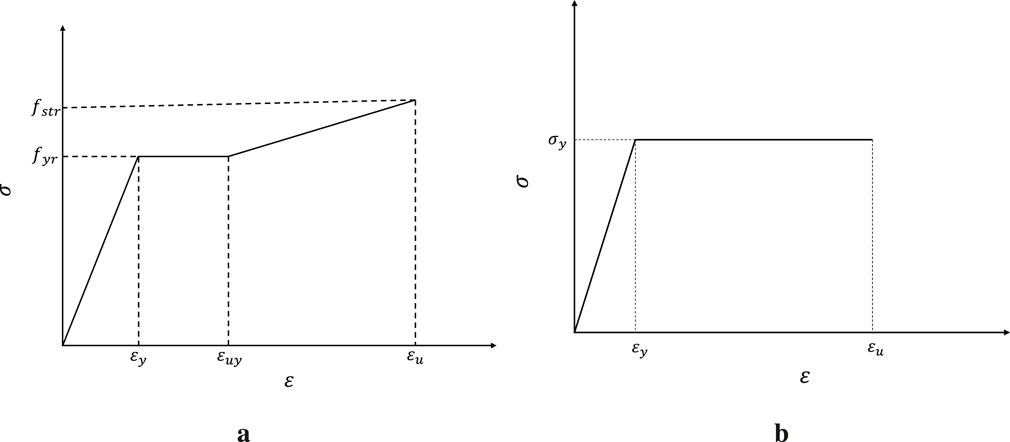
Figure 12. Stress–strain curves of prestressed tendons and stirrups. (a) Prestressed tendons. (b) Stirrups.
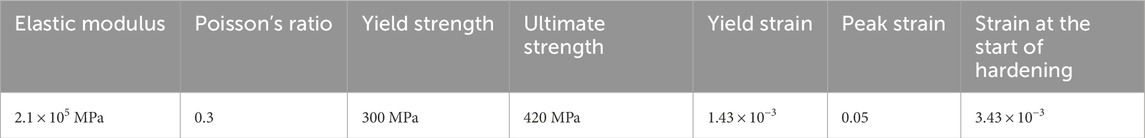
Table 5. Constitutive model parameters of HPB300 steel bars (Author Anonymous, 2011).

Table 6. Constitutive model parameters of stirrups (Author Anonymous, 2010).
The constraint conditions of the numerical model are defined as follows: A symmetric boundary condition is imposed on the symmetry plane of the concrete structure to replicate its stress state under symmetric loading scenarios, as illustrated in Figure 13a. To simulate the frost heave force induced by the water–ice phase transition within the pipe pile, a pressure load is applied to the inner wall of the pile, as depicted in Figure 13b. A tie constraint is established between the prestressed tendons and concrete to prevent relative slippage during the loading process, ensuring their collaborative load-bearing behavior. This setup aligns with the practical mechanical characteristics where prestressed tendons and concrete work in tandem through interfacial bonding, as shown in Figure 13c. An embedded region constraint is introduced between the stirrups and concrete to model the circumferential confining effect of the stirrups on the concrete. Specifically, the stirrups, treated as embedded components, restrict the lateral deformation of the surrounding concrete, as presented in Figure 13d. The displacement and rotation at the intersection of prestressing tendons and stirrups are made completely consistent by setting merged shared nodes (Merge Nodes), thereby achieving the effect of binding the two together.
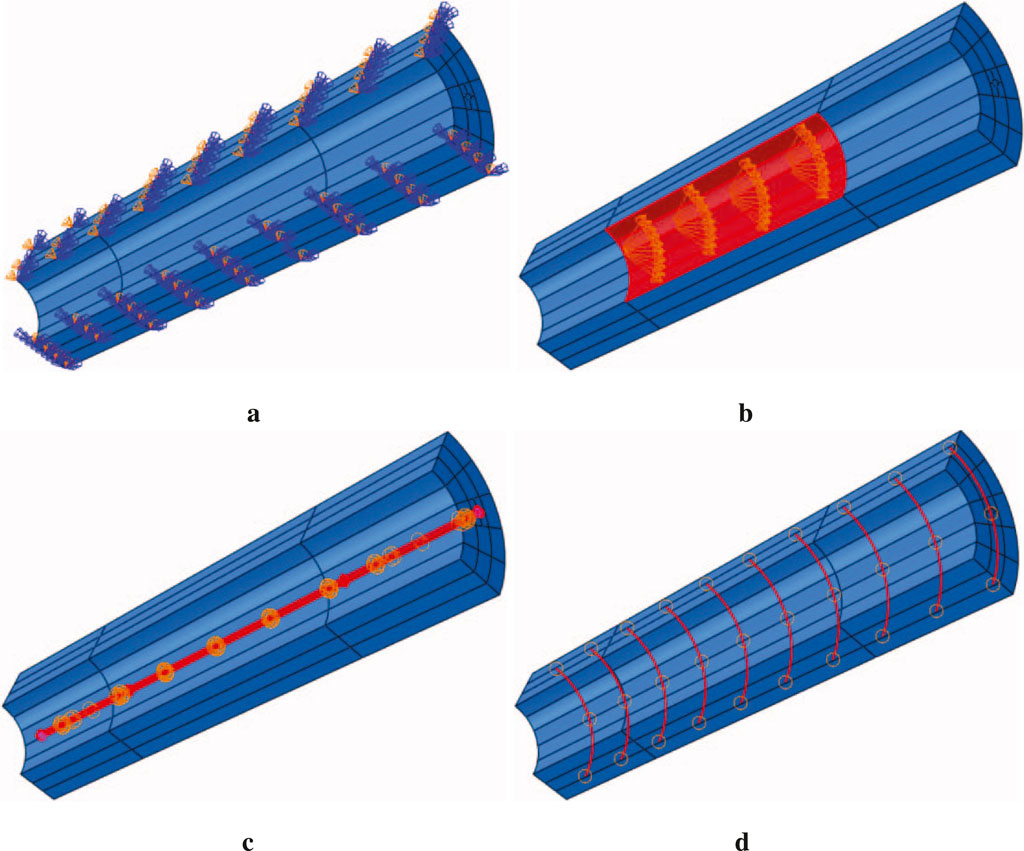
Figure 13. Boundary conditions and load settings. (a) Boundary condition settings. (b) Load application. (c) Prestressed tendon contact settings. (d) Stirrups contact settings.
In accordance with the specifications outlined in Prestressed Concrete Pipe Piles (10G409), the calculated effective pre-compressive stress of concrete for PHC300-AB-70 pipe piles is 6.37 MPa (Author Anonymous, 2010), which is applied at both ends of the pile. The loading process for the application of pressure loads is divided into three analytical steps, with linear application implemented sequentially to ensure the accuracy and convergence of simulation results. In the first step, a prestress of 6.25 MPa is applied to both ends of the pipe pile. In the second step, a load of 1.5 MPa is applied to simulate the initial accumulation stage of frost heave force. In the third step, building upon the second step, the load is further increased to 2.0 MPa, aiming to simulate the working condition where frost heave force continues to increase with the progression of the freezing process.
3.2 Structural response and damage development analysis
To further reveal the mechanical mechanism behind the failure phenomena observed in the experiment, a detailed analysis was conducted on the structural response and damage development process of the pipe pile under internal frost heaving pressure using the finite element model. The simulation results clearly show the entire process of cracks from initiation to propagation to penetration.
3.2.1 The initial position of the crack
As shown in Figure 14, the stress evolution at two different positions on the inner wall of the pipe pile was compared: monitoring point A (located near the prestressed tendons) and monitoring point B (far from the prestressed tendons). In the early stage of loading, the stress at point A was always slightly higher than that at point B. At a time step of approximately 1.965, the concrete at point A (red curve) first reached its ultimate tensile strength, and the stress dropped sharply, marking the initiation of cracking at this point, while the stress at point B did not reach the limit at this time. This phenomenon is consistent with the observation in the experiment that all cracks originated along the prestressed tendons.
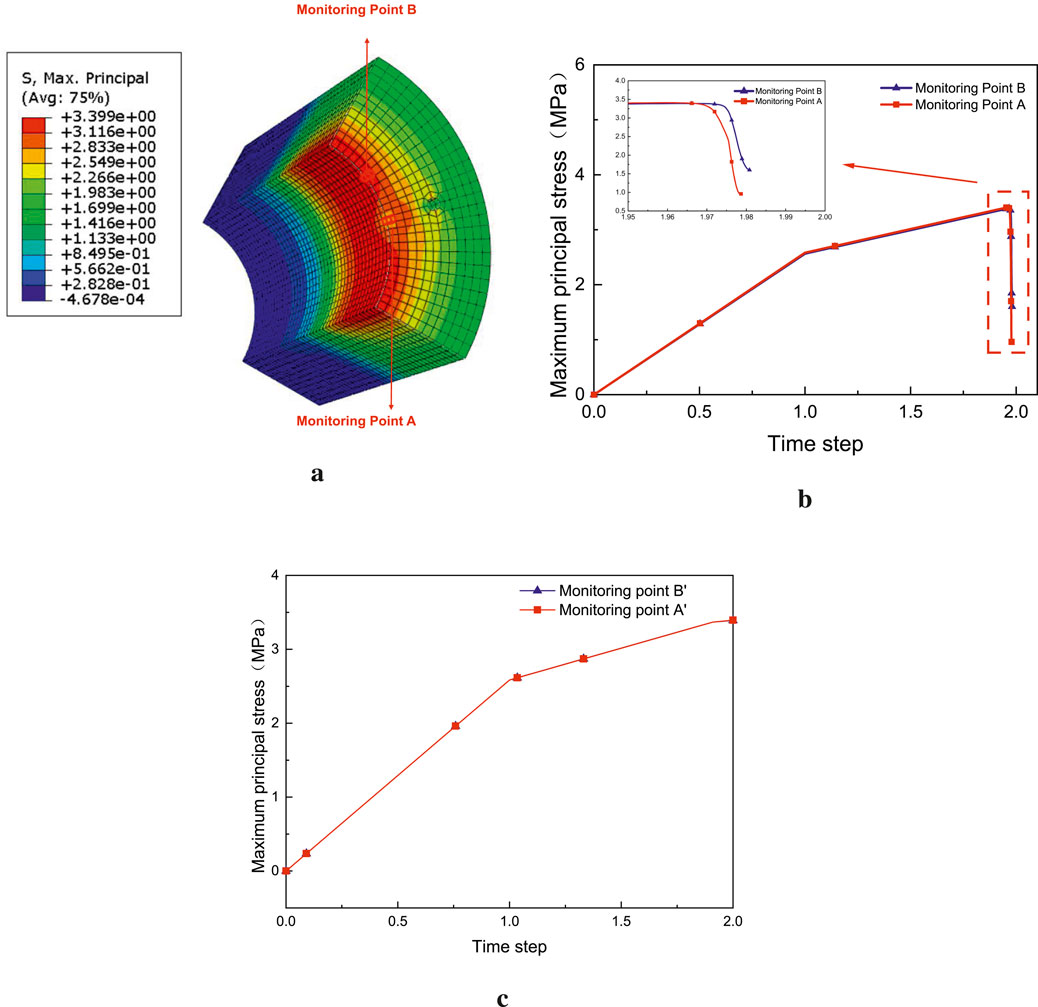
Figure 14. Stress comparison of concrete elements at two different positions on the pipe pile’s inner wall. (a) Locations of monitoring point A (at the tendon projection) and monitoring point B (far from the tendon). (b) Corresponding principal stress–time step curves for the two points. (c) The stress–time step curves of monitoring points A' and B'.
The only difference between points A and B in the model is whether there are prestressed tendons in their radial paths. A new comparative model was established to further explore the mechanism by which prestressed tendons affect cracking. In this model, the material parameters of the prestressed tendons were modified to be completely consistent with those of the surrounding C80 concrete, and the CDP model was also adopted. All other conditions, including meshing, loads, boundaries, etc., remained unchanged.
Extracted were the curves of stress versus time steps for Points A′ and B′ of elements at the same positions, as shown in Figure 14c. It can be observed that in this comparative model, the stress curves of Points A′ and B′ almost completely overlap, and the stress concentration phenomenon disappears.
From the perspective of material mechanics, when steel bars and concrete deform synergistically, the internal stress ratio between the two is approximately equal to the ratio of their elastic moduli (
Therefore, due to the significant difference in elastic modulus between the prestressed tendons and concrete, there is a stiffness mismatch between the two, which leads to significant stress concentration in the concrete near the prestressed tendons when the structure is subjected to forces, making this location the first to fail in the entire structure.
3.2.2 Crack propagation path
After identifying the initiation point of the crack, its propagation path was further analyzed. The damage contour maps and damage evolution curves of key points in Figures 15, 16 fully demonstrate this process. As shown in Figure 15, from a qualitative perspective, damage first appears near the prestressed tendons on the inner wall (load ratio: 85.376%). Subsequently, the damaged area expands radially toward the outer wall, passing through the prestressed tendons, and finally reaches the outer wall (load ratio: 85.481%). From a quantitative perspective, as shown in Figure 16, the damage evolution curves of four characteristic points selected along the radial direction (a - inner wall, b - inner side of the prestressed tendon, c - outer side of the prestressed tendon, d - outer wall) more clearly reveal the failure sequence. The damage factor first increases slowly at point a, and then suddenly deteriorates sharply when spreading to point b (near the prestressed tendon), with the damage value jumping from 0 to nearly 0.9, indicating a sudden change in structural performance at this point. Subsequently, the damage spreads to points c and d.
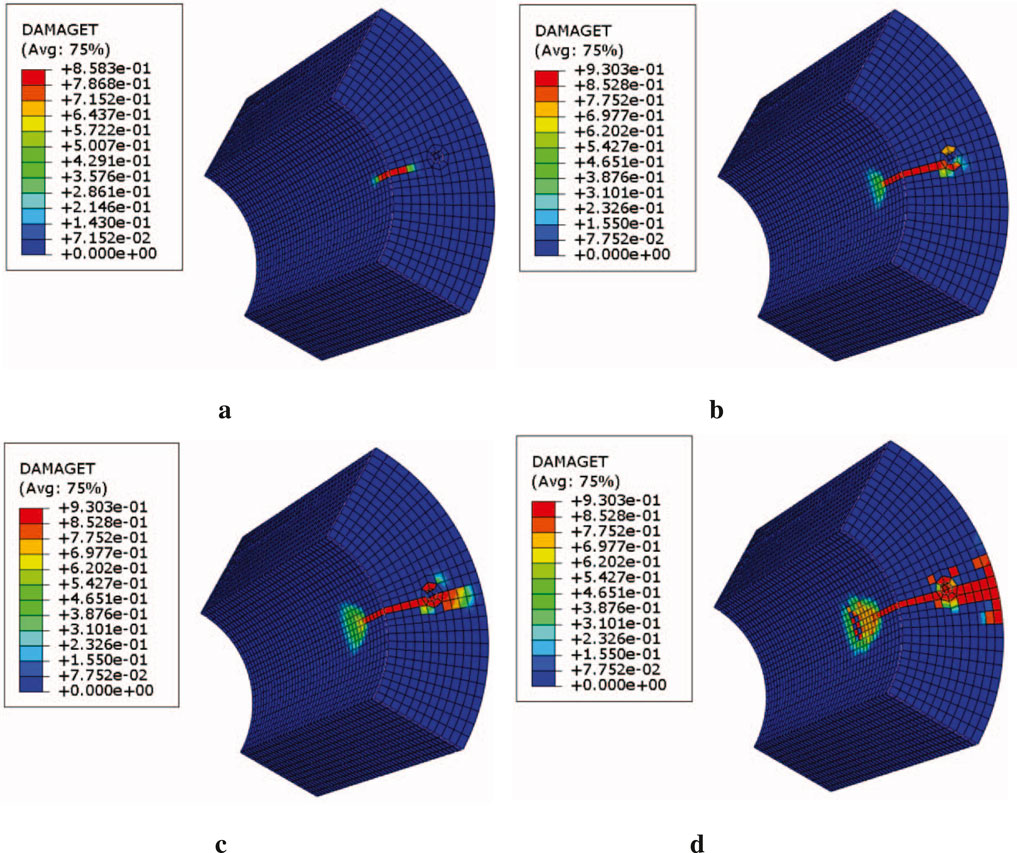
Figure 15. Progression of tensile damage (DAMAGET) in the pipe pile with increasing load ratio. (a) Load ratio 85.376%. (b) Load ratio 85.416%. (c) Load ratio 85.443%. (d) Load ratio 85.481%.
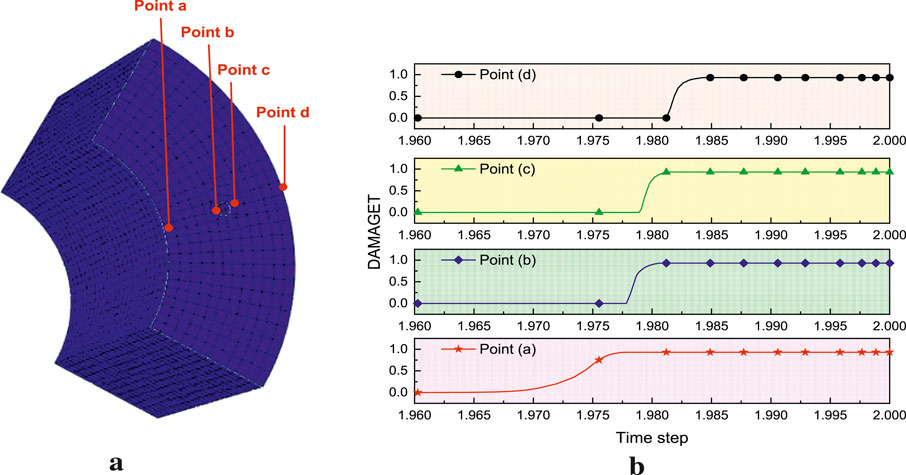
Figure 16. Damage evolution analysis along a radial path of the pipe pile. (a) Locations of characteristic points a, b, c, and d. (b) Damage factor vs. load ratio curves for each characteristic point.
The propagation of cracks from the inner wall to the outer wall is essentially a process of load transfer and redistribution. When the inner layer of concrete cracks, the circumferential tensile force it bears must be borne by the outer layer of undamaged concrete, resulting in the continuous increase in stress of the outer concrete, which eventually reaches the tensile strength limit and cracks. The entire process clearly verifies the phenomenon observed in the experiment, that the strain gauges on the inner and outer walls fail successively. The radial development of cracks in the pipe pile exhibits a state of starting from the inner wall, sudden deterioration at the prestressed tendons, and finally propagating to the outer wall.
3.2.3 The influence of stirrups on cracking
The stress condition of the stirrups is shown in Figure 17. Monitoring point E is where the maximum stress is located, and the stress evolution of the stirrups can be divided into two stages. When the concrete is not cracked, the stress of the stirrups increases very slowly (with a maximum of only 11.7 MPa). At this time, most of the load is borne by the concrete, and the stirrups only play a synergistic restraining role. When the concrete around the stirrups cracks, the load originally borne by the concrete is instantly transferred to the stirrups, causing their stress to surge sharply to a peak of 548.3 MPa in a very short time; the stirrups have yielded and are close to the ultimate strength. This indicates that after the concrete cracks, the stirrups become the main load-bearing component of the structure, maintaining the structural integrity through their own tensile capacity, restricting the expansion of cracks, and preventing further damage to the structure. From the perspective of the spatial distribution of stress, in the axial direction of the pipe pile, the stress of the stirrups in the load-affected area shows the characteristic of being higher in the middle and lower on both sides, which is completely consistent with the stress distribution law under load action.
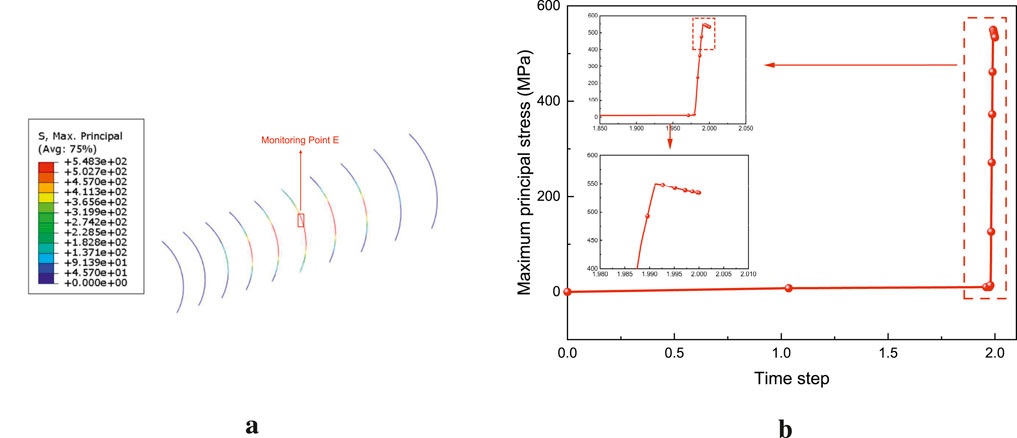
Figure 17. Stress state analysis of the stirrups. (a) Stress distribution showing the location of the maximum stress point (monitoring point E). (b) The corresponding stress–time step curve for monitoring point E.
4 Parametric analysis
A parametric analysis was conducted using the finite element model to systematically evaluate the influence of key design parameters on the frost heave cracking resistance of PHC pipe piles and to explore potential enhancement measures. The analysis primarily focuses on three key design parameters, concrete strength, axial prestress level, and wall thickness, and additionally discusses the effectiveness of radial confinement as an additional measure.
4.1 Influence of key design parameters on cracking resistance
4.1.1 Concrete strength
Concrete strength is fundamental to the load-bearing capacity of the pipe pile. As shown in Figure 18a, using a higher grade of concrete (from C70 to C90) significantly improves the pile’s resistance to frost heave pressure. Specifically, for any given level of damage, the corresponding load is consistently higher for higher-strength concrete. This demonstrates that increasing the concrete’s inherent tensile strength is a direct and effective means of resisting frost heave damage. As shown in Figure 18b, a higher concrete strength also correspondingly postpones the critical load point at which the concrete at the mid-wall thickness (i.e., the location of the longitudinal prestressing tendons) undergoes abrupt failure.
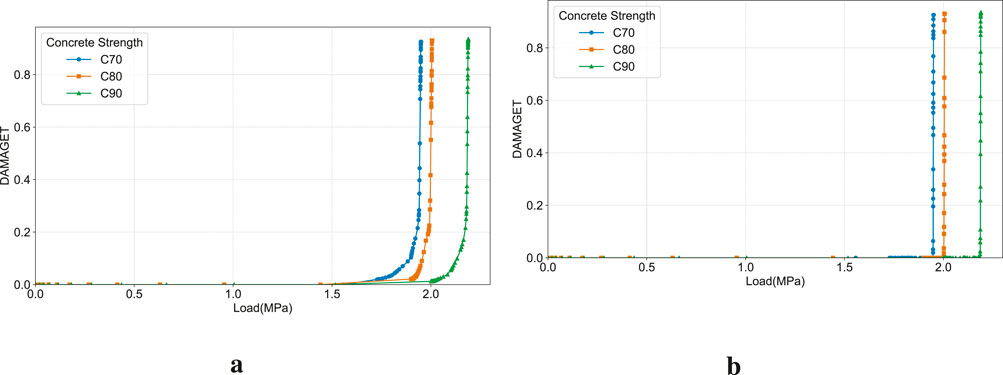
Figure 18. Concrete damage evolution for different concrete strengths. (a) Damage evolution at the inner wall for different concrete strengths. (b) Concrete damage evolution at the reinforcement location for different concrete strengths.
4.1.2 Axial prestress level
Axial prestress plays a critical role in the cracking resistance of the pipe pile at different stages of crack development, which is reflected in the following three aspects:
1. Suppression of Damage Development. As shown in Figure 19a, higher axial prestress more effectively suppresses the acceleration of damage. Specifically, once the damage develops to a certain level (e.g., DAMAGET
2. Effect on the Mid-Wall Failure Mode. As shown in Figure 19b, the concrete damage at the mid-wall thickness (i.e., the location of the longitudinal prestressing tendons) exhibits typical sudden brittle failure characteristics. The damage remains minimal before a critical load is reached, after which the damage value jumps instantaneously. Higher prestress levels significantly raise this critical load point, thereby effectively delaying the process of the crack penetrating the wall thickness.
3. Quantitative Analysis of Crack Propagation. The inhibitory effect of prestress can be further quantified by the “load difference” (the load increment required for damage to propagate from the inner wall to the mid-wall). As shown in Figure 19b, at any stage of damage, the load difference for the 8.04 MPa prestress is the largest, indicating that higher prestress more effectively impedes crack propagation. Concurrently, as damage accumulates (with the damage threshold increasing from 0.2 to 0.8), the load difference decreases, which illustrates that crack propagation exhibits an accelerating effect.
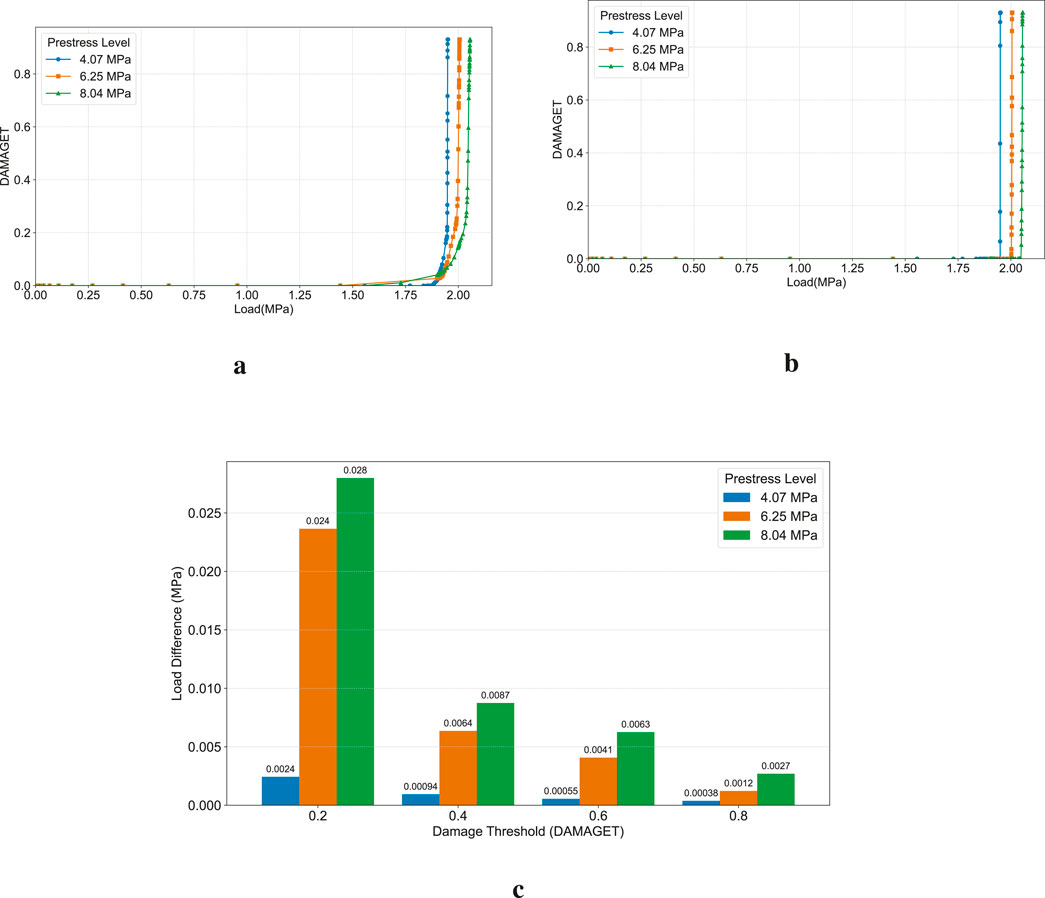
Figure 19. Concrete damage evolution for different axial prestress levels. (a) Damage evolution at the inner wall for different axial prestress levels. (b) Concrete damage evolution at the reinforcement location for different axial prestress levels. (c) Load difference for damage propagation from the inner to the middle wall.
4.1.3 Wall thickness
As shown in Figure 20, piles with thicker walls (from 70 mm to 90 mm) demonstrate significantly enhanced resistance to frost heave damage. For any given level of damage, a thicker-walled pile consistently requires a higher load to reach that damage state. This is because increasing the wall thickness provides greater structural stiffness and a larger cross-sectional area to withstand the internal frost heave pressure, thereby directly increasing the pipe pile’s capacity to resist cracking.
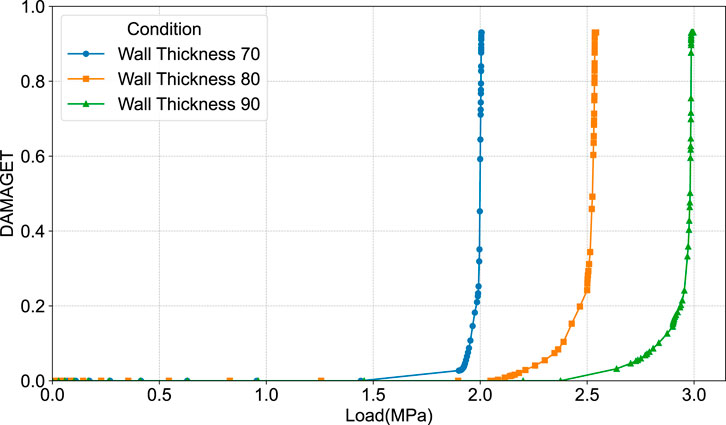
Figure 20. Damage evolution under different wall thickness.
4.2 Effect of additional measures on cracking resistance
In addition to optimizing the pile’s own design parameters, adopting external reinforcement measures is a feasible strategy. This section explores the effectiveness of enhancing cracking resistance by applying radial prestress (e.g., achieved by methods such as wrapping with carbon fiber reinforced polymer (CFRP) fabric).
As shown in Figure 21, applying radial confinement has a remarkably significant effect on suppressing damage initiation. Increasing the radial prestress from 0.05 MPa to 0.15 MPa and 0.25 MPa raises the pile’s damage initiation load from approximately 1.9 MPa to 2.25 MPa and 2.5 MPa, respectively, showing a significant gain in cracking resistance. It is also noted that higher radial prestress leads to a more abrupt failure process once damage initiates. This demonstrates that directly counteracting the hoop tension in the pipe wall through external confinement is a highly efficient protective measure against cracking caused by internal pressure.
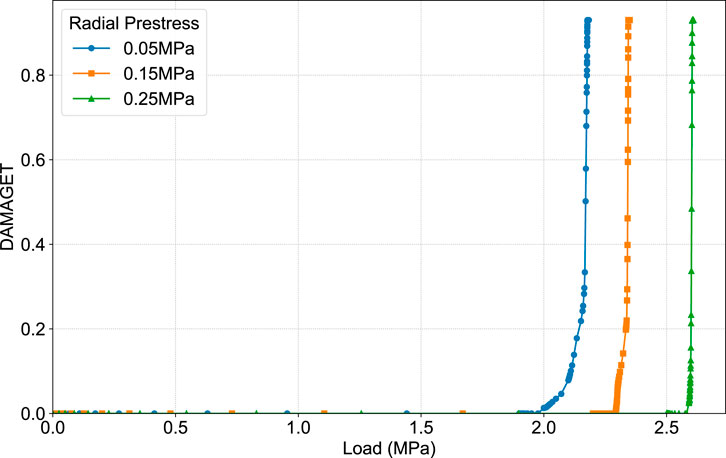
Figure 21. Damage evolution under different radial prestress levels (additional measures).
5 Conclusion
This article has studied the cracking mechanism of PHC pipe piles under the action of frost heaving force generated by the freezing of internal water by combining experimental and numerical simulation methods. The main conclusions are as follows:
1 .The triggering conditions and fundamental characteristics of the failure were identified. The frost-heave-induced cracking of PHC pipe piles is a brittle failure mode with a distinct temperature threshold. In the experiments conducted in this article, when the internal temperature drops to a critical range of −5 °C to −8 °C, the frost heave pressure is sufficient to trigger rapid, unstable failure of the structure. It should be noted that the temperature range obtained in this study is only a conclusion based on the current experimental scenario. The specific temperature threshold is closely related to the actual environmental conditions in which the pipe piles are located.
2 .The root cause of cracking and the conflicting roles of the reinforcement were revealed. The root cause of cracking is a mechanical incompatibility within the reinforced concrete system. The significant stiffness mismatch between the longitudinal prestressed tendons and the concrete leads to stress concentration, making these locations the inevitable initiation points for cracks. This reveals a dual role for the reinforcement: longitudinal tendons act to initiate failure, while the circumferential stirrups become critical only after cracking, providing confinement to restrain further damage and maintain structural integrity.
3 .The dynamic propagation path of the crack was clarified. The crack propagation follows a distinct spatiotemporal path. Axially, the crack extends almost synchronously along the pile’s length. Radially, guided by the prestressed tendons, the crack propagates progressively from the inner wall toward the outer wall.
4 .Effective recommendations for design optimization and protection were proposed. Based on the parametric analysis, increasing the concrete strength grade, the axial prestress level, and the wall thickness are effective strategies for retarding crack initiation and propagation. Furthermore, applying external radial confinement (e.g., CFRP) is shown to be a highly effective protective measure, offering practical guidance for engineering applications.
Data availability statement
The original contributions presented in the study are included in the article/supplementary material; further inquiries can be directed to the corresponding author.
Author contributions
FZ: Project administration, Writing – original draft. JW: Resources, Writing – review and editing. XY: Data curation, Writing – review and editing. MJ: Investigation, Methodology, Software, Validation, Writing – original draft. GL: Supervision, Writing – review and editing. JX: Conceptualization, Funding acquisition, Project administration, Supervision, Writing – review and editing.
Funding
The author(s) declare that financial support was received for the research and/or publication of this article. This research was funded by the Project of Research on the Mechanism and Prevention Measures of Cracks in Photovoltaic PHC Pile Foundations in Cold Regions (2024GKF-0847) and 111 Project (B20039).
Conflict of interest
Authors FZ, JW, and XY were employed by Shandong Electric Power Engineering Consulting Institute Corp., Ltd.
The remaining authors declare that the research was conducted in the absence of any commercial or financial relationships that could be construed as a potential conflict of interest.
The author(s) declared that they were an editorial board member of Frontiers, at the time of submission. This had no impact on the peer review process and the final decision.
Generative AI statement
The author(s) declare that no Generative AI was used in the creation of this manuscript.
Any alternative text (alt text) provided alongside figures in this article has been generated by Frontiers with the support of artificial intelligence and reasonable efforts have been made to ensure accuracy, including review by the authors wherever possible. If you identify any issues, please contact us.
Publisher’s note
All claims expressed in this article are solely those of the authors and do not necessarily represent those of their affiliated organizations, or those of the publisher, the editors and the reviewers. Any product that may be evaluated in this article, or claim that may be made by its manufacturer, is not guaranteed or endorsed by the publisher.
References
Chen, Z., Shi, Y., and Zhang, Y. (2024). Study on dynamic characteristics of bending damaged Rc/pc bridges based on concrete damage plasticity models. J. Hunan Univ. Sci. 51, 50–61. doi:10.16339/j.cnki.hdxbzkb.2024067
ChoiYongkyu and KimMyunghak (2018). Axial bearing characteristics of tip-transformed phc piles through field tests. J. Korean Geotechnical Soc. 34, 107–119.
Feng, Q.-r., Xing, H.-f., Chen, H.-B., and Wei, H. (2025). Suitability and bearing behavior of phc pipe piles in underlying mudstone. Geotechnical Geol. Eng. 43, 146. doi:10.1007/s10706-025-03116-z
Gu, X. (2025). Numerical simulation of bending performance test of prefabricated lining pipe segments based on cdp model. Shanxi Archit. 51, 56–60. doi:10.13719/j.cnki.1009-6825.2025.05.011
Hu, D., and Huang, S. (2011). Cause analysis and countermeasures for the longitudinal cracks in phc piles during pile driving. Port and Waterw. Eng., 141–146doi. doi:10.16233/j.cnki.issn1002-4972.2011.05.025
Islam, M., Turja, S., Nguyen, D., and Kim, D. (2024). Lateral response and failure mechanism of single and group piles in cement-improved soil. Results Eng. 23, 102668. doi:10.1016/j.rineng.2024.102668
Jun, Z., Junsheng, O., Wannian, T., Huanlin, Z., and Tongxi, W. (2024). Numerical analysis of creep effects on the settlement of phc pipe pile in soft clay treated by deep mixing method. Geotechnical Geol. Eng. 42, 5967–5977. doi:10.1007/s10706-024-02872-8
Kong, X., Qian, Y., Jia, Y., Cao, T., Yu, D., Wu, L., et al. (2021). Cracking mechanism of phc pipe piles of water surface photovoltaic support in cold area. Build. Struct. 51, 2081–2086.
Krajcinovic, D., and Fonseka, G. U. (1981). The continuous damage theory of brittle materials, part 1: general theory. J. Appl. Mech. 48, 809–815. doi:10.1115/1.3157739
Li, C., and Li, X. (2023). Evaluation of bearing capacity of phc pipe piles via the dynamic and static loading test. Front. Earth Sci. 11, 1130294. doi:10.3389/feart.2023.1130294
Li, Y., Jiang, K., and Ge, C. (2024). Discussion on the development of china’s regional carbon market under the background of double carbon. Front. Humanit. Soc. Sci. 4, 140–150. doi:10.54691/x81tve29
Liu, Z., Li, Y., Kong, Q. Y., Zhan, C., Wang, Q., Chen, X. Y., et al. (2008). Immunohistochemical profiling of wnt, NF-kappaB, Stat3 and notch signaling in human epidermal tumors. Port and Waterw. Eng. 52, 133–136doi. doi:10.1016/j.jdermsci.2008.06.011
Oktiovan, Y., Otaki, T., Obara, T., Kono, S., Asai, Y., Kobayashi, K., et al. (2021). Analysis on shear failure of phc piles under different levels of axial load ratios
Tan, Y., Wang, D., Wang, Y., Jin, X., and Zhao, C. (2022). Analysis and treatment for cracks in phc pile of photovoltaic modules support. Eng. J. Wuhan Univ. 55, 142–146.
Wang, Y., Li, S., Ye, M., Yong, Y., Bai, Y., Deng, Y., et al. (2023). Review of meso-structural evolution and mechanical damage characteristic of concrete subjected to freeze-thaw cycles. Sci. Technol. Eng. 23, 5853–5874.
Wen, J., Liu, F., Yang, F., Chen, D., Liu, J., Xu, G., et al. (2024). Flexural behaviour of non-autoclaved pre-stressed high-strength concrete pipe piles with different rubber contents. Buildings 15, 12. doi:10.3390/buildings15010012
Xiao, Y., Liu, X., Zhou, J., and Song, L. (2023). Field test study on the bearing capacity of extra-long phc pipe piles under dynamic and static loads. Sustainability 15, 5161. doi:10.3390/su15065161
Yueming, J., Xiangyi, K., Qian, Y., Yu, D., Cao, T., Wu, L., et al. (2021). Effect of cracks on mechanical properties of phc pipe pile for water surface photovoltaic support in cold areas. China Offshore Platf. 36, 84–88+100.
Zhang, T. (2020). Evaluation and application of typical material models used in FE modelling under monotonic and cyclic loading conditions. Kunming: Kunming University of Science and Technology. Master’s thesis.
Zhang, B., and Xin, Q. (2019). Damage mechanism of prestressed concrete pipe pile induced by radial frost heave in cold regions. J. Liaoning Tech. Univ. Nat. Sci. 38, 409–415.
Keywords: PHC pipe pile, concrete cracking, frost heave, cold environment, finite-element simulation
Citation: Zhang F, Wu J, Yin X, Jia M, Lacidogna G and Xu J (2025) Mechanism of frost heave cracking in PHC pipe piles: an experimental and numerical investigation. Front. Mater. 12:1694140. doi: 10.3389/fmats.2025.1694140
Received: 28 August 2025; Accepted: 09 October 2025;
Published: 10 November 2025.
Edited by:
Mijia Yang, North Dakota State University, United StatesReviewed by:
Dongxue Hao, Northeast Electric Power University, ChinaWenjun Liu, Huaihua University, China
Copyright © 2025 Zhang, Wu, Yin, Jia, Lacidogna and Xu. This is an open-access article distributed under the terms of the Creative Commons Attribution License (CC BY). The use, distribution or reproduction in other forums is permitted, provided the original author(s) and the copyright owner(s) are credited and that the original publication in this journal is cited, in accordance with accepted academic practice. No use, distribution or reproduction is permitted which does not comply with these terms.
*Correspondence: Jie Xu, anh1QHRqdS5lZHUuY24=