 Yifei Wang1,2
 Zunqing Liu
- 1School of Traffic and Logistics Engineering, Xinjiang Agricultural University, Urumqi, China
- 2Xinjiang Agricultural University Road Engineering Research Center, Urumqi, China
- 3Xinjiang Huli Jiayuan Environmental Protection Technology Co., Ltd., Urumqi, China
- 4College of Hydraulic and Civil Engineering, Xinjiang Agricultural University, Urumqi, China
This study addresses the performance requirements of road base course materials under special climate conditions in Xinjiang by employing the volume mixing method to design cement-stabilized steel slag (SSA)-gravel mixture. Systematic analysis was performed for the effects of SSA dosage (0%–100%) on the mechanical properties, shrinkage characteristics, and durability of the mixture. The test results indicated that the mechanical properties of the mixture exhibited an increasing trend up to a certain point before decreasing with further increases in SSA dosage. Notably, the C-B-1 gradation demonstrated optimal mechanical properties at a 60% SSA dosage, achieving an unconfined compressive strength of 8.9 MPa at 7 days with a 3% cement dosage. The discrete element simulation in PFC3D showed that this gradation provided a more significant backbone embedded extrusion effect. Moreover, increasing the SSA dosage effectively reduced the dry shrinkage strain of the mixture, however, the excessive dosage (>60%) caused a considerable increase in temperature shrinkage strain. Regarding durability, the mixture with 60% SSA dosage exhibited the best frost resistance, achieving an unconfined compressive strength of 7.9 MPa and a BDR of 82.3% after 18 freeze-thaw cycles. Microstructural analysis indicated that Ca2+ and SO42- released by SSA not only promoted the formation of early-stage AFt but also aided in developing a dense C-S-H gel in the later stages, thereby synergistically enhancing the material strength and durability. These findings offer the theoretical basis and technical support for the optimized design of road base course materials in Xinjiang.
1 Introduction
Cement-stabilised semi-rigid base course is the predominant type of base course for high-grade highways in China (Chen and Wang, 2023), accounting for up to 85% of the total, and is crucial for the load bearing of the road. However, its tendency to dry and crack jeopardizes the long-term quality of roads (Li et al., 2017; Li Z. et al., 2022; Du, 2019; Qin et al., 2011; You et al., 2020), and such a condition is exacerbated due to adverse natural conditions in arid and cold regions, such as Xinjiang, so the conventional base course structure is unable to meet the high requirements of modern traffic. Additionally, the rising awareness of environmental protection and the closure of quarries have resulted in a scarcity of stone resources and increased prices, creating dual challenges for highway construction (Zhang et al., 2020). Therefore, it is essential to find a way to maintain mechanical properties and durability at the base course while addressing issues of dry shrinkage and cracking, adapting to Xinjiang’s unique climatic environment, and tackling the shortage of stone resources, which has become a critical challenge in highway construction in Xinjiang and across the country.
Steel slag, a high-volume industrial solid waste, has an annual output exceeding 100 million tonnes in China. However, its utilization remains significantly low, with a current rate of less than 30% (Wu et al., 2007; Ren and Li, 2024; Jianlong et al., 2018; Neto et al., 2017). Such underutilization results in substantial resource waste and occupation of valuable land resources, posing serious environmental challenges (Marina et al., 2021). On the other hand, the unique physicochemical properties of steel slag offer promising potential for applications in road construction (Li Q. et al., 2022; Xiang et al., 2016; Tang et al., 2020). Its physical characteristics are superior to those of conventional aggregates. Furthermore, steel slag contains cementitious components such as C2S and C3S, which impart hydraulic activity, making it a viable alternative material for cement-stabilized base courses (Li L. et al., 2022; Anastasiou et al., 2014).
Experimental studies have further validated its effectiveness in enhancing road base performance. Liu et al. (2020) and Zhang et al. (2023) demonstrated that the incorporation of steel slag effectively mitigates shrinkage and deformation of base course materials while enhancing the crack resistance of the mixture. Barisic et al. (2015) found that the elastic modulus and mechanical strength of steel slag mixtures increase with curing age, cement content, and steel slag addition, noting that active components in steel slag significantly promote early cement hydration. Through mechanical property testing, Feng et al. (2025) found that compared to water-stabilized materials, those incorporating steel slag exhibit over 50% higher compressive strength. Furthermore, water-stabilized materials made with oxalic acid-treated steel slag demonstrate superior compressive strength compared to untreated materials. In recent years, a large number of scholars have also focused on analyzing micro-level mechanisms. Yang et al. (2024) explored the use of steel slag powder as a component in cement-stabilized macadam, conducting comprehensive analyses of hydration characteristics, microstructural properties, strength development, water stability, and heavy metal leaching behavior. Chen and Wang (2023) performed an extensive characterization of steel slag sourced from Xinjiang, China, evaluating its chemical composition, phase assemblage, physical properties, and expansion behavior. The research established the viability of steel slag for use in pavement base courses through a systematic investigation into the correlation between macro-mechanical properties and microstructural development in cement-stabilized steel slag mixtures at varying curing ages. At the micromechanical level, Wang et al. (2022) employed PFC3D simulations to show that increasing the steel slag content alters the failure mode of the material, shifting from a single diagonal fracture to multiple damage sections, accompanied by a significant increase in microcrack density. Furthermore, Song et al. (2024) used PFC3D to demonstrate that cement-stabilized steel slag materials under freeze-thaw-fatigue coupling exhibit three-stage damage characteristics, with the shear zone dominating the failure process. Their findings also revealed that mechanical properties degrade nonlinearly with increasing stress and freeze-thaw cycles. However, most prior studies have failed to adequately account for region-specific adaptability—particularly in regions such as Xinjiang, where cement-stabilized gravel is commonly employed, but its combined use with steel slag has received limited attention. Moreover, under Xinjiang’s characteristically severe climate, critical aspects, including gradation design, material shrinkage, freeze-thaw resistance, and micromechanical behavior of steel slag mixtures, remain insufficiently studied.
Based on the aforementioned research content, in this study, a volume-based mix design method was adopted to formulate steel slag–gravel blends, and PFC-based discrete element simulations were conducted to reveal the micromechanical behavior of various gradations. The resistance to shrinkage cracking and the mechanisms of strength degradation under freeze-thaw cycles were systematically investigated through shrinkage tests and freeze-thaw tests. Furthermore, scanning electron microscopy (SEM) was utilized to characterize the evolution of hydration products and elucidate the microstructural damage mechanisms induced by freeze-thaw action. The findings aim to provide a theoretical foundation for the design of road base materials tailored to the specific climatic conditions of Xinjiang.
2 Materials and methods
2.1 Materials
The cement used in the test was P.O. 42.5 ordinary silicate cement produced by a company in Xinjiang, with the chemical composition and physical properties shown in Table 1. Steel Slag Aggregate (SSA) was derived from SSA produced by Baosteel Group Xinjiang Bayi Iron and Steel Co., Ltd., which is a converter steel slag with alkaline properties and was cooled using the hot splashing method. The technical indices of the SSA are presented in Table 2 and 3 below. The Graded Gravel (GG) was sourced from a commonly used quarry in Xinjiang.

Table 1. Physical properties and main chemical composition of cement.
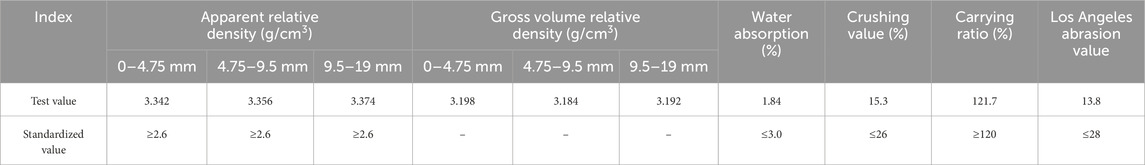
Table 2. Physical properties of SSA.

Table 3. Chemical composition of SSA.
The XRD graph of SSA is shown in Figure 1a, its micro-sample is depicted in Figure 1b, and the natural gradation is represented in Figure 1c below. For SSA micro powder and cement particles under 0.075 mm, the particle size analysis is conducted, as shown in Figure 1d below.
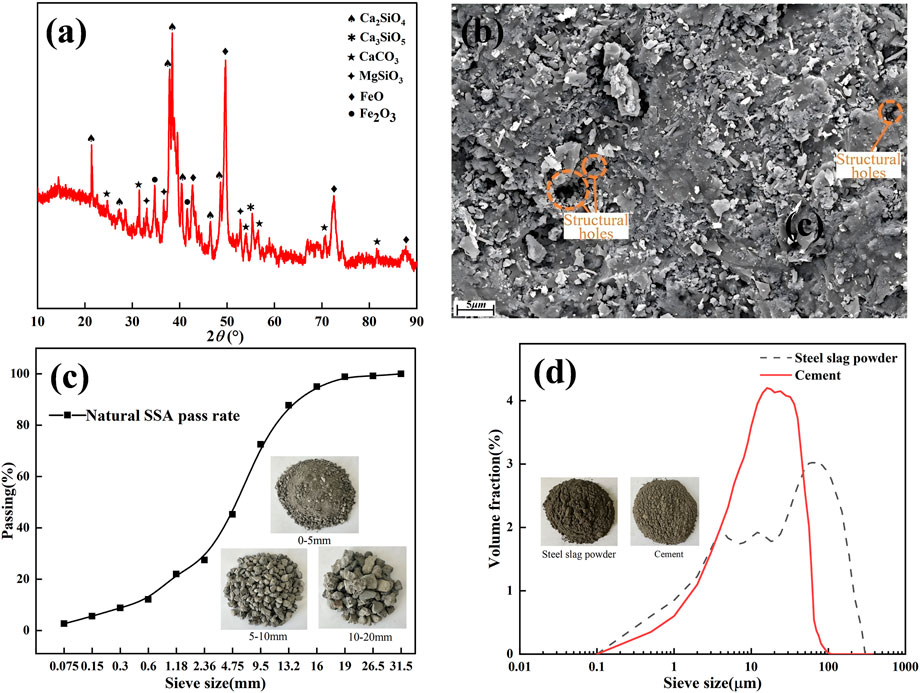
Figure 1. Raw material inspection. (a) XRD graph of SSA; (b) Microscopic sample of SSA; (c) Natural gradation curve of SSA; (d) Particle size distribution of SSA Micropowder and Cement.
2.2 Test program
The test was conducted following the gradation design requirements for cement-stabilized gravel specified in the Technical Guidelines for Construction of Highway Road Bases (JTG/T F20-2015, 2015). The same volume of SSA was used to replace the aggregate, with six mixing gradients designed (0%, 20%, 40%, 60%, 80%, and 100%). To avoid altering the gradation, the steel slag is sieved into the same size fractions as the GG, and each fraction is replaced accordingly. Since steel slag rarely contains particles larger than 19 mm, the 20–25 mm fraction of GG is retained without replacement; according to the engineering practice, select three typical cement dosage levels of 3%, 4%, and 5%; perform systematical tests on the mechanical properties (unconfined compressive strength, splitting strength), volumetric stability (dry shrinkage, temperature shrinkage strain), and freeze-thaw cycles of cement-stabilized SSA-GG mixture; and conduct the multi-factor coupling analysis, to determine the optimal material ratio of the mixture, providing improved design parameters for engineering applications.
2.3 Test methods
2.3.1 Mechanical properties test
As illustrated in Figures 2a–c, mechanical property testing was conducted following the specifications in the Test Methods of Materials Stabilized with Inorganic Binders for Highway Engineering (JTG 3441-2024, 2024). Cylindrical specimens (150 mm × 150 mm) were prepared with three cement dosages (3%, 4%, and 5%), while SSA was incorporated at substitution rates ranging from 0% to 100% of GG (at 20% intervals). The unconfined compressive strength and splitting strength of the mixtures were tested at 7 days, 28 days, 60 days, and 90 days, in accordance with standard test methods T0805-2024 and T0806-1994.
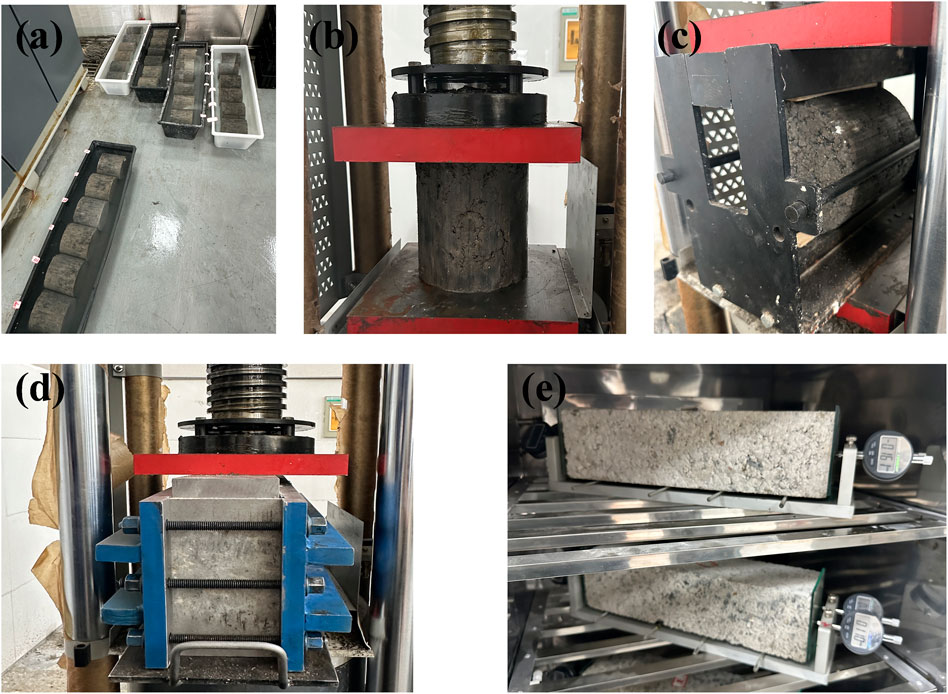
Figure 2. Performance Testing. (a) Soaking in water; (b) Unconfined compression test; (c) Splitting test; (d) Specimen molding; (e) Contraction test.
2.3.2 Volume stability test
As illustrated in Figures 2d,e, the volume stability test of the mixture was conducted following the specifications in the Test Methods of Materials Stabilized with Inorganic Binders for Highway Engineering (JTG 3441-2024, 2024). Medium-sized beam specimens (100 mm × 100 mm×400 mm) were prepared using the static pressure method. Dry shrinkage and temperature shrinkage tests were performed after 7 days of curing, in accordance with standard methods T0854-2024 and T0855-2024, with data recorded at specified time intervals.
2.3.3 Freeze-thaw cycle test
According to the Test Methods of Materials Stabilized with Inorganic Binders for Highway Engineering (JTG 3441-2024, 2024), cylindrical specimens with standard dimensions of 150 mm × 150 mm were prepared and cured for 28 days. The freeze-thaw cycle test was then conducted using procedures adapted from the standard method. As illustrated in Figure 3, a freeze-thaw cycle chamber was employed to simulate the environmental conditions, with each complete cycle consisting of 16 h of freezing at −18 °C followed by 8 h of thawing in a 20 °C constant temperature water bath. Specimen mechanical properties were tested after 3, 6, 9, 12, 15, and 18 cycles to evaluate frost resistance durability.
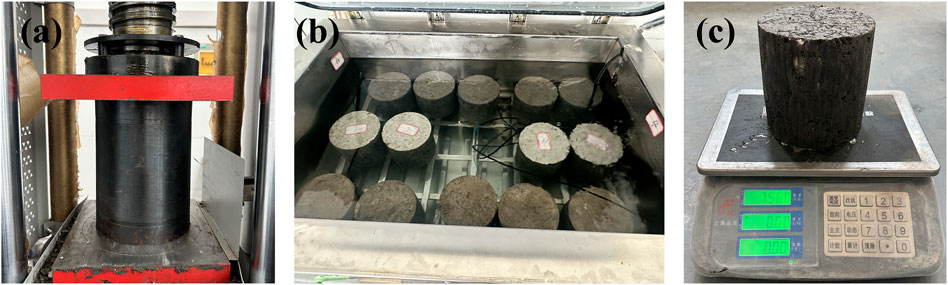
Figure 3. Freeze-thaw cycle test. (a) Specimen molding; (b) Freeze-thaw cycle test; (c) Weigh the quality.
2.3.4 Scanning electron microscope (SEM) test
Use a ZEISS Sigma 300 field emission scanning electron microscope (FE-SEM) to characterize the micro-morphology of the mixture samples after different curing and freeze-thaw cycles. Prepare the sample as follows: Select the granular specimens with a particle size of ≤5 mm, and fix on a copper sample stage with conductive tape; then, perform the gold plating under high vacuum conditions to enhance electrical conductivity, and finally use the high-resolution scanning electron microscope for observation.
2.4 Mixing ratio design
In the construction of high-grade highways in Xinjiang, the base course materials primarily comply with the recommended coarse gradation (C-B-1) and fine gradation (C-B-2) specifications outlined in the Technical Guidelines for Construction of Highway Road Bases (JTG/T F20-2015, 2015). Based on the engineering applications, these two gradations were selected for the study, with the gradation design curves shown in Figure 4. The density of SSA is significantly higher than that of GG, and using equal mass replacement will cause increased specimen void ratio and insufficient compaction, so the volume replacement method was adopted in the test. First, the gross bulk density of SSA and GG was determined using the volumetric flask and mesh basket methods; the mass of each gradation of GG in the composite gradation was converted to aggregate volume, multiplied by the gross bulk density of SSA; and finally, the mass of SSA required by each sieve was determined. The results of the compaction test are shown in Table 4 below. In the table, ρdmax denotes the maximum dry density, and ωopt denotes the optimum moisture content.
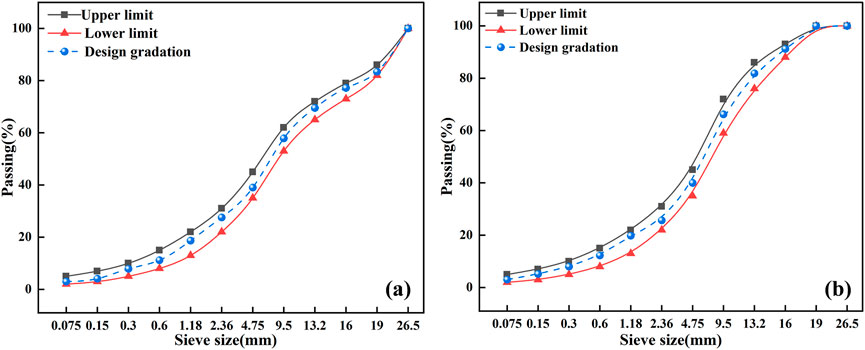
Figure 4. Gradation design curve. (a) C-B-1 Gradation; (b) C-B-2 Gradation.
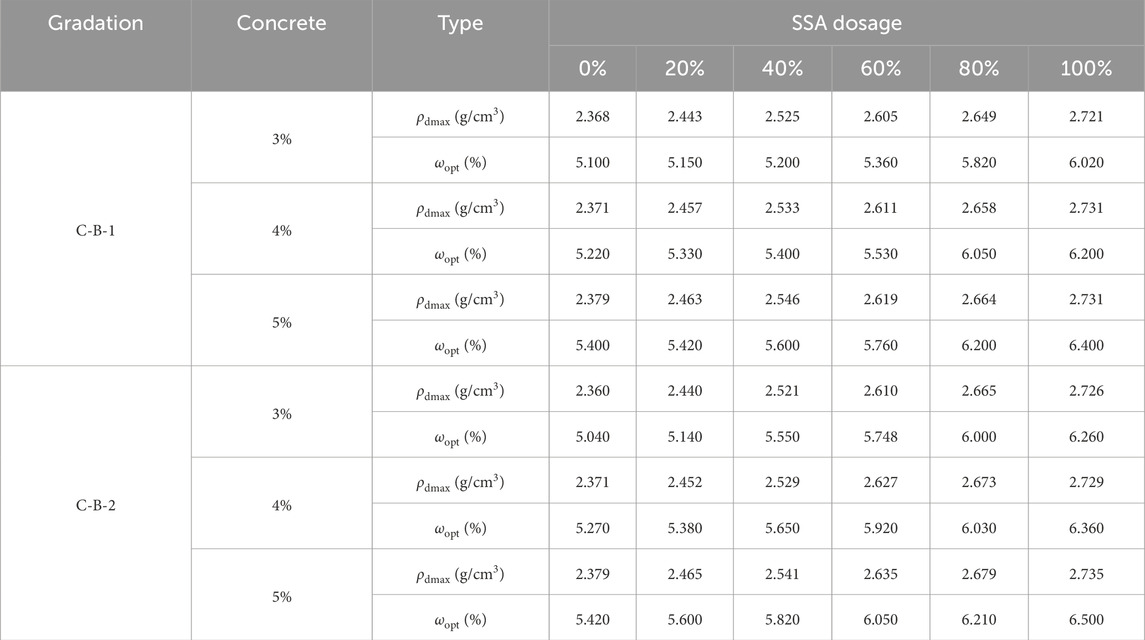
Table 4. Compaction test results with different SSA dosages.
3 Mechanical properties of cement-stabilized SSA-GG mixture
3.1 Unconfined compressive strength
The results of unconfined compressive strength tests for two gradations, three cement dosages, and 6 SSA dosages are presented in Figure 5 below. In terms of cement dosage, increasing the dosage significantly enhanced the early and later strength of the mixture. Cement hydration generated cementitious products such as C-S-H and C-A-S-H, which effectively bonded the gravel soil and cement particles, forming a dense structure. When the cement dosage was 3%, the 7-day strength of the unadulterated SSA mixture reached 5.7°MPa, meeting the specification requirements for heavy traffic road base courses (5.0–7.0 MPa) as stipulated in the Technical Guidelines for Construction of Highway Road Bases (JTG/T F20-2015, 2015). Regarding the gradation design, the strength of the C-B-1 gradation exceeded that of C-B-2; larger particle size aggregates provided a higher embedded locking effect in the early stages of incomplete hydration. However, there was no larger particle size aggregate in the C-B-2 gradation, failing to form a skeletal structure. As the hydration reaction proceeded and more hydration products were generated, the strength difference due to gradation gradually diminished. Concerning SSA dosage, the 7-day strength increased with SSA content up to 60%, reaching a peak value 38% higher than the unadulterated mixture. This improvement is mainly due to the active components in SSA (e.g., C2S, C3S, and f-CaO) participating in secondary hydration, producing additional C-S-H and C-A-S-H gels that refine pores and enhance microstructure densification. The interfacial transition zone (ITZ) between SSA and cement is also strengthened, improving bonding and reducing microcracking. However, beyond 60% dosage, excessive slurry absorption by the porous SSA structure weakened aggregate bonding. In the long term (60–90 days), continued hydration of C2S and C3S in SSA further increased cementitious products, leading to a denser matrix and significant strength gain even at 80% and 100% SSA dosages.
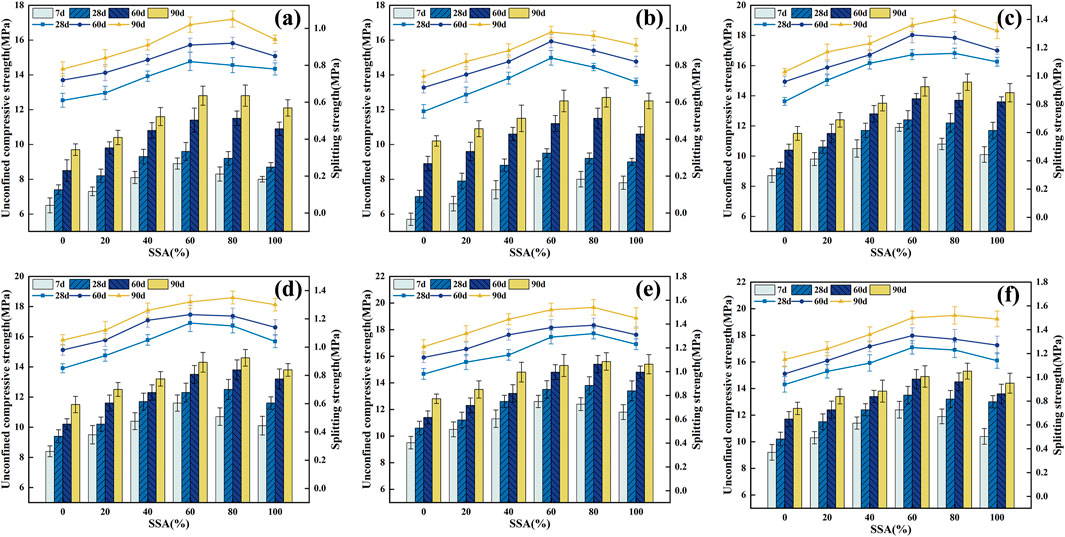
Figure 5. Test results of mechanical properties. (a) C-B-1 graded 3% cement; (b) C-B-2 graded 3% cement; (c) C-B-1 graded 4% cement; (d) C-B-2 graded 4% cement; (e) C-B-1 graded 5% cement; (f) C-B-2 graded 5% cement.
3.2 Splitting strength
The split strength test results are shown in Figure 5. Although the split strength of the mixture was significantly lower than the unconfined compressive strength, it exhibited a similar strength growth pattern. Regarding the cement dosage, the split strength increased by 35% when the cement dosage was raised from 3% to 4%, and decreased by 15% when the dosage was increased to 5%. This condition occurred because a moderate increase in cement could yield more cementitious products to enhance interfacial bonding. In contrast, excessive cement (>4%) could increase drying shrinkage, inhibiting strength development. Concerning the gradation design, when comparing the two gradations C-B-1 and C-B-2, the difference in split strength remained within 5% throughout the curing cycle. This suggested that under the same cementitious system, the impact of the gradation type on the material tensile properties was relatively limited, with its mechanical contribution primarily reflected in the compressive properties. Regarding SSA dosage, at 3% cement dosage, a 60% SSA dosage increased the splitting strength by 39.2% at 28 days and 32.5% at 90 days. Under long age curing conditions (60–90 days), the splitting strength of the 80% SSA dosage group reached its peak, indicating that the active ingredients in SSA continued to produce hydration products such as C-S-H gels during the later stages of the curing period, significantly enhancing the interfacial bonding properties and overall tensile capacity of the mixture.
3.3 Numerical simulation analysis
The macroscopic mechanical property tests above revealed that the unconfined compressive strength and splitting strength of C-B-1 gradation mixture were superior to those of C-B-2 gradation. To examine the fine mechanical mechanism, Particle Flow Code 3D (PFC3D) was used to create a discrete element model of the two gradations, allowing for the analysis of the impact of gradation type on the stability of the skeleton structure at a finer scale.
According to laboratory testing standards, a cylindrical specimen with a diameter of 150 mm and a height of 150 mm was used in this study. In the numerical simulation process, a cylindrical container model consistent with the specimen dimensions was first established. By defining parameters such as the axial vector, base point coordinates, and radius, a cylindrical side wall and upper and lower planar platens were generated to form a complete specimen confinement system. To accurately simulate the actual morphology and spatial distribution of aggregates, three-dimensional scanned STL files were imported into the PFC platform, and irregular clump templates were constructed using the Clump template command. According to the gradation requirements derived from laboratory tests, aggregates were classified into three size groups, 20–25 mm, 10–20 mm, and 5–10 mm, using the bin command, with strict control over the volume fraction of each group. The voids between aggregates were filled with ball elements to simulate the mechanical behavior of 0–5 mm cement paste and fine aggregates.
With reference to previous research findings (Wang et al., 2022; Song et al., 2024), the parallel bond model was selected to characterize the contact behavior of the materials. Corresponding micromechanical parameters were assigned to different contact types, including aggregate-aggregate, aggregate-mortar, and mortar-mortar interfaces. In the numerical testing phase, the pre-balanced model was first restored, after which the cylindrical side wall was removed and particle displacements were reset. Subsequently, the upper and lower platens were initialized, and a strain rate of 0.01/s was applied based on the initial specimen height, with opposing compression velocities assigned to the platens. Real-time monitoring functions were programmed to record stress and strain data, and a periodic saving mechanism was established. The simulation termination condition was set as a 30% drop in peak stress. Using the unconfined compressive strength results of 28-day-cured specimens with a 3% cement content as a benchmark, a parameter inversion method was employed to calibrate the micromechanical parameters of the model systematically. After multiple iterations and optimizations, the relative error between the numerical simulations and experimental data was controlled within 5%. The final micromechanical parameters are presented in Table 5, and a comparison of the stress–strain curves is shown in Figure 6.
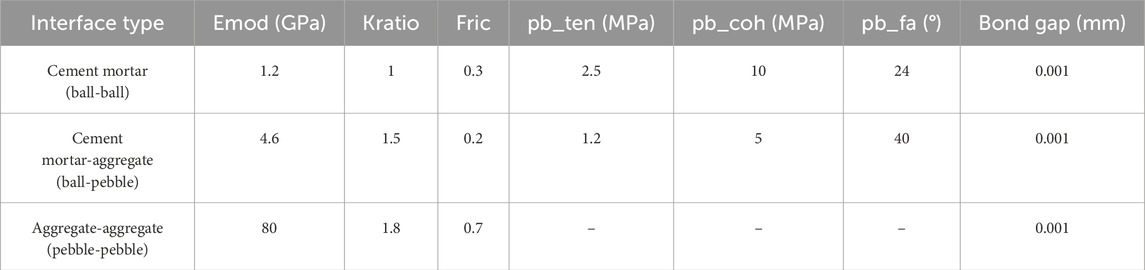
Table 5. Fine contact model parameters of mixture.
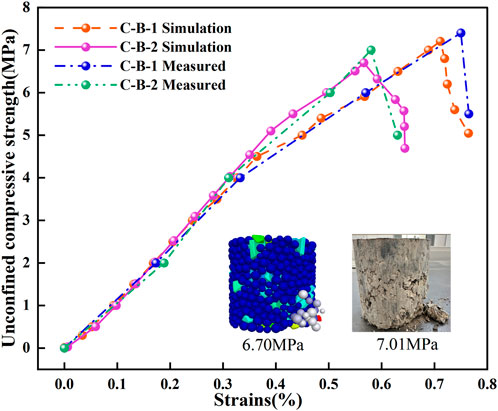
Figure 6. Stress-strain curve.
The fine-scale mechanical simulation can be divided into three distinct stages based on the loading process of the unconfined compressive test: the initial loading stage (Phase I), the semi-peak stress stage (Phase II), and the peak stress stage (Phase III).
Figure 7 illustrates the displacement field and stress distribution characteristics of different specimens at each stage, clearly showing the differences in bearing performance between the specimens of two gradations. In Phase I, the internal stress field of the C-B-1 specimen is uniform, indicating that the cementitious matrix and aggregate skeleton create an effective synergistic load-bearing mechanism to transfer and distribute the external load jointly. In contrast, the C-B-2 specimen displays non-uniformity in stress distribution at the same stage, with the upper and lower ends relying on the bonding effect of cementitious materials to transmit the force. Meanwhile, the middle part is dominated by the coarse aggregate skeleton, resulting from the initial macroscopic structural differences between the two specimens. Upon entering Phase II, stress concentration occurs at the ends of the specimen, while the stress level decreases in the middle. This is due to the elevated load, which enhances the boundary constraint effect at the contact area between the ends and the loading plate.
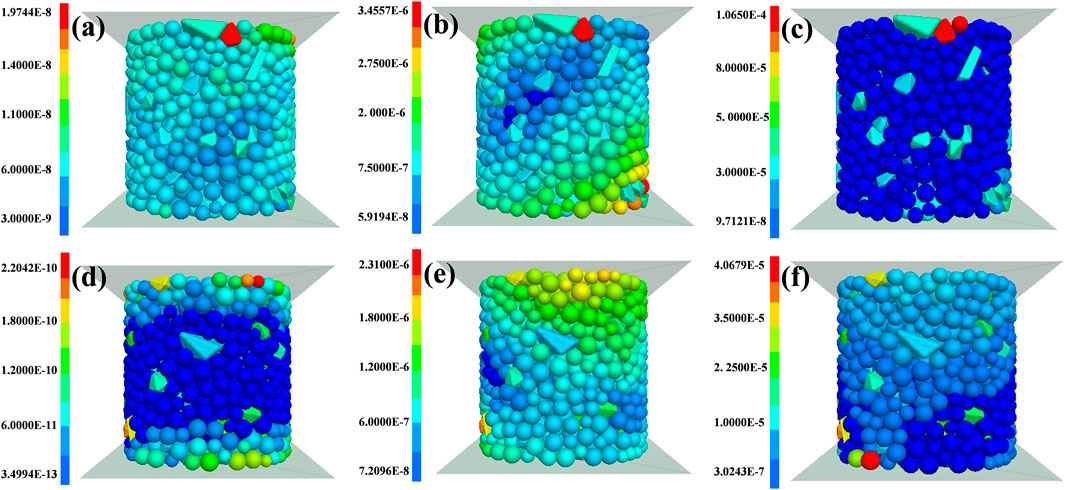
Figure 7. Variation of the displacement field at different stages. (a) C-B-1-Phase I; (b) C-B-1-Phase II; (c) C-B-1-Phase III; (d) C-B-2-Phase I; (e) C-B-2-Phase II; (f) C-B-2-Phase III.
Additionally, the cementitious material subjected to sustained load gradually develops microcracks, weakening its ability to redistribute stress. In Phase III, the disparity between the damage modes of the two specimens becomes even more pronounced. The C-B-1 specimen maintains excellent integrity, with uniform stress in the cementitious material and the large aggregates forming a highly efficient multidirectional force chain network that bears the main compressive stress. Conversely, the upper stress of the C-B-2 specimen is significantly higher than that of the lower part, making this non-uniform stress distribution prone to triggering preferential destruction of cementitious materials in the high-stress area and destabilizing the local aggregate embedding system, ultimately leading to a progressive damage mode. It is evident that although the aggregate of the C-B-2 specimen has a specific embedding effect, its overall bearing efficiency is distinctly lower than that of the C-B-1 specimen.
To analyze the force characteristics and damage mechanisms of the GG skeleton throughout the loading process, the distribution characteristics of clump stress (z-direction contact force) and the crack evolution law are illustrated in Figure 8. As shown in Figure 8a, during loading Phase I, the overall GG skeleton is in a uniform high-stress state. The optimized spatial distribution of large-grained aggregates creates a stable force chain network that efficiently transfers axial loads. However, when analyzed in conjunction with Figures 7d and 8d, local stress concentration occurs at both the upper and lower ends due to the aggregation of small-grain-size GG, resulting in stress at the ends significantly higher than that in the middle. This condition occurs because the accumulation of fine aggregates at the ends disrupts the continuity of the skeleton and obstructs the load transfer path, causing the cementitious material at the ends to bear additional stresses, which can lead to crack formation, transitioning to Phase II. As evident in Figures 8b,e, both sets of specimens exhibit a load-sharing mechanism, wherein the aggregates are interlocked. However, the region enriched with fine aggregates (particularly in the middle and lower portions of the specimens) displays noticeable localized cracks. Due to the lack of stiffness in the fine aggregate region, it becomes a weak link for stress release, with cracks preferentially extending along the fine aggregate-cementitious material interface. In Phase III, as shown in Figures 8c,f, numerous cracks occur in both specimens, although specimen C-B-1 shows fewer cracks. The cracks in both gradations are concentrated around the small grain size GGs, indicating that an uneven distribution of excessive fine grain size GGs can cause microscopic defects, leading to a decrease in the compressive capacity of the mixture and ultimately triggering the overall damage of the structure.
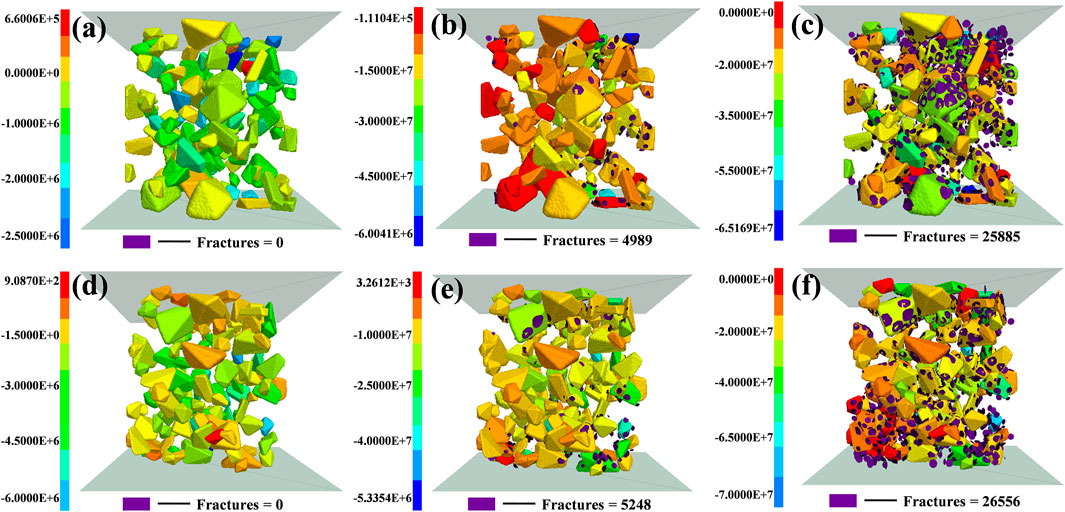
Figure 8. Variation of force on the lower aggregate at various stages. (a) C-B-1-Phase I; (b) C-B-1-Phase II; (c) C-B-1-Phase III; (d) C-B-2-Phase I; (e) C-B-2-Phase II; (f) C-B-2-Phase III.
A comprehensive analysis based on testing of macro mechanical properties and fine numerical simulation showed that when the proportion of fine aggregate was too high, the skeleton structure it forms was impossible to effectively transfer the load, resulting in a significant reduction in material strength. In contrast, an appropriate coarse aggregate could establish a stable spatial skeleton structure, greatly enhancing the mixture’s load-bearing capacity through the mechanical embedding effect between particles. This skeleton effect was characterized by a more uniform distribution of force chains and a more efficient stress transfer path at the fine scale. The systematic comparison of the mechanical response characteristics of the two grading schemes proved the C-B-1 grading scheme was better.
4 Durability test
Based on the results of the macroscopic mechanical property test and analysis of the fine mechanical mechanism conducted earlier, the C-B-1 graded mixture with 3% cement dosage was selected as the research subject for the experimental study and analysis of its durability performance.
4.1 Dry shrinkage performance test
Figure 9 below shows the drying test results for the cement-stabilized SSA-GG mixture at various ages and SSA dosages.
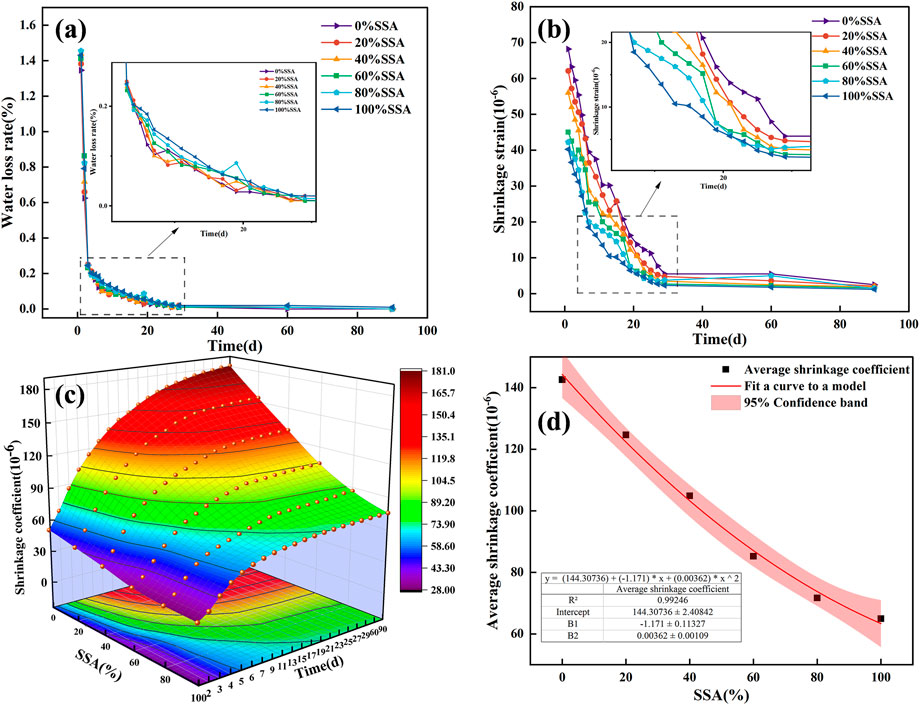
Figure 9. Drying experiment results. (a) Water loss rate-age relationship; (b) Drying strain-age relationship; (c) Drying coefficient-age relationship; (d) Average drying coefficient-SSA dosage.
Figure 9a shows that the water loss rate of the mixture decreases exponentially with the curing time, and the proportion of water loss reaches 71.3% ± 2.0% in the first 4 days, and then becomes stabilized afterward. For every 20% increase in SSA dosage, the water loss rate rises by 2.5%–5.5%. The mechanism is as follows: In the initial stage (0–4 days), the moisture gradient drives dual water loss, i.e., surface evaporation (controlled by temperature and humidity) and hydration water consumption (dependent on gelling activity), which act synergistically; and in the later stage, the hydration products (C-S-H gel, AFt crystals) block the capillary pore channels and create a dense barrier that inhibits water loss. Additionally, mixing SSA results in a larger ωopt and increase of active substances, leading to an aggravated initial water migration, which correlates positively with the mixing amount and the water loss rate.
Figures 9b,c show that the dry shrinkage strain value of the mixture is negatively correlated with the SSA dosage. When the SSA dosage is increased from 0% to 100%, the 28 days dry shrinkage strain decreases by as much as 57.6%. This reduction is due to the expansion phase generated by the delayed hydration of the SSA filling the pore space in the mixture, which counteracts the shrinkage stress, thereby significantly reducing the dry shrinkage strain of the mixture. The water loss rate gradually increases, and the corresponding water loss ratio rises progressively, similar to the SSA. The corresponding dry shrinkage coefficient of the mix is also steadily reduced. Figure 9d presents the statistical regression analysis, indicating that with a 20% increase in SSA dosage, the dry shrinkage coefficient of the mixture exhibits a stepwise decrease of 12.5%–54.3%. This change can be expressed with the quadratic equation (y = 144.30736-1.171x+0.00362x2, R2 = 0.992). In engineering practice, this quadratic equation can be utilized to determine the optimal SSA dosage range by setting an allowable dry shrinkage threshold.
4.2 Temperature shrinkage performance test
Figure 10 below displays the results of the temperature shrinkage test for the mixture within the temperature range of 40 to −20 °C for various SSA dosages.
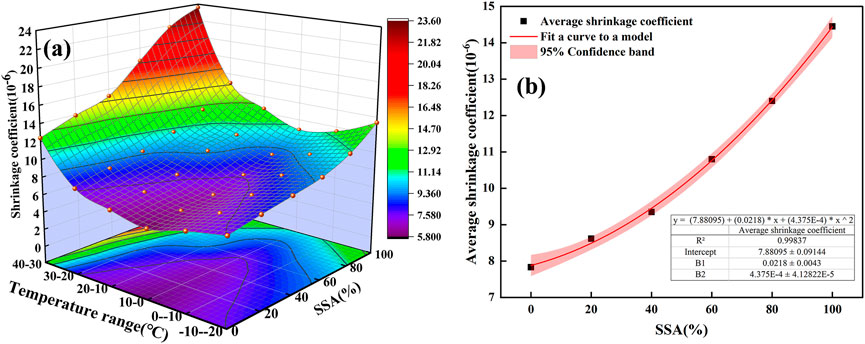
Figure 10. Results of temperature shrinkage test. (a) Relationship between SSA dosage and temperature shrinkage coefficient; (b) Relationship between SSA dosage and average shrinkage coefficient.
From Figure 10a, it is evident that the temperature shrinkage coefficient of the mixture exhibits significant nonlinear evolution characteristics. The temperature shrinkage coefficient shows a changing pattern that decreases and then rises. In the temperature interval of 10 °C–0 °C, the trace pore water in the mixture begins to form ice crystals, resulting in an expansion effect that reduces the temperature shrinkage coefficient of the mixture to its minimum value among the mixing materials. From Figure 10b, it can be observed that increasing the SSA dosage from 0% to 100% raises the temperature shrinkage coefficient from 10.0% to 84.5%. This change can be expressed with the quadratic equation (y = 7.88 + 0.0218x+0.0004375x2, R2 = 0.998). This is attributed to the thermal expansion coefficient of the RO phase (FeO-MnO solid solution) in SSA (12 × 10−6∼14 × 10−6 με/ °C), which is notably higher than that of natural aggregate (6 × 10⁻⁶∼12 × 10−6 με/ °C). This difference in thermodynamic properties results in a significant increase in the temperature sensitivity of the mixture system, which is macroscopically reflected in the gradient increase of the coefficient of temperature shrinkage with the dosage of SSA.
Comparing the temperature shrinkage and drying strain under the extreme climatic conditions in Xinjiang (where the maximum temperature difference between day and night is 20 °C), the cumulative drying strain of the mixture measures 300–600 × 10−6, while the temperature shrinkage strain produced by the equivalent temperature cycle is only 150–350 × 10−6. This indicates that the drying strain is 1.7–2.4 times greater than the temperature shrinkage. The dry shrinkage process also involves irreversible plastic deformation, as water evaporation results in permanent changes to the pore structure. In contrast, the temperature shrinkage deformation exhibits partially reversible characteristics, with 50%–70% of the strain recoverable when the temperature returns to a higher level due to the thermoelastic hysteresis effect. Thus, cracking occurring in the inorganic binding material stabilized base layer primarily stems from material deformation and stress concentration caused by the dry shrinkage effect. The appropriate SSA dosage in cement-stabilized gravel material can enhance the microstructural properties of the material, inhibiting shrinkage and deformation while significantly improving its anti-cracking performance.
4.3 Freeze-thaw cycle test
4.3.1 Changes in apparent morphology
The optimal SSA dosage range was determined as 40%–80% based on the mechanical properties and shrinkage characteristics. A freeze-thaw cycle test was conducted to explore the effect of SSA dosage on the mix’s frost resistance.
As shown in Figure 11, the surface and sides of all specimens exhibit surface layer spalling, specifically manifesting as the formation of pits, grooves, and net-like grooves in local areas, along with aggregate exposure. However, from an overall structural perspective, there are no noticeable penetrating cracks, indicating that the specimens maintain a certain degree of structural continuity on a macro scale. Furthermore, the structural integrity of the specimens significantly increased with higher SSA dosages, with the 60% and 80% dosage specimens demonstrating a denser matrix structure. This suggests that SSA dosage can optimize the material’s internal and external pore structures, enhancing the ability of the mixture to resist freeze-thaw damage and allowing the specimens to retain better surface integrity after freeze-thaw cycles.
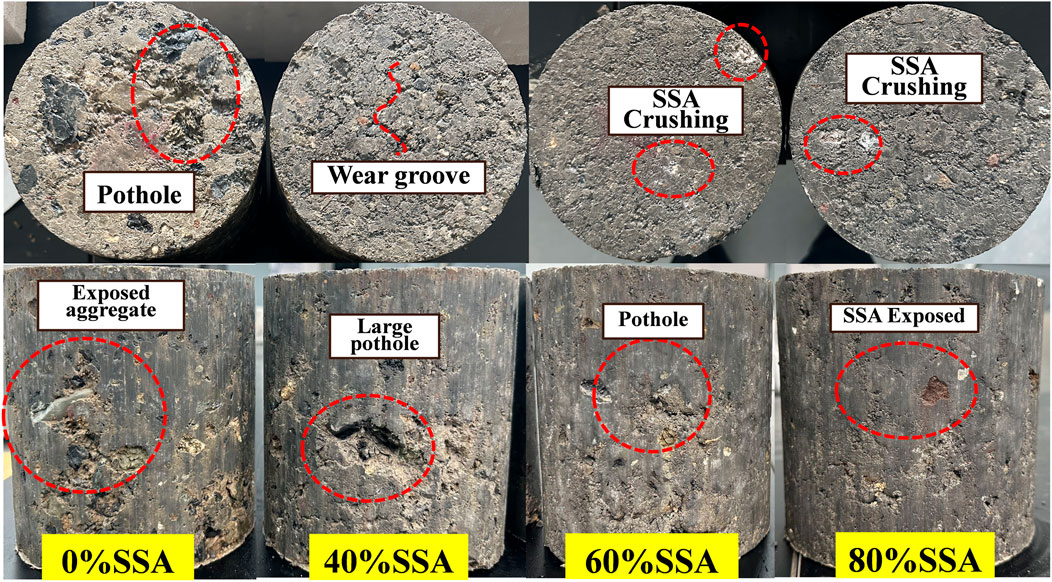
Figure 11. Changes in appearance and morphology.
4.3.2 Mass loss rate
The pattern of change in the mass of cement-stabilized SSA mixture under freeze-thaw cycle conditions is shown in Figure 12a. The results indicated that the mass loss rate of the mixture with 0% SSA continued to increase with the number of freeze-thaw cycles, showing a significant rise after the ninth cycle. In contrast, the mixture with SSA demonstrated a negative mass loss rate, reflecting a positive trend in its mass, which became more pronounced with increased SSA dosage. This phenomenon can be attributed to SSA’s high water absorption and porous structure. At the beginning of the freeze-thaw cycle, the open pores on the surface of SSA gradually expanded due to alternating temperatures, leading to greater water infiltration. Subsequently, the mass of absorbed water exceeded that of lost materials, increasing the apparent mass. However, after 12 freeze-thaw cycles, material loss in the mixture exceeded the absorbed water, resulting in the upward trend in mass loss rate. Consequently, there was an increase in the mass loss rate.
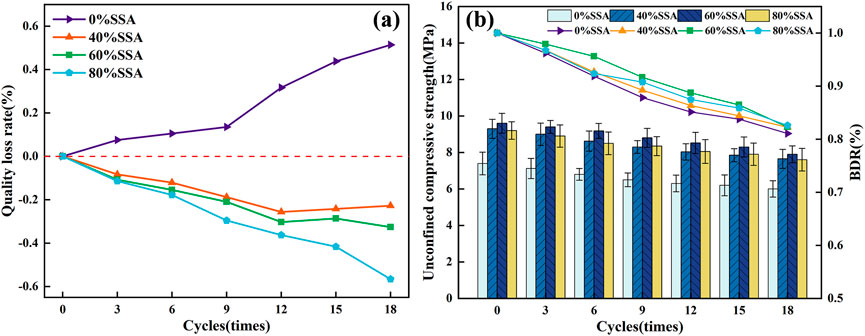
Figure 12. Freeze-thaw cycle test results. (a) Changes in the rate of mass loss; (b) Unconfined compressive strength.
4.3.3 Unconfined compressive strength
The unconfined compressive strength of cement-stabilized SSA mixture under freeze-thaw cycle conditions is illustrated in Figure 12b. As shown in the figure, it is evident that the compressive strength of the mixture gradually decreases with the increase of the freeze-thaw cycles. The mechanism behind strength decay can be attributed to the cumulative process of multiscale damage. As shown in Figure 13, the inherent micropores and cracks within the mixture create pathways for water infiltration. During the cyclic freeze-thaw process, pore water continuously migrates and aggregates; when the ambient temperature drops below freezing, this pore water undergoes a phase transition and expands to form ice crystals, generating significant frost heave stresses under constrained conditions. This cyclic freezing and expansion induce two levels of destructive effects. On the microscopic scale, it results in the loosening of the cementitious structure of the hydration products and the weakening of the interfacial bonding strength between the hydration products from the active components of SSA and the aggregate. On a finer scale, it leads to stress concentration in the transition zone at the interface between the cement stone and the aggregate, promoting the emergence of microcracks. As the number of freeze-thaw cycles increases, these microcracks continue to expand under alternating stress and interact with one another, ultimately forming macrocracks, which results in a significant decline in the material’s overall structural integrity and bearing capacity.
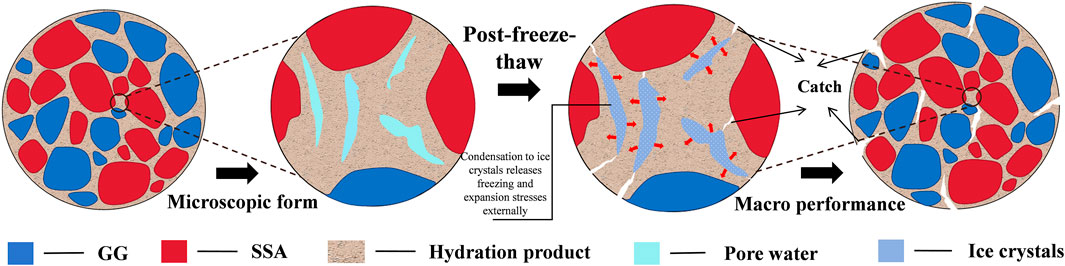
Figure 13. Mechanism of freeze-thaw cycle damage.
With the increase of freeze-thaw cycles, the freeze-thaw residual strength ratio (BDR) of the mixture of different SSA dosages showed a decreasing trend. The test results showed that under the condition of the same number of freeze-thaw cycles, the BDR value of the mixture exhibited a trend of increasing and then decreasing with the increase of SSA dosage, and reached the peak value at 60% dosage. Adding an appropriate amount of SSA (≤60%) could give full play to its water-absorbing properties and potential gelling activity, generate additional C-S-H gel and other gelling products during the hydration reaction, effectively optimize the distribution of the pore structure of the mixture, and thus improve its resistance to freeze-thaw damage. However, when the dosage of SSA was 80%, the hydration reaction was insufficient due to the limitation of the total cementitious materials. On the other hand, the excessive f-CaO in SSA generated too many Ca(OH)2 crystals with expansion characteristics during the hydration process. Together, these two factors led to the unfavorable volumetric expansion effect inside the mixture, which accelerated the structural damage during the freeze-thaw cycle and ultimately manifested as a significant decrease in the BDR value.
Based on the results of the mechanical properties test, the shrinkage test, and the freeze-thaw cycle test, 60% SSA dosage is recommended for use in Xinjiang and other areas with significant temperature differences. The mechanical properties of the mixture are optimal, the average dry shrinkage coefficient has been reduced to 85.2, and the temperature shrinkage coefficient shows minimal increase. After 18 freeze-thaw cycles, the BDR of the mixture remains above 80%, meeting the engineering mechanical properties and long-term durability requirements.
5 Micro-mechanism analysis
5.1 Analysis of micro-mechanisms across various ages
Figure 14 illustrates the evolution of the microscopic morphology of 0% and 60% SSA dosage mixtures at various curing ages. The analysis was conducted concerning hydration reaction kinetics and product development:
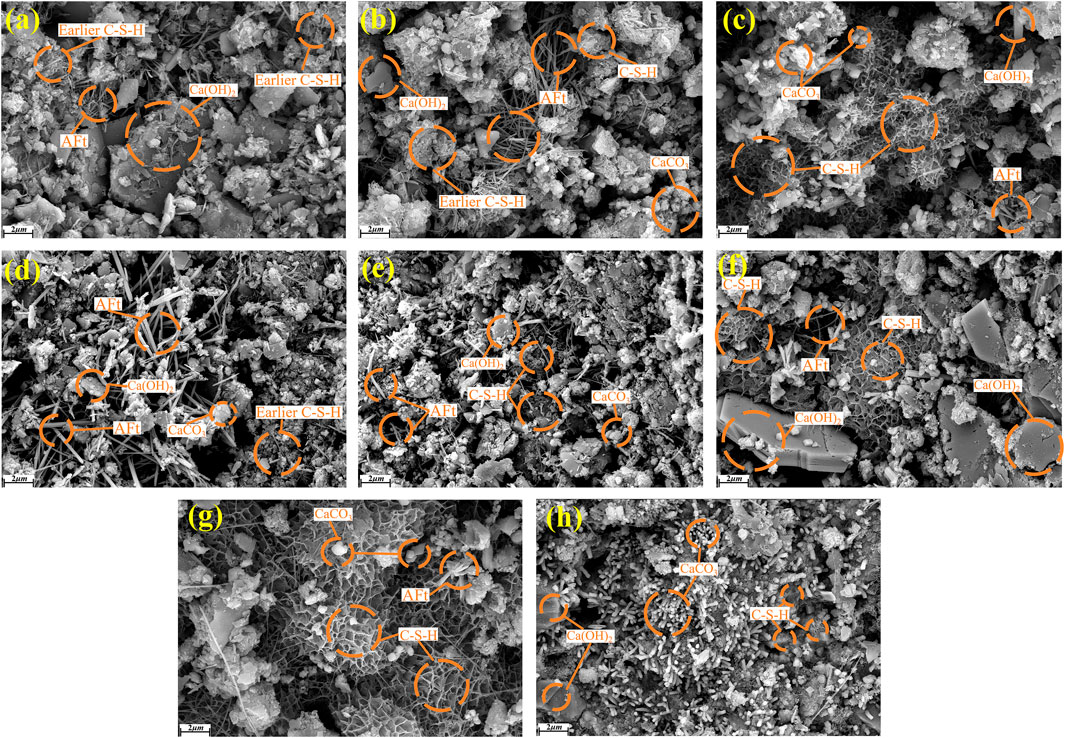
Figure 14. Analysis of micro-mechanisms at different ages. (a) 7 days-0%SSA; (b) 28 days-0% SSA; (c) 60 days-0% SSA; (d) 7 days-60% SSA; (e) 28 days-60% SSA; (f) 60 days-60% SSA; (g) 90 days-0% SSA; (h) 90 days-60% SSA.
At 7 days (Figures 14a,d), rod-shaped AFt, massive Ca(OH)2, and spherical CaCO3 were present in both mixes. However, the SSA mixing system promoted the nucleation and growth of early AFt due to the higher content of reactive Ca2+ and SO42- ions, resulting in a significantly larger number of AFt compared to the control group, which explains the microscopic mechanism of the early strength advantage of the SSA specimens. At 28 days (Figures 14b,e), the control group underwent the typical silicate cement hydration reaction, producing a large amount of AFt and initial C-S-H gel. The SSA system, on the other hand, exhibited a significantly different reaction path: AFt was gradually converted to C-S-H gel, and at the same time, f-CaO in SSA continued to hydrate, generating Ca(OH)2. This dual reaction mechanism suggests that mixing SSA altered the hydration kinetics of the system.
At 60 days (Figures 14c,f), both sets of specimens formed a more developed C-S-H gel network. However, Ca(OH)2 produced by continuous hydration of f-CaO in the SSA specimens existed as hexagonal plate-like crystals, and such crystals effectively filled the pores through the swelling effect, which corroborated the results of the dry shrinkage experiments. By 90 days (Figures 14g,h), the SSA system showed more significant post-age hydration characteristics: the C-S-H gel was further hydrated to form a highly dense gel structure, indicating that the reactive SiO2 and Ca(OH)2, etc., in the SSA continued to participate in the secondary hydration; Ca(OH)2 carbonized to form CaCO3 crystals clusters, and this double-filling effect (hydration swelling + carbonization deposition) significantly optimized the pore structure. In contrast, the control group relied only on accumulating conventional hydration products to achieve structural densification.
From the perspective of elemental migration, mixing SSA introduced additional metal ions, such as Ca2+ and Fe3+, which continued to optimize the structural evolution of the cementitious system by forming AFt, and facilitating the polymerization of C-S-H gels. Macroscopically, this is manifested in the continuous improvement of mechanical properties, attributed to SSA’s unique multi-stage hydration mechanism and elemental synergy.
5.2 Mechanism analysis under different numbers of freeze-thaw cycles
Figure 15 shows the microstructural deterioration of mixtures containing 0% and 60% SSA subjected to varying numbers of freeze-thaw cycles (the parameter ‘t’ indicates the cycle number). After three freeze-thaw cycles (Figures 15a,d), the 60% SSA specimens showed only microcracks in the AFt phase region, while penetrating cracks formed in the control group. This condition occurred because the Fe3+ and Al3+ ions in the SSA system enhanced the stability of AFt crystals through solid solution. Simultaneously, the dense C-S-H gel generated offered better resistance to frost heave. After nine cycles (Figures 15b,e), although cracks appeared in the SSA specimens, the C-S-H surrounding the cracks and the Ca(OH)2 remained intact within the structure, indicating that the continuous hydration of the active components (f-CaO, C2S, etc.) in the SSA could repair some of the freeze-thaw damage. In contrast, the control group exhibited significant loss of cementitious materials and numerous collapsed pores due to a lack of secondary hydration capacity. After 18 cycles (Figures 15c,f), the SSA specimens showed gaps in the interfacial transition zone (ITZ). However, the overall cementitious skeleton still maintained high densities, which could be attributed to the filling of the micropores by the C-S-H gel produced by hydration of the SSA. The Fe3+ involved in forming the Fe-phase C-S-H showed higher chemical stability. In contrast, the gelation system collapsed in the control group, directly associated with the loss of bonding force due to the significant dissolution of Ca(OH)2.
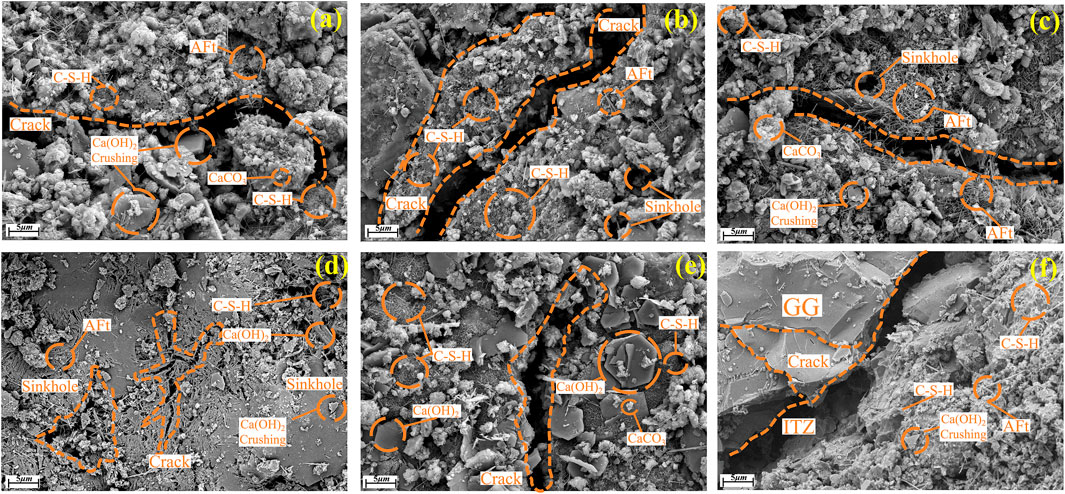
Figure 15. Micro-mechanism analysis under different numbers of cycles. (a) 3t-0% SSA; (b) 9t-0% SSA; (c) 18t-0% SSA; (d) 3t-60% SSA; (e) 9t-60% SSA; (f) 18t-60% SSA.
In summary, the effective dissipation of freezing stresses by the highly dense gel structure allowed the 60% SSA specimens to maintain a high level of pristine gelling properties after 18 cycles of freezing and thawing, which was significantly better than that of the unadulterated SSA mixture.
6 Conclusion
This study systematically examined the effects of gradation, cement dosage, SSA dosage, and age on the macroscopic mechanical properties of mixtures by replacing GG with SSA using the volume replacement method. The fine mechanical effects of gradation were analyzed through PFC3D simulation, and the durability was evaluated by combining dry shrinkage, temperature shrinkage, and freeze-thaw tests. Additionally, SEM was employed to reveal the hydration enhancement mechanism of SSA and the freeze-thaw deterioration mechanism from a microscopic perspective. The main conclusions are as follows.
1. Macro-mechanical tests indicated that cement dosage, grading design, and SSA dosage significantly affected the mechanical properties of the mixture. An increase in cement dosage (3%–5%) effectively improved both the early and later strength; however, when the dosage was beyond 4%, the enhancement in mechanical properties diminished. C-B-1 grading exhibited better compressive and splitting strength in the early stages due to the skeleton-embedded locking effect, although it showed reduced differences in later stages. Mixing SSA notably enhances cementation, with a 38% rise in 7 days compressive strength at 60% dosage. In comparison, 80% dosage maximized mechanical properties at later ages (60–90 days) due to the continuous hydration of active components.
2. PFC 3D was employed to elucidate the granular mechanical impact of grading design on the bearing performance of mixes, the stabilizing force chain network formed by large aggregates in C-B-1 grading ensured uniform stress transfer and demonstrated overall synergistic bearing characteristics. Conversely, C-B-2 grading caused uneven stress distribution due to the concentration of fine aggregates, which triggered local stress concentration and gradual damage. The fine aggregate region, lacking stiffness, became the weak link for crack initiation and propagation. In contrast, the large aggregate skeleton maintained structural stability through the multidirectional force chain network.
3. Regarding durability performance, as the dosage of SSA increased, the expansion phase generated by its hydration filled the pores and reduced the 28 days dry shrinkage strain by 57.6%. However, the high thermal expansion coefficient of the RO phase in SSA with increasing dosage led to a rise in the temperature shrinkage coefficient of the mixture by 10.0%–84.5%. The freeze-thaw cycle test demonstrated that a SSA dosage of 60%–80% allowed the specimen to maintain the best structural integrity, and the initial water absorption characteristics of its porous structure resulted in a negative mass loss; additionally, the optimum compressive strength with a 60% SSA dosage could still reach 7.9 MPa after 18 cycles.
4. Microscopic tests showed that SSA promoted early AFt generation by supplying active Ca2+ and SO42-, while f-CaO continued to hydrate, forming expansive Ca(OH)2 that filled the pores. Later, Ca(OH)2 participated in secondary reactions, generating dense C-S-H gels. The freeze-thaw test demonstrated that the degree of destruction in the gel system of the mixture with 60% SSA dosage was significantly lower than that of the control group, maintaining a relatively intact structure even after 18 freeze-thaw cycles, indicating excellent resistance to freeze-thaw damage.
Data availability statement
The raw data supporting the conclusions of this article will be made available by the authors, without undue reservation.
Author contributions
YW: Conceptualization, Data curation, Formal Analysis, Methodology, Writing – original draft, Writing – review and editing. HJ: Formal Analysis, Investigation, Resources, Supervision, Writing – review and editing. HX: Funding acquisition, Project administration, Resources, Supervision, Writing – review and editing. YJ: Validation, Visualization, Writing – review and editing. XZ: Funding acquisition, Supervision, Writing – review and editing. WJ: Validation, Visualization, Writing – review and editing. ZL: Data curation, Formal Analysis, Funding acquisition, Investigation, Project administration, Resources, Supervision, Validation, Writing – original draft, Writing – review and editing.
Funding
The author(s) declare that financial support was received for the research and/or publication of this article. The author(s) declare that financial support was received for the research and/or publication of this article. This study was financially supported by the National Natural Science Foundation of China (grant number 52268072) and a Joint Research Project between Academic Institutions and Enterprises (grant number HLJY2022KY0628A).
Conflict of interest
Author XZ was employed by Xinjiang Huli Jiayuan Environmental Protection Technology Co., Ltd.
The remaining authors declare that the research was conducted in the absence of any commercial or financial relationships that could be construed as a potential conflict of interest.
Generative AI statement
The author(s) declare that no Generative AI was used in the creation of this manuscript.
Any alternative text (alt text) provided alongside figures in this article has been generated by Frontiers with the support of artificial intelligence and reasonable efforts have been made to ensure accuracy, including review by the authors wherever possible. If you identify any issues, please contact us.
Publisher’s note
All claims expressed in this article are solely those of the authors and do not necessarily represent those of their affiliated organizations, or those of the publisher, the editors and the reviewers. Any product that may be evaluated in this article, or claim that may be made by its manufacturer, is not guaranteed or endorsed by the publisher.
References
Anastasiou, E., Filikas, K. G., and Stefanidou, M. (2014). Utilization of fine recycled aggregates in concrete with fly ash and steel slag. Constr. Build. Mater. 50, 154–161. doi:10.1016/j.conbuildmat.2013.09.037
Barisic, I., Dimter, S., and Rukavina, T. (2015). Elastic properties of cement-stabilised mixes with steel slag. Int. J. Pavement Eng. 17 (9-10), 753–762. doi:10.1080/10298436.2015.1019496
Chen, G., and Wang, S. (2023). Research on macro-microscopic mechanical evolution mechanism of cement-stabilized steel slag. J. Build. Eng. 75, 107047. doi:10.1016/j.jobe.2023.107047
Du, S. (2019). Mechanical properties and shrinkage characteristics of cement stabilized macadam with asphalt emulsion. Constr. Build. Mater. 203, 408–416. doi:10.1016/j.conbuildmat.2019.01.126
Feng, M., Wang, D., Zhang, H., Ma, H., Huang, X., Gao, W., et al. (2025). Volume stability evaluation and life prediction of steel slag water-stabilised materials. Road. Mater. Pavement. Des. 1–21. doi:10.1080/14680629.2025.2492140
Jianlong, G., Yanping, B., and Min, W. (2018). Steel slag in China: treatment, recycling, and management. Waste Manag. 78, 318–330. doi:10.1016/j.wasman.2018.04.045
JTG 3441-2024 (2024). Test methods of materials stabilized with inorganic binders for highway engineering. Beijing, China: Ministry of Transport of the People's Republic of China.
JTG/T F20-2015 (2015). Technical guidelines for construction of highway road bases. Beijing, China: Ministry of Transport of the People's Republic of China.
Li, W., Lang, L., Lin, Z., Wang, Z., and Zhang, F. (2017). Characteristics of dry shrinkage and temperature shrinkage of cement-stabilized steel slag. Constr. Build. Mater. 134, 540–548. doi:10.1016/j.conbuildmat.2016.12.214
Li, Z., Shen, A., Yang, X., Guo, Y., and Liu, Y. (2022a). A review of steel slag as a substitute for natural aggregate applied to cement concrete. Road Mater. Pavement Des. 24 (2), 537–559. doi:10.1080/14680629.2021.2024241
Li, Q., Li, B., Li, X., He, Z., and Zhang, P. (2022b). Microstructure of pretreated steel slag and its influence on mechanical properties of cement stabilized mixture. Constr. Build. Mater. 317, 125799. doi:10.1016/j.conbuildmat.2021.125799
Li, L., Ling, T. C., and Pan, S. Y. (2022c). Environmental benefit assessment of steel slag utilization and carbonation: a systematic review. Sci. Total Environ. 806, 150280. doi:10.1016/j.scitotenv.2021.150280
Liu, J., Yu, B., and Wang, Q. (2020). Application of steel slag in cement treated aggregate base course. J. Clean. Prod. 269, 121733. doi:10.1016/j.jclepro.2020.121733
Marina, D.-P., Terrados-Cristos, M., Lvarez-Cabal, J. V., and Eliseo, V.-G. (2021). Comprehensive analysis of steel slag as aggregate for road construction: experimental testing and environmental impact assessment. Materials 14 (13), 3587. doi:10.3390/ma14133587
Neto, J. B. F., Fredericci, C., Faria, J. O. G., Chotoli, F. F., and Lotto, A. A. (2017). Modification of basic oxygen furnace slag for cement manufacturing. J. Sustain. Metallurgy 3 (1), 1–9. doi:10.1007/s40831-017-0133-5
Qin, F., He, Z. B., and Huang, Q. N. (2011). Research on the corrosion resistance of manganese slag cement stabilized macadam base. Adv. Mater. Res. 280, 13–18. doi:10.4028/www.scientific.net/AMR.280.13
Ren, Z., and Li, D. (2024). Uniaxial compressive behavior study of normal-strength concrete using waste steel slag aggregate through laboratory tests and numerical simulation. J. Build. Eng. 85, 108720. doi:10.1016/j.jobe.2024.108720
Song, P.-C., Chen, G.-X., and Chen, Y.-J. (2024). Optimizing the utilization of steel slag in cement-stabilized base layers: insights from freeze–thaw and fatigue testing. Materials 17 (11), 2576. doi:10.3390/ma17112576
Tang, G., Liu, X., Yang, Y., Chen, D., Deng, D., Zhou, L., et al. (2020). Phosphorus-containing silane modified steel slag waste to reduce fire hazards of rigid polyurethane foams. Adv. Powder Technol. 31 (4), 1420–1430. doi:10.1016/j.apt.2020.01.019
Wang, S., Chen, G., and Zhang, L. (2022). Parameter inversion and microscopic damage research on discrete element model of cement-stabilized steel slag based on 3D scanning technology. J. Hazard. Mater. 424, 127402. doi:10.1016/j.jhazmat.2021.127402
Wu, S., Xue, Y., Ye, Q., and Chen, Y. (2007). Utilization of steel slag as aggregates for stone mastic asphalt (SMA) mixtures. Build. Environ. 42 (7), 2580–2585. doi:10.1016/j.buildenv.2006.06.008
Xiang, X. D., Xi, J. C., Li, C. H., and Jiang, X. W. (2016). Preparation and application of the cement-free steel slag cementitious material. Constr. Build. Mater. 114, 874–879. doi:10.1016/j.conbuildmat.2016.03.186
Yang, X., Wu, S., Chen, B., Ye, G., and Xu, S. (2024). Development of a sustainable stabilized macadam road base using steel slag as supplementary cementitious material. Constr. Build. Mater. 449, 138566. doi:10.1016/j.conbuildmat.2024.138566
You, L., Yue, Y., Yan, K., and Zhou, Y. (2020). Characteristics of cement-stabilized macadam containing surface-treated recycled aggregates. Road Mater. Pavement Des. 22 (3), 2029–2043. doi:10.1080/14680629.2020.1740771
Zhang, J., Ding, L., Li, F., and Peng, J. (2020). Recycled aggregates from construction and demolition wastes as alternative filling materials for highway subgrades in China. J. Clean. Prod. 255, 120223. doi:10.1016/j.jclepro.2020.120223
Keywords: steel slag, discrete element, roadworthiness, freeze-thaw cycle, electronmicroscope scanning
Citation: Wang Y, Ji H, Xie H, Jia Y, Zhao X, Jiang W and Liu Z (2025) Study on the evolution of macro and fine mechanical properties and the micro-mechanism of cement-stabilized steel slag and gravel base course. Front. Mater. 12:1696064. doi: 10.3389/fmats.2025.1696064
Received: 31 August 2025; Accepted: 19 September 2025;
Published: 30 September 2025.
Edited by:
Jue Li, Chongqing Jiaotong University, ChinaReviewed by:
Dongdong Yuan, Chang’an University, ChinaJie Gao, East China Jiaotong University, China
Copyright © 2025 Wang, Ji, Xie, Jia, Zhao, Jiang and Liu. This is an open-access article distributed under the terms of the Creative Commons Attribution License (CC BY). The use, distribution or reproduction in other forums is permitted, provided the original author(s) and the copyright owner(s) are credited and that the original publication in this journal is cited, in accordance with accepted academic practice. No use, distribution or reproduction is permitted which does not comply with these terms.
*Correspondence: Zunqing Liu, MTUwOTkxNzI2ODNAMTYzLmNvbQ==