 Kouchen Xiao
 Hongjian Zhang2
- 1Architectural and Civil Engineering, Jinken College of Technology, Nanjing, Jiangsu, China
- 2College of Civil Engineering and Architecture, Xinjiang University, Urumqi, Xinjiang, China
High-performance concrete (HPC) exhibits excellent comprehensive performance and is widely applied in tunnel engineering, large-span bridges, and special engineering projects. With the advancement of technology, HPC is moving towards green and sustainable development by incorporating industrial solid waste as a supplementary cementitious material. This study constructs machine learning models (individual and ensemble learners) to predict the compressive strength of HPC. The database employed in this study includes eight parameters (including cement, blast furnace slag, fly ash, water, superplasticizer, coarse aggregate, fine aggregate, age), with a total of 1,030 data samples. This study evaluates the performance of the constructed models using the coefficient of determination (R2), mean absolute error (MAE), and root mean square error (RMSE), and validates the models using k-fold cross-validation (k = 10). The results indicate that the Decision Tree (DT) model has the best predictive performance among individual learners, while the Harris Hawks Optimization-XGBoost (HHO-XGB) model has the best performance among ensemble learners. The ensemble learning further improves the predictive performance of individual learners: compared with the best individual learner (DT), R2 increases from 0.91 to 0.94 (Random Forest (RF)) and 0.95 (HHO-XGB); MAE decreases from 2.72 MPa to 2.69 MPa (RF) and 2.51 MPa (HHO-XGB); RMSE decreases from 5.01 MPa to 4.01 MPa (RF) and 3.57 MPa (HHO-XGB), respectively. In addition, the constructed models have been validated for robustness through k-fold cross-validation. The superior predictive accuracy of the HHO-XGB model can provide a more reliable basis for optimizing mix designs, thereby enhancing structural safety and reducing material cost overruns in critical applications like tunnel linings and marine structures.
1 Introduction
High-performance concrete (HPC) is the main engineering material in major engineering projects widely used in large-span bridges, important transportation engineering, underground engineering, and tunnel engineering, among other major projects (Rodriguez de Sensale et al., 2016; Dong et al., 2023; Li et al., 2023; Wang J. et al., 2024; Zhou et al., 2024). HPC is prepared by mixing cementitious materials, granular aggregates (or just aggregates), water, and, when required, admixtures, all in specific proportions. Cementitious materials are one of the important components of HPC. The commonly used cementitious material is Portland cement. The production of Portland cement consumes large amounts of energy and generates significant carbon dioxide emissions, and its carbon dioxide emissions account for 5%–7% of total anthropogenic emissions (Bajpayee et al., 2020; Biricik et al., 2021; Miller et al., 2021; International Energy Agency, 2023). At present, the annual output of Portland cement is 4 billion tons. Some scholars predict that the output of Portland cement will reach 6 billion tons by 2060 (Samimi et al., 2017). Because of the importance attached to climate change and environmental protection, all countries have formulated strict emission standards. In order to reduce the dependence on Portland cement in HPC and reduce the emission of harmful gases, alternatives to Portland cement should be actively explored to reduce energy consumption and pollution while ensuring engineering performance (Amin et al., 2019; Batista et al., 2019; Taji et al., 2019; Tang et al., 2019; Li et al., 2021; 2024; Wang et al., 2025). At present, industrial solid wastes such as fly ash and blast furnace slag, as well as supplementary cementitious materials such as lime, are commonly used to replace Portland cement, which also increases the reuse rate of industrial waste (Lothenbach et al., 2011; Juenger and Siddique, 2015; Kirgiz, 2015; Du et al., 2021; Sevim et al., 2021; Zhang et al., 2021; Nagaraju et al., 2023).
The compressive strength (CS) test of HPC is usually to cure the HPC sample prepared with a certain mix proportion for a period of time, and then test its CS. The test process is complex and time-consuming. To enhance the efficiency of experiments, many studies have developed predictive models as effective alternatives. Early research mainly relied on empirical and statistical methods. For example, Bhanja and Sengupta (2002) established a mathematical model of CS by performing statistical analysis based on intensity ratios from more than 300 tests. This method, while groundbreaking, often struggles to capture the complex nonlinearities and interactions between mixing ratios and intensities, especially when incorporating complex materials such as industrial solid waste. Mechanistic studies of HPC further validate the complex nature of these relationships. Studies have shown that the incorporation of industrial solid wastes such as fly ash and slag significantly alters the hydration kinetics and early properties of concrete (Li et al., 2020; Wu et al., 2021). These studies show that CS in HPC is influenced by a number of interdependent factors, making it difficult to predict using simple linear relationships or regression models.
To address this challenge, machine learning models have attracted the attention of many scholars due to their ability to learn complex nonlinear relationships from data. For example, Peng and Unluer (2022) successfully applied machine learning techniques to predict the mechanical properties of geopolymer HPC, while Farooq et al. (2021) found that ensemble models such as random forests can significantly reduce prediction errors. At the same time, recent studies have constantly optimized and enhanced these machine learning models. For example, Xie et al. (2025) proposed an enhanced Bayesian Gaussian process regression method and optimized the kernel function, resulting in excellent prediction performance. In summary, although traditional empirical models provide a foundation, they have certain limitations in dealing with complexity. The results of mechanistic research emphasize the necessity of using advanced model technologies. Although machine learning offers an effective solution, selecting and constructing the most suitable model remains an issue that requires attention. Therefore, this study aims to systematically construct and evaluate individual models and ensemble learning models to achieve accurate prediction of the CS of HPC containing industrial solid waste.
Therefore, this study focuses on predicting the compressive strength of high-performance industrial solid waste mixed concrete. Specifically, it constructs multiple machine learning models to achieve accurate prediction of CS, and further compares and selects suitable models to provide research references for similar prediction studies. This study aims to evaluate the predictive performance of individual learners (including Decision Tree (DT) model, Support Vector Machine (SVM) model, and Artificial Neural Network (ANN) model) and ensemble learners (including Random Forest (RF) model and Harris Hawks Optimization-XGBoost (HHO-XGB) model). Additionally, it assesses the predictive performance of tree-based models (DT model) and network-based models (SVM model and ANN model) among individual learners. Ultimately, the research results provide a new model reference for accurately predicting the compressive strength of high-performance concrete blended with industrial solid waste, while also offering a model selection approach for predictive research using machine learning methods.
2 HPC compressive strength database and performance evaluation
2.1 HPC compressive strength database
The CS data of HPC using industrial waste comes from the CS field of HPC in UC Irvine machine learning library (Lichman, 2013). The CS database of HPC comprises 1,030 data points, including CS, cement, fine aggregate, coarse aggregate, blast furnace slag, fly ash, water, superplasticizer, and HPC age. The quantitative statistical information of various parameters in the database is displayed in Table 1.
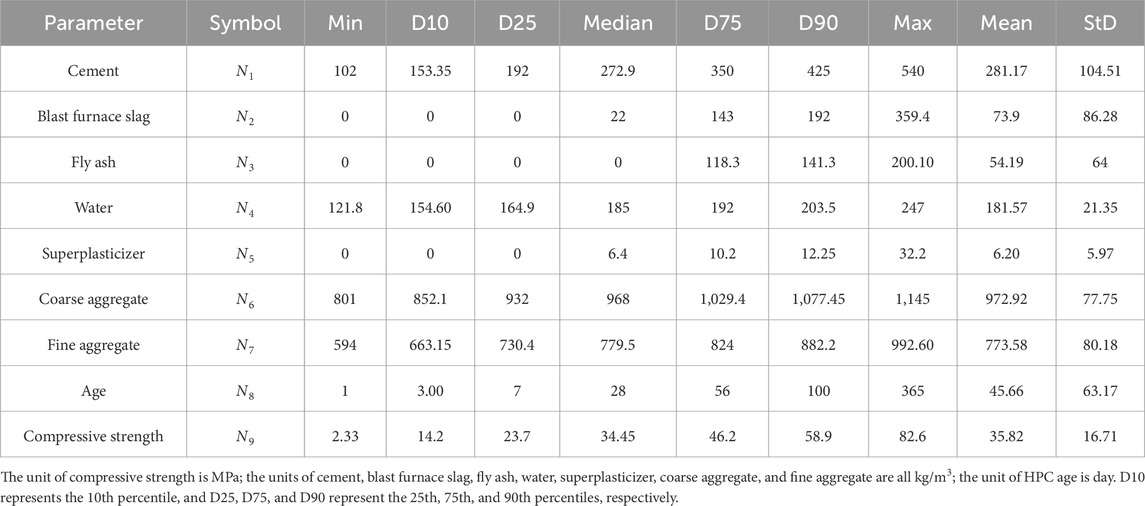
Table 1. Statistics of HPC parameters.
2.2 Performance evaluation of prediction model
To ensure the scientific rigor and practical value in engineering of the model presented in this research, the database adopted in this study is split into a training dataset and a testing dataset. Specifically, the training dataset is employed to develop the predictive model, while the testing dataset is used to verify its reliability. The training dataset contains 721 random data points, accounting for 70% of the total database, while the remaining 309 data points constitute the testing dataset. Additionally, this paper will employ the following statistical evaluation metrics to measure the model’s predictive performance, including the correlation coefficient (R2), mean absolute error (MAE), and root mean square error (RMSE) (Xie et al., 2025b; Wang et al., 2024b; Wang et al., 2025), with the relevant expressions being:
where ya is the measured value, yp is the predicted value,
To further confirm the generalization ability of the proposed model, k-fold cross-validation will be employed to assess the model’s performance. Although the above-mentioned random division of the dataset for model validation has enhanced the evidence for model reliability, the evaluation results will still be affected by the data division method, and the lack of randomness may affect the stability of the model’s evaluation. k-fold cross-validation can more thoroughly reflect the model’s performance across subsets with different data distributions by randomly splitting the dataset into k subsets of comparable size. Here, k-1 subsets function as the training set, while the remaining single subset works as the testing set; this approach can more comprehensively capture how the model performs on such varied data subsets, thereby being closer to the model’s actual performance in real-world scenarios. Kohavi’s (1995) study of cross-validation yielded reliable variance when using 10-fold for validation. Therefore, this study chooses 10-fold cross-validation, divides the training dataset into 10 subsets of consistent size, establishes a multivariate distribution model on 9 subsets each time, and uses the remaining subset for the verification of the model’s prediction performance, repeats 10 times, and finally uses the average value as the evaluation value of the model’s prediction performance.
3 Methodology
Currently, machine learning methods have been widely adopted in a range of scientific disciplines. Machine learning, based on data-driven characteristics, breaks through the shortcomings of traditional methods that rely on manually designed logic and simplified assumptions, and has strong adaptability and generalization ability. In the field of materials science, this technology is usually applied to predict and interpret the characteristics of materials. This study focuses on the prediction of CS of HPC mixed with industrial solid waste, and conducts research on it using various machine learning methods. Meanwhile, the machine learning methods used in this study include individual learners and ensemble learners. Individual learners include the DT model, the SVM model, and the ANN model, while ensemble learners include the RF model and the HHO-XGB model.
3.1 Decision tree model
The decision tree model simulates the logic of human step-by-step decision-making, breaking down complex problems into simple judgment problems one by one. The final analysis and solution process resembles an inverted tree, hence the model’s name. The DT model is a relatively intuitive model in machine learning methods, and its application is also quite extensive (Karbassi et al., 2014; Ahmad et al., 2022). The DT mainly consists of four basic structures: root node, internal node, branch, and leaf node. The root node is the input node, the internal nodes are connected to the branches, and the leaf nodes are the final output nodes. Therefore, based on the above explanation, the core goal of DT models—whether they are dealing with classification tasks or regression tasks—is to use specific functions between internal nodes to make the split sub-datasets have higher “purity”; that is, to make the data in the subsets belong to the same category or have more concentrated values as much as possible.
In this study, since no classification is required for the dataset when predicting the CS of HPC, this prediction task is defined as a regression task. In the context of predicting the CS of HPC, the model splits the dataset based on eight input variables. The model determines the optimal split point for each variable by optimizing a splitting criterion, which minimizes the error between the predicted values and the measured CS values. Finally, each sub-dataset is continuously split and partitioned until a tree capable of predicting the target variable is formed.
3.2 Support vector machine model
The support vector machine model is based on statistical learning theory. Cortes and Vapnik (1995) first proposed the concept of “support vector” and first used it in 1995. This model was originally employed to address linear classification problems; with the gradual deepening of research, it has been able to map low-dimensional nonlinear data into a high-dimensional space through the introduction of kernel functions, thus enabling the linear separability of data within this high-dimensional space. At the same time, with further improvements made by Vapnik et al. (1996), the support vector regression model—a regression-oriented branch of SVM—was proposed, which expanded the model’s application from solving classification problems to addressing regression problems. This study predicts the CS of HPC based on its mix proportion, and this prediction task belongs to regression. The process of using SVM model to solve regression tasks is as follows.
Firstly, for the SVM model, the core objective of addressing both classification and regression problems is to find hyperplanes. However, for regression problems, an insensitive loss function needs to be defined before that. The specific formula is as follows:
where ԑ is called error tolerance and it is the core parameter of the insensitive loss function.
The hyperplane optimization step is to fit as many sample data points as possible within the ɛ interval band; additionally, to avoid overfitting, it is necessary to keep the regression function as simple as possible to reduce model complexity. This dual objective is formulated by the following formula:
where n is the total number of samples, p is the weight vector, q is the bias term,
As the prediction of CA of HPC is a nonlinear problem, it is necessary to introduce a kernel function to transform the low-dimensional nonlinear relationship into a high-dimensional linear relationship. The kernel function is:
The above steps involve multiple variables and the solution is complex, so it can be transformed into a dual problem for solving:
Finally, by solving the dual problem, the strength prediction formula is derived as follows:
3.3 Artificial neural network model
The development of artificial neural network models is based on the study of information processing in the human brain, by simulating the collaborative cooperation between neurons in the human brain during information processing to construct models. The ANN model is primarily composed of the input layer, the hidden layer, and the output layer, with neurons linking these three layers. The overall framework of ANN models is relatively easy to understand. After the model is constructed, various problems can be solved via a simple “input-output” process. However, in the process of model construction, it is necessary to reasonably determine the number of hidden layers and neurons based on the complexity of the problem. It is worth noting that for the research on HPC in this study, a single hidden layer can effectively predict the CS (Orbanić and Fajdiga, 2003). In addition, activation functions are also key components of ANN models. Most real-world problems are nonlinear problems, and activation functions introduce nonlinear relationships by establishing connections between the input and output of neurons, thereby equipping ANN models with the ability to handle nonlinear problems (Nguyen et al., 2020). For this study, the Sigmoid function serves as the model’s activation function. Figure 1 illustrates a typical single-hidden-layer neural network structure, where X1, X2, … , Xk are input parameters and Y is the output parameter.
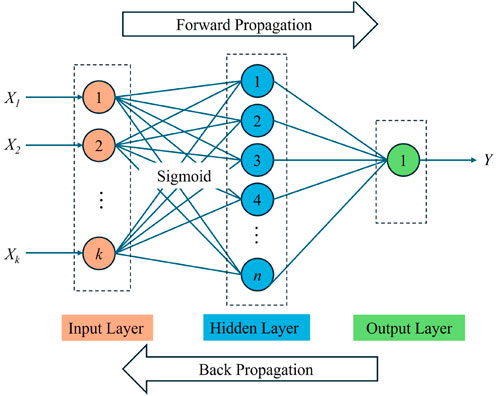
Figure 1. Single hidden layer of the ANN model.
This study uses the Bayesian regularization algorithm to construct the model during the ANN model training process. This method utilizes Bayes’ theorem to update weights and simultaneously estimates regularization parameters, which can effectively control the complexity of the neural network and reduce the risk of overfitting (MacKay, 1992; Dan Foresee and Hagan, 1997; Wang C. et al., 2024).
3.4 Random forest model
Random Forest stands as a frequently applied ensemble learning model within the field of machine learning, and its fundamental structure is composed of multiple decision trees. The RF model exhibits advantages such as stable performance and strong generalization ability, making it widely used in various classification and regression tasks; it has thus received extensive attention in the field of civil engineering materials (Han et al., 2019; Zhang et al., 2019). In the RF model, “forest” refers to the overall framework composed of multiple decision trees, while “random” is embodied in two aspects: random sampling and random selection of features (Farooq et al., 2021). According to the research in this paper, the model construction is divided into the following steps:
1. Each tree randomly samples two-thirds of the data from the original database with replacement for training—this subset is referred to as bagged data. The unselected out-of-bag data can be used for model evaluation.
2. When splitting each node of a tree, the algorithm randomly selects features from the original features for optimal node splitting. For regression tasks, one-third of the original features are generally selected as a random feature subset to achieve this optimal splitting (Breiman, 2001; Hastie et al., 2009).
3. Each tree grows independently based on the aforementioned random samples and random features until the leaf nodes reach a sufficiently high level of purity or the number of samples in a node is reduced to 1.
4. Finally, in the context of regression tasks, the ultimate prediction result is derived by taking the average of the predicted values from all individual trees.
3.5 XGBoost model combined with HHO algorithm
Extreme Gradient Boosting (XGBoost) also functions as an ensemble learning model built on the foundation of decision trees. Unlike the RF model, which is based on the Bagging framework, XGBoost is based on the Boosting framework (Chen and Guestrin, 2016; Bentéjac et al., 2021). The XGBoost model adopts an iterative approach to train weak learners and ultimately integrates them into a strong learner. The specific idea is as follows: the first tree in the model directly fits the true values of the samples; subsequently, the second tree fits the prediction error of the first tree, and each subsequent new tree fits the cumulative error of all previous trees to minimize the cumulative error. Finally, the prediction results of all trees are linearly weighted and summed to complete the prediction of the target parameters.
In addition, unlike random forests, which rely on tree diversity to control overfitting and usually do not constrain tree growth, XGBoost relies on parameters such as regularization parameters, learning rate, and tree structure parameters to control overfitting. Therefore, this study introduces the harris hawks optimization (HHO) algorithm to optimize the aforementioned parameters, further enhancing the performance of the XGBoost model.
The HHO algorithm is a metaheuristic algorithm that optimizes model parameters by simulating the hunting behavior of Harris hawk swarms. It involves two key phases:a global exploration stage and a local exploitation stage (Heidari et al., 2019). This algorithm can automatically search for the optimal parameter combination within a preset parameter range, thereby overcoming the drawbacks of traditional parameter tuning methods (Moayedi et al., 2021; Song et al., 2021). The detailed optimization process for the HHO algorithm is depicted in Figure 2.
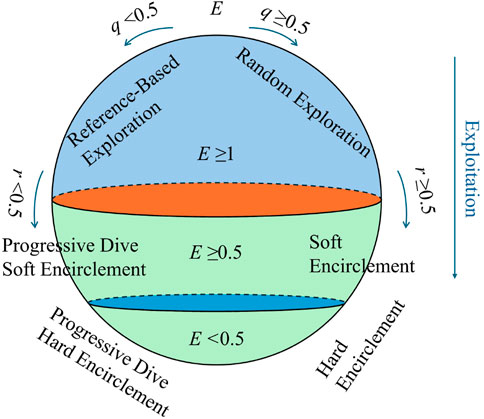
Figure 2. Flowchart of HHO algorithm parameter optimization.
4 Analysis of model results
Based on the analysis conducted on the dataset and the overview of the selected machine learning models in the prior chapters, this chapter will conduct a detailed analysis of the predictive performance of different learners with respect to the CS of HPC. This comprises a comparative analysis between measured and predicted CS values, an analysis of prediction errors from the models, and a k-fold cross-validation analysis performed on the models. Meanwhile, based on the results of the aforementioned analysis, this chapter will further compare the performance of different learners—specifically, performance comparisons between individual learners, between ensemble learners, and between individual learners and ensemble learners.
4.1 Analysis of model prediction results
This study uses individual learner-based models—including the DT model, SVM model, and ANN model—as well as ensemble learner-based models, namely, the RF model and HHO-XGB model, to predict the CS of HPC mixed with industrial waste. Among these steps, the 1,030 data points in the dataset were randomly divided into a training set (721 data points) and a testing set (309 data points). The constructed machine learning models can be evaluated using the R2, MAE, and RMSE. The evaluation of model performance using the testing dataset is presented in Table 2. Figure 2 presents the relationship between the predicted and measured values of different models; in addition, the models’ training results and testing results are also shown in Figure 2.
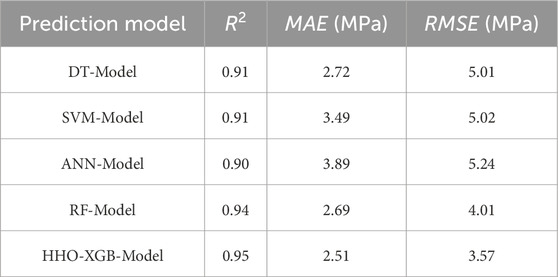
Table 2. Test of prediction model with testing data set.
From Figure 3, it can be seen that subplots (a), (b), and (c) correspond to the individual learners, while subplots (d) and (e) correspond to the ensemble learners. Among the individual learners, the DT model has better predictive performance, with an R2 of 0.93 for the training set and 0.91 for the testing set. According to Table 2, the DT model also has an MAE of 2.72 MPa and an RMSE of 5.01 MPa, indicating high prediction accuracy among individual learners. The performance of the SVM model is slightly lower than that of the DT model. However, among the individual learners, both models show a certain degree of decrease in R2 values after testing on the testing set. Although the ANN model has relatively weak predictive performance compared to the other two individual learners, the changes in its various indicators are negligible after validation on the testing set, which demonstrates a certain degree of robustness. In the ensemble learners, the HHO-XGB model exhibits superior predictive performance, with an R2 of 0.95 for both the training set and the testing set. Similarly, according to Table 2, the HHO-XGB model has an MAE of 2.51 MPa and an RMSE of 3.57 MPa, respectively. This model exhibits robustness and high prediction accuracy.
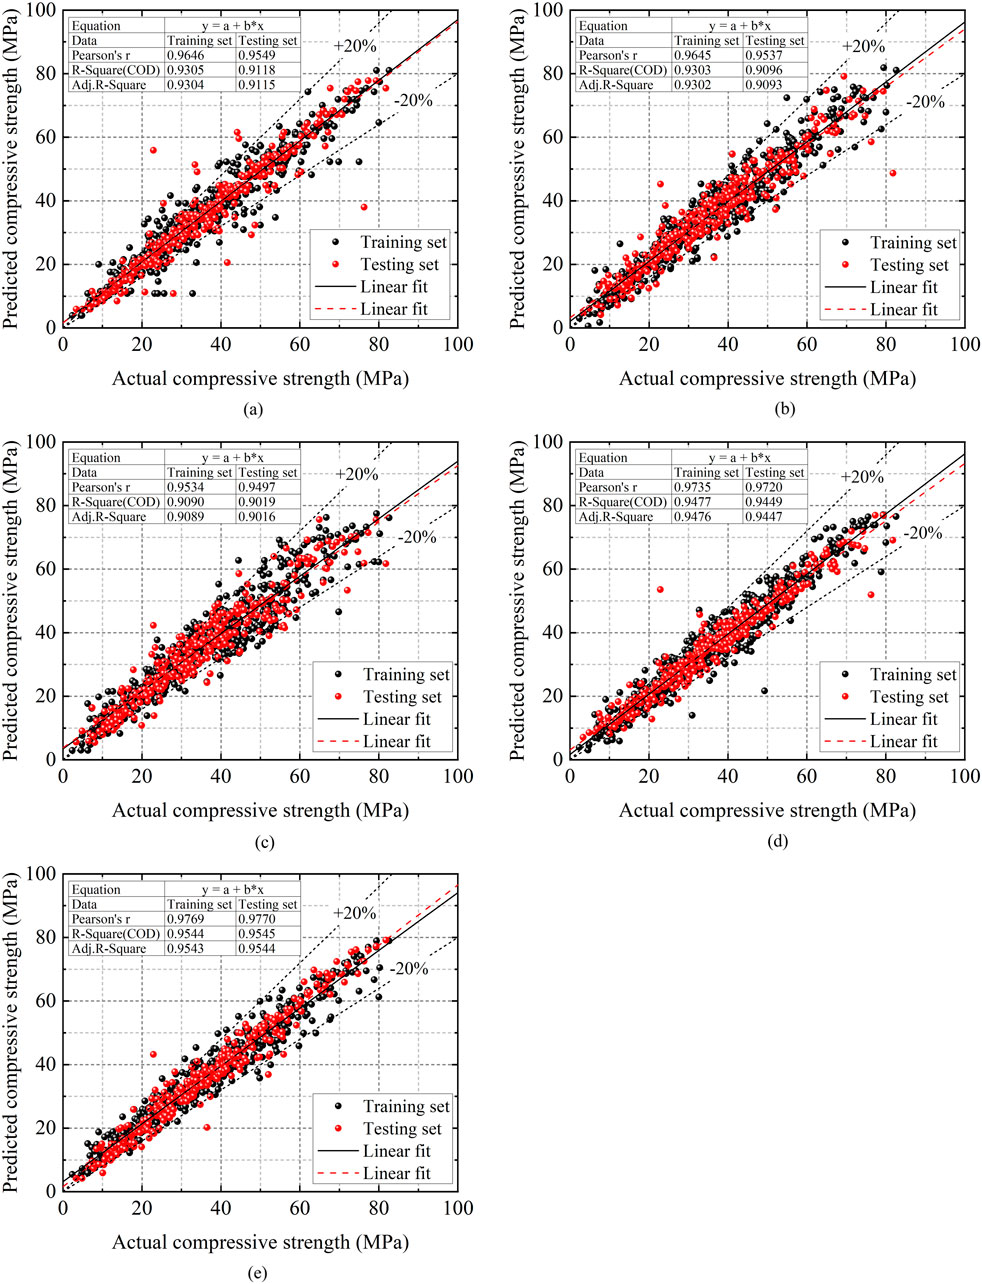
Figure 3. Comparison between predicted and actual values of machine learning models. (a) DT-Model. (b) SVM-Model. (c) ANN-Model. (d) RF-Model. (e) HHO-XGB-Model.
In addition, the prediction performance of ensemble learners based on decision trees—including the RF model and the HHO-XGB model—is superior to that of individual learners. Among these ensemble learners, compared to the best-performing individual learner, the R2 of the training set increases from 0.93 to 0.95 (for the RF model) and 0.95 (for the HHO-XGB model) respectively, while the R2 of the testing set increases from 0.91 to 0.94 (for the random forest model) and 0.95 (for the HHO-XGB model) respectively. The ensemble learners show a strong correlation between predicted and measured values in predicting the target parameter, indicating that the ensemble learning strategy effectively enhances predictive performance.
4.2 Analysis of model prediction error
The prediction error of each learning model was analyzed and validated using the testing set, and the error distribution plot is shown in Figure 4. Table 3 also presents the error distribution statistics of the testing set for different models.
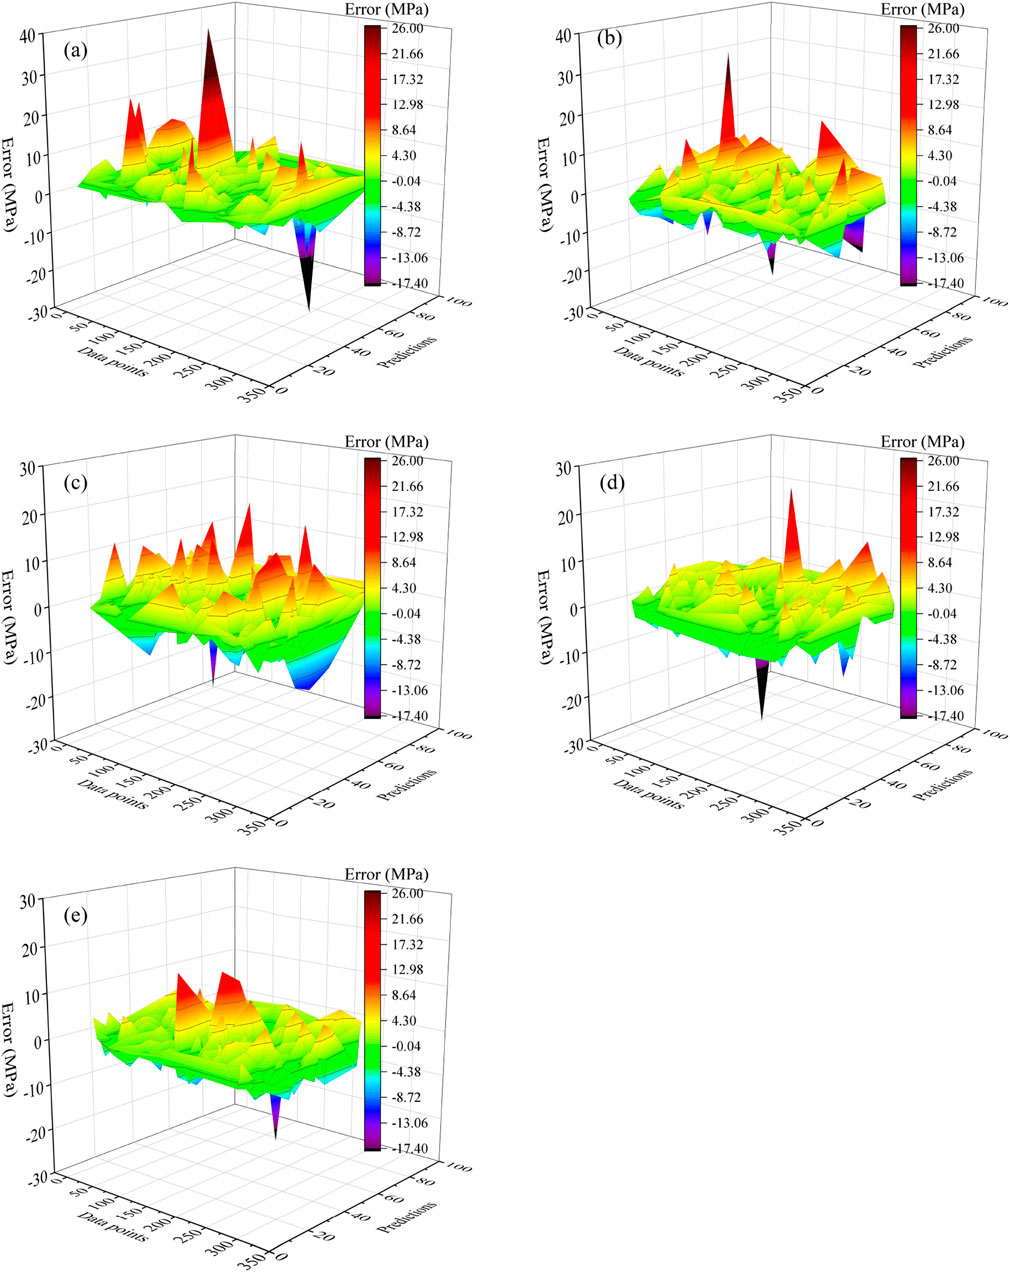
Figure 4. Error distribution of machine learning model. (a) DT-Model. (b) SVM-Model. (c) ANN-Model. (d) RF-Model. (e) HHO-XGB-Model.
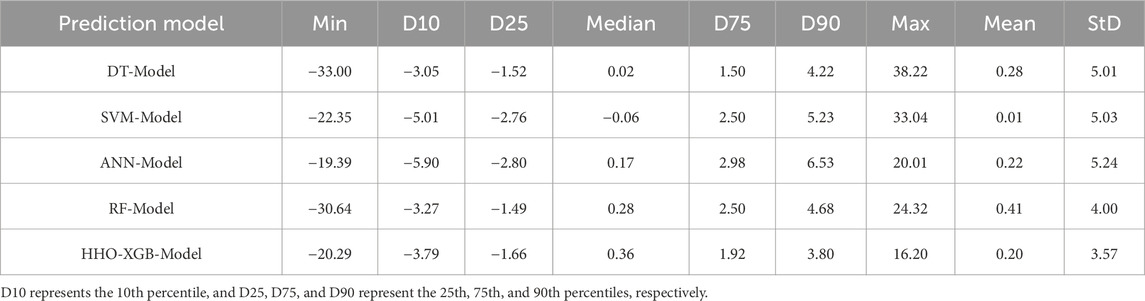
Table 3. Error statistics of prediction model testing data set (MPa).
From Table 3 and Figure 4, it can be seen that among the constructed individual learning models for predicting the CS of HPC, the DT model exhibits the largest prediction errors, with a maximum value of 38.22 MPa and a minimum value of −33.00 MPa. The standard deviation of errors for the SVM model is similar to that of the DT model: these two models show consistency in the degree of error dispersion during the prediction process, except that the DT model has larger values in terms of extreme errors. Among the individual learners used in this study, the ANN model shows a relatively narrow distribution of prediction errors, with a maximum prediction error of 20.01 MPa and a minimum of −19.39 MPa. However, the standard deviation of this model’s errors is 5.24 MPa, and the prediction error data is relatively scattered.
Compared with individual learners, the error distributions of ensemble learners are more stable. Although the RF model still contains a small number of extreme values, most of its error values are more concentrated than those of individual learners. Specifically, 50% of the error data of this model falls within the range of −1.49 MPa–2.50 MPa, with small data fluctuations. The HHO-XGB model further reduces error fluctuations and minimizes the occurrence of extreme error values. As shown in Figure 4e, the error distribution plot of this model has the smallest peak-to-valley amplitude, and the positive and negative errors exhibit gentle fluctuations without violent variations. Among the predictive models constructed in this paper, this model demonstrates excellent stability and prediction accuracy.
4.3 Cross validation analysis
To ensure the scientific rationality and engineering practicality of the models constructed in this study, it is necessary to evaluate their predictive accuracy. Furthermore, to maintain engineering practicality and simulate the randomness and complexity of actual engineering data, it is necessary to further test the models’ predictive performance by adjusting the division of the training dataset. At this stage, the 10-fold cross-validation method mentioned previously is employed. Specifically, the dataset is randomly split into 10 subsets, among which 9 subsets are employed to train the CS prediction model, and the remaining single subset is applied for the validation of the model and the calculation of statistical indicators. Subsequently, the above steps are repeated 10 times, and the average values of the statistical indicators are taken as the final validation results. Finally, the 10-fold cross-validation results of the prediction models are illustrated in Figure 5.
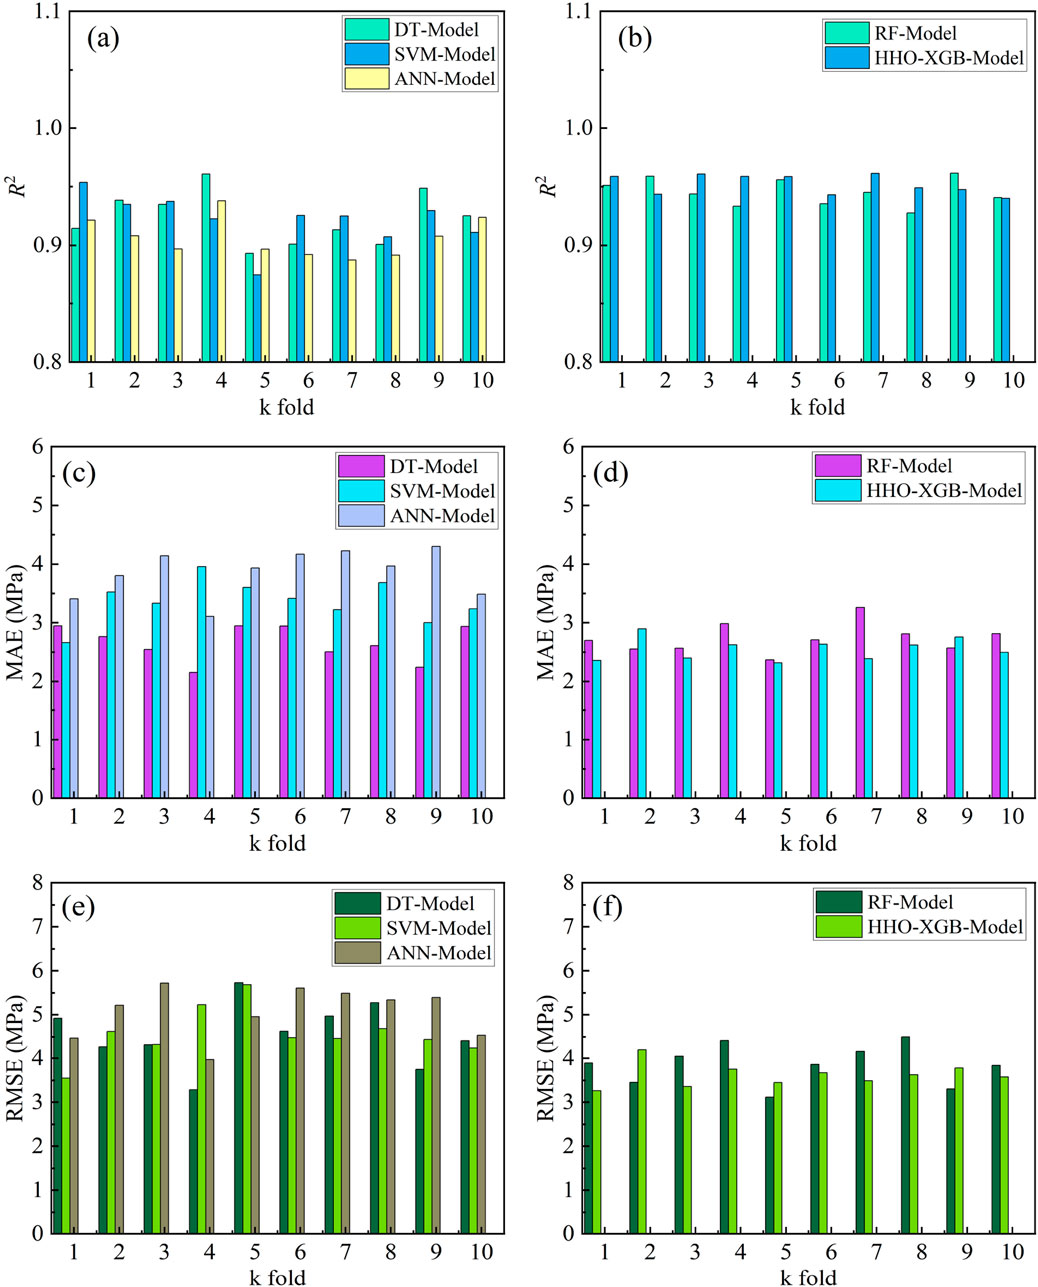
Figure 5. K-fold cross validation of prediction models of R2 (a,b), MAE (c,d) and RMSE (e,f).
When conducting 10-fold cross-validation, the indicators R2, MAE, and RMSE are used for evaluation. From Figure 5, it can be observed that all constructed models exhibit good performance: although the MAE and RMSE results of 10-fold cross-validation exhibit fluctuations, the prediction accuracy of the models remains relatively high. From Figures 5a,b, the maximum R2 value of the prediction models is 0.96, the minimum R2 value is 0.87, and their average R2 values are 0.92, 0.92, 0.91, 0.87, 0.95, and 0.95, respectively. From Figures 5c,d, the MAE of the prediction models ranges from 2.15 to 4.30 MPa, with their average MAE values being 2.66, 3.36, 3.85, 2.73, and 2.54 MPa, respectively. From Figures 5e,f, the RMSE of the prediction models ranges from 3.11 to 5.73 MPa, and their average RMSE values are 4.55, 4.57, 5.07, 3.86, and 3.62 MPa, respectively. Through 10-fold cross-validation analysis, it is found that the established models exhibit robustness, thus verifying the accuracy and effectiveness of the prediction models. It is worth noting that, consistent with the analysis results in the first two sections of this chapter, although the prediction models constructed in this study all exhibit good predictive performance, individual learners exhibit a certain degree of fluctuations when predicting the CS of HPC, while ensemble learners show a certain degree of stability. Among them, the HHO-XGB model has the highest prediction accuracy and excellent stability, performing well among all the constructed prediction models.
5 Discuss
As shown in Tables 2, 3, compared with the individual learners constructed in this study, the ensemble learners exhibit more accurate prediction results and more robust prediction performance. As shown in Figures 4, 5, by integrating multiple independent individual learning models, the ensemble learners effectively reduce the impact of random factors such as training data sampling bias and noise interference, thereby significantly enhancing the prediction performance of the models. Specifically, the DT model is one of the better-performing individual learners used in this study, and it still exhibits significant extreme prediction errors and considerable fluctuations during training and testing. In contrast, ensemble learners based on decision trees, including the RF model (adopting the Bagging strategy) and the HHO-XGB model (adopting the Boosting strategy), all optimize prediction errors and prediction stability to varying degrees. Compared to the DT model’s MAE (2.72 MPa) and RMSE (5.01 MPa), the MAE of the two ensemble learners is reduced to 2.69 MPa and 2.51 MPa, respectively, while their RMSE is reduced to 4.01 MPa and 3.57 MPa, respectively.
In summary, integrating the constructed individual learners through Bagging and Boosting methods effectively improves the predictive performance of the models. The HHO-XGB model, optimized by the HHO algorithm, exhibits better prediction accuracy and stability.
6 Conclusion
This study focuses on the CS of HPC mixed with industrial solid waste. By adopting machine learning methods, this study classifies the used machine learning models into individual learners and ensemble learners, which are applied to model and analyze the CS data of HPC. The following main conclusions are drawn:
1. The choice of algorithm fundamentally affects model performance. In individual learners, the DT model exhibits strong predictive capabilities, with the model’s R2 being 0.91, MAE being 2.72 MPa, and RMSE being 5.01 MPa. The SVM model and the ANN model show relatively lower performance. This hierarchy underscores that algorithm selection is crucial, even within the same category. Additionally, the success of the HHO-XGB model demonstrates that metaheuristic optimization can successfully fine-tune ensemble models, further enhancing model prediction accuracy and stability.
2. Compared with individual learners, ensemble learners adopting the Bagging and Boosting methods effectively improve prediction accuracy and stability. Specifically, compared to the best-performing individual learner (the DT model), its R2 increases from 0.91 to 0.94 (for the RF model) and 0.95 (for the HHO-XGB model), respectively; its MAE decreases from 2.72 MPa to 2.69 MPa (for the RF model) and 2.51 MPa (for the HHO-XGB model), respectively; and its RMSE decreases from 5.01 MPa to 4.01 MPa (for the RF model) and 3.57 MPa (for the HHO-XGB model), respectively.
3. The established prediction models were subjected to k-fold cross-validation, and these models exhibit good robustness and effectiveness. In the constructed model, the HHO-XGB model exhibits global optimal performance, which provides an effective data-driven solution for predicting the CS of HPC, contributing to more efficient and sustainable use of industrial solid waste and cost savings in construction projects such as tunnels and marine structures.
Data availability statement
Publicly available datasets were analyzed in this study. This data can be found here: Dataset Name: Concrete Compressive Strength, Direct URL: https://archive.ics.uci.edu/dataset/165/concrete+compressive+strength.
Author contributions
KX: Funding acquisition, Resources, Formal Analysis, Validation, Supervision, Writing – review and editing, Writing – original draft, Conceptualization. HZ: Visualization, Validation, Formal Analysis, Conceptualization, Methodology, Writing – original draft. SW: Investigation, Visualization, Conceptualization, Methodology, Validation, Writing – review and editing. CZ: Investigation, Visualization, Formal Analysis, Validation, Writing – review and editing. JH: Writing – review and editing, Resources, Visualization, Validation, Methodology, Conceptualization. SZ: Validation, Writing – review and editing, Conceptualization, Methodology, Visualization, Investigation. XY: Methodology, Validation, Writing – review and editing, Investigation, Formal Analysis.
Funding
The author(s) declare that financial support was received for the research and/or publication of this article. This paper was supported by Tianshan Talent Training Program (2023TSYCLJ0055), CSCEC Xinjiang Construction and Engineering Group Co., LTD. (Grant 65,000,022,859,700,210,197), and Jilin Provin cial Department of Science and Technology (YDZJ202401586ZYTS). Their financial support is gratefully acknowledged. Application research on foundation treatment technology for ultra deep oil drilling platforms in desert hinterland (CSCEC-2024-Q-75 Youth Project of China State Construction Engineering Corporation).
Conflict of interest
Authors XL and YL were employed by Xinjiang Institute of Architectural Sciences (Limited Liability Company). Author HL was employed by Yuexiu (China) Transport Infrastructure Investment Limited.
The remaining authors declare that the research was conducted in the absence of any commercial or financial relationships that could be construed as a potential conflict of interest.
The authors declare that this study received funding from China State Construction Engineering Corporation (CSCEC) and Xinjiang Construction and Engineering Group Co., Ltd. The funder had the following involvement in the study: Prediction of compressive strength of high-performance concrete based on multiple machine learning models.
Correction note
A correction has been made to this article. Details can be found at: 10.3389/fmats.2025.1721158.
Generative AI statement
The author(s) declare that no Generative AI was used in the creation of this manuscript.
Any alternative text (alt text) provided alongside figures in this article has been generated by Frontiers with the support of artificial intelligence and reasonable efforts have been made to ensure accuracy, including review by the authors wherever possible. If you identify any issues, please contact us.
Publisher’s note
All claims expressed in this article are solely those of the authors and do not necessarily represent those of their affiliated organizations, or those of the publisher, the editors and the reviewers. Any product that may be evaluated in this article, or claim that may be made by its manufacturer, is not guaranteed or endorsed by the publisher.
References
Ahmad, A., Ahmad, W., Aslam, F., and Joyklad, P. (2022). Compressive strength prediction of fly ash-based geopolymer concrete via advanced machine learning techniques. Case Stud. Constr. Mater. 16, e00840. doi:10.1016/j.cscm.2021.e00840
Amin, M. N., Hissan, S., Shahzada, K., Khan, K., and Bibi, T. (2019). Pozzolanic reactivity and the influence of rice husk ash on early-age autogenous shrinkage of concrete. Front. Mater. 6, 150. doi:10.3389/fmats.2019.00150
Bajpayee, A., Farahbakhsh, M., Zakira, U., Pandey, A., Ennab, L. A., Rybkowski, Z., et al. (2020). In situ resource utilization and reconfiguration of soils into construction materials for the additive manufacturing of buildings. Front. Mater. 7, 52. doi:10.3389/fmats.2020.00052
Batista, R. P., Trindade, A. C. C., Borges, P. H. R., and Silva, F. D. A. (2019). Silica fume as precursor in the development of sustainable and high-performance MK-Based alkali-activated materials reinforced with short PVA fibers. Front. Mater. 6, 77. doi:10.3389/fmats.2019.00077
Bentéjac, C., Csörgő, A., and Martínez-Muñoz, G. (2021). A comparative analysis of gradient boosting algorithms. Artif. Intell. Rev. 54, 1937–1967. doi:10.1007/s10462-020-09896-5
Bhanja, S., and Sengupta, B. (2002). Investigations on the compressive strength of silica fume concrete using statistical methods. Cem. Concr. Res. 32, 1391–1394. doi:10.1016/S0008-8846(02)00787-1
Biricik, H., Kırgız, M. S., Galdino, A. G. de S., Kenai, S., Mirza, J., Kinuthia, J., et al. (2021). Activation of slag through a combination of NaOH/NaS alkali for transforming it into geopolymer slag binder mortar – assessment the effects of two different blaine fines and three different curing conditions. J. Mater. Res. Technol. 14, 1569–1584. doi:10.1016/j.jmrt.2021.07.014
Chen, T., and Guestrin, C. (2016). “XGBoost: a scalable tree boosting system,” in Proceedings of the 22nd ACM SIGKDD international conference on knowledge discovery and data mining, (san francisco California USA: ACM), 785–794. doi:10.1145/2939672.2939785
Cortes, C., and Vapnik, V. (1995). Support-vector networks. Mach. Learn 20, 273–297. doi:10.1007/BF00994018
Dan Foresee, F., and Hagan, M. T. (1997). “Gauss-newton approximation to bayesian learning,” in Proceedings of international conference on neural networks (ICNN’97) (Houston, TX, USA: IEEE), 1930–1935. doi:10.1109/ICNN.1997.614194
Dong, L., Yao, A., Zhou, D., and Zhang, P. (2023). Characterizing the bending behavior of underground utility tunnel roofs in a fabricated composite shell system. Front. Mater. 10, 1201752. doi:10.3389/fmats.2023.1201752
Du, Y., Yang, W., Ge, Y., Wang, S., and Liu, P. (2021). Thermal conductivity of cement paste containing waste glass powder, metakaolin and limestone filler as supplementary cementitious material. J. Clean. Prod. 287, 125018. doi:10.1016/j.jclepro.2020.125018
Farooq, F., Ahmed, W., Akbar, A., Aslam, F., and Alyousef, R. (2021). Predictive modeling for sustainable high-performance concrete from industrial wastes: a comparison and optimization of models using ensemble learners. J. Clean. Prod. 292, 126032. doi:10.1016/j.jclepro.2021.126032
Han, Q., Gui, C., Xu, J., and Lacidogna, G. (2019). A generalized method to predict the compressive strength of high-performance concrete by improved random forest algorithm. Constr. Build. Mater. 226, 734–742. doi:10.1016/j.conbuildmat.2019.07.315
Hastie, T., Tibshirani, R., and Friedman, J. (2009). The elements of statistical learning. New York, NY: Springer New York. doi:10.1007/978-0-387-84858-7
Heidari, A. A., Mirjalili, S., Faris, H., Aljarah, I., Mafarja, M., and Chen, H. (2019). Harris hawks optimization: algorithm and applications. Future Gener. Comput. Syst. 97, 849–872. doi:10.1016/j.future.2019.02.028
International Energy Agency (2023). Cement. Paris, France: International Energy Agency. Available online at: https://www.iea.org/reports/cement-3.
Juenger, M. C. G., and Siddique, R. (2015). Recent advances in understanding the role of supplementary cementitious materials in concrete. Cem. Concr. Res. 78, 71–80. doi:10.1016/j.cemconres.2015.03.018
Karbassi, A., Mohebi, B., Rezaee, S., and Lestuzzi, P. (2014). Damage prediction for regular reinforced concrete buildings using the decision tree algorithm. Comput. and Struct. 130, 46–56. doi:10.1016/j.compstruc.2013.10.006
Kirgiz, M. S. (2015). Advance treatment by nanographite for Portland pulverised fly ash cement (the class F) systems. Compos. Part B Eng. 82, 59–71. doi:10.1016/j.compositesb.2015.08.003
Kohavi, R. (1995). “A study of cross-validation and bootstrap for accuracy estimation and model selection,” in International joint conference on artificial intelligence. Available online at: http://www.researchgate.net/publication/262566867_A_Study_of_Cross-Validation_and_Bootstrap_for_Accuracy_Estimation_and_Model_Selection (Accessed April 14, 2022).
Li, Y., Qiao, C., and Ni, W. (2020). Green concrete with ground granulated blast-furnace slag activated by desulfurization gypsum and electric arc furnace reducing slag. J. Clean. Prod. 269, 122212. doi:10.1016/j.jclepro.2020.122212
Li, J., Xu, D., Wang, X., Wang, K., and Wang, W. (2021). Synergetic–complementary use of industrial solid wastes to prepare high-performance rapid repair mortar. Front. Mater. 8, 792299. doi:10.3389/fmats.2021.792299
Li, B., Li, Y., Liu, X., Liu, X., Zhu, S., and Ke, L. (2023). Section optimization design of UHPC beam bridges based on improved particle swarm optimization. Front. Mater. 10, 1276118. doi:10.3389/fmats.2023.1276118
Li, X., Liu, C.-X., Zhao, X.-Y., and Kang, S.-B. (2024). Effect of recycled molybdenum tailings on mechanical properties of ultra-high-performance concrete. Front. Mater. 11, 1483446. doi:10.3389/fmats.2024.1483446
Lichman, M. (2013). UCI machine learning repository. UCI Mach. Learn. Repos. Available online at: http://archive.ics.uci.edu/ml.
Lothenbach, B., Scrivener, K., and Hooton, R. D. (2011). Supplementary cementitious materials. Cem. Concr. Res. 41, 1244–1256. doi:10.1016/j.cemconres.2010.12.001
MacKay, D. J. C. (1992). Bayesian interpolation. Neural Comput. 4, 415–447. doi:10.1162/neco.1992.4.3.415
Miller, S. A., Habert, G., Myers, R. J., and Harvey, J. T. (2021). Achieving net zero greenhouse gas emissions in the cement industry via value chain mitigation strategies. One Earth 4, 1398–1411. doi:10.1016/j.oneear.2021.09.011
Moayedi, H., Osouli, A., Nguyen, H., and Rashid, A. S. A. (2021). A novel harris hawks’ optimization and k-fold cross-validation predicting slope stability. Eng. Comput. 37, 369–379. doi:10.1007/s00366-019-00828-8
Nagaraju, T. V., Bahrami, A., Azab, M., and Naskar, S. (2023). Development of sustainable high performance geopolymer concrete and mortar using agricultural biomass—A strength performance and sustainability analysis. Front. Mater. 10, 1128095. doi:10.3389/fmats.2023.1128095
Nguyen, T.-A., Ly, H.-B., Jaafari, A., and Pham, T. B. (2020). Estimation of friction capacity of driven piles in clay using artificial neural network. TCCKHVTD 42. doi:10.15625/0866-7187/42/3/15182
Orbanić, P., and Fajdiga, M. (2003). A neural network approach to describing the fretting fatigue in aluminium-steel couplings. Int. J. Fatigue 25, 201–207. doi:10.1016/S0142-1123(02)00113-5
Rodriguez de Sensale, G., Rodriguez Viacava, I., and Aguado, A. (2016). Simple and rational methodology for the formulation of self-compacting concrete mixes. J. Mater. Civ. Eng. 28, 04015116. doi:10.1061/(ASCE)MT.1943-5533.0001375
Samimi, K., Kamali-Bernard, S., Akbar Maghsoudi, A., Maghsoudi, M., and Siad, H. (2017). Influence of pumice and zeolite on compressive strength, transport properties and resistance to chloride penetration of high strength self-compacting concretes. Constr. Build. Mater. 151, 292–311. doi:10.1016/j.conbuildmat.2017.06.071
Sevim, U. K., Bilgic, H. H., Cansiz, O. F., Ozturk, M., and Atis, C. D. (2021). Compressive strength prediction models for cementitious composites with fly ash using machine learning techniques. Constr. Build. Mater. 271, 121584. doi:10.1016/j.conbuildmat.2020.121584
Song, S., Wang, P., Heidari, A. A., Wang, M., Zhao, X., Chen, H., et al. (2021). Dimension decided harris hawks optimization with gaussian mutation: balance analysis and diversity patterns. Knowledge-Based Syst. 215, 106425. doi:10.1016/j.knosys.2020.106425
Taji, I., Ghorbani, S., de Brito, J., Tam, V. W. Y., Sharifi, S., Davoodi, A., et al. (2019). Application of statistical analysis to evaluate the corrosion resistance of steel rebars embedded in concrete with marble and granite waste dust. J. Clean. Prod. 210, 837–846. doi:10.1016/j.jclepro.2018.11.091
Tang, Z., Li, W., Ke, G., Zhou, J. L., and Tam, V. W. Y. (2019). Sulfate attack resistance of sustainable concrete incorporating various industrial solid wastes. J. Clean. Prod. 218, 810–822. doi:10.1016/j.jclepro.2019.01.337
Vapnik, V., Golowich, S., and Smola, A. (1996). “Support vector method for function approximation, regression estimation and signal processing,” in Advances in neural information processing systems, 281–287.
Wang, C., Wu, M., Cai, G., He, H., Zhao, Z., and Chang, J. (2024a). Prediction of soil thermal conductivity using individual and ensemble machine learning models. J. Therm. Anal. Calorim. 149, 5415–5432. doi:10.1007/s10973-024-13105-8
Wang, C., Yang, Y-L., Cai, G., and Zhang, T. (2024b). Improvement of normalized prediction model of soil thermal conductivity. International Communications in Heat and Mass Transfer157, 107792. doi:10.1016/j.icheatmasstransfer.2024.107792
Wang, C., Zhang, H., Xie, L., Jin, Z., Cai, G., Zhou, A., et al. (2025). Study on spatial distribution of soft soil parameters and settlement deformation law of extension foundation based on CPTU. Transportation Geotechnics 54, 101616. doi:10.1016/j.trgeo.2025.101616
Wang, J., Wang, T., Zhang, Y., and Qian, X. (2024b). Study on mechanical properties and self-sensing properties of sprayed high-performance concrete containing glass aggregate. Front. Mater. 10, 1320584. doi:10.3389/fmats.2023.1320584
Wang, H., Xu, F., Liu, Z., Zhong, S., Xing, E., Ye, Y., et al. (2025). Preparation and carbon emission analysis of high-performance pavement concrete using waste gypsums. Front. Mater. 12, 1539929. doi:10.3389/fmats.2025.1539929
Wu, M., Sui, S., Zhang, Y., Jia, Y., She, W., Liu, Z., et al. (2021). Analyzing the filler and activity effect of fly ash and slag on the early hydration of blended cement based on calorimetric test. Constr. Build. Mater. 276, 122201. doi:10.1016/j.conbuildmat.2020.122201
Xie, L., He, J., Wang, C., Zhu, S., Zhang, H., and Yang, X. (2025a). Enhanced bayesian gaussian process regression for compressive strength prediction of multi-binder concrete. J. Build. Eng. 111, 113308. doi:10.1016/j.jobe.2025.113308
Xie, L., Zhou, A., Wang, C., Xu, Y., Liu, J., Cai, G., et al. (2025b). Enhancing over-consolidation ratio interpretation in seismic piezocone testing using multivariate probability distribution models incorporating soil physical properties. Engineering Geology. 356, 108271. doi:10.1016/j.enggeo.2025.108271
Zhang, X., Lin, L., Bi, M., Sun, H., Chen, H., Li, Q., et al. (2021). Multi-objective optimization of nano-silica modified cement-based materials mixed with supplementary cementitious materials based on response surface method. Front. Mater. 8, 712551. doi:10.3389/fmats.2021.712551
Keywords: high-performance concrete, compressive strength, individual learner, ensemble learner, k-fold cross-validation
Citation: Xiao K, Zhang H, Wei S, Zhu C, He J, Zhu S and Yang X (2025) Prediction of compressive strength of high-performance concrete based on multiple machine learning models. Front. Mater. 12:1698248. doi: 10.3389/fmats.2025.1698248
Received: 03 September 2025; Accepted: 15 September 2025;
Published: 08 October 2025; Corrected: 20 October 2025.
Edited by:
Jue Li, Chongqing Jiaotong University, ChinaReviewed by:
Wensheng Wang, Jilin University, ChinaQinglin Guo, Hebei University of Engineering, China
Copyright © 2025 Xiao, Zhang, Wei, Zhu, He, Zhu and Yang. This is an open-access article distributed under the terms of the Creative Commons Attribution License (CC BY). The use, distribution or reproduction in other forums is permitted, provided the original author(s) and the copyright owner(s) are credited and that the original publication in this journal is cited, in accordance with accepted academic practice. No use, distribution or reproduction is permitted which does not comply with these terms.
*Correspondence: Kouchen Xiao, eGlhb2tvdWNoZW5famtjdEAxNjMuY29t