 Sheng-Ao Jia
 Qi Fan1
 Pan Chen
- 1State Key Laboratory of Offshore Natural Gas Hydrate, Research Institute of CNOOC, Beijing, China
- 2Department of Civil Engineering, Shanghai University, Shanghai, China
- 3State Key Laboratory of Geomechanics and Geotechnical Engineering Safety, Institute of Rock and Soil Mechanics, Chinese Academy of Sciences, Wuhan, Hubei, China
- 4School of Engineering Science, University of Chinese Academy of Sciences, Beijing, China
This study employs nuclear magnetic resonance and acoustic testing methods to investigate the evolutions in unfrozen water content and shear wave velocity of silty soils, both with and without chloride salt contamination, under freeze–thaw cycles. The effects of saline solution and freezing–thawing processes on the soil-water state and acoustic properties were systematically assessed. The results indicate that the addition of sodium chloride lowers the soil freezing temperature from roughly −1.6 °C to −4 °C, causing an undercooling depression of approximately 2.4 °C. This causes a significant delay in the phase transition of pore water. In the case of salt-free silty soil, the unfrozen water content dramatically decreases from 27.2% to 1.7% at the freezing point, exhibiting pronounced hysteresis during the thawing processes. On the other hand, the reduction of unfrozen water content in chloride salt–contaminated soil is more gradual, resulting in less pronounced hysteresis effects. Freezing-thawing cycles induce a reorganization of the pore structure, evidenced by a reduced micropore fraction and an increased macropore fraction. These alterations are more pronounced in salt-free soils. The shear wave velocity increases as the temperature drops during freezing and rises during thawing. Notably, the wave velocity reaches approximately 2,220 m/s for salt-free soil and 1944 m/s for salt-contaminated soil at −10 °C. When subjected to identical temperature conditions, the shear wave velocities in salt-contaminated soils are 200–300 m/s lower than those in salt-free soils. Variations in frequency between 10 and 30 kHz yield a difference of less than 3%. These findings provide valuable insights for understanding the freeze-thaw mechanisms in saline soils and hold significant implications for geotechnical engineering in cold regions.
1 Introduction
In cold regions and seasonally frozen ground areas, soils are subjected to freezing-thawing cycles that significantly alter their microstructure, moisture state, and mechanical properties, thereby influencing foundation stability, road durability, and the safety of underground engineering works (Li et al., 2019; Liu et al., 2019; Sheng et al., 2014). During freezing, pore water gradually transforms into ice, accompanied by volumetric expansion (Zhou et al., 2014), pore structure reorganization, and changes in mechanical behavior (Chamberlain and Gow, 1979; Watanabe and Mizoguchi, 2002). In this process, unfrozen water content plays a pivotal role in governing soil behavior (Zou et al., 2023; Wang et al., 2024; Wu et al., 2025). Unfrozen water refers to the portion of water that remains in the liquid state even below 0 °C due to surface adsorption (Shi et al., 2022), capillary forces, and the presence of solutes (Bing and Ma, 2011; Zhou et al., 2020; Zhou and Wei, 2020). This unfrozen water critically affects heat and mass transfer as well as the mechanical performance of frozen soils (Wu et al., 2023; Zhang et al., 2021). With the intensification of infrastructure development in cold regions and the increasing impacts of climate change, understanding the coupled evolution of soil water states and mechanical characteristics under freezing-thawing cycles has become a central topic in permafrost geotechnics and frozen soil science.
The soil freezing characteristic curve (SFCC) describes the relationship between unfrozen water content and temperature under freezing-thawing paths (Devoie et al., 2022; Ma et al., 2017; Zhou et al., 2020; Zhong et al., 2025). Accurate determination of unfrozen water content is therefore fundamental to evaluate soil freezing behavior. Several experimental techniques have been employed, including nuclear magnetic resonance (NMR) (Teng et al., 2020; Tian et al., 2018; Tian et al., 2014), time domain reflectometry (TDR) (Azmatch et al., 2012; Mu et al., 2019), and electrical resistivity methods (Liu and Si, 2011). While TDR and resistivity methods have provided valuable laboratory insights, their performance is constrained in practice due to sensitivity to soil type, salinity, heterogeneity, and temperature variations (Tao et al., 2023). By contrast, NMR enables nondestructive and in situ measurements, allowing both accurate quantification of unfrozen water and characterization of its distribution across different pore-size domains. This has made NMR a widely adopted approach in unfrozen water research (An et al., 2024; Teng et al., 2024; Tian et al., 2014). Nevertheless, although existing methods can capture unfrozen water evolution during freezing-thawing processes, they are limited in simultaneously reflecting the macroscopic structural and mechanical responses of soils.
Acoustic testing, as a nondestructive and rapid technique highly sensitive to the water–ice phase transition, offers new perspectives for studying freezing-thawing effects (Zhang et al., 2018; Li et al., 2023). Acoustic parameters, particularly shear wave velocity, are direct indicators of small-strain stiffness and the evolution of soil skeletal structure (Kurfurst, 1976; Zhang et al., 2021). Previous studies have shown that ice formation during freezing enhances particle bonding, thereby increasing shear wave velocity, whereas the presence of unfrozen water films weakens the soil skeleton and promotes energy dissipation, resulting in velocity reduction or attenuation enhancement (Li et al., 2016; Nakano et al., 1972). Acoustic properties are thus not only sensitive to water–ice phase states but also indirectly characterize soil structure and mechanical behavior (Christ and Park, 2009; Zhang et al. 2020). However, most studies have primarily focused on the influence of temperature on unfrozen water content or on the variation of acoustic velocity with freezing conditions, while systematic quantitative investigations into the coupling between unfrozen water evolution and acoustic response remain scarce. Moreover, salinity exerts a pronounced regulatory effect on freezing: solutes lower the freezing point and markedly enhance unfrozen water retention (Xu et al., 2017; Zhou et al., 2020). Yet, the effects of salinity on the acoustic response of soils during freezing-thawing cycles have received limited attention.
In this context, the present study systematically investigates a representative seasonal frozen soil. Nuclear magnetic resonance is employed to quantify unfrozen water content across multiple temperature stages, while acoustic methods are used to characterize stiffness and skeletal evolution. Furthermore, salinity is incorporated as a factor to analyze its role in unfrozen water retention and acoustic behavior. This integrated approach not only deepens the understanding of the coupled mechanisms linking micro-scale water states and macro-scale mechanical responses under freezing-thawing conditions but also provides theoretical insights and experimental evidence for evaluating foundation stability and predicting frost-related hazards in cold-region engineering.
2 Materials and methods
2.1 Material
The soil investigated in this study is a representative material from seasonally frozen regions, referred to as Zhengzhou silt. Chloride salts are among the most common types of salts found in saline soils (Xu et al., 2017; Watanabe and Mizoguchi, 2002). Considering the variability of ion concentrations in natural soils, a commonly adopted concentration of 0.5 mol/L was selected in this study based on previous literature (Bing and Ma, 2011; Teng et al., 2024). The specific gravity and Atterberg limits of the soil were determined following ASTM D854-23 (2023) and ASTM D4318-17e1 (2018), as summarized in Table 1. The grain size distribution curve was obtained in accordance with ASTM D7928-21e1 (2021) and is presented in Figure 1. Based on the Unified Soil Classification System (USCS) defined in ASTM D2487-17e1 (2018), the soil is classified as ML–CL.

Table 1. Physical properties of silt.
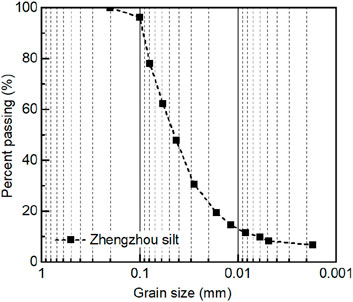
Figure 1. The grain-size distributions of Zhengzhou silt.
2.2 Test equipment
In this study, the unfrozen water content of soil samples at different temperatures was measured using a nuclear magnetic resonance (NMR) system, as shown in Figure 2. NMR detects the magnetic response of atomic nuclei with spin when exposed to a static magnetic field and a radio-frequency (RF) pulse. After the RF field is removed, the nuclei return to equilibrium through a relaxation process, which includes longitudinal and transverse relaxation. The transverse relaxation is particularly used to characterize the distribution and quantity of water in soils. During transverse relaxation, the NMR instrument records a free induction decay (FID) curve. The first point of the FID corresponds to the signal peak, which is proportional to the liquid water content, forming the basis for determining unfrozen water content. According to the Curie law, signal intensity decreases with increasing temperature; therefore, temperature calibration was performed as described in Section 2.3.1.
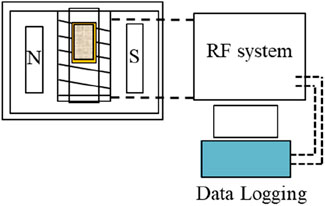
Figure 2. Schematic illustration of the NMR setup.
The NMR instrument (PQ-001 model) was equipped with a 0.5 T permanent magnet, and the system temperature was maintained at 32 °C ± 0.1 °C. The sample tube had an effective volume of the diameter d = 60 mm and height h = 60 mm, and the Carr–Purcell–Meiboom–Gill (CPMG) pulse sequence was used to obtain the T2 distribution curve. The peak area of the T2 spectrum represents the unfrozen water content within a specific pore size range, as T2 is positively correlated with the pore radius (Tian et al., 2018).
Under freeze–thaw conditions, the acoustic properties of the soil were measured using a temperature-controlled acoustic testing system, shown in Figure 3. Form Figure 3, the system consisted of a waveform generator, filter, oscilloscope, acoustic probes, and probe holders. During testing, the waveform generator emitted pulsed electrical signals that were converted into acoustic waves by the transmitting probe and received as electrical signals by the receiving probe. After filtering, the signals were displayed on the oscilloscope, and the shear wave velocity was determined using the first-arrival method (Christ and Park, 2009; Li et al., 2023).
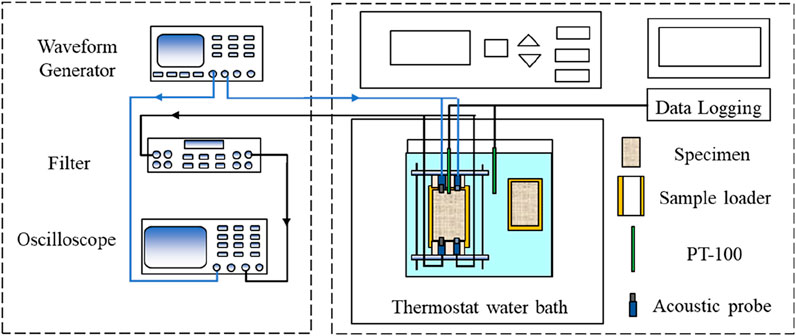
Figure 3. Schematic illustration of the experimental setup.
The waveform generator was Keysight 33500B, capable of producing various waveform types with a sampling rate of 250 MSa/s. The oscilloscope used was Keysight DSOX3024T, offering a bandwidth of 200 MHz and a sampling rate of 5 GSa/s. The filter was Krohn-Hite Model 3,944, with a frequency range of 3 Hz to 2 MHz, adjustable gain, and selectable high-pass and low-pass modes. Sinusoidal shear waves with an amplitude of 10 V and excitation frequencies of 10, 20, and 30 kHz were used, while the filter was set to a high-pass of 1 kHz and a low-pass of 300 kHz. Sample temperature was controlled by a thermostatic water bath, with a temperature range of −20 °C to 100 °C and a control precision of ±05 °C. To monitor the temporal evolution of temperature inside both the water bath and the soil specimens, PT100 temperature sensors were installed in the acoustic device and water bath system, enabling continuous measurement of internal sample temperatures.
2.3 Testing procedure
The experimental program included acoustic testing and unfrozen water content measurements under freeze–thaw conditions. Before the tests, the equipment calibration was done to ensure the reliability of the results, seen in Figure 4. The overall procedure for measure the acoustic behavior unfrozen water content is further shown in Figure 5. The detailed testing process is explained as follows.
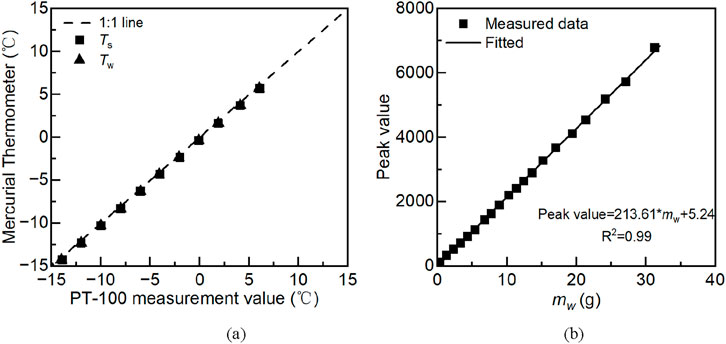
Figure 4. The calibration curves for the measurement: (a) Temperature calibration curve; (b) The relationship between mass of water and peak value.
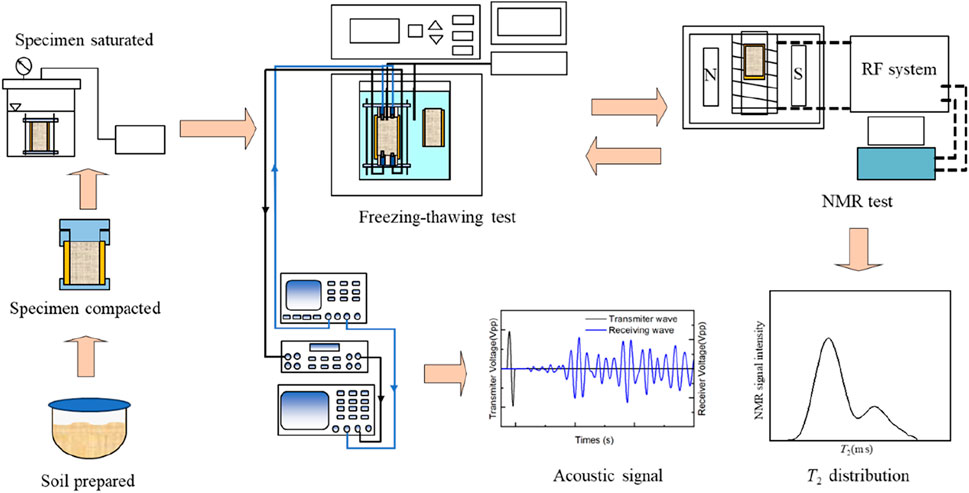
Figure 5. Flowchart of the testing procedure.
2.3.1 Equipment calibration
The PT-100 temperature sensor was calibrated using two mercury thermometers in a constant-temperature water bath: one monitored the bath temperature (Tw) and the other measured the sample temperature (Ts). Corrections were applied based on the mercury readings, and the results confirmed that the PT-100 sensor provided stable, accurate, and reliable temperature measurements. The NMR device was calibrated by testing soil–water mixtures with different water contents to obtain FID peaks and determine the signal intensity per unit water mass, followed by measurements at different temperatures to evaluate temperature-dependent signal variation. Both fittings, shown in Figures 4a,b, exhibited strong linear relationships, confirming the reliability of the instrument. For the acoustic probe, the intrinsic travel time was determined as 0.0234 ms. Using a 50 mm 1,060 aluminum block, the measured shear-wave velocity (3,260 m/s) was consistent with the reference value (3,100 m/s), validating the probe accuracy (Royer and Valier-Brasier, 2022).
2.3.2 Specimen preparation
The static compaction saturation method was adopted. First, soil samples were prepared with an initial water content of 10%. Non-saline specimens were prepared with deionized water, while saline specimens were prepared with a sodium chloride solution of 0.5 mol/L. The prepared samples were sealed and stored for more than 24 h to ensure uniform moisture distribution. The specimens were then compacted by static pressure to a dry density of 1.6 g/cm3. The specimen dimensions were d = 45 mm and h = 20 mm for unfrozen water content testing and d = 50 mm and h = 60 mm for acoustic testing, respectively. Finally, vacuum saturation was applied to saturate the specimens, seen in Figure 5.
2.3.3 Temperature path
The initial testing temperature was 5 °C, which was gradually decreased to −10 °C and then increased back to 5 °C. Given that the phase transition of pore water in soil induces a pronounced variation in unfrozen water content, a temperature interval of approximately 0.5 °C was applied prior to the onset of phase change to accurately capture the environmental temperature corresponding to the transition. After the completion of the phase change, the cooling gradient was gradually increased with a larger temperature interval of 1 °C–2 °C until the target temperature of −10 °C was reached. During the subsequent warming phase, the temperature schedule was maintained identical to that of the cooling path to ensure a direct comparison of soil properties at equivalent temperatures. Unfrozen water content tests and acoustic tests were carried out simultaneously. Before testing, both NMR and acoustic specimens were placed in the same thermostatic water bath, which was adjusted to 5 °C. To ensure data reliability, thermal equilibrium was defined as when the specimen temperature matched the bath temperature and remained stable for more than 4 h. At each temperature stage, unfrozen water content and acoustic tests were conducted after equilibrium was reached. The temperature was then adjusted to the next stage, and testing continued until a complete freeze–thaw cycle was achieved.
2.3.4 Unfrozen water content test
The saturated NMR specimens were placed into transparent polyethylene waterproof bags and then immersed in the thermostatic water bath, which was adjusted to the target temperature. After thermal equilibrium, the specimen was transferred into the NMR device. Using the CPMG pulse sequence, the water distribution spectrum (T2 spectrum) and echo amplitude curves were obtained, and the unfrozen water content was calculated. The detailed calculation procedure is described in Section 2.4.
2.3.5 Acoustic test
The fully saturated specimen was placed in the acoustic testing system and fixed with bolts. The specimen was then immersed in the thermostatic water bath, and after the specimen temperature matched the bath temperature, acoustic testing was carried out. The wave velocity was determined from the first arrival time, as described in Section 2.4.
2.4 Data processing methods
2.4.1 Determination of unfrozen water content
The NMR method can accurately capture the water molecules in soil and allows for continuous testing without damaging the specimen. In NMR measurements, soil water content is determined either from the area under the T2 distribution peaks or from the first point of the free induction decay (FID) curve. Meanwhile, according to Curie’s law, the NMR signal of unfrozen water per unit mass increases linearly as temperature decreases. Based on this principle, Tian et al. (2014) measured NMR signals of specimens at different temperatures prior to freezing. By analyzing the variation of the FID peak values with temperature, they determined the signal intensity corresponding to a unit unfrozen water content, and subsequently obtained corrected values of unfrozen water content at different temperatures.
2.4.2 Determination of shear wave velocity
Shear wave tests were conducted on the specimens, and wave velocity was determined using the first-break method. The measurement of shear wave velocity required three parameters: system delay time of the acoustic probe, effective length, and first arrival time. The system delay time was obtained by directly coupling the transmitting and receiving probes and recording the acoustic signal. The effective length was calculated as the specimen height minus the probe dimension. The first arrival time was identified using the first-break method.
3 Test result analysis
3.1 Freezing temperature
Figure 6 presents the variations of soil temperature (Ts) and bath temperature (Tw) with time during the freeze–thaw path for both non-saline and saline silt specimens. Figure 6a shows the results for the non-saline silt, where supercooling occurred when the bath temperature was gradually reduced to −1.6 °C, after which most of the liquid pore water in the soil transformed into ice. Figure 6b illustrates the results for saline silt with a NaCl concentration of 0.5 mol/L. In this case, supercooling occurred when the temperature decreased to −4 °C, with the supercooling temperature measured at −2.9 °C. These results indicate that the presence of solutes lowers the freezing temperature of the soil, implying that saline soils in cold regions are more resistant to freezing and may exhibit delayed phase transition compared with non-saline soils.
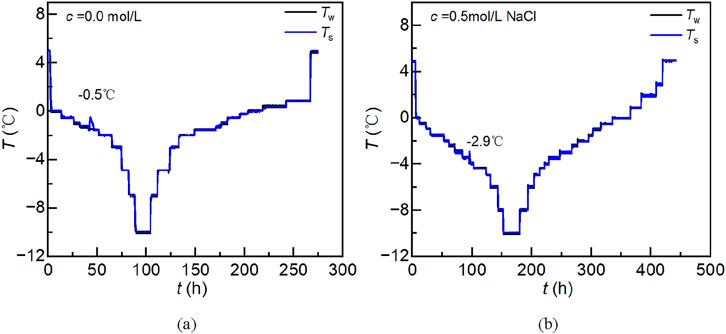
Figure 6. Temperature variation curves of environment and sample during freezing–thawing cycles: (a) c = 0.0 mol/L; (b) c = 0.5 mol/L NaCl.
3.2 Unfrozen water content and water distribution in frozen soil
Figure 7 shows the results of unfrozen water content and water distribution in the non-saline silt during the freezing-thawing path. Figures 7a,c present the freezing path results. At 5 °C, the water distribution ranged from 01 to 100 ms and exhibited a bimodal pattern, with an unfrozen water content of 27.2%. As the temperature decreased to −1.3 °C, no significant change in the water distribution was observed and the unfrozen water content remained nearly constant, indicating that no phase transition occurred in the pore water during this stage. When the temperature dropped to −1.6 °C, most of the pore water froze into ice, the water distribution narrowed to 01–1 ms, and the unfrozen water content decreased sharply to 1.7%. With further temperature reduction, the signal amplitude gradually decreased and the unfrozen water content continued to decline, while the distribution range remained nearly unchanged. This indicates that the remaining unfrozen water was primarily in the form of adsorbed water films on soil particles, where decreasing temperature reduced the film thickness without altering its distribution range.
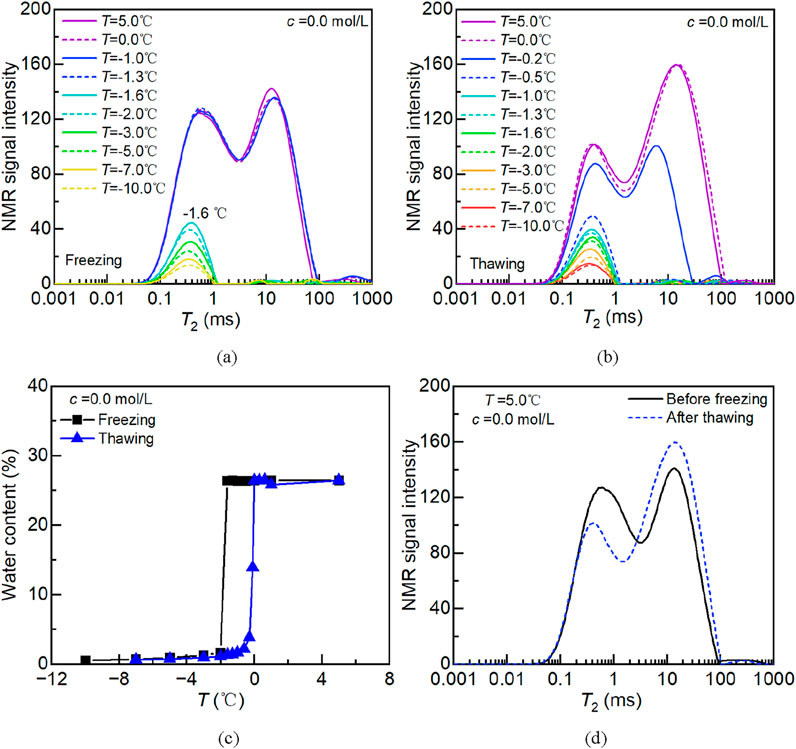
Figure 7. The water distribution of silt under freezing and thawing path-c = 0 mol/L: (a) T2 distribution of Freezing path; (b) T2 distribution of Thawing path; (c) Unfrozen water under freezing and thawing path; (d) T2 distribution before freezing and after thawing.
Figure 7b presents the melting path results. During warming, the signal amplitude gradually increased and the unfrozen water content rose as ice began to melt, while the water distribution range exhibited little variation. From −10 °C to −1.3 °C, no significant ice melting was observed, whereas at −1.3 °C during freezing, pore water remained unfrozen. This reveals a hysteresis effect in unfrozen water content between the freezing and melting paths, as is also clearly illustrated in Figure 7c. When the temperature increased to −0.2 °C, most of the ice melted into liquid water, and the unfrozen water content rose to 10.3%. At 0 °C, all the ice within the soil was fully transformed into liquid water. Figure 7d shows the water distribution after one complete freeze–thaw cycle. Compared with the initial state, a distinct shift in water distribution was observed. This change can be attributed to pore structure alteration induced by ice formation and expansion, where part of the smaller pores was converted into larger pores during the freezing process.
Figure 8 shows the results of unfrozen water content and water distribution in saline silt during the freeze–thaw path. Figures 8a,c present the freezing path results. At 5 °C, the water distribution ranged from 01 to 90 ms and exhibited a bimodal pattern, with an unfrozen water content of 26.6%. As the temperature decreased to −3 °C, a slight migration of pore water from smaller to larger pores was observed, although the total unfrozen water content remained unchanged. When the temperature further decreased to −4 °C, most of the pore water froze into ice, the distribution range narrowed to 01–30 ms, and the pattern remained bimodal, with unfrozen water content reduced to 11%. With progressive cooling, the signal amplitude gradually decreased, the bimodal feature weakened, and the unfrozen water content continued to decline. At −10 °C, the distribution became nearly unimodal, and the unfrozen water content dropped to 2.7%. A comparison of Figures 7c, 8c demonstrates that due to the presence of salt, the freezing temperature of pore water was depressed, and the unfrozen water content at the same temperature was higher in saline silt than in non-saline silt.
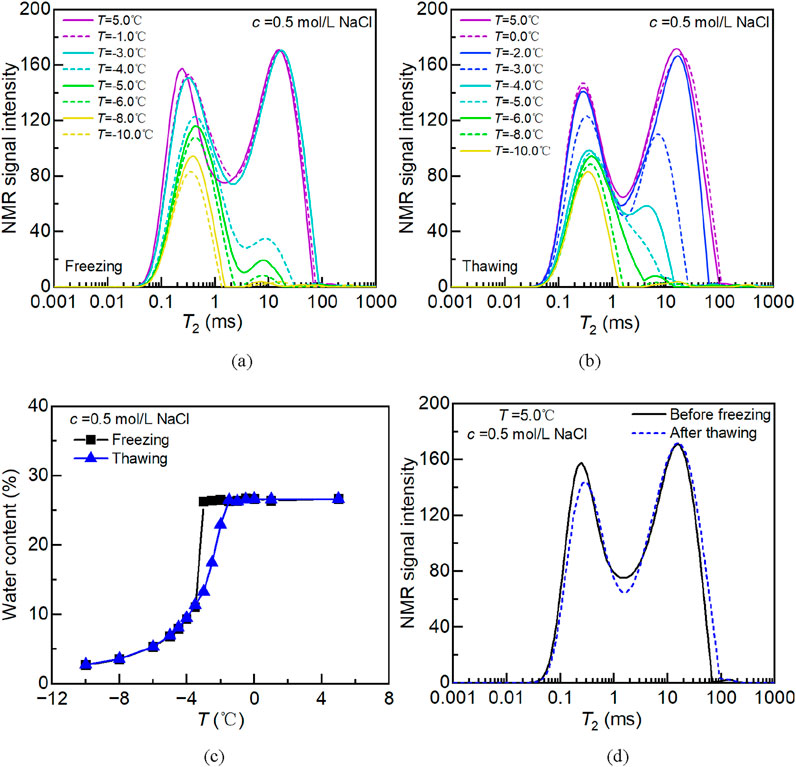
Figure 8. The water distribution of silt under freezing and thawing path-c = 0.5 mol/L NaCl: (a) T2 distribution of Freezing path; (b) T2 distribution of Thawing path; (c) Unfrozen water under freezing and thawing path; (d) T2 distribution before freezing and after thawing.
Figure 8b illustrates the melting path of the saline silt. During warming, the signal amplitude increased gradually, the distribution range expanded, and the pattern transitioned from unimodal to bimodal. As shown in Figure 8c, the increase in unfrozen water content during melting was relatively smooth, with no abrupt melting stage observed. Complete melting of pore ice occurred at −1.5 °C, at which point all ice was transformed into liquid water. Figure 8d shows the water distribution after one freeze–thaw cycle. A distinct alteration in pore structure was observed, with some small pores converted into larger pores and water migrating from smaller to larger pores. This trend is consistent with the results of the non-saline silt shown in Figure 7d, although the extent of water migration was significantly lower in the saline silt.
3.3 Shear wave velocity of frozen soil
Figures 9a–c show the shear wave velocity of saline and non-saline silts at different frequencies during the freeze–thaw path, where FP denotes the freezing path and TP denotes the thawing path. Taking the results at 10 kHz as an example, Figure 9a indicates that for the non-saline silt, the wave velocity increased rapidly to 1840 m/s when the temperature decreased to −1.6 °C, marking the onset of pore water freezing. As the temperature further decreased from −1.6 °C to −10 °C, unfrozen water content gradually diminished as liquid water transformed into ice, and the velocity progressively increased from 1840 m/s to about 2,220 m/s. During the thawing process, the wave velocity from −10 °C to −5 °C was nearly identical to that of the freezing path, suggesting no hysteresis occurred below −5 °C. From −5 °C to −0.2 °C, the velocity decreased gradually from 2,107 m/s to 1,660 m/s, and in this range the thawing path consistently exhibited higher velocities than the freezing path. When the temperature rose to 0 °C, the velocity dropped sharply to approximately 110 m/s, indicating that all pore ice had melted into liquid water.
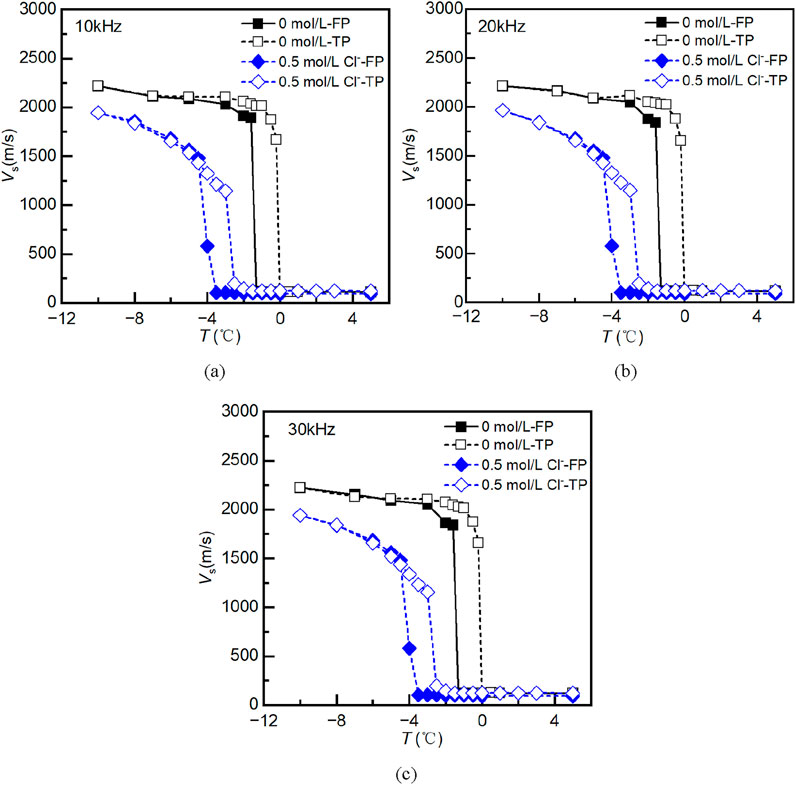
Figure 9. Shear wave velocity at different frequencies under freezing and thawing path: (a) 10kHz; (b) 20kHz; (c) 30kHz.
For saline silt, the results showed that when the temperature decreased to −4 °C, the wave velocity rose abruptly to 579 m/s, reflecting the occurrence of supercooling and subsequent phase change of pore water into ice. At −4.5 °C, the velocity further increased to 1,480 m/s, and continued to rise gradually with decreasing temperature, reaching 1944 m/s at −10 °C. During the thawing process, the velocities between −10 °C and −4 °C were nearly identical to those of the freezing path, with no hysteresis observed. When the temperature increased from −4 °C to −2 °C, the wave velocity decreased sharply to about 120 m/s. From −2 °C to 5 °C, the velocity remained nearly constant, indicating that all pore ice had completely melted by −2 °C.
Due to the presence of salt, the freezing temperature of pore solutions was depressed, causing the results of saline specimens to shift toward lower temperatures. At the same temperature, saline silt retained a higher unfrozen water content compared with non-saline silt, resulting in lower wave velocities. As shown in Figure 9, the results were consistent across different excitation frequencies, suggesting that frequency dispersion effects were negligible.
4 Conclusion
This study employed nuclear magnetic resonance (NMR) and acoustic testing techniques to measure the unfrozen water content and shear wave velocity of chloride salt–contaminated silty soil under freeze–thaw cycles. The water distribution and wave velocity variations during freeze–thaw processes were obtained to investigate the effects of freeze–thaw cycling and salinity on silty soil properties. The main conclusions are as follows.
1. The freezing temperature of chloride salt–contaminated silty soil is significantly lower than that of salt-free silty soil. The presence of sodium chloride reduced the freezing temperature from approximately −1.6 °C to about −4 °C, with the supercooling temperature decreasing from around −1.6 °C to −2.9 °C, resulting in an overall freezing point depression of approximately 2.4 °C.
2. For salt-free silty soil, the unfrozen water content sharply decreased from about 27.2% to 1.7% near the freezing temperature, exhibiting a pronounced hysteresis during thawing. In salt-containing soil, the unfrozen water content decreased from 26.6% to 11% at −4 °C, and further dropped to 2.7% at −10 °C, showing a relatively gradual change with a weaker hysteresis effect.
3. Freezing–thawing cycles induced pore structure reconstruction, characterized by a reduction in micropores and an increase in macropores. The transformation from micropores to macropores and associated water migration were significantly more pronounced in salt-free silty soil than in salt-containing soil.
4. Shear wave velocity increased with decreasing temperature during freezing and decreased with increasing temperature during thawing. For salt-free soil, wave velocity rapidly rose to approximately 1840 m/s at −1.6 °C and reached about 2,220 m/s at −10 °C. For salt-containing soil, the velocity was only about 579 m/s at −4 °C and approximately 1944 m/s at −10 °C. At the same temperature, wave velocity in salt-containing soil was 200–300 m/s lower than in salt-free soil. Differences in results across testing frequencies (10–30 kHz) were minimal.
This study provides a useful reference for evaluating the freeze–thaw behavior of saline soils. The developed temperature-controlled acoustic testing system and the quantitative relationship between unfrozen water content and shear wave velocity have potential applications in subgrade and foundation assessment in cold regions. However, the influence factors on mechanical characteristics of in situ frozen soils is yet lack, including the varying salt concentrations, salt type, particularly sulfate salts. These works should be carefully examined in future research.
Data availability statement
The original contributions presented in the study are included in the article/supplementary material, further inquiries can be directed to the corresponding author.
Author contributions
S-AJ: Data curation, Writing – original draft, Validation, Investigation. QFa: Resources, Writing – review and editing. W-XP: Resources, Writing – review and editing. QFu: Resources, Writing – review and editing. PC: Funding acquisition, Project administration, Validation, Conceptualization, Writing – review and editing, Methodology, Supervision.
Funding
The author(s) declare that financial support was received for the research and/or publication of this article. This research was supported by the Director’s Fund of State Key Laboratory of Offshore Natural Gas Hydrates (2024) (Grant No. CCL2024RCPS0272KQN), the National Science Foundation of China (NSFC) (No. 12572463), and the Research Fund Key Laboratory of Geomechanics and Geotechnical Engineering Safety, Chinese Academy of Sciences (JBGS2405).
Conflict of interest
The authors declare that the research was conducted in the absence of any commercial or financial relationships that could be construed as a potential conflict of interest.
Generative AI statement
The author(s) declare that no Generative AI was used in the creation of this manuscript.
Any alternative text (alt text) provided alongside figures in this article has been generated by Frontiers with the support of artificial intelligence and reasonable efforts have been made to ensure accuracy, including review by the authors wherever possible. If you identify any issues, please contact us.
Publisher’s note
All claims expressed in this article are solely those of the authors and do not necessarily represent those of their affiliated organizations, or those of the publisher, the editors and the reviewers. Any product that may be evaluated in this article, or claim that may be made by its manufacturer, is not guaranteed or endorsed by the publisher.
References
An, R., Gao, H., Chen, C., and Zhang, X. (2024). Quantification and division of unfrozen water content of frozen soils during freezing and the influence of freeze-thaw cycles. Bull. Eng. Geol. Environ. 83 (11), 440. doi:10.1007/s10064-024-03954-w
ASTM D2487-17e1 (2018). Standard practice for classification of soils for engineering purposes (unified soil classification system). West Conshohocken, PA, USA: ASTM International.
ASTM D4318-17e1 (2018). Standard test methods for liquid limit, plastic limit, and plasticity index of soils. West Conshohocken, PA, USA: ASTM International.
ASTM D7928-21e1 (2021). Standard test method for particle-size distribution (gradation) of fine-grained soils using the sedimentation (hydrometer) analysis. West Conshohocken, PA, USA: ASTM International.
ASTM D854-23 (2023). Test methods for specific gravity of soil solids by water pycnometer. West Conshohocken, USA: ASTM International.
Azmatch, T. F., Sego, D. C., Arenson, L. U., and Biggar, K. W. (2012). New ice lens initiation condition for frost heave in fine-grained soils. Cold Regions Sci. Technol. 82, 8–13. doi:10.1016/j.coldregions.2012.05.003
Bing, H., and Ma, W. (2011). Laboratory investigation of the freezing point of saline soil. Cold Regions Sci. Technol. 67 (1), 79–88. doi:10.1016/j.coldregions.2011.02.008
Chamberlain, E. J., and Gow, A. J. (1979). Effect of freezing and thawing on the permeability and structure of soils. Eng. Geol. 13 (1), 73–92. doi:10.1016/0013-7952(79)90022-X
Christ, M., and Park, J.-B. (2009). Ultrasonic technique as tool for determining physical and mechanical properties of frozen soils. Cold Regions Sci. Technol. 58 (3), 136–142. doi:10.1016/j.coldregions.2009.05.008
Devoie, É. G., Gruber, S., and McKenzie, J. M. (2022). A repository of measured soil freezing characteristic curves: 1921 to 2021. Earth Syst. Sci. Data 14 (7), 3365–3377. doi:10.5194/essd-14-3365-2022
Kurfurst, P. J. (1976). Ultrasonic wave measurements on frozen soils at permafrost temperatures. Can. J. Earth Sci. 13 (11), 1571–1576. doi:10.1139/e76-163
Li, D., Huang, X., Feng, M., and Yu, Z. (2016). The impact of unfrozen water content on ultrasonic wave velocity in frozen soils. Procedia Eng. 143, 1210–1217. doi:10.1016/j.proeng.2016.06.114
Li, H., Lai, Y., Wang, L., Yang, X., Jiang, N., Li, L., et al. (2019). Review of the state of the art: interactions between a buried pipeline and frozen soil. Cold Regions Sci. Technol. 157, 171–186. doi:10.1016/j.coldregions.2018.10.014
Li, Q., Zhang, D., Li, P., Cui, K., and Jing, X. (2023). The small-strain stiffness of frozen clay soils at different temperatures and initial water contents: experimental study and predicted model. Cold Regions Sci. Technol. 215, 103986. doi:10.1016/j.coldregions.2023.103986
Liu, G., and Si, B. (2011). Soil ice content measurement using a heat pulse probe method. Can. J. Soil Sci. 91 (2), 235–246. doi:10.4141/cjss09120
Liu, H., Yuan, X., and Xie, T. (2019). A damage model for frost heaving pressure in circular rock tunnel under freezing-thawing cycles. Tunn. Undergr. Space Technol. 83, 401–408. doi:10.1016/j.tust.2018.10.012
Ma, T., Wei, C., Xia, X., Zhou, J., and Chen, P. (2017). Soil freezing and soil water retention characteristics: connection and solute effects. J. Perform. Constr. Facil. 31 (1), D4015001. doi:10.1061/(asce)cf.1943-5509.0000851
Mu, Q., Zhou, C., Ng, C., and Zhou, G. (2019). Stress effects on soil freezing characteristic curve: equipment development and experimental results. Vadose Zone J. 18 (1), 1–10. doi:10.2136/vzj2018.11.0199
Nakano, Y., Martin Iii, R. J., and Smith, M. (1972). Ultrasonic velocities of the dilatational and shear waves in frozen soils. Water Resour. Res. 8 (4), 1024–1030. doi:10.1029/WR008i004p01024
Royer, D., and Valier-Brasier, T. (2022). “Propagation in an unbounded solid,” in In elastic waves in solids 1 (London, UK: ISTE Ltd).
Sheng, D., Zhang, S., Niu, F., and Cheng, G. (2014). A potential new frost heave mechanism in high-speed railway embankments. Geotechnique 64 (2), 144–154. doi:10.1680/geot.13.p.042
Shi, Y., Zhang, L., Ma, W., Yang, C., Han, D., and Shang, F. (2022). Investigating unfrozen water and its components during freeze–thaw action in loess using a novel NMR technique. Eur. J. Soil Sci. 73 (4), e13262. doi:10.1111/ejss.13262
Tao, Y., Yang, P., Li, L., Si, X., and Jin, Y. (2023). Characterizing unfrozen water content of saline silty clay during freezing and thawing based on superposition of freezing point reduction. Cold Regions Sci. Technol. 213, 103933. doi:10.1016/j.coldregions.2023.103933
Teng, J., Kou, J., Yan, X., Zhang, S., and Sheng, D. (2020). Parameterization of soil freezing characteristic curve for unsaturated soils. Cold Regions Sci. Technol. 170, 102928. doi:10.1016/j.coldregions.2019.102928
Teng, J., Dong, A., Zhang, S., Zhang, X., and Sheng, D. (2024). Freezing-thawing hysteretic behavior of soils. Water Resour. Res. 60 (7), e2024WR037280. doi:10.1029/2024WR037280
Tian, H., Wei, C., Wei, H., and Zhou, J. (2014). Freezing and thawing characteristics of frozen soils: bound water content and hysteresis phenomenon. Cold Regions Sci. Technol. 103, 74–81. doi:10.1016/j.coldregions.2014.03.007
Tian, H., Wei, C., Lai, Y., and Chen, P. (2018). Quantification of water content during freeze–thaw cycles: a nuclear magnetic resonance based method. Vadose Zone J. 17 (1). 1. 12. doi:10.2136/vzj2016.12.0124
Wang, X., Gao, Y., Hou, J., Yang, J., Smits, K., and He, H. (2024). Machine learning facilitates connections between soil thermal conductivity, soil water content, and soil matric potential. J. Hydrology 633, 130950. doi:10.1016/j.jhydrol.2024.130950
Watanabe, K., and Mizoguchi, M. (2002). Amount of unfrozen water in frozen porous media saturated with solution. Cold Regions Sci. Technol., 34 (2). 103–110. doi:10.1016/S0165-232X(01)00063-5
Wu, T., Li, H., and Lyu, H. (2023). Effect of freeze–thaw process on heat transfer and water migration between soil water and groundwater. J. Hydrology 617, 128987. doi:10.1016/j.jhydrol.2022.128987
Wu, Y., Wang, Y., and Hu, L. (2025). A unified soil freezing characteristic curve model incorporating supercooling, capillarity, adsorption, and solute effects. J. Hydrology 662, 133899. doi:10.1016/j.jhydrol.2025.133899
Xu, J., Liu, H., and Zhao, X. (2017). Study on the strength and deformation property of frozen silty sand with NaCl under tri-axial compression condition. Cold Regions Sci. Technol. 137, 7–16. doi:10.1016/j.coldregions.2017.01.008
Zhang, F., Yang, Z., Still, B., Wang, J., Yu, H., Zubeck, H., et al. (2018). Elastic properties of saline permafrost during thawing by bender elements and bending disks. Cold Regions Sci. Technol. 146, 60–71. doi:10.1016/j.coldregions.2017.11.014
Zhang, J., Liu, S., Zhang, S., Li, F., Han, Y., and Wang, L. (2020). Response characteristics of sound fields of stratum frozen wall of water-rich sand during developing process. Chin. J. Geotechnical Eng. 42 (12), 2230–2239. doi:10.11779/CJGE202012009
Zhang, J., Lai, Y., Zhao, Y., and Li, S. (2021). Study on the mechanism of crystallization deformation of sulfate saline soil during the unidirectional freezing process. Permafr. Periglac. Process. 32 (1), 102–118. doi:10.1002/ppp.2080
Zhong, M., Guo, Z., Bai, R., Zhang, M., Jin, X., and Wang, Z. (2025). Experimental characterization and hysteresis modeling of unfrozen water in soil during freezing-thawing cycle. Cold Regions Sci. Technol. 238, 104537. doi:10.1016/j.coldregions.2025.104537
Zhou, J., and Wei, C. (2020). Ice lens induced interfacial hydraulic resistance in frost heave. Cold Regions Sci. Technol. 171, 102964. doi:10.1016/j.coldregions.2019.102964
Zhou, J., Wei, C., Wei, H., and Tan, L. (2014). Experimental and theoretical characterization of frost heave and ice lenses. Cold Regions Sci. Technol. 104-105, 76–87. doi:10.1016/j.coldregions.2014.05.002
Zhou, J., Meng, X., Wei, C., and Pei, W. (2020). Unified soil freezing characteristic for variably-saturated saline soils. Water Resour. Res. 56 (7), e2019WR026648. doi:10.1029/2019WR026648
Keywords: frozen soil, freezing-thawing cycle, saline soil, shear wave, nuclear magnetic resonance
Citation: Jia S-A, Fan Q, Pang W-X, Fu Q and Chen P (2025) The characteristics of acoustic propagation and unfrozen water in silt under freezing-thawing conditions. Front. Mater. 12:1721576. doi: 10.3389/fmats.2025.1721576
Received: 09 October 2025; Accepted: 30 October 2025;
Published: 14 November 2025.
Edited by:
Bing Bai, Beijing Jiaotong University, ChinaReviewed by:
Deshan Cui, China University of Geosciences Wuhan, ChinaYu Lu, Tongji University, China
Copyright © 2025 Jia, Fan, Pang, Fu and Chen. This is an open-access article distributed under the terms of the Creative Commons Attribution License (CC BY). The use, distribution or reproduction in other forums is permitted, provided the original author(s) and the copyright owner(s) are credited and that the original publication in this journal is cited, in accordance with accepted academic practice. No use, distribution or reproduction is permitted which does not comply with these terms.
*Correspondence: Pan Chen, cGNoZW5Ad2hyc20uYWMuY24=