 Jun Zhu
 Yangqianzi Jiang1
 Huining Li
 Qingshan Liu
- 1School of Mathematics, Southeast University, Nanjing, China
- 2School of Information Science and Engineering, Southeast University, Nanjing, China
In this study, the trend of the epidemic situation of COVID-19 is analyzed based on the analysis method for network topology. Combining with the sliding window method, the dynamic networks with different topologies for each window are built to reflect the relationship of the data on different days. Then, the static statistical features on network topologies at different times are extracted during the dynamic evolution of complex networks. A new trend function defined on the average degree and clustering coefficient of the network is tailored to measure the characteristics of the trend. Through the value of the trend function, we can analyze the trend of the epidemic situation in real time. It is found that if the value of the trend function tends to decrease, it means that the epidemic will have to be effectively controlled. Finally, we put forward some suggestions for early control of the epidemic.
Introduction
Since December 2019, patients with pneumonia of unknown cause have appeared in some medical institutions. By now, the number of cases caused by coronavirus (COVID-19) has increased. The World Health Organization (WHO) declared the COVID-19 disease a pandemic on March 11, 2020. The cumulative confirmed cases have reached almost 3,220,000 as of May 1, 2020 worldwide. For new outbreaks, it is significant to understand the transmission dynamics of infection, which can help governments take effective measures to contain them and reduce the number of spread. In the survey of other two pandemics caused by coronavirus severe acute respiratory syndrome coronavirus (SARS-CoV) and Middle East respiratory syndrome coronavirus (MERS-CoV), scientists have put forward many effective measures to build the transmission models, such as the transmission analysis based on genome research (Qin et al., 2003) and the mathematical model of infection kinetics (Liang, 2020).
Since the outbreak of COVID-19, scholars have conducted relevant research through different models. Zhu and Chen give a statistical analysis of COVID-19 with early transmission model (Zhu and Chen, 2020). A data-based iterative prediction method is proposed to find growth rates under which the situation will be in control (Perc et al., 2020). Robust time series are used to complete statistical forecasts for the confirmed cases of COVID-19 by Fotios and Spyros (Petropoulos and Makridakis, 2020). In (Chen and Zhou, 2020), a Monte Carlo method is proposed to quantify the control efficacy, which is completed by calculating the mean number of secondary cases infected by a case with symptom onset every day. Moreover, a segmented Poisson model is adopted in Zhang et al. (2020) to analyze the new cases, which takes the governments’ regulations into consideration. An extended SIR model is employed by Jia and Han to compare the epidemics trend in Italy and Hunan, China (Jia et al., 2020).
With the development of complex networks, the spread analysis of epidemics on complex networks has attracted wide attention in the literature. Based on the SIR model in complex networks, Xia et al. have investigated the effects of delaying the time to recovery and of nonuniform transmission on the propagation of diseases on structured populations (Xia et al., 2012; Xia et al., 2013). In (Small and Tse, 2005), Small and Tse propose a new four state model based on the transmission of SARS, where community is modeled as a small-world network of interconnected nodes. Wang et al. point out the spread of epidemics in small-world networks (Wang and Li, 2016). The prevalence of infectious diseases in the population, the spread of viruses on computer networks, and the spread of rumors in human society can all be regarded as the problem of information dissemination on the network, which belongs to the dynamic process of the network and can be dealt with machine learning (Silva and Zhao, 2016).
In the study of complex network diseases (Wang et al., 2019; Wu and Hadzibeganovic, 2020), individuals in the population are regarded as nodes in the network, and the connections between individuals are regarded as edges in the network, which establishes the topology of the network. Since the real network is usually small scale and scale-free, it is generally that the network under study is a Watts–Strogatz (WS) or Barabási-Albert (BA) scale-free network (Wu et al., 2019). After the establishment of network topology, a mathematical model that can reflect the dynamic characteristics of infectious diseases is able to be built according to the transmission characteristics and infectious diseases between individuals (Huang, 2008; Liu and Li, 2019; Lu and Liu, 2019; Zhou and Wu, 2019; Aadil et al., 2020). In this paper, we attempt to make use of empirical data and combine the characteristics of COVID-19 transmission to analyze the trend of COVID-19. We mainly use the knowledge of network topology to give the trend analysis of COVID-19, which networks are established based on the data from COVID-19 Data Repository by the Center for Systems Science and Engineering (CSSE) at Johns Hopkins University (https://github.com/CSSEGISandData/COVID-19).
The article is organized as follows. Section 1 introduces the process of relevant research. In Section 2, which is also the most significant part of the article, we present the construction of the networks and the topological features extracted from the networks. Section 3 displays the networks we built and analyzes the epidemic situation in the four regions through the topological characteristics of the networks. We summarize the method we used and give some suggestions in Section 4.
Methodology
This section introduces the construction of the networks and the topological features extracted from the networks.
Networks Constructing
Here, we select four regions for the analysis, including Wuhan, South Korea, Russia, and Germany. The total number of confirmed cases is extracted for every day in each region. We get a time series
From this treatment, the change in the daily diagnostic number can be seen more clearly. At the same time, the impact of the total local population on the growth rate of the number of confirmed cases can also be ignored. Then, we get a new time series on the growth rate of daily diagnoses
The dynamic evolution analysis method is an important way for data analysis based on the features of network topology. In dynamic evolution, the feature measurement of networks is a function of time. In the same evolution mode, two subnetworks obtained at different times have different features. Therefore, it is a very important and effective way to analyze and classify the network by using static statistical features at different times during the dynamic evolution of networks (Backes et al., 2009). Here, the sliding window method is used to extract the features of network topology for further observation. The key to selecting sliding windows is how to effectively maintain the quality and quantity of the original time series information, while minimizing the calculation complexity to the most extent (Li and Zhang, 2004; Li and Xiao, 2009). In this study, we apply the sliding window with the length of 9 days and the step size of 1 day. Figure 1 shows the process of sliding windows for the time series data. Next, we will use the daily growth rate to build the networks.
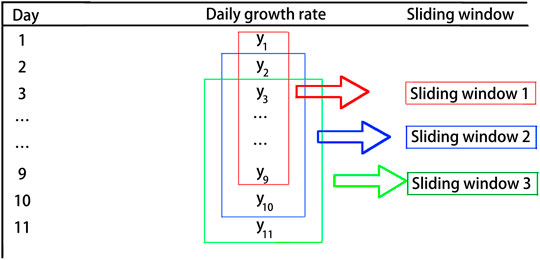
FIGURE 1. Sliding windows are used to form the time series. The length of sliding windows is chosen as 9 days, and the step size is 1 day. The figure shows the process of constructing time series.
For one of the sliding window
where
Topological Features of Networks
The degree
where
The clustering coefficient is a coefficient that measures the degree of network aggregation, which can be formulated as follows:
where
Experimental Results
In this section, we combine the daily number of confirmed cases in Wuhan, South Korea, Russia, and Germany to build the networks and analyze the epidemic situation in the four regions through the topological characteristics of the networks.
Data Processing
We use the daily number of diagnoses from January 22, 2020 to May 16, 2020 as the data set. So, for each region, we can get the total number of diagnoses per day for 116 days. First, from (1), the data are processed to calculate the 115-day daily diagnosis growth rate for each region. Then, using a sliding window of 9 days and a step size of 1 day, the time series data are divided into 107 periods, and 107 networks are constructed with nine nodes in each period. Figure 2 shows the networks at the 43rd day of the four regions. The more connections the network has, the greater the change is of the 9-day growth rate. It should be emphasized that few connections cannot only indicate the control period of the disease but also the period of early outbreak.
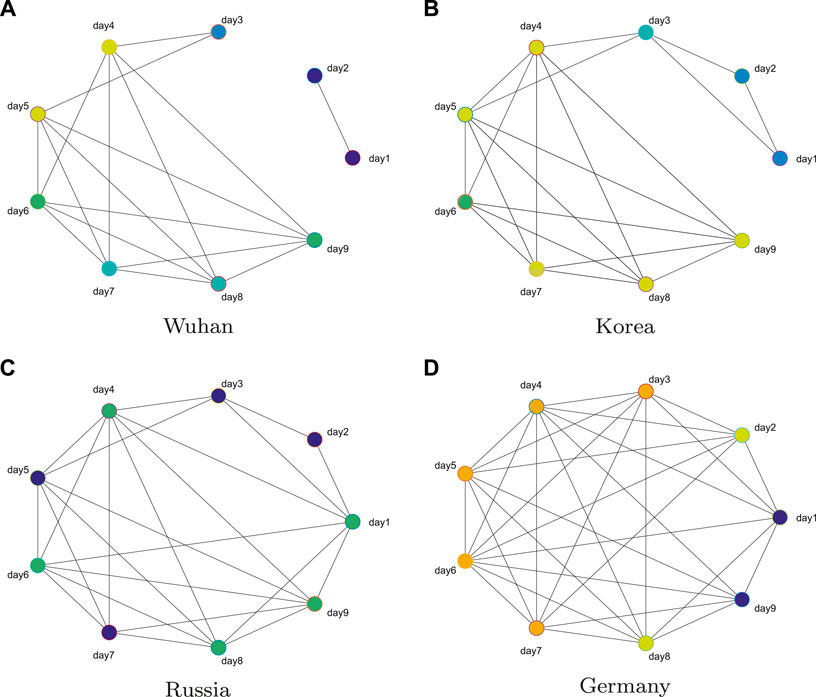
FIGURE 2. Networks at the 43rd day of the four regions. The number of connections in the network reflects the change degree of nine-day growth rate.
Analysis of Network Topological Characteristics
We use the equations in Eqs (5) and (6) to calculate the average degree and clustering coefficient of each network, and the trend function is defined as
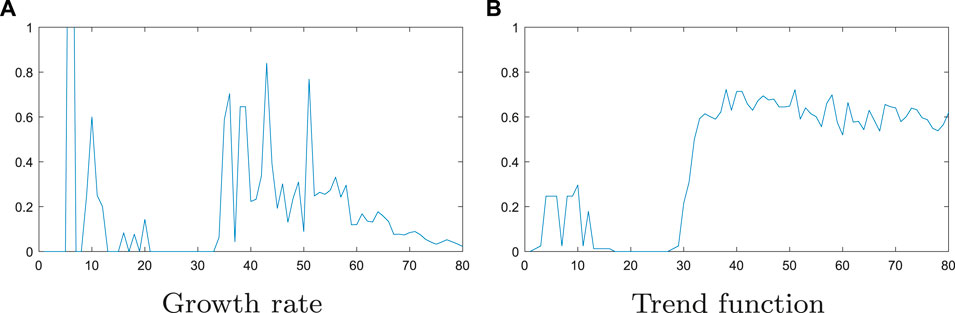
FIGURE 3. Growth rate and the evolution of trend function of Germany.
The evolution of the trend function in the four regions is shown in Figure 4. In the figure, the value of the abscissa is the number of days passed from January 22, 2020, and the ordinate is the value of the trend function I. The larger the I value, the larger is the clustering coefficient and mean sum. The larger the clustering coefficient, the difference of growth rate of any 3 days is less than the threshold in 9 days, and the larger the average degree, the difference of the growth rate in 9 days is less than the threshold number of days. Therefore, when the daily diagnostic growth rate of 9 days becomes relatively small, the clustering coefficient and average degree will be relatively small. If the growth rate changes greatly in 1 day in the 9 days, the average threshold will become larger, and the number of connections will increase in the remaining 8 days, then the value of trend function will also increase.
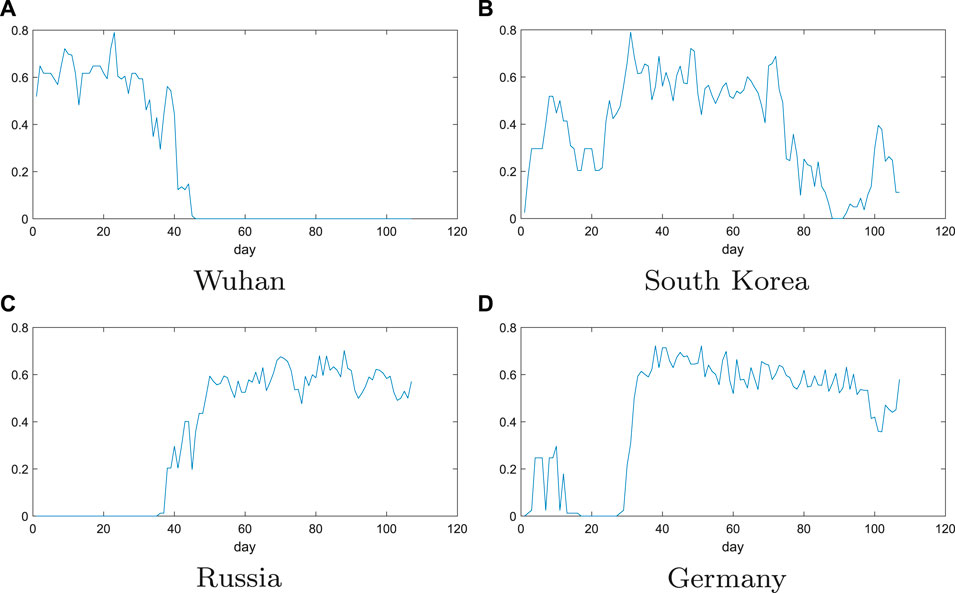
FIGURE 4. Evolution of trend function for the four regions: Wuhan, South Korea, Russia, and Germany. The value of the abscissa is the number of days passed from January 22, 2020, and the ordinate is the value of the trend function I. The larger the I value, the larger is the clustering coefficient and mean sum.
From Figure 4A in Wuhan, there is a clear downward trend in the values of the trend function around March 2. The growth rate of the number of confirmed patients in the next 9 days has also dropped to
In Figure 4D, the values of trend function change in Germany can be seen that it has a small wave peak at first, and then suddenly increases until it stabilizes around 0.6. So, it can be speculated that there was a small outbreak in Germany between January 22 and February 2, and then it was effectively controlled, resulting in a growth rate of almost zero. But since February 22, there has been a second outbreak in Germany. The values of trend function have been fluctuating around 0.6, indicating that Germany’s growth rate still remains high and the epidemic has not been effectively controlled. The above results are consistent with the local epidemic data in Germany, which proves that the method is effective.
From above analysis, we can analyze and predict the epidemic situation in South Korea and Russia. From Figure 4, it can be seen that the figure of South Korea has shown a clear downward trend since April 2, indicating that the epidemic situation in South Korea has been effectively controlled. However, there was a small upward trend at the 100th day. This indicates that the daily growth rate in South Korea has increased by a small margin recently. But, it can be controlled quickly. For Russia, where the values of trend function is still fluctuating around 0.6, which indicates a certain fluctuation in the growth rate of the daily confirmed population in Russia during April. We can also see that the growth rate is still relatively high, which shows that the Russian epidemic has not been effectively controlled, and the growth rate will not be significantly reduced in the near future, and more stringent measures are needed to control the development of the epidemic.
Note that the effective control of the epidemic in this article refers to the fact that the daily growth rate is almost zero, that is, there is almost no new infection, rather than the change in the daily growth rate of 0, or in other words, the next day is approximately equal to the daily growth rate of the previous day, as mentioned in some articles. For example, for the platform period mentioned in Perc et al. (2020), we understand it as the epidemic situation has been preliminarily controlled, and only when there is no new infection can it be considered to be effectively controlled.
Discussions and Conclusions
In this article, we proposed a trend analysis method based on network construction with sliding windows to extract the characteristics of network dynamic evolution over time and analyzed the epidemic trend in four typical regions. In the analysis, we found that some regions had better control of the epidemic, while others were still in the process of outbreak. So, we put forward some suggestions and hope that the epidemic situation in various countries can be effectively controlled as soon as possible.
The proposed method in this article is easy but efficient for the trend analysis of COVID-19. In general, since COVID-19 patients’ mid-term course of disease develops rapidly, it is hard to accurately judge the cycle from mild to severe. Moreover, the issue of infectivity in the incubation period and the infectious power of those infected patients during the recovery period remains to be studied, which may be the cause of second outbreak in Germany. The intensity of different infection generation and the difference of infection are still unknown. The question of whether the virus will disappear or persist in the population remains to be resolved.
Many countries have taken effective measures to the epidemic, such as closing churches, bars, and gymnasiums. In severe cases, some countries such as China seal off the city from all outside contact to stop the spread of the plague. We can learn from the above analysis that Wuhan has got the epidemic under control in a relatively short time. In order to block the transmission chain of the virus, it is a very effective method to trace the confirmed patient’s activity route and contacts. For countries like Russia where the epidemic is still serious, which can be observed from the trend in Figure 4, they should consider to strengthen the isolation measures.
Data Availability Statement
Publicly available datasets were analyzed in this study. This data can be found here https://github.com/CSSEGISandData/COVID-19.
Author Contributions
JZ and QL designed and performed the research. JZ, YJ, TL, and HL wrote the manuscript.
Funding
This work was supported in part by the National Natural Science Foundation of China under Grant 61876036.
Conflict of Interest
The authors declare that the research was conducted in the absence of any commercial or financial relationships that could be construed as a potential conflict of interest.
References
Aadil L., Adel S., Hamza E. M., Mustapha E. J., Mohamed E. F. (2020). Global dynamics of an epidemic model with incomplete recovery in a complex network. J. Franklin Inst. 357, 4414–4436. doi:10.1016/j.jfranklin.2020.03.010
Backes A. R., Casanova D., Bruno O. M. (2009). A complex network-based approach for boundary shape analysis. Pattern Recogn. 42, 54–67. doi:10.1016/j.patcog.2008.07.006
Huang S.-Z. (2008). A new SEIR epidemic model with applications to the theory of eradication and control of diseases, and to the calculation of. Math. Biosci. 215, 84–104. doi:10.1016/j.mbs.2008.06.005
Jia W., Han K., Song Y., Cao W., Wang S., Yang S., et al. (2020). Extended SIR prediction of the epidemics trend of COVID-19 in Italy and compared with Hunan, China. Front. Med. 7, 169. doi:10.3389/fmed.2020.00169
Li F., Xiao J. (2009). How to get effective slide-window size in time series similarity search. J. Front. Comput. Sci. Tech. 3, 105–112. [in Chinese]. doi:1673-9418/2009/03(01)-0105-08
Li J., Zhang D. (2004). Algorithms for dynamically adjusting the sizes of sliding windows. J. Softw. 15, 1800–1814. [in Chinese]. doi:1000-9825/2004/15(12)1800
Liang K. (2020). Mathematical model of infection kinetics and its analysis for COVID-19, SARS and MERS. Infect. Genet. Evol. 82, 104306. doi:10.1016/j.meegid.2020.104306
Liu Q., Li H. (2019). Global dynamics analysis of an seir epidemic model with discrete delay on complex network. Phys. Stat. Mech. Appl. 524, 289–296. doi:10.1016/j.physa.2019.04.258
Lu Y., Liu J. (2019). The impact of information dissemination strategies to epidemic spreading on complex networks. Phys. Stat. Mech. Appl. 536, 120920. doi:10.1016/j.physa.2019.04.156
Perc M., Gorišek Miksić N., Slavinec M., Stožerr A. (2020). Forecasting COVID-19. Front. Phys. 8, 127. doi:10.3389/fphy.2020.00127
Petropoulos F., Makridakis S. (2020). Forecasting the novel coronavirus COVID-19. PLoS One 15, e0231236. doi:10.1371/journal.pone.0231236
Qin E. d., He X., Tian W., Liu Y., Li W., Wen J, et al. (2003). A genome sequence of novel SARS-CoV isolates: the genotype, gd-ins29, leads to a hypothesis of viral transmission in south China. Dev. Reprod. Biol. 1, 101–107. doi:10.1016/s1672-0229(03)01014-3.
Silva T. C., Zhao L. (2016). “Case study of network-based semi-supervised learning: stochastic competitive-cooperative learning in networks.” in Machine learning in complex networks (Cham, Switzerland: Springer International Publishing), 291–321.
Small M., Tse C. K. (2005). Clustering model for transmission of the SARS virus: application to epidemic control and risk assessment. Phys. Stat. Mech. Appl. 351, 499–511. doi:10.1016/j.physa.2005.01.009
Wang B., Li P. (2016). Introduction of small world network. Mod. Phys. 28, 51–55. [in Chinese]. doi:10.13405/j.cnki.xdwz.2016.03.018
Wang Y., Yuan G., Fan C., Hu Y., Yang Y. (2019). Disease spreading model considering the activity of individuals on complex networks. Phys. Stat. Mech. Appl. 530, 121393. doi:10.1016/j.physa.2019.121393
Wu Q., Hadzibeganovic T. (2020). An individual-based modeling framework for infectious disease spreading in clustered complex networks. Appl. Math. Model. 83, 1–12. doi:10.1016/j.apm.2020.02.012
Wu Y., Gao L., Zhang Y., Xiong X. (2019). Structural balance and dynamics over signed BA scale-free network. Phys. Stat. Mech. Appl. 525, 866–877. doi:10.1016/j.physa.2019.04.038
Xia C., Wang L., Sun S., Wang J. (2012). An sir model with infection delay and propagation vector in complex networks. Nonlinear. Dynam. 69, 927–934. doi:10.1007/s11071-011-0313-y
Xia C.-Y., Wang Z., Sanz J., Meloni S., Moreno Y. (2013). Effects of delayed recovery and nonuniform transmission on the spreading of diseases in complex networks. Phys. Stat. Mech. Appl. 392, 1577–1585. doi:10.1016/j.physa.2012.11.043
Zhang X., Ma R., Wang L. (2020). Predicting turning point, duration and attack rate of COVID-19 outbreaks in major western countries. Chaos Solit. Fractals 135, 109829. doi:10.1016/j.chaos.2020.109829
Zhou R., Wu Q. (2019). Epidemic spreading dynamics on complex networks with adaptive social-support. Phys. Stat. Mech. Appl. 525, 778–787. doi:10.1016/j.physa.2019.03.107
Keywords: COVID-19, sliding window, network topology, dynamic evolution, trend analysis
Citation: Zhu J, Jiang Y, Li T, Li H and Liu Q (2020) Trend Analysis of COVID-19 Based on Network Topology Description. Front. Phys. 8:564061. doi: 10.3389/fphy.2020.564061
Received: 20 May 2020; Accepted: 07 October 2020;
Published: 12 November 2020.
Edited by:
Zhen Wang, Hong Kong Baptist University, Hong KongReviewed by:
Yuyao Wang, Nanjing University of Science and Technology, ChinaChengyi Xia, Tianjin University of Technology, China
Copyright © 2020 Zhu, Jiang, Li, Li and Liu. This is an open-access article distributed under the terms of the Creative Commons Attribution License (CC BY). The use, distribution or reproduction in other forums is permitted, provided the original author(s) and the copyright owner(s) are credited and that the original publication in this journal is cited, in accordance with accepted academic practice. No use, distribution or reproduction is permitted which does not comply with these terms.
*Correspondence: Qingshan Liu, cXNsaXVAc2V1LmVkdS5jbg==