 M. Toppi1,2I. Avanzolini3,4L. Balconi5
 G. Battistoni6G. Calvi6M. De Simoni3,4
 Y. Dong5,6
 A. Fantoni2G. Franciosini3,4
 M. Marafini2,7M. Fischetti1,4V. Muccifora2
 S. Muraro6
 V. Patera1,4,7F. Ronchetti2
 A. Sarti1,4,7A. Sciubba1,4,7
 G. Traini4*S. M. Valle6
 I. Mattei6
- 1Dipartimento Di Scienze Di Base E Applicate Per l’Ingegneria, Sapienza Università Di Roma, Rome, Italy
- 2INFN Laboratori Nazionali Di Frascati, Frascati, Italy
- 3Dipartimento Di Fisica, Sapienza Università Di Roma, Rome, Italy
- 4INFN Section of Rome, Rome, Italy
- 5Dipartimento Di Fisica, Università Degli Studi Di Milano, Milan, Italy
- 6INFN Section of Milan, Milan, Italy
- 7Museo Storico Della Fisica E Centro Studi E Ricerche E. Fermi, RomeItaly
In Particle Therapy, safety margins are applied around the tumor to account for the beam range uncertainties and ensure an adequate dose coverage of the tumor volume during the therapy. The reduction of safety margins is in great demand in order to diminish the Particle Therapy side effects especially in the case of treatment of tumors close to Organs at Risk (OAR) and of pediatric patients. To this aim, beam range monitoring techniques are being developed by the scientific community, most of all based on the detection of secondary particles produced by the nuclear interactions of the beam with the patient’s tissue nuclei. In this contribution, a novel beam range monitoring technique is proposed, based on the detection of prompt photons exploiting the pair production mechanism. The proof of principle of the PAir PRoduction Imaging ChAmber (PAPRICA) is studied through the development of a Monte Carlo simulation and the detector performances toward a more realistic scenario are determined.
1 Introduction
Particle Therapy (PT) is a type of external radiotherapy exploiting charged ion beams (mainly protons and carbon ions) to treat solid tumors. The typical charged particle dose-depth profile in tissues, characterized by a low dose release in the entrance channel followed by a narrow high-dose region called Bragg peak, elects the PT as the favorable treatment of unresectable deep-seated tumors close to Organs at Risk (OAR) [1]. Carbon ions can also profit from their high Relative Biological Effectiveness (RBE), which could be exploited to treat radioresistant tumors [2]. On the other hand, the intrinsic high-dose conformity to the target volume that could be achieved in PT is limited by the several sources of beam range uncertainties arising during the treatment (e.g., patient positioning and anatomical changes) and/or in the treatment plan itself (e.g., Hounsfield units, dE/dx conversion) [3]. To ensure a complete dose coverage of the tumor volume, safety margins are foreseen by the treatment planning, with a consequent unnecessary dose delivery to healthy tissues that can be potentially dangerous. The minimization of safety margins would be of large importance especially when tumors are seated in the proximity of OARs or in the treatment of long-life expectation patients as the pediatric ones [4], in which the occurrence of long-term side effects has a stronger impact. For such reasons, a large effort is being made by the scientific community in order to develop a beam range verification technique [5, 6] capable of operating on-line, i.e., during the PT treatment, to provide prompt feedback on the actual administered dose spatial distribution. Different techniques have been proposed in the last decade, based on the detection of sound waves [7] or secondary particles produced in the nuclear interactions of the beam projectiles with the patient’s tissue nuclei, as annihilation photons produced in the decay of beam-induced
Prompt gamma detection is a promising and deeply investigated solution [14] since different PG physics properties could be correlated to the beam range as the Time of Flight (TOF) [15] with Prompt Gamma Timing (PGT) technique, the energy spectrum [16] with Prompt Gamma Spectroscopy (PGS) technique, and the emission spatial distribution (PG imaging). In particular, the PGT technique is facility dependent, while the PGS was shown to be a very promising technique, reaching an accuracy of the order of few millimeters [16]. In the case of PGI, mechanical collimators [17] or Compton Cameras [18, 19] are used to reconstruct the PG production points. At present, one of the latest researches exploiting the prompt gamma imaging with a mechanical collimator has been published by Xie et al. [20] using a knife-edge slit camera. Data acquisition during a proton treatment on a patient has been reported and a 2 mm shift on the Bragg peak position has been observed by aggregating beam spots for a 7 mm kernel on the same tumor layer. One of the updated works regarding the prompt gamma electronic collimation with a Compton Camera is related to Draeger et al. [21], where a resolution of 3 mm has been obtained with a pencil beam of 108 protons, performing three measurements in three different detector positions as if the detector is made by six modules of the presented prototype. The obtained results by these two studies are very promising too, even though in the case of Compton Cameras limitations mainly due to the complex reconstruction algorithms have not yet been overcome [22].
In this contribution, a novel 3D PG imaging technique is proposed, exploiting the pair production (PP) interactions to reconstruct the incoming photon emission direction. The proof of principle of such a technique will be studied by means of the PAir PRoduction Imaging ChAmber (PAPRICA), a novel detector under development within the PAPRICA project1.
The prompt photon imaging based on the pair production mechanism has been already investigated by Rohling et al. in 2015 [23]. The authors performed a Monte Carlo (MC) study with a simple detector geometry using photon point-like sources of different energies. Their study showed that such technique is mainly limited by the multiple scattering suffered by the produced lepton pair within their CZT converter, leading to a large angular resolution on the reconstructed photons and observing a bias on the photon emission point which is dependent on the detector geometry. The authors finally state that a pair production camera cannot match the precision requested in range monitoring applications in PT. The work presented in this manuscript aims to further explore the method proposed by the Rohling et al., evaluating its feasibility using a detector designed to work in a clinical environment, with an optimized geometry in order to improve the detection efficiency while reducing the multiple scattering of e+-e− pairs within the converter plane. Moreover, the developed reconstruction algorithm would improve the imaging ability of a PP chamber by correcting the bias observed by the cited authors.
The PAPRICA design and its expected performances, evaluated by means of Monte Carlo simulations performed with the FLUKA software [24, 25], will be shown hereafter.
2 The PAPRICA Device
The pair telescope is a technology adopted in astrophysics research to image cosmic photons having energies higher than 30 MeV, recently explored also in the range ∼5–200 MeV [26]. Telescopes are typically formed by layers of converter material, where photons undergo PP producing a
PAPRICA will intrinsically exploit the PG with energy greater than 4 MeV, above which the PP cross section becomes significant and PP is the most likely process to occur in several materials. Moreover, such photons are best correlated with the Bragg peak position [27], with a consequent background reduction due to the uncorrelated neutron-induced photons (
2.1 Detector Design
The PAPRICA design oversees three detector blocks, as shown in Figure 1. A converter layer, made of a high Z material to maximize the PP cross section (
in which the unaccessible momentum of the recoiled nucleus has been neglected. As will be discussed in Section 2.1.1, such assumption represents the major intrinsic limit of PP-based imaging at the energy range of interest in PT. At the photon energy of interest, the PG 4-momentum resolution is also significantly affected by the multiple scattering (MS) suffered by the lepton pair to exit from the converter layer and cross the silicon-based tracking stations. To optimize the PAPRICA performance, the converter material and size as well as the full detector geometry have been finely tuned by means of an MC simulation developed with the FLUKA software. A point-like photon source, emitting in a cone with an angular aperture of ∼0.7 rad and pointing toward the converter, has been placed at 30 cm distance from the converter surface (see Figure 2 (left)), an attainable distance of the detector from a patient in a treatment room. The photon energy has been sampled from the emission spectrum (predicted by FLUKA) resulting from the interaction of a 160 MeV proton beam impinging on a PMMA (polymethil-methacrylate) target (see Figure 2 (right)). The energy peaks due to the deexcitation of the 12C* (4.44 MeV) and 16O* (6.13 MeV) are clearly visible.
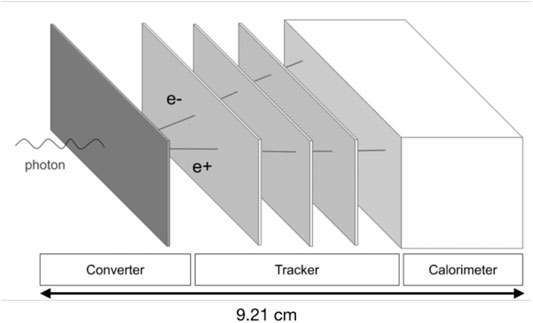
FIGURE 1. Sketch of the PAPRICA design: the converter, the tracker, and the calorimeter blocks are shown. The total detector length is reported.
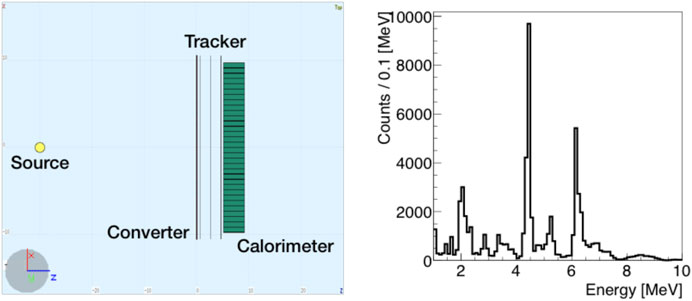
FIGURE 2. Left: visualization of the FLUKA simulated geometry (top view). The photon point source is represented by the yellow dot. Right: PG energy spectrum at production obtained from the simulation of a 160 MeV proton beam impinging on a PMMA target.
2.1.1 Converter
The converter layer has been optimized in terms of material (atomic number Z and density ρ) and thickness in order to balance the pair production efficiency, maximizing the number of PP interactions, while minimizing the converter MS. Using an optimized thickness, the LYSO (Zeff = 66; ρ = 7.1 g/cm3) scintillating crystal material has been chosen over tungsten (Z = 74; ρ = 19.3 g/cm3) and lead (Z = 82; ρ = 11.3 g/cm3). The advantage of using an active medium with respect to a passive one has been pursued: it will allow us to develop a trigger for the acquisition exploiting the time coincidence of the converter and calorimeter signals. The converter layer will be composed of ∼130 LYSO fibers placed side by side, 1.5 × 1.5 × 50 mm3 each, for a total surface of
Despite the PP interactions are almost uniformly distributed along the converter thickness, 85% of the exiting leptons are produced in the last 500 μm as shown in Figure 3 (left): the white solid area represents the production coordinate distribution along the longitudinal axis of the converter (z), while the black area shows the production coordinate of the pairs capable of exiting the converter. Nevertheless, the use of thinner LYSO fibers has been excluded due to their high mechanical fragility. The average energy of the exiting pair is ∼2 MeV. Figure 3 (right) shows the probability distribution that an electron with a given kinetic energy at the converter exit (
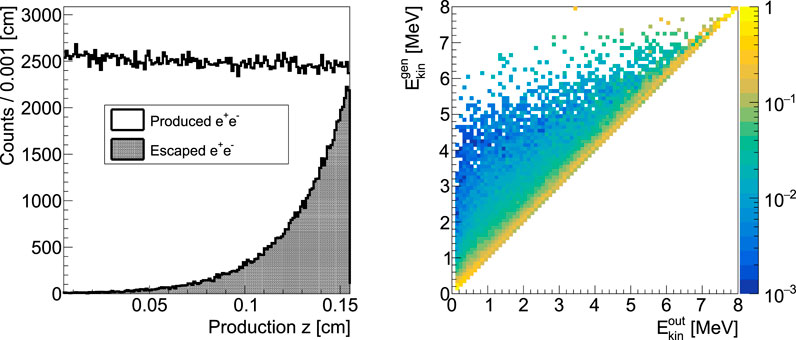
FIGURE 3. Left: production coordinate of the pairs on the longitudinal axis z of the converter layer (white area) superimposed to the same distribution for the pairs able to exit the converter (black area). The observed exponential behavior represents the pair absorption toward the converter exit face. Right: probability distribution that an electron with a given kinetic energy at the converter exit (
The contribution on the photon reconstruction of the converter nuclear recoil in the LYSO material has been evaluated accessing to the Monte Carlo scored information, calculating the angle
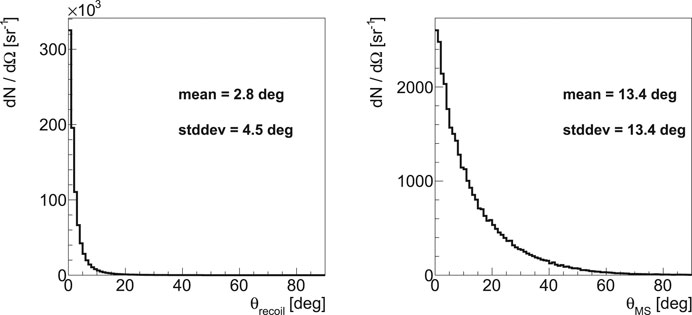
FIGURE 4. Left:
2.1.2 Tracker
The tracking stations of the PAPRICA chamber are based on the ALPIDE (ALice PIxel DEtector) [29, 30] sensor, developed for the Outer Barrel (OB) of the new Inner Tracking System (ITS) of the ALICE detector [31, 32], in view of the LHC Run 3. Tests of ALPIDE telescopes, performed within the ALICE collaboration using minimum ionization particles, have shown a tracking efficiency > 99% and a fake hits rate <10−6/pixel×event, exceeding the PAPRICA required performances in terms of achievable spatial resolution (
The ALPIDE chip is a 15 mm × 30 mm MAPS, implemented in a 180 nm CMOS imaging sensor process. The sensor is segmented in 512 × 1024 pixels of 29 μm × 27 μm each. A periphery circuit region of 1.2 mm × 30 mm implements control and read-out functionalities and constitutes a dead area for crossing particles. Each pixel contains an n-well sensing diode (∼2 μm diameter), an amplifying and shaping stage, a discriminator, and a digital section with three-hit storage register (Multievent Buffer). The digital read-out is managed by an in-matrix zero suppression circuit (“priority encoder”), providing to the periphery the addresses of pixels over the threshold. The circuits are fabricated on a high resistivity (> 1 k
The front-end read-out logic is fully integrated into the ALPIDE sensor, which is able to drive signals directly over 2 m copper cables by integrated high-speed transmitters toward the off-detector electronics with rates up to 400 Mb/s. The off-detector read-out is managed by a MOSAIC board [34], FPGA-based board, that connects to control, clock, and data lines on the detector side, and interfaces with the DAQ PC via an Ethernet link. 3 MOSAIC units are employed, each connected to one of the tracker layers through the copper cables. High-speed receivers are connected to a 1 GB DDR3 memory that stores data waiting to be sent to the DAQ PC through a gigabit Ethernet interface. An external trigger can be provided to the MOSAIC board and then distributed to the sensors. The powering of the tracker layers is managed by a Power Board, interfaced and controlled by the MOSAIC, providing the possibility to power and monitor the voltages and currents for each layer, independently.
The three layers of the tracker are hosted in a mechanical structure designed to have the possibility to change the interlayers distance. Each layer is held by a rectangular frame provided of two windows in correspondence with the layer active region. The final mechanical structure has still to be finalized and the HIC assembly on the frames tested. The interplane distance has been optimized in order to meet the converter constraints and the minimum distance of ∼2 cm allowed by the mechanics and electronics has been chosen: it maximizes the collectable pair statistics, geometrically selecting pairs from PG with energy > 4 MeV. Indeed, enlarging the interplane distance would cause a larger loss of the pairs due to the smaller angular acceptance, reducing the events generated by the 4.44 MeV prompt gammas, which are the most correlated to the beam range [27], of a factor ∼2 when doubling the interplane distance.
To evaluate the impact of the multiple scattering suffered by the lepton pair crossing the tracker planes, all the detector details have been implemented in the simulation. An overall material budget of x/X0 ∼ 0.22% per layer has been estimated. Figure 5 shows the angle
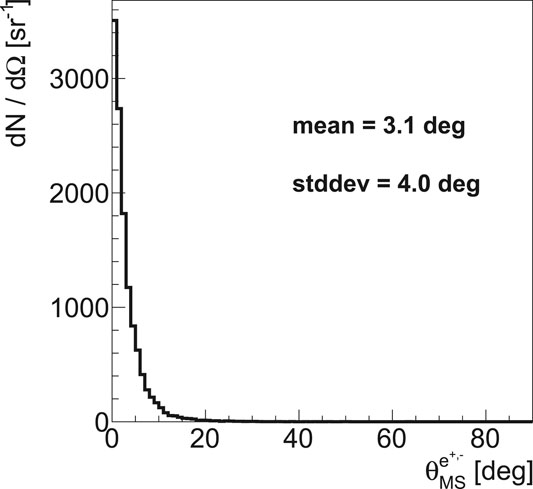
FIGURE 5. Distribution of the angle
2.1.3 Calorimeter
In order to measure the kinetic energy of the pair, a calorimeter made of a plastic scintillator has been chosen. The material choice has been driven by the need of minimizing the lepton backscattering on the entrance surface, which can occur with a non-negligible probability for the < 10 MeV e+-e− [35]. As an outcome of the Monte Carlo simulation, the plastic low atomic number (
The scintillator (EJ-200) will be segmented in 256 rods 6 × 6 × 50 mm3, arranged in an 8
3 Expected Performances Toward a Realistic Case
The PAPRICA expected performances toward a realistic case have been evaluated by means of a FLUKA Monte Carlo simulation of 160 MeV proton beam, 1011 primary particles, impinging on a PMMA thick target with a volume of 5 × 5 × 25 cm3. The beam has a Gaussian profile with
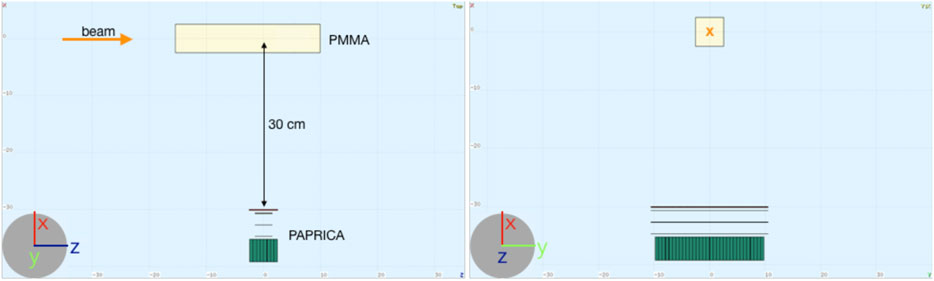
FIGURE 6. Visualization of the FLUKA simulated geometry. The beam direction (in orange) is along the positive z-axis. Left: side view (xz plane). Right: front view (xy plane).
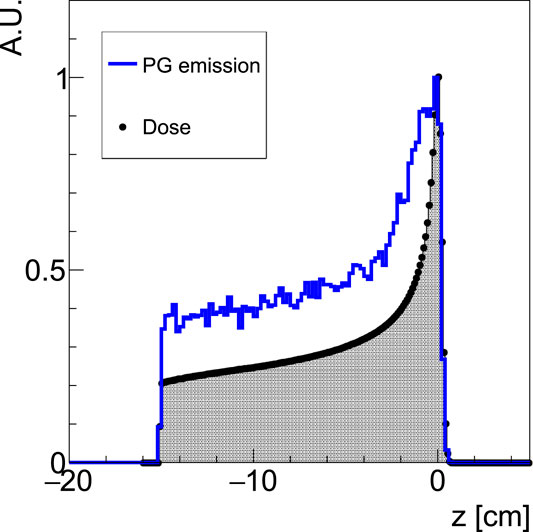
FIGURE 7. 160 MeV proton beam dose deposition (full dots; black area) within the PMMA target, superimposed to the prompt photons (selected requiring production energy larger than 4 MeV) spatial emission distribution along the beam axis (solid blue line; white area). Each distribution is normalized to its maximum value. The PMMA entrance face is at z = −15.05 cm.
3.1 Prompt Gamma Emission Profile
In order to image the PG emission distribution, the incoming direction of the PG impinging on the converter and creating the electron-positron pair has been reconstructed in three steps: reconstruction of the leptons production vertex, photon momentum measurement (using Eq. 1), and photon emission coordinate reconstruction. To this aim, an ad hoc simulation output has been built by means of dedicated FLUKA user routines. The simulation output is given on an event-by-event basis. In order to develop a data-like MC output, the concept of a detector hit has to be introduced: a hit is defined as the energy release of one or more particles within an active detector (LYSO fiber, MAPS Si pixel, and plastic scintillator rod), which is above the detector energy threshold (Eth). No energy threshold has been set for the LYSO fibers and MAPS in the reported event reconstruction, while Eth = 500 keV has been chosen for the calorimeter rods, as a result of a dedicated analysis performed to optimize the trigger efficiency while minimizing the selection of background events. The Events of Interest (EoI), defined as the events where a photon produces in the converter an
3.2 Lepton Track Reconstruction
A combinatorial reconstruction algorithm has been developed in order to identify the leptons tracks, evaluate their direction, and finally reconstruct the production vertex position within the converter as the Point of Closest Approach (POCA) between the tracks direction. Adjacent hits in the tracker planes have been grouped in clusters, to whom the arithmetic average of the single hit positions is assigned.
For each event selected with the strategy described above, the algorithm looks for a couple of tracks pointing to the converter. All the possible combinations of three clusters c1, c2, and c3 (one per plane, see Figure 8) are considered as track candidates. Firstly, as shown in Figure 8, the angle
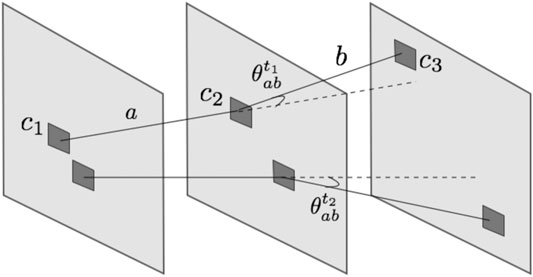
FIGURE 8. Sketch of the cluster assignment to a track in the reconstruction algorithm (not to scale). The MAPS planes are represented in light gray, while the clusters are highlighted in dark gray. c1, c2, and c3 belong to track t1. a and b are the segments between c1-c2 and c2-c3, respectively. The angle
Indeed, the reconstruction algorithm reconstructs an e+-e− leptons’ pair in 90% of the reconstructed tracks and in 74% of pairs the track belongs to the same particle. The background events are mainly represented by uncorrelated e+-e− leptons (7% of reconstructed tracks) and by the presence of an e+ or e− with a secondary proton within the chamber (2% of reconstructed tracks). 0.5% of background events are represented by (p, 2p) reactions within the converter plane.
The spatial resolution on the reconstructed vertex position has been assessed in the case of the EoI (see Section 3.1) computing the difference between the true and the reconstructed production vertexes, shown in Figure 9. A
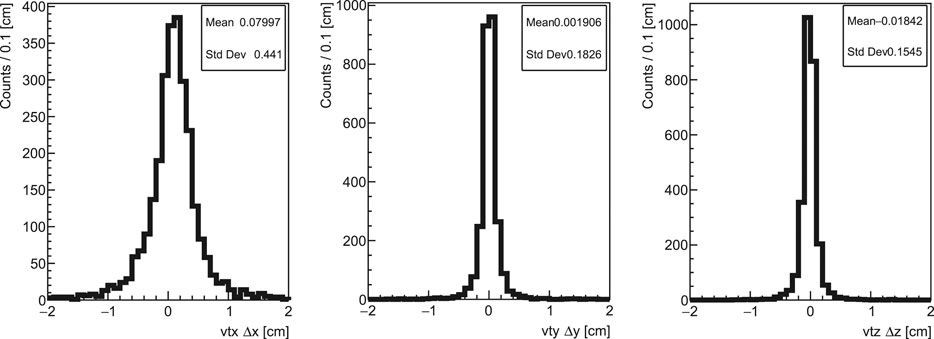
FIGURE 9. Resolution on the reconstructed vertex position along the x(left), y(middle), and z(right) axes. The resolution has been computed for the tracks where an e+-e− leptons’ pair has been correctly reconstructed and the leptons have been generated by a photon undergoing pair production within the converter plane.
3.3 Photon Emission Point Reconstruction
In order to reconstruct the prompt photon emission position, the photon momentum has been computed according to Eq. 1. The leptons’ momentum is assessed exploiting the energy released in the calorimeter. Kinetic energy is assigned to each chosen track extrapolating the direction identified by the segment connecting c2 and c3 (see Section 3.2) on the calorimeter entrance surface. The closest rods to the track projection, within a 2.5 cm radius, are assigned to a track and the corresponding deposited energy in each rod is added, applying a 5% calorimeter resolution.
Once the particle incoming direction on the converter plane has been calculated, the gamma emission position is assessed as the POCA between the beam axis (the z-axis in the simulated setup geometry) and the reconstructed particle direction. In Figure 10 (left), the reconstructed PG emission profile along the beam direction is shown (white area) and compared with the actual emission profile of the reconstructed sample (black area). A systematic error in the reconstructed position can be noticed, as shown in Figure 10 (right), due to a geometrical effect arising as the angle of the incident photon on the converter plane increases.
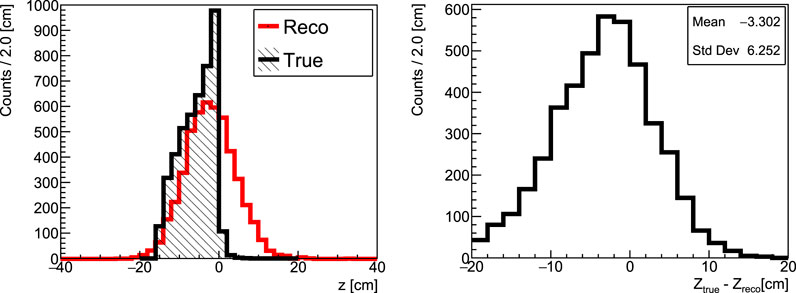
FIGURE 10. Left: reconstructed prompt photons emission distribution along the beam axis (z coordinate) (red line; white area) obtained from 1011 160 MeV protons impinging on a PMMA target. The distribution of the actual points at production is superimposed (black line; black area). Right: the difference between the z coordinate of the photon at generation (
The bias observed affects mainly the tracks with a large incidence angle on the converter plane and is due to geometrical reasons: it arises when backprojecting the reconstructed tracks toward the beam direction, as a consequence of the poor track angular resolution. This unavoidable reconstruction artifact significantly degrades the correlation between the fall-off of the reconstructed prompt gamma distribution and the Bragg peak position, and it has been corrected by applying an unfolding procedure.
3.3.1 Unfolding
The unfolding technique has been implemented and encoded using the ROOT TUnfold software tool [37, 38]. The unfolding matrix or migration matrix is built in order to retrieve the emission profile at the production of the reconstructed events. The matrix has been computed simulating an extended photon source with 1012 primaries, located inside an 80 cm long PMMA target (FLATsim). The PMMA target sides have the same dimensions as the target used in the 160 MeV proton beam simulation (FULLsim). The gamma source is uniformly distributed in z = [−40, 40] cm, while having a Gaussian shape in x and y (μ = 0 cm,
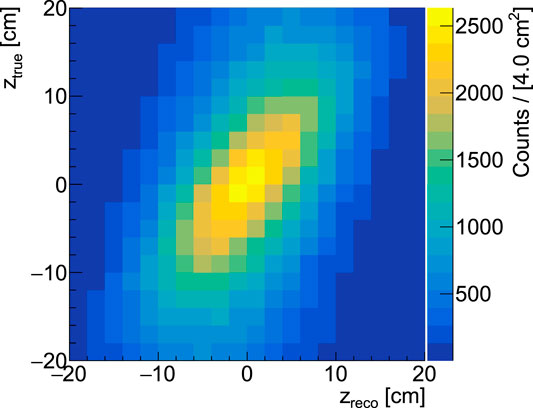
FIGURE 11. Unfolding matrix computed from a FLATsim (extended photon source within a PMMA target). Zreco is the photon coordinate reconstructed by the PAPRICA detector having the same geometry of the FULLsim, while Ztrue is its generation coordinate.
The choice of using an extended photon source is based on the assumption that the MC is well able to reproduce the photons transport and interaction, and therefore, it is not dependent on the FLUKA MC nuclear cross sections of the prompt photon production. The photon source extension is of 80 cm, which is well beyond the PMMA extension in the FULLsim, in order to consider the whole phase-space of the generation and reconstructed photon directions. The configuration of the TUnfold algorithm has been optimized in order to minimize the differences of the unfolded spectrum with respect to the true one and the following parameters have been chosen: the regularization scheme is the kRegModeCurvature, 20 bins for the unfolded final output starting from 20 measured bins, a regularization strength τ ∼ 0.01–0.02, with variations related to the different samples. In Figure 12, the measured spectrum obtained from the FULLsim (red white area distribution of Figure 10 (left)) has been unfolded with the presented matrix. The unfolded spectrum (red triangles) is superimposed to the true z distribution (black line). The fall-off of the unfolded distribution is clearly better related to the fall-off of the true emission spectrum in comparison to the raw distribution shown in Figure 10 (left).
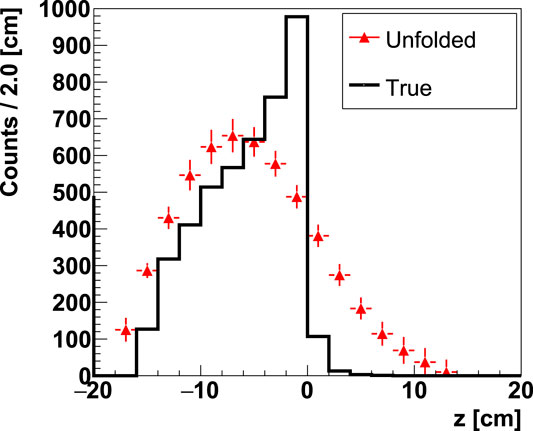
FIGURE 12. Unfolded distribution of the reconstructed prompt photons emission along the beam axis (z coordinate) (red triangles) obtained from 1011 160 MeV protons impinging on a PMMA target. The distribution of the actual points at production is superimposed (black line). The errors on the unfolded spectrum are only statistical, mainly due to the unfolding procedure.
3.3.2 Calibration
The capability of monitoring the Bragg peak position using the PAPRICA chamber has been evaluated by performing an MC-based calibration with the aim of parameterizing the Bragg peak position vs. fall-off trend. FULL simulations of different proton beam energies impinging on the PMMA target have been run. The beam parameters of the simulations are reported in Table 1 and are extracted from the therapeutic beams of the CNAO center (Pavia, Italy). The statistics of primary particles simulated is 1011 protons.
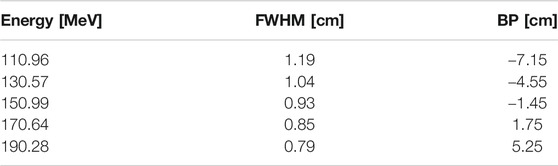
TABLE 1. Proton beam parameters of the MC simulations used to build the calibration: beam energy, full width at half maximum, and theoretical Bragg peak position. The error on the BP is 0.03 cm, from the finite binning of the obtained dose distributions.
Figure 13 shows the raw reconstructed photon spectra (solid green line) that have been unfolded with the afore-mentioned procedure, and the resulting emission profiles (red triangles) superimposed together to the true emission profile (dotted black line). The bias in the reconstruction that mainly affects the tracks with a large incidence angle on the converter plane (as explained in Section 3.3) is more noticeable for lower beam energies, since for larger energies more detected photons have smaller incident angles. The distributions obtained with protons at 110 MeV and 130 MeV present an unfolding artifact whose origin is still under investigation. The fall-off of each distribution has been parameterized using a Fermi-Dirac function:
where
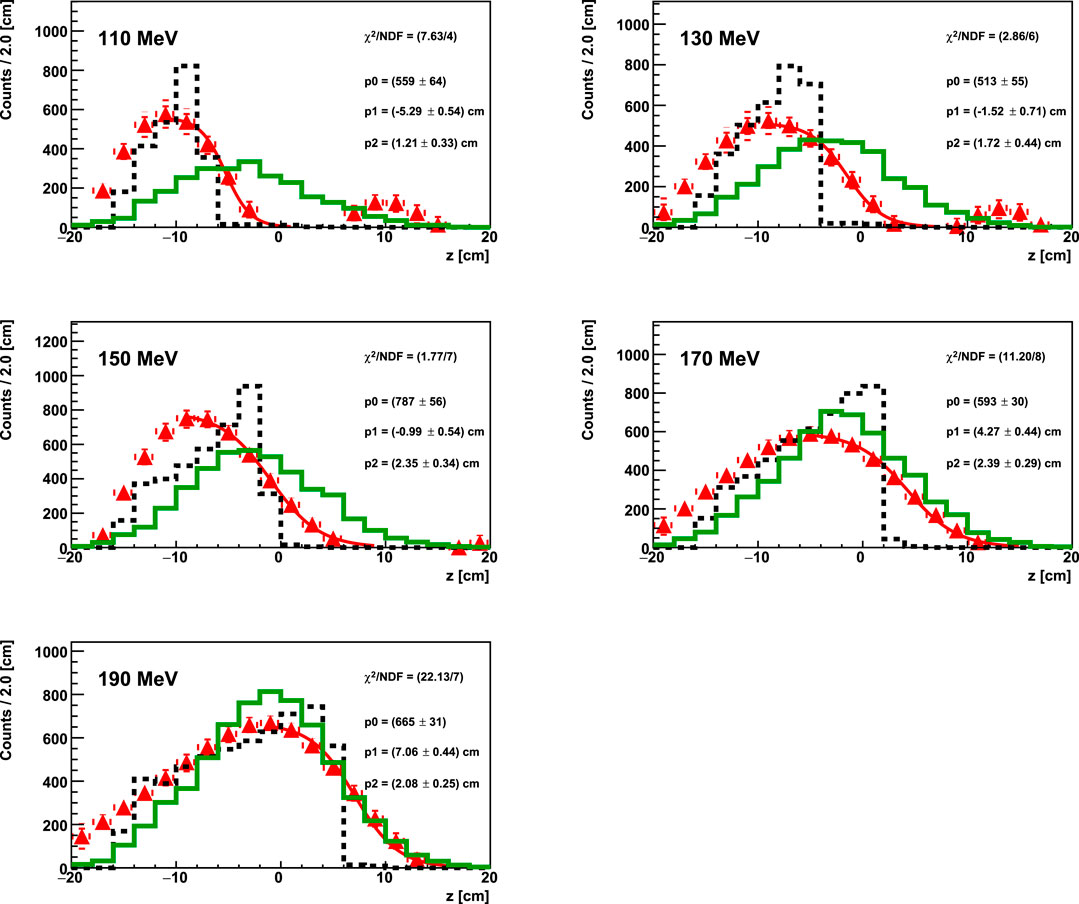
FIGURE 13. True photon emission distribution (dotted black line) superimposed to the raw reconstructed prompt photons emission spectrum (solid green line) and to the unfolded distributions (red triangles) for the FULL simulations of protons (1011 primaries) at different energies impinging on a PMMA target. The geometrical setup of the simulations is the one shown in Figure 6. The fit on the unfolded distributions is performed with the function in Eq. 2 and the fit parameters are reported on each canvas.
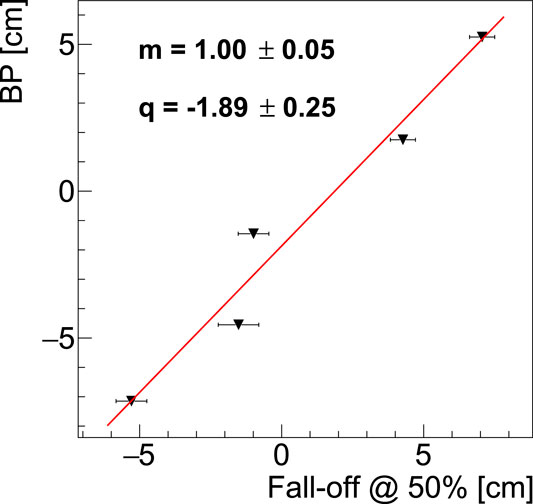
FIGURE 14. Calibration curve of the theoretical Bragg peak positions for each simulated proton beam energy as a function of the fall-off at 50% of the unfolded distributions of the reconstructed prompt photon profiles. The point related to the 160 MeV proton beam has been removed from the calibration since it is used to assess the PAPRICA performances toward a realistic case.
3.4 Absolute Proton Beam Range Verification
When evaluating the precision of the PAPRICA detector in monitoring the beam range in a realistic scenario, the proper reconstructed statistics have to be considered. We have used as a reference the prompt photon yield produced by a 160 MeV proton beam impinging on a PMMA target, measured by Pinto et al. in 2015 [39]:
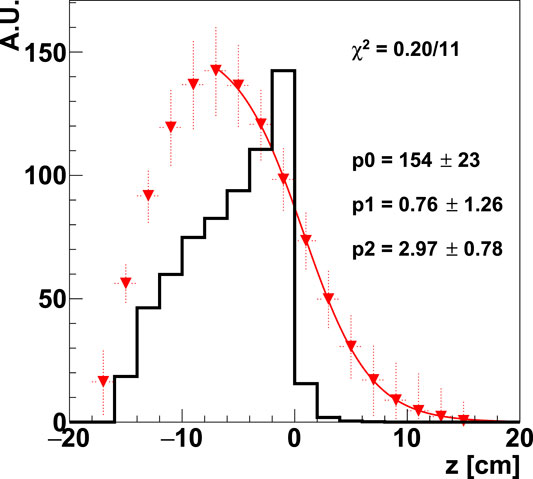
FIGURE 15. True (black solid line) and unfolded (red triangles) distributions for a number of 1000 photons reconstructed exploiting the 160 MeV proton simulation. The true spectrum has been normalized to the maximum of the unfolded one. The errors on the unfolded distribution are statistical errors, due to the unfolding procedure. The solid line is the Fermi-Dirac fit function reported in Eq. 2.
The ∼1 cm accuracy obtained on the absolute verification proton beam range does not match the clinical requests. However, it can be improved by performing a further optimization of the unfolding procedure and by using an unfolding matrix with higher statistics, as well as a higher statistics in the FULL simulation used to build the calibration function. Moreover, a study on other geometrical configurations of the PAPRICA setup with respect to the beam field has to be investigated.
4 Conclusion
The aim of the PAPRICA project is the proof of principle of a novel beam range monitoring technique based on prompt gamma imaging exploiting the pair production mechanism. A prompt gamma-based range monitoring exploiting the pair production mechanism has several advantages with respect to other proposed techniques: a 3D imaging that could be in principle possible, the simple reconstruction algorithm, the intrinsically E > 4 MeV targeted prompt photons which are the ones with the stronger correlation to the beam range, the topological event signature allowing good background discrimination enhancing the possibility of exploiting the prompt photon imaging also in the case of carbon ion therapy, and the no need of mechanical collimation nor time or energy analyses of the detected signal. A FLUKA Monte Carlo simulation of a prompt photon source impinging on the chamber has been performed in order to optimize the PAPRICA detector geometry, with a focus on each PAPRICA subdetector: the converter, the tracker, and the calorimeter. The intrinsic limit on the prompt photon reconstruction considering the low prompt gamma energy range (1–10 MeV) is the recoil of the nuclei participating in the e+-e− pair production, giving a degradation on the angular resolution of ∼3°. Due to the low pair production cross section at the prompt gamma energies, a high atomic number material for the converter has been chosen: the thickness of the converter assures to have a sufficient e+-e− pair statistics to reconstruct the impinging photon direction. On the other hand, the converter thickness contributes to the angular resolution degradation due to the multiple scattering suffered by the leptons’ pair while exiting the converter surface. The optimized PAPRICA converter thickness is a trade-off between the resolution on the single reconstructed prompt photon, the produced statistics, and the high mechanical fragility of thin LYSO fibers.
The expected PAPRICA performances in retrieving the Bragg peak position for absolute verification of the proton beam range have been computed in a more realistic case scenario, with ∼3 × 10⁹ 160 MeV protons impinging on a PMMA target and considering a 1 sr PAPRICA detector to increase the collectable prompt gamma statistics. By applying a developed MC calibration to a low statistics simulation in order to consider the expected number of reconstructed prompt photons in the outlined scenario, a resolution on the retrieved Bragg peak of ∼1 cm has been obtained, demonstrating that the PAPRICA detector, with larger solid angle, would not be able to perform an absolute range verification with the clinically required resolution of ∼2 mm on the computed beam range. Nevertheless, there is room for optimization of the proposed pair production imaging technique and further investigations to perform 3D imaging and to improve the PAPRICA resolution on the imaged photons are foreseen and will be the subject of future studies.
Data Availability Statement
The original contributions presented in the study are included in the article/Supplementary Material; further inquiries can be directed to the corresponding author.
Author Contributions
MT: leader of the INFN LNF unit, development of the ALPIDE tracker detector, and Monte Carlo simulation of the PAPRICA tracker. IA: Monte Carlo simulation of the PAPRICA calorimeter and work on the trigger logic optimization. LB: Monte Carlo simulation, data analysis, and development of the calibration method. GB: Monte Carlo simulation and development of the FLUKA user routines. GC: Monte Carlo simulation, PAPRICA detector optimization, development of the reconstruction algorithm, and data analysis. MD: development of the tracks reconstruction code. YD: development of the tracks reconstruction code. AF: work on the ALPIDE tracker optimization. GF: data analysis. MM: Monte Carlo simulation and data analysis. MF: optimization of the reconstruction algorithm. VM: optimization of the ALPIDE tracker geometry. SM: Monte Carlo simulation. VP: Monte Carlo simulation and converter optimization. FR: optimization of the ALPIDE tracker geometry. ASa: data analysis. ASc: full detector design optimization. GT: unit leader of the INFN Roma1 unit, work on the trigger logic optimization, development of the reconstruction algorithm, and data analysis. SV: Monte Carlo simulation. IM: PI of the PAPRICA project, Monte Carlo simulation, and data analysis.
Funding
The project is supported by INFN Gruppo V with a Young Researchers Grant (2019–2021).
Conflict of Interest
The authors declare that the research was conducted in the absence of any commercial or financial relationships that could be construed as a potential conflict of interest.
The handling editor declared a shared affiliation with the authors MM, VP, AS, and AS at the time of review.
Acknowledgments
We would like to thank Marco Magi from “Sapienza”, Università di Roma, SBAI Department, for his valuable work in the design of the detector mechanical structure. We also thank the LNF electronic service for the technical support in the design and test of the read-out electronics and DAQ system.
Footnotes
1INFN (National Institute of Nuclear Physics, Italy) young researcher grant.
References
1. Durante M, Orecchia R, Loeffler J. Charged-particle therapy in cancer: clinical uses and future perspectives. Nat Rev Clin Oncol (2017) 14(8):483–95. doi:10.1038/nrclinonc.2017.30
2. Malouff TD, Mahajan A, Krishnan S, Beltran C, Seneviratne DS, Trifiletti DM. Carbon ion therapy: a modern review of an emerging technology. Front Oncol (2020) 10:82. doi:10.3389/fonc.2020.00082
3. Paganetti H. Range uncertainties in proton therapy and the role of Monte Carlo simulations. Phys Med Biol (2012) 57(11):R99–R117. doi:10.1088/0031-9155/57/11/r99
4. Thomas H, Timmermann B. Paediatric proton therapy. Br J Radiol (2020) 93(1107):20190601. doi:10.1259/bjr.20190601.PMID:31529979
5. Knopf AC, Lomax A. In vivo proton range verification: a review. Phys Med Biol (2013) 58(15):R131–60. doi:10.1088/0031-9155/58/15/r131
6. Parodi K, Polf JC. In vivo range verification in particle therapy. Med Phys (2018) 45(11):e1036–50. doi:10.1002/mp.12960
7. Parodi K, Assmann W. Ionoacoustics: a new direct method for range verification. Mod Phys Lett (2015) 30(17):1540025. doi:10.1142/S0217732315400258
8. Parodi K. On- and off-line monitoring of ion beam treatment. Nucl Instrum Methods Phys Res Sect A Accel Spectrom Detect Assoc Equip (2016) 809:113–9. doi:10.1016/j.nima.2015.06.056 Advances in detectors and applications for medicine.
9. Ferrero V, Fiorina E, Morrocchi M, Pennazio F, Baroni G, Battistoni G, et al. Online proton therapy monitoring: clinical test of a Silicon-photodetector-based in-beam PET. Sci Rep (2018) 8(1):4100. doi:10.1038/s41598-018-22325-6
10. Krimmer J, Dauvergne D, Létang J, Testa E. Prompt-gamma monitoring in hydrotherapy: a review. Nucl Instrum Methods Phys Res Sect A Accel Spectrom Detect Assoc Equip (2018) 878:58–73. doi:10.1016/j.nima.2017.07.063
11. Mattei I, Bini F, Collamati F, Lucia ED, Frallicciardi PM, Iarocci E, et al. Secondary radiation measurements for particle therapy applications: prompt photons produced by 4He, 12C and 16O ion beams in a PMMA target. Phys Med Biol (2017) 62(4):1438–55. doi:10.1088/1361-6560/62/4/1438
12. Piersanti L, Bellini F, Bini F, Collamati F, Lucia ED, Durante M, et al. Measurement of charged particle yields from PMMA irradiated by a 220 MeV/u 12C beam. Phys Med Biol (2014) 59(7):1857–72. doi:10.1088/0031-9155/59/7/1857
13. Traini G, Mattei I, Battistoni G, Bisogni M, Simoni MD, Dong Y, et al. Review and performance of the Dose Profiler, a particle therapy treatments online monitor. Phys Med (2019) 65:84–93. doi:10.1016/j.ejmp.2019.07.010
14. Pausch G, Berthold J, Enghardt W, Römer K, Straessner A, Wagner A, et al. Detection systems for range monitoring in proton therapy: needs and challenges. Nucl Instrum Methods Phys Res Sect A Accel Spectrom Detect Assoc Equip (2020) 954:161227. doi:10.1016/j.nima.2018.09.062
15. Werner T, Berthold J, Hueso-González F, Koegler T, Petzoldt J, Roemer K, et al. Processing of prompt gamma-ray timing data for proton range measurements at a clinical beam delivery. Phys Med Biol (2019) 64(10):105023. doi:10.1088/1361-6560/ab176d
16. Hueso-González F, Rabe M, Ruggieri TA, Bortfeld T, Verburg JM. A full-scale clinical prototype for proton range verification using prompt gamma-ray spectroscopy. Phys Med Biol (2018) 63(18):185019. doi:10.1088/1361-6560/aad513
17. Richter C, Pausch G, Barczyk S, Priegnitz M, Keitz I, Thiele J, et al. First clinical application of a prompt gamma based in vivo proton range verification system. Radiother Oncol (2016) 118(2):232–7. doi:10.1016/j.radonc.2016.01.004
18. Aldawood S, Thirolf P, Miani A, Bömer M, Dedes G, Gernhäuser R, et al. Development of a Compton camera for prompt-gamma medical imaging. radiat. phys. chem. In: 2nd International Conference on Dosimetry and its Applications (ICDA-2), July 3-8, 2016. Guildford, United Kingdom: University of Surrey (2017). p. 190–7.
19. Llosá G, Trovato M, Barrio J, Etxebeste A, Muñoz E, Lacasta C, et al. First images of a three-layer Compton telescope prototype for treatment monitoring in hadron therapy. Front Oncol (2016) 6:14. doi:10.3389/fonc.2016.00014
20. Xie Y, Bentefour EH, Janssens G, Smeets J, Stappen FV, Hotoiu L, et al. Prompt gamma imaging for in vivo range verification of pencil beam scanning proton therapy. Int J Radiat Oncol Biol Phys (2017) 210–8. doi:10.1016/j.ijrobp.2017.04.027
21. Draeger E, Mackin D, Peterson S, Chen H, Avery S, Beddar S, et al. 3D prompt gamma imaging for proton beam range verification. Phys Med Biol (2018) 63(3):035019. doi:10.1088/1361-6560/aaa203
22. Rohling H, Priegnitz M, Schoene S, Schumann A, Enghardt W, Hueso-González F, et al. Requirements for a Compton camera for in-vivo range verification of proton therapy. Phys Med Biol (2017) 62(7):2795–811. doi:10.1088/1361-6560/aa6068
23. Rohling H, Golnik C, Enghardt W, Hueso-Gonzàlez F, Kormoll T, Pausch G, et al. Simulation study of a combined pair production - Compton camera for in-vivo dosimetry during therapeutic proton irradiation. IEEE Trans Nucl Sci (2015) 62(5):2023–30. doi:10.1109/TNS.2015.2448235
24. Ferrari A, Sala PR, Fasso A, Ranft J. FLUKA: a multi-particle transport code (Program version 2005). p. 405. CERN-2005-010, SLAC-R-773, INFN-TC-05-11 (2005). doi:10.5170/CERN-2005-010
25. Böhlen T, Cerutti F, Chin M, Fassó A, Ferrari A, Ortega P, et al. The FLUKA code: developments and challenges for high energy and medical applications. Nucl Data Sheets (2014) 120:211–4. doi:10.1016/j.nds.2014.07.049
26. Hunter SD, Bloser PF, Depaola GO, Dion MP, DeNolfo GA, Hanu A, et al. A pair production telescope for medium-energy gamma-ray polarimetry. Astropart Phys (2014) 59:18–28. doi:10.1016/j.astropartphys.2014.04.002
27. Verburg JM, Riley K, Bortfeld T, Seco J. Energy- and time-resolved detection of prompt gamma-rays for proton range verification. Phys Med Biol (2013) 58(20):L37–49. doi:10.1088/0031-9155/58/20/l37
28. Traini G, Battistoni G, Bollella A, Collamati F, Lucia ED, Faccini R, et al. Design of a new tracking device for on-line beam range monitor in carbon therapy. Phys Med (2017) 34:18–27. doi:10.1016/j.ejmp.2017.01.004
29. Aglieri Rinella G. The ALPIDE pixel sensor chip for the upgrade of the ALICE Inner Tracking System. Nucl Instrum Methods A Accel Spectrom Detect Assoc Equip (2017) 845:583–7. doi:10.1016/j.nima.2016.05.016
30. Kushpil S, Krizek F, Isakov A. Recent results from beam tests of the ALPIDE pixel chip for the upgrade of the ALICE inner tracker. IEEE Trans Nucl Sci (2019) 66(11):2319–23. doi:10.1109/tns.2019.2945234
31. Abelev B(ALICE collaboration). Upgrade of the ALICE experiment: letter of intent. J Phys G Nucl Part Phys (2014a) 41(8):087001. doi:10.1088/0954-3899/41/8/087001
32. Abelev B(ALICE collaboration). Technical design report for the upgrade of the ALICE inner tracking system. J Phys G (2014b) 41(8):087002. doi:10.1088/0954-3899/41/8/087002
33. Di Mauro AOn behalf of the ALICE collaboration. The new inner tracking system for the ALICE upgrade at the LHC. Nucl Instrum Methods A Accel Spectrom Detect Assoc Equip (2019) 936:625–9. doi:10.1016/j.nima.2018.10.047
34. De Robertis G, Fanizzi G, Loddo F, Manzari V, Rizzi M. A MOdular System for Acquisition, Interface and Control (MOSAIC) of detectors and their related electronics for high energy physics experiment. EPJ Web Conf (2018) 174:070024. doi:10.1051/epjconf/201817407002
35. Tabata T. Backscattering of electrons from 3.2 to 14 MeV. Phys Rev (1967) 162(2):336–47. doi:10.1103/PhysRev.162.336
36. Grevillot L, Bertrand D, Dessy F, Freud N, Sarrut D. A Monte Carlo pencil beam scanning model for proton treatment plan simulation using GATE/GEANT4. Phys Med Biol (2011) 56(16):5203–19. doi:10.1088/0031-9155/56/16/008
37. Schmitt S. TUnfold, an algorithm for correcting migration effects in high energy physics. J Instrum (2012) 7(10):T10003. doi:10.1088/1748-0221/7/10/t10003
38.Cern. ROOT data analysis framework. Available from: https://root.cern.ch/.
39. Pinto M, Bajard M, Brons S, Chevallier M, Dauvergne D, Dedes G, et al. Absolute prompt-gamma yield measurements for ion beam therapy monitoring. Phys Med Biol (2015) 60(2):565–94. doi:10.1088/0031-9155/60/2/565
Keywords: reconstruction, pair production, particle therapy, range monitoring, prompt photons
Citation: Toppi M, Avanzolini I, Balconi L, Battistoni G, Calvi G, De Simoni M, Dong Y, Fantoni A, Franciosini G, Marafini M, Fischetti M, Muccifora V, Muraro S, Patera V, Ronchetti F, Sarti A, Sciubba A, Traini G, Valle SM and Mattei I (2021) PAPRICA: The Pair Production Imaging Chamber—Proof of Principle. Front. Phys. 9:568139. doi: 10.3389/fphy.2021.568139
Received: 31 May 2020; Accepted: 19 January 2021;
Published: 16 March 2021.
Edited by:
Federico Giove, Centro Fermi–Museo Storico Della Fisica E Centro Studi E Ricerche Enrico Fermi, ItalyReviewed by:
Etienne Testa, Université Lyon 1, FranceJean Michel Létang, Institut National Des Sciences Appliquées De Lyon (INSA Lyon), France
Copyright © 2021 Toppi, Avanzolini, Balconi, Battistoni, Calvi, De Simoni, Dong, Fantoni, Franciosini, Marafini, Fischetti, Muccifora, Muraro, Patera, Ronchetti, Sarti, Sciubba, Traini, Valle and Mattei. This is an open-access article distributed under the terms of the Creative Commons Attribution License (CC BY). The use, distribution or reproduction in other forums is permitted, provided the original author(s) and the copyright owner(s) are credited and that the original publication in this journal is cited, in accordance with accepted academic practice. No use, distribution or reproduction is permitted which does not comply with these terms.
*Correspondence: G. Traini, Z2lhY29tby50cmFpbmlAcm9tYTEuaW5mbi5pdA==