 Rasmus Solem
 Till Dreier
 Isabel Goncalves
 Martin Bech
- 1Department for Medical Radiation Physics, Clinical Sciences Lund, Lund University, Lund, Sweden
- 2Excillum AB, Stockholm, Sweden
- 3Cardiovascular Research and Translational Studies, Clinical Sciences Malmö, Lund University, Malmö, Sweden
- 4Skåne University Hospital, Malmö, Sweden
Material decomposition in computed tomography is a method for differentiation and quantification of materials in a sample and it utilizes the energy dependence of the linear attenuation coefficient. In this study, a post-image reconstruction material decomposition method is constructed for a low-energy micro-CT setup using a photon counting x-ray detector. The low photon energy range (4–11 keV) allows for K-edge contrast separation of naturally occurring materials in organic tissue without the need of additional contrast agents. The decomposition method was verified using a phantom and its capability to decompose biomedical samples was evaluated with paraffin embedded human atherosclerotic plaques. Commonly, the necessary dual energy data for material decomposition is obtained by manipulating the emitted x-ray spectrum from the source. With the photon counting detector, this data was obtained by acquiring two energy window images on each side of the K-edge of one material in the sample. The samples were decomposed into three materials based on attenuation values in manually selected regions. The method shows a successful decomposition of the verification phantom and a distinct distribution of iron, calcium and paraffin in the atherosclerotic plaque samples. Though the decompositions are affected by beam hardening and ring artifacts, the method shows potential for spectral evaluation of biomedical samples.
1. Introduction
In conventional x-ray imaging, contrast depends on material density. While e.g. soft tissue gives good contrast against bone, materials with similar density are harder to distinguish. This can be circumvented by exploiting the energy dependence of the linear attenuation coefficient μE as proposed by [1]. In particular, the element specific absorption edges allow for material decomposition, when energy bins can be selected in the vicinity of the edge. Acquiring images with different x-ray energies will thus allow for separation of materials with similar density based on their specific absorption edges [2, 3].
By applying material decomposition, additional information can be obtained from a sample. It can be used to separate materials that are indistinguishable from another in conventional imaging as shown by [4]. Further, materials and theirs concentrations in a sample can be assessed, providing spectroscopic information. This approach can greatly simplify segmentation of computed tomography (CT) scans and allows to extract material quantities or concentrations in a non-destructive way.
Typically, material decomposition is performed in dual energy CT scanners. A common method with clinical CT scanners is to manipulate the emitted spectrum of the x-ray source by changing the acceleration voltage, commonly known as the dual-kV method [1, 5, 6]. Utilizing the non-linearity of the attenuation coefficients of different elements, materials can be separated. However, this approach requires two consecutive acquisitions. Alternatively, systems with two x-ray sources and detectors can be used as demonstrated by [7] and [8]. A different approach is to use a photon counting detector with multiple energy-discriminating thresholds as shown by [9–11]. Such a detector allows to create energy bins covering a certain energy range. Each individual photon creates a signal proportional to its energy, which is only counted if exceeding the threshold energy [see [12]]. Photon counting detectors are showing great potential for pre-clinical and clinical applications as outlined by [13–16]. An alternative approach is to measure the time-over-threshold (ToT), where the duration of a signal, which is proportional to its energy, is measured and then related to a specific energy as implemented for the Timepix detector developed by [17].
In clinical settings, with x-ray energies well above 15 keV and decimeter sized objects (such as patients), the elements available of K-edge contrast are those with Z ≥ 37. However, most of the elements relevant in organic tissue are in the periods 1–4 in the periodic table (Z ≤ 36), and consequently a contrast agent containing an element with an absorption edge in the high energy range must be added to make use of this effect. Common x-ray contrast agents contain iodine (Z = 53) or gadolinium (Z = 64) with K-shell binding energies above 30 keV (EB = 33 and 50 keV, respectively), and can be exploited in the clinical scenario [2]. In order to use the K-edge attenuation discontinuities of lighter elements, such as iron (Z = 26) or zinc (Z = 30), naturally occurring in the human body, an imaging setup sensitive to lower energies is required. This is feasible for x-ray microscopy studies of millimeter to centimeter sized samples.
Our setup, working in a low energy range (4–11 keV), allows us to decompose elements with K-edges in this range (Cr, Mn, Fe, Co, Ni, Cu, Zn, Ga). Further, Lanthanide elements (Z = 57–71), e.g., gadolinium, can be used for materials decomposition due to their L-edge discontinuities. However, L-edges are less dominant in the attenuation spectrum and will be affected more by sample thickness. Energy windows have to be selected as narrow as possible in the vicinity of the absorption edges, to best exploit the contrast difference. Potential limitations are beam hardening effects and photon starvation in narrow energy windows.
In this study, micro-CT material decomposition with a dual-threshold photon counting detector is evaluated in the energy range 4–11 keV. The method is verified using a phantom and applied to biomedical samples containing materials with absorption edges in the given energy range. This method is proposed for spectral evaluation of samples. When requiring higher resolution, higher sensitivity and better energy resolution, this method can be used for pre-scanning to guide sample and region-of-interest (ROI) selection prior to experiments, e.g., x-ray fluorescence or high resolution imaging, at a synchrotron or other large scale facilities. With time and access being the limiting factors at large facilities, this approach has the potential to use allocated time more efficiently.
2. Materials and Methods
2.1. Imaging System
The imaging system (see Figure 1) consists of an Eiger 2R 500 K photon counting detector from Dectris Ltd. (Baden, Switzerland), a prototype solid anode micro-focus x-ray source from Excillum AB (Stockholm, Sweden), and motorized stages for sample alignment.
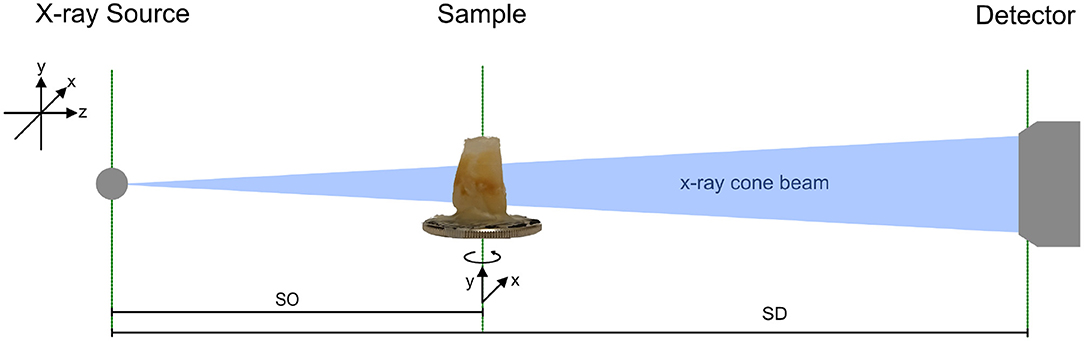
Figure 1. Sketch of the imaging setup consisting of an x-ray source, sample holder with three motorized degrees of freedom, and a photon counting detector. The sample can be translated manually along beam direction. SO indicates the distance from the source to the object (sample) and SD is the distance from the source to the detector, which is 0.55 m for all measurements.
The x-ray source is equipped with a tungsten anode and is operated at 70 kV acceleration voltage. A 10 μm spot is calibrated and internally verified, the emission power is set to 15 W. The sample is mounted on a rotation stage for tomographic acquisitions, on top of two linear stages for vertical and horizontal alignment. Sample tower and detector are rail-mounted for optional translation along the optical axis of the system. However, in the present experiment, the detector is kept at 0.55 m from the source where the sensor is fully illuminated by x-rays.
The detector has a pixel size of 75 μm an consists of 1,030 × 514 pixels in total resulting in an active area of 77.25 × 38.625 mm2. Each pixel contains two configurable energy thresholds, with an energy resolution of 1.43 keV FWHM at 8 keV. The sensor material is 450 μm silicon, which has almost 100% quantum efficiency up to 10 keV and then drops to 35% at 20 keV and 10% at 30 keV as measured by [18]. Stable detector operation requires limitation of the usable threshold range from 4 to 11 keV [see technical specifications from [19]]. Projections are acquired in difference mode, i.e., the detector creates an image containing only energies between the two configured thresholds.
To guide the energy window selection, multiple radiographies with different threshold energies are acquired. From these images, a variety of energy windows are created, by subtracting the lower from the upper threshold retaining only energies between both thresholds, and the transmission at different thresholds is evaluated resulting in an optimal energy window (see Figure 2), which retains the absorption difference while maximizing the amount of photons. Also, the energy resolution of the detector has to be considered, thus limiting the minimum width of energy windows to around 1.5 keV. Selected energy windows are then used during the CT acquisition, where the detector is configured in difference mode directly providing an image in a certain energy range, which is the difference between two images acquired at two different thresholds. With the current detector, two acquisitions per position are necessary since only one energy window can be obtained at the same time. A detector with four or more thresholds would avert this limitation.
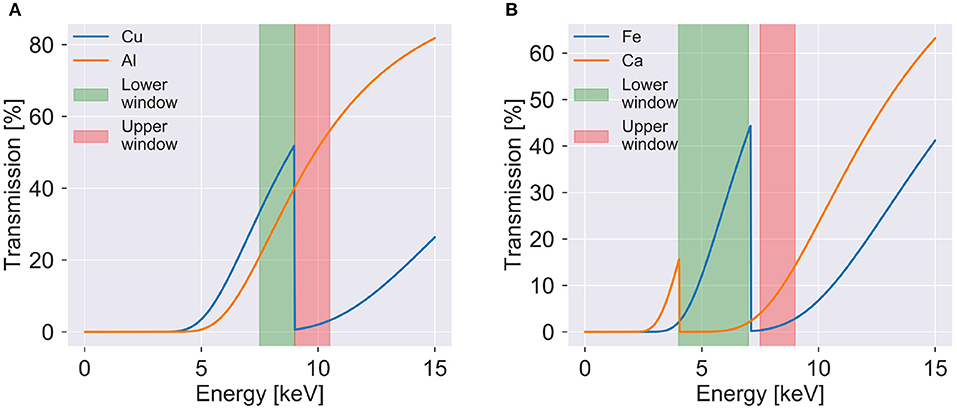
Figure 2. Transmission as function of photon energy to visualize the K-edges and used energy windows for (A) the verification sample and (B) the plaque samples. The transmission is shown for 20 μm of copper and 100 μm of aluminum in (A) and 20 μm of iron and 100 μm of calcium in (B). The upper and lower energy windows used for the verification sample and plaque 1 are shown on each side of the copper and iron K-edges, respectively. Simulated transmission data from [20].
2.2. Image Processing and Reconstruction
The raw images contain broken, under- and over-responsive pixels, which have to be removed from the image to avoid artifacts in the reconstruction. The detector contains masked pixels, which can be easily identified. Depending on the energy threshold, additional pixels have to be removed. Such pixels are identified by lying above or below a certain amount of counts or showing a large difference from the standard deviation of the image. Identified pixels are filled with an average value based on their surrounding pixels, which is obtained via a median filter. The same correction is applied to the flat-field images before dividing the images with their corresponding flat-field. Further, the corrected images are adjusted to a maximum pixel value of 1, to avoid outliers when calculating attenuation images applying the negative natural logarithm.
Reconstruction is performed via the ASTRA toolbox developed by [21, 22] inside a MATLAB (Mathworks) environment. The toolbox uses a GPU implementation of the filtered back-projection algorithm for cone beam geometry developed by [23]. Further, center of rotation correction, tilt correction, and ring filtering using an additive or wavelet filter as implemented by [24] are applied.
2.3. Decomposition Algorithm
Post reconstruction material decomposition is used in this study, as described by [4], [25], and [15]. It is executed on two different energy ranges obtained with a polychromatic x-ray source. The attenuation coefficient μE of each voxel is described as a linear combination of the volume fraction fi multiplied with the corresponding attenuation coefficients μi,E of different materials i = 1, 2, 3. Thus, the attenuation coefficient of any voxel in a given energy window can be determined by Equation (1). The attenuation coefficient of any μi,E corresponds to 100% of a given material. Exact quantities can be obtained when using a reference sample with known material compositions.
Individual attenuation coefficients are obtained from selected regions using both energy windows as described by [26]. Since Equation (1) contains three unknown fractions fi, a constraint is added that fractions f1, f2, and f3 sum up to 1. Thus, an equation system can be created to calculate three different material images using two energy windows constructing Equation (2), which can be solved for three unknown materials.
Material images can be improved by adding a constraint that the material fractions are non-negative and solving a non-negative least squares problem with an iterative algorithm finding the best fitting fractions within the given bounds. This approach has been demonstrated by [25] and results in a noticeable improvement of image quality compared to only using the matrix multiplication from Equation (2). In this study, we utilized the approach described by [25].
2.4. Samples
To verify the method, a phantom consisting of copper and aluminum was constructed. The individual wires of a copper cable were spread out and a rod of tightly folded aluminum foil was fixated in the center of the cable. Energy windows were selected around the K-edge of copper at 8.99 keV (see Figure 2A). Seven hundred and twenty projections evenly spread out over 360 degrees were acquired with an exposure time of 100 s per image. Data acquisition parameters can be found in Table 1.

Table 1. Image acquisition parameters.
To demonstrate the materials decomposition method on biomedical samples, paraffin embedded human atherosclerotic plaques were imaged. Samples were obtained from patients that had undergone carotid endarterectomy after a stroke or transient ischemic attack. All patients gave informed consent and the study was approved by the local Swedish Ethical Review Authority (registration number 472/2005). These samples contain large calcified areas containing large concentrations of calcium. These samples also have areas with hemorrhage and iron deposits. For the decomposition, the K-edge of iron at 7.11 keV was used to select suitable energy windows (see Figure 2B). In the material decomposition, the samples were decomposed into iron rich tissue, calcium rich tissue, and paraffin. Differentiation between soft tissue and paraffin was not possible due to the absence of absorption edges and very similar attenuation.
Reconstructed datasets [see [27]] and analysis code [see [28]] are available online.
3. Results
3.1. Verification Sample
The attenuation in selected regions in radiographies of the verification sample (see Figure 3A) are shown as function of the energy window in Figure 3B. The plot was created to assist the selection of optimal energy windows. Attenuation plots were created for all samples (see Supplementary Figures 1, 2). For the verification sample energy windows between 7.5–9 and 9–10.5 keV were chosen, which are shown in Figures 3C,D.
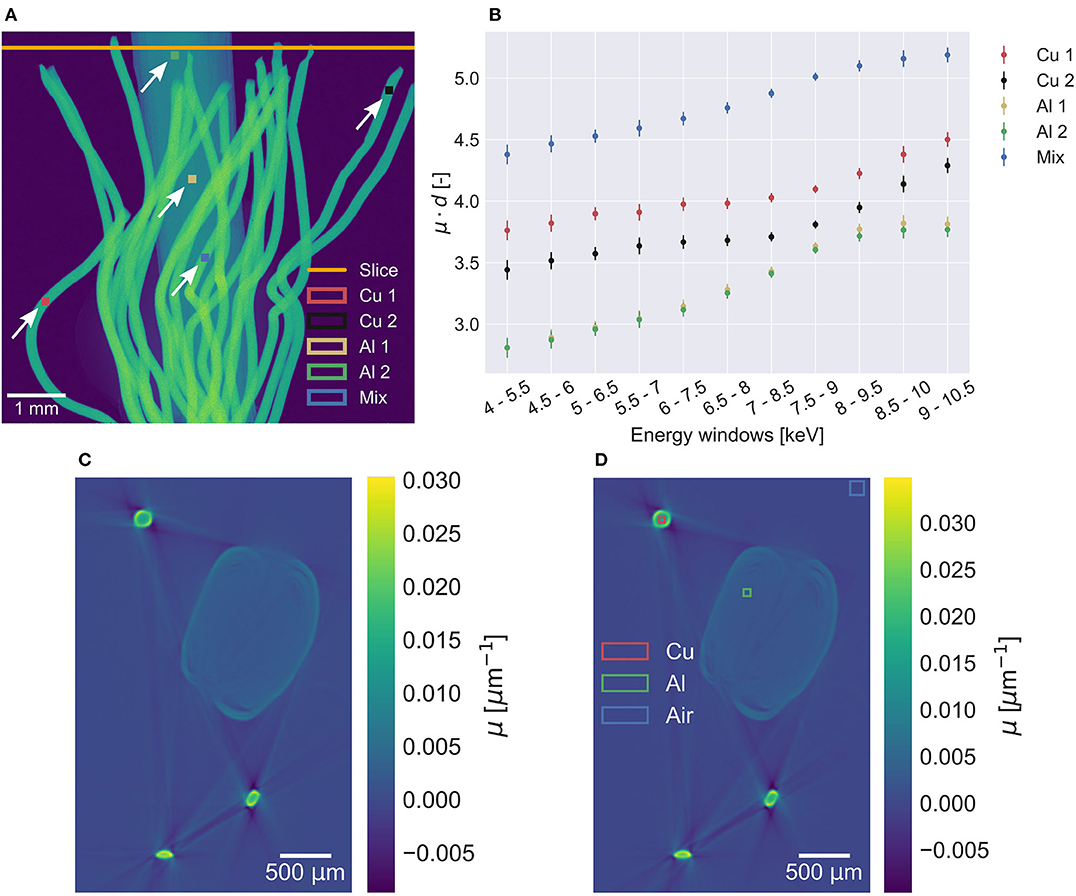
Figure 3. (A) Two copper regions, two aluminum regions and one mixed region selected in the verification sample radiography for energy window selection. The orange line represents the slice used for decomposition. (B) Measured attenuation in the regions plotted as function of energy windows. (C) Lower (7.5–9 keV) and (D) upper (9–10.5 keV) energy window images used for the decomposition of the verification sample. Only a small difference in attenuation between the energy windows are measured, resulting in the visually nearly identical energy window images. In the upper energy window, the regions used for material decomposition values are shown.
Beam hardening, mainly seen as streaking artifacts in the energy windows affect the material decomposition as seen in Figure 4. Decomposed images are strongly affected by ring artifacts, which are barely visible in the energy windows (see Figures 3C,D). This can be seen particularly well in the aluminum foil in Figure 4. In general, the decomposition method works with the three material regions having a material fraction of 1 or close to 1 of the respective material. Lower fractions of both copper and air are measured within the aluminum foil.
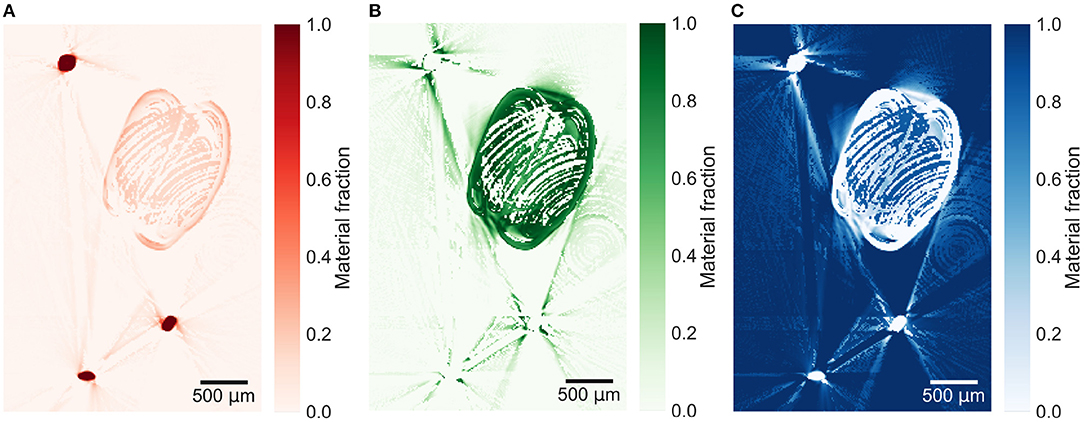
Figure 4. Material decomposed images of (A) copper, (B) aluminum, and (C) air from the verification sample. The effect of ring and beam hardening artifacts on the decomposition is prominent.
3.2. Biomedical Samples
The reconstructed energy windows used for the plaque samples decompositions are shown in Supplementary Figures 3–5. The material decomposition of a slice in plaque 1 in Figure 5 shows a distinct distribution of calcium within the calcification. All plaque samples are decomposed based on the decomposition attenuation values from plaque 1, enabling relative comparison between the material fractions in the different slices. The decomposition of a lower slice (257), shown in Figure 6, in plaque 2 shows a similar distribution but with lower fractions of iron and calcium. An upper slice (14) in plaque 2, shown in Figure 7, barely contains any iron and only a low fraction of calcium compared to the other slices. The higher fraction of iron along the edges of the calcifications in all slices is most probably an artifact caused by beam hardening.
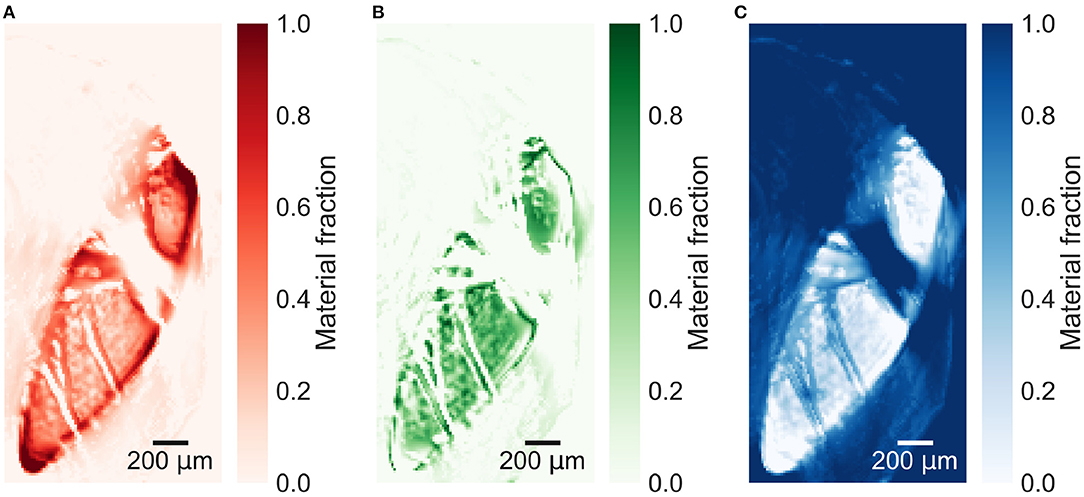
Figure 5. Material decomposed images of (A) iron, (B) calcium, and (C) paraffin from a slice in plaque 1.
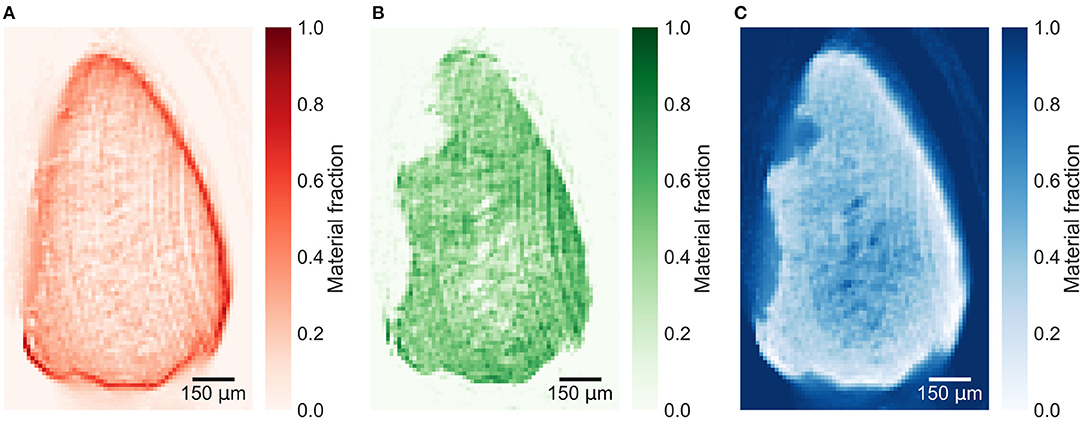
Figure 6. Material decomposed images of (A) iron, (B) calcium, and (C) paraffin from a lower slice (257) in plaque 2. Decomposed with decomposition attenuation values from plaque 1 allowing to compare the relative material fractions. The high iron signal around the calcification might be caused mostly by beam hardening.
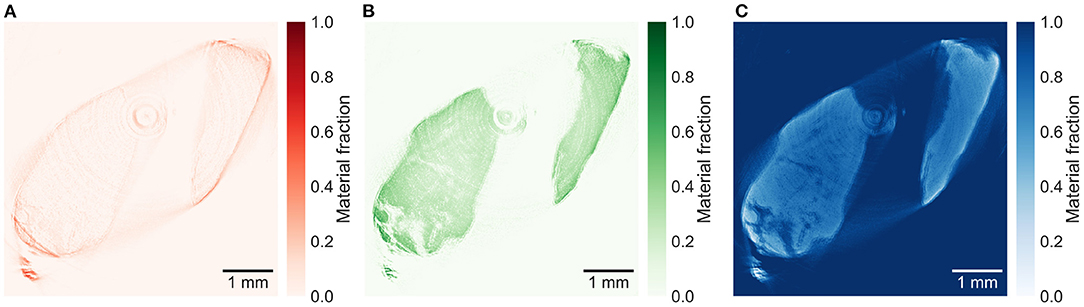
Figure 7. Material decomposed images of (A) iron, (B) calcium, and (C) paraffin from an upper slice (14) in plaque 2. Decomposed with decomposition attenuation values from plaque 1 allowing to compare the relative material fractions. The iron image (A) shows almost no iron inside the sample, while the iron signal around the sample might be mostly caused by beam hardening.
4. Discussion
The verification sample demonstrates that the implemented decomposition method works, albeit the result is affected by beam hardening and ring artifacts.
The attenuation plot in Figure 3B does not show the theoretically expected decrease of the attenuation with increasing energy. But the increase of the attenuation in the copper regions after the copper K-edge at 8.99 keV is visible, enabling the identification of copper in the sample.
For the verification sample, the selection of regions for material decomposition attenuation values are straight forward as the materials are well-separated. For the plaque sample, a region representing iron was selected in an area with a high increase of attenuation but not in the outermost edge of the calcification where beam hardening is affecting the measured attenuation. In similarity with the increase in attenuation with energy of aluminum in Figure 3B, almost the whole calcification increased in attenuation in the upper energy window. Therefore, a region representing calcium was selected within the calcification with only a slight increase in attenuation. The selected regions are shown in Supplementary Figure 3.
The highest content of both iron and calcium was measured in the slice in plaque 1. Slices 14 and 257 in plaque 2 are from different calcifications in the plaque. Comparing the decomposition of these slices, it is clear that there are differences in the material content of calcifications within a plaque.
The implemented post-image reconstruction material decomposition method decomposes the sample into three basic materials. With the constraint that the material fractions should sum up to 1, a third material can be obtained from only two images. Hence, the addition of more energy windows should in theory enable the decomposition of more materials.
The method shows potential to be used as a pre-scanning method to identify regions of interest for further investigation, such as measurements at a synchrotron facility and histo-chemical analysis.
While the low energy range limits the sample size, it also allows for exploiting the K-edge attenuation discontinuity of naturally occurring elements. In the application of x-ray micro-tomography, the energy range applied here is compatible with soft tissue samples extracted in clinical routines.
Material decomposition attenuation values are manually selected in the reconstructed images. Therefore, a priori knowledge about the sample is necessary for calibration and the outcome of the decomposition is highly dependent on the operator. In this paper, the three plaque slices have been decomposed based on the same values from plaque 1 for relative comparison between the slices. To be noted is that a material fraction of 1 does not mean that the volume contains only one solid material but that it has the same content as the volume selected to represent 100% of the given material. For future work, a calibration sample with known concentrations of iron, calcium and paraffin could be constructed for quantitative data analysis. Decompositions performed with decomposition attenuation values from the known material concentrations would result in a material fraction corresponding to a known concentration. Hence, a calibration sample would enable quantification of the material concentrations, absolute comparison between samples and eliminate the dependency on the operator.
Data Availability Statement
The datasets presented in this study can be found in online repositories. The names of the repository/repositories and accession number(s) can be found at: www.osf.io/wmvn2.
Ethics Statement
The studies involving human participants were reviewed and approved by Local Swedish Ethical Review Authority (registration number 472/2005). The patients/participants provided their written informed consent to participate in this study.
Author Contributions
The research project was proposed by MB and TD. Experiments were designed by TD and RS, and executed by RS. Data was obtained and analyzed by RS and IG. The manuscript was written by RS and TD, with revisions from MB and IG. All authors contributed to the article and approved the submitted version.
Funding
This project has been financially supported by the Swedish research council (grant number 2014-06054 and 2019-01260), by the Swedish Foundation for Strategic Research (grant number ID17-0097) and by Carl Tryggers Stiftelse (grant number CTS17:45).
Conflict of Interest
The authors declare that the research was conducted in the absence of any commercial or financial relationships that could be construed as a potential conflict of interest.
Acknowledgments
The authors acknowledge Lena Sundius and Ana Persson (Clinical Research Centre Malmö, Skåne University Hospital, Malmö, Sweden) for providing the atherosclerotic plaque samples.
Supplementary Material
The Supplementary Material for this article can be found online at: https://www.frontiersin.org/articles/10.3389/fphy.2021.673843/full#supplementary-material
References
1. Alvarez RE, Macovski A. Energy-selective reconstructions in X-ray computerized tomography. Phys Med Biol. (1976) 21:733–44. doi: 10.1088/0031-9155/21/5/002
2. Roessl E, Proksa R. K-edge imaging in x-ray computed tomography using multi-bin photon counting detectors. Phys Med Biol. (2007) 52:4679–96. doi: 10.1088/0031-9155/52/15/020
3. Wang X, Meier D, Taguchi K, Wagenaar DJ, Patt BE, Frey EC. Material separation in x-ray CT with energy resolved photon-counting detectors. Med Phys. (2011) 38:1534–46. doi: 10.1118/1.3553401
4. Granton PV, Pollmann SI, Ford NL, Drangova M, Holdsworth DW. Implementation of dual- and triple-energy cone-beam micro-CT for postreconstruction material decomposition. Med Phys. (2008) 35:5030–42. doi: 10.1118/1.2987668
5. Lehmann L, Alvarez R, Macovski A, Brody W, Pelc N, Riederer SJ, et al. Generalized image combinations in dual KVP digital radiography. Med Phys. (1981) 8:659–67. doi: 10.1118/1.595025
6. Kappadath SC, Shaw CC. Quantitative evaluation of dual-energy digital mammography for calcification imaging. Phys Med Biol. (2004) 49:2563–76. doi: 10.1088/0031-9155/49/12/007
7. Johnson TRC, Nikolaou K, Wintersperger BJ, Leber AW, von Ziegler F, Rist C, et al. Dual-source CT cardiac imaging: initial experience. Eur Radiol. (2006) 16:1409–15. doi: 10.1007/s00330-006-0298-y
8. Flohr TG, McCollough CH, Bruder H, Petersilka M, Gruber K, Su C, et al. First performance evaluation of a dual-source CT (DSCT) system. Eur Radiol. (2006) 16:256–68. doi: 10.1007/s00330-005-2919-2
9. Riederer I, Si-Mohamed S, Ehn S, Bar-Ness D, Noel PB, Fingerle AA, et al. Differentiation between blood and iodine in a bovine brainInitial experience with Spectral Photon-Counting Computed Tomography (SPCCT). PLoS ONE. (2019) 14:e0212679. doi: 10.1371/journal.pone.0212679
10. Shikhaliev PM, Fritz SG. Photon counting spectral CT versus conventional CT: comparative evaluation for breast imaging application. Phys Med Biol. (2011) 56:1905–30. doi: 10.1088/0031-9155/56/7/001
11. Marfo E, Anderson NG, Butler APH, Schleich N, Carbonez P, Damet J, et al. Assessment of material identification errors, image quality and radiation doses using small animal spectral photon-counting CT. IEEE Trans Radiat Plasma Med Sci. (2020) 7311:1. doi: 10.1109/TRPMS.2020.3003260
12. Williams GM, Rhee J, Zou H, Lee A, Ross S. Dual threshold X-ray photon counting pixel array detector. In: IEEE Nuclear Science Symposium Conference Record Seoul (2013). doi: 10.1109/NSSMIC.2013.6829841
13. Taguchi K, Iwanczyk JS. Vision 20/20: single photon counting x-ray detectors in medical imaging. Med Phys. (2013) 40:100901. doi: 10.1118/1.4820371
14. Willemink MJ, Persson M, Pourmorteza A, Pelc NJ, Fleischmann D. Photon-counting CT: technical principles and clinical prospects. Radiology. (2018) 289:293–312. doi: 10.1148/radiol.2018172656
15. Bateman CJ, Knight D, Brandwacht B, Mahon JM, Healy J, Panta R, et al. MARS-MD: Rejection based image domain material decomposition. J Instrum. (2018) 13:P05020. doi: 10.1088/1748-0221/13/05/P05020
16. Leng S, Bruesewitz M, Tao S, Rajendran K, Halaweish AF, Campeau NG, et al. Photon-counting detector CT: system design and clinical applications of an emerging technology. Radiographics. (2019) 39:729–43. doi: 10.1148/rg.2019180115
17. Llopart X, Ballabriga R, Campbell M, Tlustos L, Wong W. Timepix, a 65k programmable pixel readout chip for arrival time, energy and/or photon counting measurements. Nucl Instrum Methods Phys Res Sect A. (2007) 581:485–94. doi: 10.1016/j.nima.2007.08.079
18. Donath T, Brandstetter S, Cibik L, Commichau S, Hofer P, Krumrey M, et al. Characterization of the PILATUS photon-counting pixel detector for X-ray energies from 1.75 keV to 60 keV. J Phys. (2013) 425:062001. doi: 10.1088/1742-6596/425/6/062001
19. Dectris Ltd. Technical Specifications EIGER2 R 500K Detector Systems. Dectris Ltd (2018). Available online at: www.dectris.com.
20. Henke BL, Gullikson EM, Davis JC. X-ray interactions: photoabsorption, scattering, transmission, and reflection at E = 50-30,000 eV, Z = 1-92. Atom Data Nucl Data Tables. (1993) 54:181–342. doi: 10.1006/adnd.1993.1013
21. van Aarle W, Palenstijn WJ, De Beenhouwer J, Altantzis T, Bals S, Batenburg KJ, et al. The ASTRA toolbox: a platform for advanced algorithm development in electron tomography. Ultramicroscopy. (2015) 157:35–47. doi: 10.1016/j.ultramic.2015.05.002
22. van Aarle W, Palenstijn WJ, Cant J, Janssens E, Bleichrodt F, Dabravolski A, et al. Fast and flexible X-ray tomography using the ASTRA toolbox. Opt Exp. (2016) 24:25129. doi: 10.1364/OE.24.025129
23. Feldkamp La, Davis LC, Kress JW. Practical cone-beam algorithm. J Opt Soc Am A. (1984) 1:612. doi: 10.1364/JOSAA.1.000612
24. Lohse LM, Robisch AL, Tøopperwien M, Maretzke S, Krenkel M, Hagemann J, et al. A phase-retrieval toolbox for X-ray holography and tomography. J Synchr Radiat. (2020) 27:852–9. doi: 10.1107/S1600577520002398
25. Badea CT, Guo X, Clark D, Johnston SM, Marshall CD, Piantadosi CA. Dual-energy micro-CT of the rodent lung. Am J Physiol Lung Cell Mol Physiol. (2012) 302:L1088–97. doi: 10.1152/ajplung.00359.2011
26. Handschuh S, Beisser CJ, Ruthensteiner B, Metscher BD. Microscopic dual-energy CT (microDECT): a flexible tool for multichannel ex vivo 3D imaging of biological specimens. J Microsc. (2017) 267:3–26. doi: 10.1111/jmi.12543
27. Solem R, Dreier T, Bech M. Low-Energy Micro-CT Material Decomposition Data (2021). Available online at: http://www.osf.io/wmvn2
28. Solem R, Dreier T, Bech M. Decomposition Scripts. (2021). Available online at: https://gitlab.com/medluxray/material-decomposition
Keywords: material decomposition, micro tomography, x-ray imaging, photon-counting detectors, biomedical imaging
Citation: Solem R, Dreier T, Goncalves I and Bech M (2021) Material Decomposition in Low-Energy Micro-CT Using a Dual-Threshold Photon Counting X-Ray Detector. Front. Phys. 9:673843. doi: 10.3389/fphy.2021.673843
Received: 28 February 2021; Accepted: 12 April 2021;
Published: 10 May 2021.
Edited by:
Kris Thielemans, University College London, United KingdomReviewed by:
Carlo Fiorini, Politecnico di Milano, ItalyGabriele Giacomini, Brookhaven National Laboratory (DOE), United States
Copyright © 2021 Solem, Dreier, Goncalves and Bech. This is an open-access article distributed under the terms of the Creative Commons Attribution License (CC BY). The use, distribution or reproduction in other forums is permitted, provided the original author(s) and the copyright owner(s) are credited and that the original publication in this journal is cited, in accordance with accepted academic practice. No use, distribution or reproduction is permitted which does not comply with these terms.
*Correspondence: Martin Bech, bWFydGluLmJlY2hAbWVkLmx1LnNl