 Yu Zhao
 Q. Q. Wang1*
- 1School of Optics and Photonics, Beijing Institute of Technology, Beijing, China
- 2School of Information and Communication Engineering, North University of China, Taiyuan, China
Real-time explosive detectors must be developed to facilitate the rapid implementation of appropriate protective measures against terrorism. We report a simple yet efficient methodology to classify three explosives and three non-explosives by using laser-induced breakdown spectroscopy. However, the similarity existing among the spectral emissions collected from the explosives resulted in the difficulty of separating samples. We calculated the weights of lines by using the ReliefF algorithm and then selected six line regions that could be identified from the arrangement of weights to calculate the area of each line region. A multivariate statistical method involving support vector machines was followed for the construction of the classification model. Several models were constructed using full spectra, 13 lines, and 100 lines selected by the arrangement of weights and areas of the selected line regions. The highest correct classification rate of the model reached 100% by using the six line regions.
Introduction
In recent years, explosions from terrorist attacks have spread across the globe. The advanced detection of explosives has attracted the interest of scientists in communities. Many techniques for explosive detection are well established and include Gas chromatography-Mass spectrometry [1]; Terahertz spectroscopy [2]; Raman spectroscopy [3–5]; photo-fragmentation, followed by laser-induced fluorescence [6]; and photoacoustic spectroscopy [7]. Although explosives can be detected by these advanced spectral methods, they require sample pretreatment and long detection time. A fast, in-situ method should be developed to identify hidden explosives in transit areas characterized by a high flux of people and goods. Hidden explosives can be recognized through the detection of their trace vapors or dispersed particles. The capabilities of laser-induced breakdown spectroscopy (LIBS) make it an attractive technique for the ultra-rapid, in situ identification of explosives [7, 8]. Given the atomic spectroscopy technique of LIBS, molecularly specific chemical identification is complicated by the similar stoichiometry of threats. Spectrochemical information obtained from a surface interrogated by LIBS provides the elemental composition of a potential surface contaminant and the surface through ablation. From an analytical point of view, explosives with different molecular structures and substantially constituent elements can be identified by atom emission [9–11].
LIBS is a rapid detection method with high efficiency and accuracy. In LIBS, a tightly focused laser pulse (usually a nanosecond laser) is used to create a micro plasma (10,000–20,000 K) on the surface of a sample. During cooling, the hot plasma emits light radiation at characteristic wavelengths; the radiation provides information on the identity of the elemental and molecular species present in the sample. LIBS has been prolifically evaluated for the detection/identification of explosive residues [12–26], chemical and biological materials [27–29], landmines [30], geological materials [28], and plastic [31]; for food authentication [32]; and other applications [33]. As an emerging analytical tool, LIBS has numerous advantages, including in situ application, ability to detect multiple elements and trace materials, and rapid microanalysis; it also does not require a separate sample preparation process [34].
Among the multivariate techniques demonstrated to be viable to classify an unknown sample as an explosive or a harmless product, the most widely used is elemental peaks ratios [35], principal component analysis (PCA) [36–41]. Several other chemometric methods, including soft independent modeling of class analogy [42], partial least squares Discriminant Analysis (PLS-DA) [43, 44], support vector machines (SVMs) [45], and artificial neural network, have been applied to LIBS spectra for classification and identification [46]. For example, Gottfried et al. applied PCA and PLS-DA on the LIBS spectra of carbonate, fluorite, silicate, and soil and reported a correct classification rate (CCR) of >95%. Femtosecond laser is also used to investigate spectral signatures of molecular and atomic species in air and argon atmospheres to correlate the spectral emission with the chemical structure for energetic materials, the correlation studies are expected to support the understanding and improve the discrimination procedures for hazardous materials [47, 48].
In the current paper, we present the results of our initial classification studies for three common explosives, namely, RDX, HMX, CL-20, and three interferences, namely, flour, talcum powder, and polytetrafluoroethylene (PTFE). The principal component that contains most of the variance information of the PCA algorithm is often used for data processing. However, the useful information that classifies different samples is not necessarily projected on the components with large variance. Selecting the principal component by using differences in contribution degrees will lead to serious information loss and classification deterioration. From the perspective of classification, the ReliefF algorithm selects the components with high weight and good effect as principal components to avoid the loss of important information in PCA algorithm. Therefore, we used a chemometric SVM method for the classification of the six test samples. We divided the spectral data of the tested samples into training and test sets. We calculated the weight of the lines of the training set by using the ReliefF algorithm and then selected element lines that could be identified from the National Institute of Standards and Technology database on the basis of the arrangement of weight to construct an SVM model for the classification of the samples. The data size and calculation time were decreased by using the element lines instead of complete spectra as input variables for the SVM model. Although our proposed methodology has only been applied to six samples, it could be generalized and possibly used to classify other explosives.
Materials and Methods
Experimental Setup
A schematic of the LIBS set-up used in this work is shown in Figure 1. Plasma was generated using an actively Q-switched Nd:YAG nanosecond laser. Typical lasers were used for the LIBS experiments. The lasers produced 10 ns and 80 mJ pulses at 1,064 nm with a maximum repetition rate of 10 Hz. Laser beam transmission was adjusted using three reflective mirrors and focused by a 100 mm convex lens onto the sample surface. The sample was mounted on an X-Y-Z translation stage with a resolution of 0.1 mm. We ensured that each laser pulse interacts with the fresh area of the sample. Emission from a plasma spark was collected by a two-fiber optic bundle that was 600 μm in diameter. A lens with a 30 mm focal length and 25 mm diameter was placed in front of the fiber bundle to sufficiently focus the plasma spark, thus allowing each fiber to collect the same emission. Each fiber output was sent to a two-channel-gated charge-coupled device (CCD) spectrometer developed by AVANTES B.V. Spectral information from each CCD was stitched together to yield LIBS spectra with a full spectral coverage of 190–1,100 nm and resolution of 0.3 nm. The operation of the spectrometer was controlled using customized electronics, including a high-speed photodetector and a digital delay/pulse generator (DG535). DG535 was connected to a photodetector, which produced a delay signal upon detecting a plasma spark to control spectral collection by the spectrometer. All LIBS spectra were collected with a 1.28 μs delay to eliminate plasma continuum effects and a 2 ms integration time synchronized with the shooting of the laser pulse.
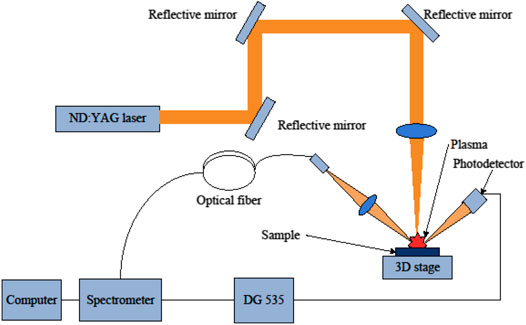
FIGURE 1. Experimental LIBS setup.
Sample Preparation
Explosive samples of research-grade RDX (C3H6N6O6), HMX (C4H8N8O8), and CL-20 (C6H6N12O12) were provided by our School of Materials Science and Engineering at the Beijing Institute of Technology. The three possible interferent samples flour, talcum powder, and PTFE were also used for the study. All of the samples were in powder form. A piece of double-sided adhesive tape was secured on a glass slide, and the sample powder (approximately 1 g or less) was then crushed and spread with a Teflon block on top of the tape. Excess sample was shaken off, leaving a uniform thin layer of powder on the tape. We used the ultrasonic thickness gauge DR85 to measure the thickness of the powder layer which the total amount of sample with a thickness of 20 μm on 20 × 40 mm2-thin films upon the tape was approximately 20–30 mg.
Data Acquisition and Analysis
Although a double-sided adhesive tape is composed of organic compounds containing C, H, N, O, and other elements, we ignored the interference of the tape to the test the samples because of its weak spectral intensity. Multiple LIBS spectra were collected for each thin film. Each LIBS spectrum was collected from a single laser pulse and on a fresh shot. A total of 100 individual spectra from each sample of thin film were acquired. The spectra of each sample were randomly divided into two parts: training set and test set. For each sample, 70 spectra were used as the training set to build the classification model, and the 30 remaining spectra of each sample served as the test set to assess the discrimination ability of the model. Data analysis was performed without applying any spectral subtraction to the datasets.
For our LIBS experimental platform, we used SVM Toolbox program in Matlab version 2016a (MathWorks, Natick, United States) running Win7 on an Intel Core i7-4790K CPU with a 3.6 GHz processor and 8 GB of RAM. The LIBS spectrum collection software was provided by AVANTES B.V.
Results
Figure 2 shows the LIBS spectra of the six samples on a slide collected from a single pulse in ambient air. The features of interest were the atomic emission peaks labeled in the spectra. All of the samples, except for talcum powder, exhibited similar LIBS spectral characteristics in the 230–1,000 nm region. Each spectrum of the samples consisted of numerous strong emission lines contributed by Ca, Na, Mg, K, Fe, O, H, and N, whereas that of the explosives exhibited few strong emission lines. In the spectra of the explosives, O and N emission lines could be attributed to ambient air, whereas Ca, Na, K, Fe, and Mg emission lines were likely from common contaminants. In flour, the intensity of K lines was stronger than that of the five other samples because of nutritional requirements. CN lines, the characteristic emission feature of the spectra of explosives, were absent from the spectra of the talcum powder. Regardless of ablation mechanisms and dissociation pathways followed by any organic compound, all of the spectra of the explosives showed sequences of the violet system attributed to the CN fragment, which is generated mainly through the recombination of C with atmospheric N in the plume. C2 lines, another characteristic emission feature of organic compound, were present in the PTFE, which were mostly attributed to C=C fragments. Table 1 shows the major spectral lines of the six samples.
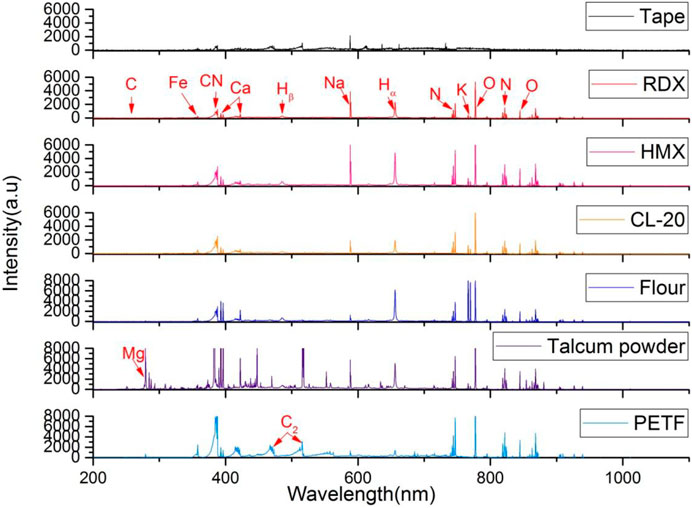
FIGURE 2. Representation spectra of the six samples: CL-20, HMX, RDX, flour, talcum powder, and PTFE.
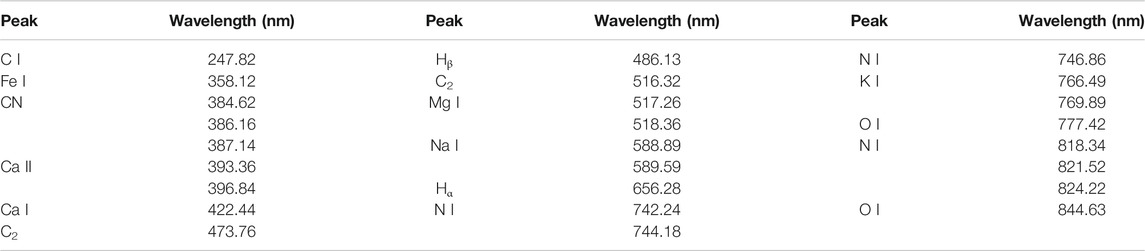
TABLE 1. Major emission lines of six samples.
Discussion
SVM Model Using Full Spectra
To classify the six samples, we used SVM multivariate analysis to construct a classification model. SVM is a very common classifier. It has been popular for more than 10 years, and its classification ability is stronger than that of neural networks. The discrimination model was built on the basis of three one-versus-one SVM classifiers. SVM classifiers distinguish two classes of data by finding the best hyperplane that separates the data points of one class from those of the other class. In cases when binary classification problems do not have a simple hyperplane as a useful separating criterion, nonlinear transformation with kernel functions can be used [49].
A total of 420 full spectra of the six samples in the training set were used to construct the SVM model. The model built by using the min–max normalization preprocessing of full spectral data was called SVM1. The time needed by our computer to calculate the two models was 35 s. After modeling, we used the test set to assess the discrimination ability of the model. The test set was also constructed using min–max normalization preprocessing with the same parameters used in the model construction preprocessing. Table 2 shows the CCR of the SVM model. The average CCR result of the models reached 93.34%.

TABLE 2. Correct classification rate of SVM1 model using full spectra.
Lines Selected Based on Intensities
To construct a model with few input variables for classification, we studied the distribution of the intensities of different lines. Figure 3 shows the intensities of different lines and their standard deviation. Different samples had different intensities for the same line. For the lines of CN 386.16 nm and Ca 393.366 nm and the Potassium line of K 766.49 nm, PTFE, talcum powder, and flour had the strongest intensity, respectively. The lines of H, O, and N had different intensities in the six samples, which may be beneficial to the classification. A 3D plot of the intensity of Na 588.89 nm versus that of H 656.28 nm and K 766.49 nm, which had high weight values, is shown in Figure 4. The data separated into three distinct clusters. The first cluster comprised flour, which evidently separated from the other samples. The second cluster comprised HMX and talcum powder, which slightly overlapped. The third cluster comprised CL-20, RDX, and PTFE, which seriously overlapped. A 3D plot of the intensity of H 656.28 nm versus that of O 777.417 nm and N 742.24 nm is shown in Figure 5. The data of the six samples separated into six distinct clusters, indicating that three lines would be beneficial for classification. Because the spectral line of C 247 nm was not obvious and the carbon element had a strong peak in the CN band, two characteristic spectral lines CN 386.16 nm and CN 387.14 nm were selected to represent the carbon element. According to the composition of the elements, Ca 393.36 nm, Ca 396.84 nm, Na 588.89 nm, Na 589.59 nm, Hα 656.28 nm, N 742.24 nm, N 744.18 nm, N 746.86 nm, K 766.49 nm, K 769.89 nm, O 777.42 nm were very easy to identify as a single characteristic spectral line with high intensity. A total thirteen lines were selected to construct the SVM models. Table 3 lists the selected lines to construct the model. An SVM model called SVM2 was constructed using the 13 lines and test set to assess the discrimination ability of the model. Table 4 shows the CCR of the model. The CCR of the model was up to 99.44%.
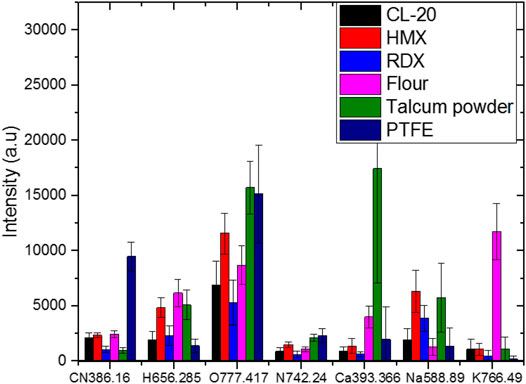
FIGURE 3. Intensity of different lines and their standard deviation.
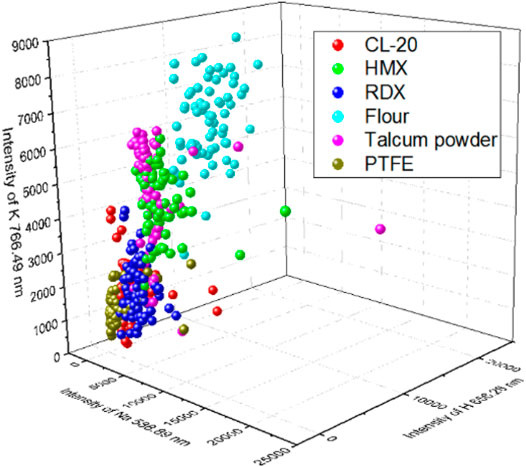
FIGURE 4. 3D plot of the intensity of Na 588.89 nm, H 656.28 nm, and K 766.49 nm.
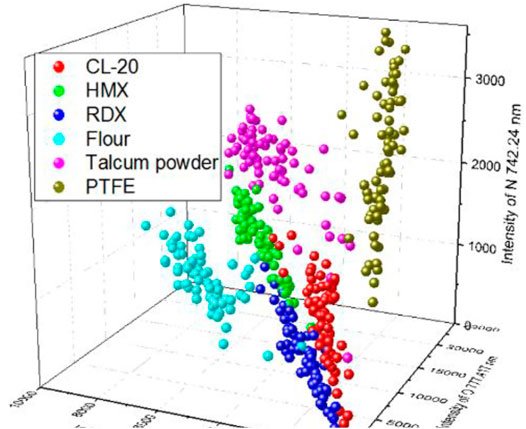
FIGURE 5. 3D plot of the intensity of H 656.28 nm, O 777.417 nm, and N 742.24 nm.
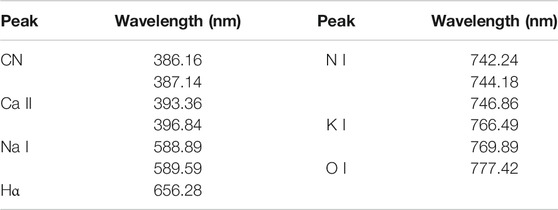
TABLE 3. Thirteen lines selected to construct SVM models.

TABLE 4. Correct classification rate of SVM2 model using thirteen lines.
Feature Selection Based on the relieff Algorithm
The Relief algorithm was first proposed by Kira [50] and initially limited to classify two types of data. The algorithm is a feature weighting algorithm that assigns different weights on the basis of the correlation of each feature and category. The weights of features that are less than a certain threshold will be removed. The correlation of features and categories in the algorithm is based on the ability of features to distinguish neighboring samples. It is widely used because of its relative simplicity, high operation efficiency, and satisfactory results; however, its limitation is that it can only process two types of data. Therefore, Kononenko [51] proposed ReliefF to extend the Relief algorithm in 1994. ReliefF algorithms can manage multiple categories of problems. They randomly take a sample R from the training sample set, find the k neighbor samples (near hits) from the same class of R and k neighbor samples (near misses) from the different classes of each R in the sample set, and then update the weight of each feature. The weight of each feature can be represented by Eq. (1).
In Eq. (1),
To reduce the calculation time of the model, we used the ReliefF algorithm to calculate the weight of each line of the full spectra (k = 10) and then selected the first 100 lines that involved high weights (weight threshold >0.05). The intensities of 100 lines were selected to construct the SVM models. Similarly, an SVM model called SVM3 was constructed with data preprocessing. The calculation time of the model was 9.2 s in our computer. After modeling, we used the test set to assess the discrimination ability of the model. Table 5 shows the CCR of the model. The CCR result of model reached 98.33%.

TABLE 5. CCR of SVM3 model using 100 lines with high weights (weight threshold >0.05).
Areas of Line Regions Selected From the Weight Calculated by the relieff Algorithm
The value of k, which indicates the number of nearest neighbors in a sample, is crucial because different values of k affect the weight of each line in the ReliefF algorithm. Figure 6 shows the calculated weights of the top 100 lines with different values of k. Several line regions, such as CN bands, Na, Hα, K, and Fe, were easily identified. Na and K contributed higher weights than the non-metallic elements C, N, O, and H, which showed very weak weights, except for Hα. Each line region showed great similarity with different k values. Figure 7 shows the differences of intensity between different line regions. For the CN band region, the difference of six samples was not obvious, except for talcum powder. For talcum powder the lines of Mg 382.97 nm and Mg 383.57 nm contributed most of intensity in CN band region, the main component of which is magnesium silicate (Mg3 [Si4O10](OH)2). For the Potassium line of K 766.49 nm, flour had the strongest intensity, which may be attributed to nutritional needs. In addition, the K line region was composed of two major lines, including K 766.69 nm and K 769.89 nm. Given the low resolution of our spectrometer and Stark broadening, the high weight of lines calculated using ReliefF consisted of center and nearby lines. Therefore, most of the spectral lines with high weight values were composed of the central lines of Na, K, and H and their nearby lines. We selected six line regions that could be easily identified from the top 100 weights and calculated the areas under the line regions. Figure 8 shows the area calculation of CN band region based on the weight threshold (>0.05). We selected the boundary of each line region on the basis of the feature line of elements and calculated the area of region subtracted by the base line. Table 6 shows the selected line regions and their boundaries. All six areas used min–max normalization to construct the SVM model to classify the six samples. Similarly, a model called SVM4 was constructed, and the test set was used to assess the discrimination ability of the model. Table 7 shows the CCR of the model constructed using areas of selected line regions. The CCR of the model reached 100%.
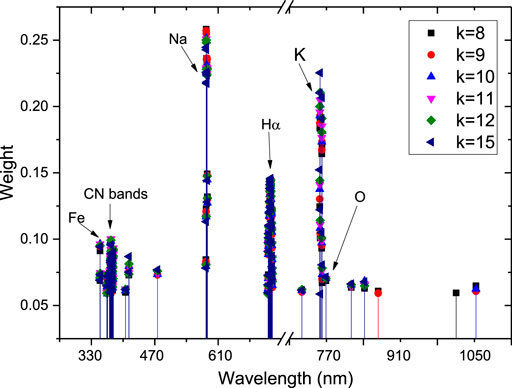
FIGURE 6. Scatter plot of the top 100 weights of lines using different values of nearest neighbors (k).

FIGURE 7. Two-dimensional mapping of intensities of line regions with high weights (A) CL-20, (B) HMX, (C) RDX, (D) flour, (E) talcum powder, (F) PTFE.
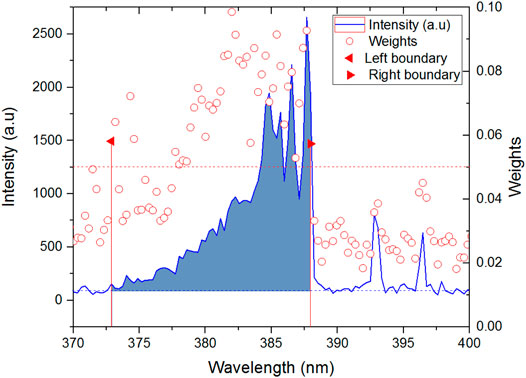
FIGURE 8. Area calculation of CN band line region based on weights by using the ReliefF algorithm. The weight threshold determines the boundary of area, which is used to build the SVM model. The red dotted line represents the weight threshold (0.05). The blue dotted line represents the base line.

TABLE 6. Line regions and their boundaries used to calculate areas.

TABLE 7. CCR of SVM4 model using the areas of six line regions.
In summary, an unsatisfactory result was obtained using the full spectra to classify the six samples. Although we further reduced the number of selected lines to construct the model, the CCR of the model reached 99.44% but was no longer raised. Excellent classification results could be obtained using the ReliefF algorithm to calculate the areas of six line regions instead of the full spectra of a model. In order to construct a classification model with the fewest input variables, we selected six line regions that could be easily identified from the top 100 arranged weights of lines by using the ReliefF algorithm. The boundary of each line region was determined on the basis of the top 100 arranged weights to calculate the area for constructing the classification model. The CCR of the model reached 100%. Most importantly, the line regions selected used to construct a classification model were easy to detect and identify. The few spectral lines selected to construct the model reduced the calculation time and increased the classification efficiency. These advantages promote the potential of the proposed LIBS–SVM model for the accurate and rapid classification of explosives.
Conclusion
Three explosives and three possible interferents were discriminated using the ReliefF algorithm and SVM under laboratory conditions. First, we constructed an SVM model by using the full spectra of the six samples. The CCR of the model reached 93.34%. Second, to construct a model with few input variables for the best classification, we selected 13 lines on the basis of the elemental composition of the organic compounds and the ease of identification to construct the SVM models. The CCR of the models reached 99.44%. Third, we used the ReliefF algorithm to calculate the weight values of each line and then selected 100 lines from the arranged weight values to construct the SVM models. The CCR of the model reached 98.34%. Finally, six line regions selected by using the ReliefF algorithm to construct the SVM classification model. The CCR of the model reached 100%.
This study was performed under atmospheric conditions. O, H, N, and C in the atmosphere could influence the LIBS spectrum of samples. In this study, we acquired the LIBS spectra of pure, not mixed, explosives. Thus, the LIBS spectra of the mixed explosives on the organic substrates were expected to be more complex than those of pure explosives on simple substrates. Further studies on the effects of external factors on the performance of SVM are currently underway.
Data Availability Statement
The raw data supporting the conclusions of this article will be made available by the authors, without undue reservation.
Author Contributions
All the authors have their individual contributions for this manuscript. Conceptualization, YZ and QW; methodology, YZ; software, XC; validation, GT, KW, and HL; formal analysis, XC; investigation, YZ; resources, GT; data curation, KW; writing—original draft preparation, YZ; writing—review and editing, YZ; visualization, XC. All authors have read and agreed to the published version of the manuscript.
Funding
This research was funded by the National Natural Science Foundation (grant number: 61775017) and the Beijing Natural Science Foundation (grant number: 4132063).
Conflict of Interest
The authors declare that the research was conducted in the absence of any commercial or financial relationships that could be construed as a potential conflict of interest.
Acknowledgments
The authors gratefully acknowledge support from the Institute of Chemical Defense–China.
References
1. Sharma SP, Lahiri SC. Characterization and Identification of Explosives and Explosive Residues Using GC-MS, an FTIR Microscope, and HPTLC. J Energetic Mater (2005) 23:239–64. doi:10.1080/07370650591006795
2. Leahy-Hoppa MR., Fitch MJ, Osiander R. Terahertz Spectroscopy Techniques for Explosives Detection. Anal Bioanal Chem (2009) 395:247–57. doi:10.1007/s00216-009-2803-z
3. Carter JC, Angel SM, Lawrence-Snyder M, Scaffidi J, Whipple RE, Reynolds JG Standoff Detection of High Explosive Materials at 50 Meters in Ambient Light Conditions Using a Small Raman Instrument. Appl Spectrosc (2005) 59:769–75. doi:10.1366/0003702054280612
4. Gulati KK, Gulia S, Gambhir T, Kumar N, Gambhir V, Reedy MN Standoff Detection and Identification of Explosives and Hazardous Chemicals in Simulated Real Field Scenario Using Time Gated Raman Spectroscopy. Def Sc Jl (2019) 69:342–47. doi:10.14429/dsj.69.13234
5. Videira-Quintela D, Zapata F, García-Ruiz C. Detection of Microscopic Traces of Explosive Residues on Textile Fabrics by Raman Spectroscopy. J Raman Spectrosc (2018) 49:1668–77. doi:10.1002/jrs.5455
6. Lazic V, Palucci A, De Dominicis L, Nuvoli M, Pistilli M, Menicucci I, et al. Integrated Laser Sensor (ILS) for Remote Surface Analysis: Application for Detecting Explosives in Fingerprints. Sensors (2019) 19:4269. doi:10.3390/s19194269
7. El-Sharkawy YH, Elbasuney S. Novel Laser Induced Photoacoustic Spectroscopy for Instantaneous Trace Detection of Explosive Materials. Forensic Sci Int (2017) 277:215–22. doi:10.1016/j.forsciint.2017.06.005
8. Winefordner JD, Gornushkin IB, Correll T, Gibb E, Smith BW, Omenetto N. Comparing Several Atomic Spectrometric Methods to the Super Stars: Special Emphasis on Laser Induced Breakdown Spectrometry, LIBS, A Future Super Star. J Anal Spectrom (2004) 19:1061–83. doi:10.1039/B400355C
9. Lucena P, Doña A, Tobaria LM, Laserna JJ. New Challenges and Insights in the Detection and Spectral Identification of Organic Explosives by Laser Induced Breakdown Spectroscopy. Spectrochimica Acta B: At Spectrosc (2011) 66:12–20. doi:10.1016/j.sab.2010.11.012
10. Gottfried JL, De Lucia FC, Munson CA, Miziolek AW. Laser-induced Breakdown Spectroscopy for Detection of Explosives Residues: A Review of Recent Advances, Challenges, and Future Prospects. Anal Bioanal Chem (2009) 395:283–300. doi:10.1007/s00216-009-2802-0
11. Moros J, Laserna J. Laser-Induced Breakdown Spectroscopy (LIBS) of Organic Compounds: A Review. Appl Spectrosc (2019) 73:963–1011. doi:10.1177/0003702819853252
12. De Lucia FC, Gottfried JL, Miziolek AW. Evaluation of Femtosecond Laser-Induced Breakdown Spectroscopy for Explosive Residue Detection. Opt Express (2009) 17:419–25. doi:10.1364/OE.17.000419
13. De Lucia, Jr. FC, Gottfried JL, Munson CA, Miziolek AW. Multivariate Analysis of Standoff Laser-Induced Breakdown Spectroscopy Spectra for Classification of Explosive-Containing Residues. Appl Opt (2008) 47:G112–21. doi:10.1364/AO.47.00G112
14. Gottfried JL, De Lucia, Jr FC, Munson CA, Miziolek AW. Strategies for Residue Explosives Detection Using Laser-Induced Breakdown Spectroscopy. J Anal Spectrom (2008) 23:205–16. doi:10.1039/b703891g
15. De Lucia FC, Gottfried JL, Munson CA, Miziolek AW. Double Pulse Laser-Induced Breakdown Spectroscopy of Explosives: Initial Study Towards Improved Discrimination. Spectrochimica Acta Part B: At Spectrosc (2007) 62:1399–404. doi:10.1016/j.sab.2007.10.036
16. Fernandez-Bravo A, Lucena P, Laserna JJ. Selective Sampling and Laser-Induced Breakdown Spectroscopy (LIBS) Analysis of Organic Explosive Residues on Polymer Surfaces. Appl Spectrosc (2012) 66:1197–203. doi:10.1366/12-06697
17. Mäkinen M, Nousiainen M, Sillanpää M. Ion Spectrometric Detection Technologies for Ultra-traces of Explosives: A Review. Mass Spectrom Rev (2011) 30:940–73. doi:10.1002/mas.20308
18. Kim S, Lee D, Liu X, Van Neste C, Jeon S, Thundat T. Molecular Recognition Using Receptor-free Nanomechanical Infrared Spectroscopy Based on a Quantum Cascade Laser. Sci Rep (2013) 3:1111. doi:10.1038/srep01111
19. Abdelhamid M, Fortes FJ, Harith MA, Laserna JJ. Analysis of Explosive Residues in Human Fingerprints Using Optical Catapulting-Laser-Induced Breakdown Spectroscopy. J Anal Spectrom (2011) 26:1445–50. doi:10.1039/c0ja00188k
20. DeLucia FC, Samuels AC, Harmon RS, Walters RA, McNesby KL, LaPointe A, et al. Laser-induced Breakdown Spectroscopy (LIBS): A Promising Versatile Chemical Sensor Technology for Hazardous Material Detection. IEEE Sensors J (2005) 5:681–89. doi:10.1109/JSEN.2005.848151
21. González R, Lucena P, Tobaria LM, Laserna JJ. Standoff LIBS Detection of Explosive Residues behind a Barrier. J Anal Spectrom (2009) 24:1123–6. doi:10.1039/b821566a
22. Moros J, Lorenzo JA, Lucena P, Miguel Tobaria L, Laserna JJ. Simultaneous Raman Spectroscopy−Laser-Induced Breakdown Spectroscopy for Instant Standoff Analysis of Explosives Using a Mobile Integrated Sensor Platform. Anal Chem (2010) 82:1389–400. doi:10.1021/ac902470v
23. De Lucia, Jr. FC, Gottfried JL, Munson CA, Miziolek AW. Multivariate Analysis of Standoff Laser-Induced Breakdown Spectroscopy Spectra for Classification of Explosive-Containing Residues. Appl Opt (2008) 47:G112–22. doi:10.1364/AO.47.00G112
24. Lazic V, Palucci A, Jovicevic S, Carpanese M. Detection of Explosives in Traces by Laser Induced Breakdown Spectroscopy: Differences from Organic Interferents and Conditions for a Correct Classification. Spectrochimica Acta Part B: At Spectrosc (2011) 66:644–55. doi:10.1016/j.sab.2011.07.003
25. Lazic V, Palucci A, Jovicevic S, Poggi C, Buono E. Analysis of Explosive and Other Organic Residues by Laser Induced Breakdown Spectroscopy. Spectrochimica Acta Part B: At Spectrosc (2009) 64:1028–39. doi:10.1016/j.sab.2009.07.035
26. De Lucia FC, Gottfried JL. Classification of Explosive Residues on Organic Substrates Using Laser Induced Breakdown Spectroscopy. Appl Opt (2012) 51:B83–92. doi:10.1364/AO.51.000B83
27. Gottfried JL, De Lucia FC, Munson CA, Miziolek AW. Standoff Detection of Chemical and Biological Threats Using Laser-Induced Breakdown Spectroscopy. Appl Spectrosc (2008) 62:353–63. doi:10.1366/000370208784046759
28. Fabre C. Advances in Laser-Induced Breakdown Spectroscopy Analysis for Geology: A Critical Review. Spectrochimica Acta Part B: At Spectrosc (2020) 166:105799. doi:10.1016/j.sab.2020.105799
29. Diedrich J, Rehse SJ, Palchaudhuri S. Escherichia Coliidentification and Strain Discrimination Using Nanosecond Laser-Induced Breakdown Spectroscopy. Appl Phys. Lett (2007) 90:163901. doi:10.1063/1.2723659
30. Harmon RS, DeLucia FC, LaPointe A, Winkel RJ, Miziolek AW. LIBS for Landmine Detection and Discrimination. Anal Bioanal Chem (2006) 385:1140–8. doi:10.1007/s00216-006-0513-3
31. Junjuri R, Gundawar MK. Femtosecond Laser-Induced Breakdown Spectroscopy Studies for the Identification of Plastics. J Anal Spectrom (2019) 34:1683–92. doi:10.1039/c9ja00102f
32. Sezer B, Durna S, Bilge G, Berkkan A, Yetisemiyen A, Boyaci IH. Identification of Milk Fraud Using Laser-Induced Breakdown Spectroscopy (LIBS). Int Dairy J (2018) 81:1–7. doi:10.1016/j.idairyj.2017.12.005
33. Schade W, Bohling C, Hohmann K, Scheel D. Laser-induced Plasma Spectroscopy for Mine Detection and Verification. Laser Part Beams (2006) 24:241–7. doi:10.1017/S0263034606060356
34. Ahmadi SH, Keshavarz MH, Hafizi Atabak HR. Introducing Laser Induced Breakdown Spectroscopy (LIBS) as a Novel, Cheap and Non-destructive Method to Study the Changes of Mechanical Properties of Plastic Bonded Explosives (PBX). Z Anorg Allg Chem (2018) 644:1667–73. doi:10.1002/zaac.201800415
35. Sreedhar S, Gundawar MK, Venugopal Rao S. Laser Induced Breakdown Spectroscopy for Classification of High Energy Materials Using Elemental Intensity Ratios. Dsj (2014) 64(4):332–8. doi:10.14429/dsj.64.4741
36. Rezaei AH, Keshavarz MH, Tehrani MK, Darbani MR. Assessment of Detonation Performance and Characteristics of 2,4,6-Trinitrotoluene Based Melt Cast Explosives Containing Aluminum by Laser Induced Breakdown Spectroscopy. Cent Eur J Energ Mater (2019) 16:3–20. doi:10.22211/cejem/104383
37. Gottfried JL, Harmon RS, De Lucia FC, Miziolek AW. Multivariate Analysis of Laser-Induced Breakdown Spectroscopy Chemical Signatures for Geomaterial Classification. Spectrochimica Acta Part B: At Spectrosc (2009) 64:1009–19. doi:10.1016/j.sab.2009.07.005
38. Liu K, Wang QQ, Zhao H, Xiao YL. Differentiation of Plastic with Laser Induced Breakdown Spectroscopy. Spectrosc Spectr Anal (2011) 31:1171–4. doi:10.3964/j.issn.1000-0593(2011)05-1171-04
39. Shaik AK, Epuru NR, Syed H, Byram C, Soma VR. Femtosecond Laser Induced Breakdown Spectroscopy Based Standoff Detection of Explosives and Discrimination Using Principal Component Analysis. Opt Express (2018) 26(7):8069–83. doi:10.1364/OE.26.008069
40. Shaik AK, Soma VR. Standoff Discrimination and Trace Detection of Explosive Molecules Using Femtosecond Filament Induced Breakdown Spectroscopy Combined with Silver Nanoparticles. OSA Continuum (2019) 2(3):554–62. doi:10.1364/OSAC.2.000554
41. Soma VR, Shaik AK. Femtosecond Filaments for Standoff Detection of Explosives. Def Sc Jl (2020) 70(4):359–65. doi:10.14429/dsj.70.14962
42. Gottfried JL, De Lucia FC, Munson CA, Miziolek AW. Double-pulse Standoff Laser-Induced Breakdown Spectroscopy for Versatile Hazardous Materials Detection. Spectrochimica Acta Part B: At Spectrosc (2007) 62:1405–11. doi:10.1016/j.sab.2007.10.039
43. De Lucia FC, Gottfried JL. Influence of Variable Selection on Partial Least Squares Discriminant Analysis Models for Explosive Residue Classification. Spectrochimica Acta Part B: At Spectrosc (2011) 66:122–8. doi:10.1016/j.sab.2010.12.007
44. Gottfried JL, De Lucia Jr. FC, Miziolek AW. Discrimination of Explosive Residues on Organic and Inorganic Substrates Using Laser-Induced Breakdown Spectroscopy. J Anal Spectrom (2009) 24:288–96. doi:10.1039/b818481j
45. Pinkham DW, Bonick JR, Woodka MD. Feature Optimization in Chemometric Algorithms for Explosives Detection. SPIE-IntSoc Opt Eng (2012) 8357:K1–7. doi:10.1117/12.923387
46. Sirven J-B, Sallé B, Mauchien P, Lacour J-L, Maurice S, Manhès G. Feasibility Study of Rock Identification at the Surface of Mars by Remote Laser-Induced Breakdown Spectroscopy and Three Chemometric Methods. J Anal Spectrom (2007) 22:1471–80. doi:10.1039/b704868h
47. Rao EN, Mathi P, Kalam SA, Sreedhar S, Singh AK, Jagatap BN, et al. Femtosecond and Nanosecond LIBS Studies of Nitroimidazoles: Correlation Between Molecular Structure and LIBS Data. J Anal Spectrom (2016) 31(3):737–50. doi:10.1039/C5JA00445D
48. Kalam SA, Murthy NL, Mathi P, Kommu N, Singh AK, Rao SV. Correlation of Molecular, Atomic Emissions with Detonation Parameters in Femtosecond and Nanosecond LIBS Plasma of High Energy Materials. J Anal Spectrom (2017) 32(8):1535–46. doi:10.1039/C7JA00136C
49. Vance T, Reljin N, Lazarevic A, Pokrajac D, Kecman V, Melikechi N, et al. Classification of LIBS Protein Spectra Using Support Vector Machines and Adaptive Local Hyperplanes. In: The 2010 International Joint Conference on Neural Networks (IJCNN); 18–23 July, 2010; Barcelona, Spain. IEEE (2010). p. 978.
50. Kira K, Rendell LA. A Practical Approach to Feature Selection. Proc 9th Int Work-shop Machine Learn (1992) 1992:249–56. doi:10.1016/B978-1-55860-247-2.50037-1
Keywords: LIBS, explosives, line region, reliefF algorithm, support vector machines, classification
Citation: Zhao Y, Wang QQ, Cui X, Teng G, Wei K and Liu H (2021) Laser-Induced Breakdown Spectroscopy for the Discrimination of Explosives Based on the ReliefF Algorithm and Support Vector Machines. Front. Phys. 9:675135. doi: 10.3389/fphy.2021.675135
Received: 02 March 2021; Accepted: 03 May 2021;
Published: 14 May 2021.
Edited by:
Ya-nan Zhang, Northeastern University, ChinaReviewed by:
Venugopal Rao Soma, University of Hyderabad, IndiaJohn Castro, Universidad Del Sinú, Colombia
Copyright © 2021 Zhao, Wang, Cui, Teng, Wei and Liu. This is an open-access article distributed under the terms of the Creative Commons Attribution License (CC BY). The use, distribution or reproduction in other forums is permitted, provided the original author(s) and the copyright owner(s) are credited and that the original publication in this journal is cited, in accordance with accepted academic practice. No use, distribution or reproduction is permitted which does not comply with these terms.
*Correspondence: Q. Q. Wang, cXF3YW5nQGJpdC5lZHUuY24=