 Mengke Wang
 Ying Xu
 Yali Zhang
 Heping Li
 Shangjian Zhang
- State Key Laboratory of Electronic Thin Films and Integrated Devices, School of Optoelectronic Science and Engineering, University of Electronic Science and Technology of China, Chengdu, China
A self-calibrated method to measuring the frequency responses of broadband photodetectors (PDs) is proposed based on photonic pulse sampling of two-tone microwave signal, with the help of a mode-locked laser diode (MLLD) and a Mach-Zehnder modulator (MZM). Firstly, the repetition frequency of the optical comb from the MLLD divides the whole measuring frequency range into several segments. Then, a close-spaced two-tone signal modulates every comb tooth through the MZM and generates the sum- and difference-frequency products, working as the probing signal to extract the frequency response of the PD in every segment. Hyper-fine frequency response of the PD at any frequency point can be obtained in every segment by subtly varying the center frequency of the two-tone signal while keeping the difference frequency fixed. Finally, the whole frequency response of the PD in ultra-wide frequency range is obtained by seamlessly stitching the segmental frequency responses. In our experiment, measurement of a commercial PD is demonstrated up to 49.765 GHz with an optical comb at the repetition frequency of 9.953 GHz and a two-tone modulation up to 4.9765 GHz. The measured results are compared with those by using the traditional methods to check accuracy. Moreover, the uneven responses of the MLLD and the MZM are fully subtracted, verifying the ultra-wideband, hyperfine and self-calibrated measurement of PDs based on the two-tone photonic sampling.
Introduction
Broadband photodetectors (PDs) are essential optical receiver components in optical fiber communication systems and microwave photonic links [1–3], and the frequency response measurement with high-resolution and high-accuracy is very critical to supporting the device characterization and link evaluation for high-spectral-efficiency optical communication systems and hyper-fine microwave photonic links [4–6].
There are numerous methods reported for characterizing frequency responses of PDs by employing all-optical or electro-optical stimulus. The all-optical methods can achieve ultra-wideband measurements of PDs based on the ultra-wideband optical stimulus. However, the optical wavelength-beating method requires to control the optical wavelength drifting and power fluctuation with extremely high accuracy [7–10], and the optical noise-beating method is subject to the poor signal-to-noise ratio and insufficient frequency resolution [11–14]. By contrast, the electro-optical methods make the best use of electro-optical modulation to improve the frequency resolution. However, the widely used electro-optical swept frequency method needs intense calibration to subtract the effect of the assisted modulator [15–17]. In order to alleviate the electro-optical calibration, the improved swept frequency method was proposed with the help of an electro-absorption modulator used as a modulator and a PD, provided that the frequency responses of the modulator and the PD are identical [18, 19]. The twice modulation method requires active bias control of two intensity modulators [20]. For the calibration-free and bias-drifting-free measurement, we proposed a frequency-shifted heterodyne scheme for extracting frequency responses of PDs [21–24]. Recently, we also presented a low-speed photonic sampling method for the frequency response measurement within ultra-wide frequency range based on a mode-locked laser diode (MLLD), which is also free of the uneven frequency responses of other components in the setup [25]. Nevertheless, the major difficulty of this method lies in that hyper-fine measurement of PD at any frequency point cannot be obtained, since the frequency resolution is limited to be tens of MHz by the repetition frequency of the MLLD.
In this work, we demonstrate a two-tone photonic sampling method, featuring hyper-fine frequency resolution and ultra-wide frequency range, for self-calibrated frequency response measurement of broadband PDs. As is shown in Figure 1, the optical pulses from a MLLD are sent to a Mach-Zehnder modulator (MZM) for two-tone modulation, and then are detected by the PD under test. Firstly, the whole frequency range is equally divided into several segments by the repetition frequency of the optical comb from the MLLD. The comb tooth in every segment mixes with the two-tone signal and generates the sum- and difference-frequency products, working as the probing signal to measure the frequency response of the PD, and then the hyper-fine frequency response of the PD at any frequency point is obtained in every segment by subtly varying the center frequency of the two-tone signal. Finally, the whole frequency response of the PD in ultra-wide frequency range can be obtained by stitching the multiple segments. It is noteworthy that the uneven response of the MLLD and the MZM are subtracted by carefully setting the two-tone photonic sampling. Theoretical basis and experimental results are elaborated in detail, where the experimental results agree well-with those obtained by employing the low-speed photonic sampling method.
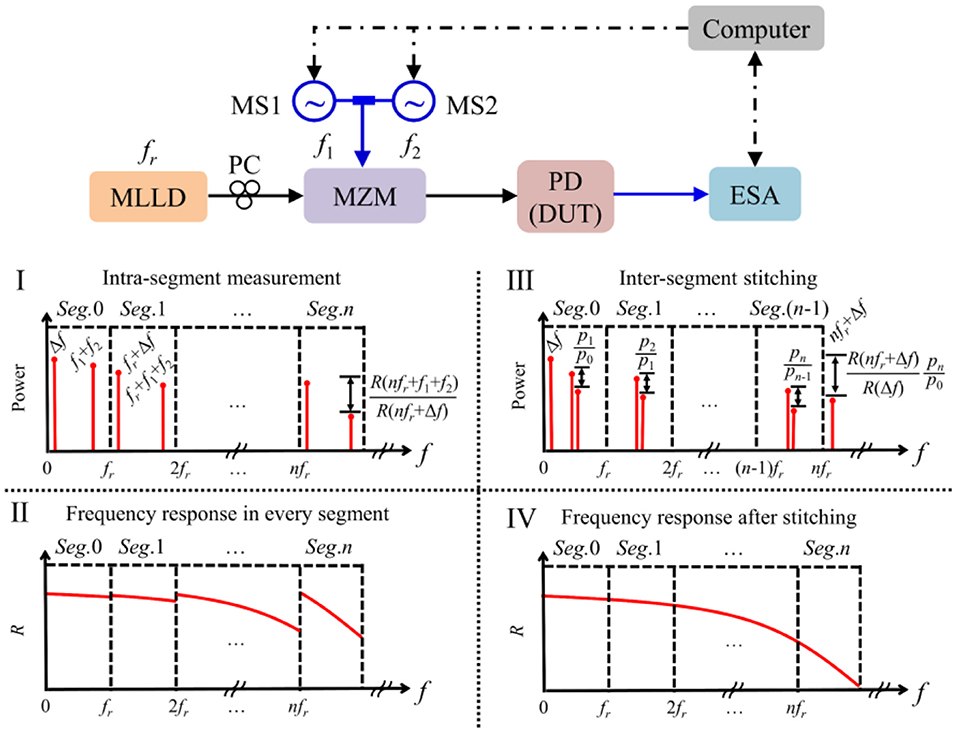
Figure 1. Schematic diagram of the proposed two-tone photonic sampling method, MLLD, mode-locked laser diode; PC, polarization controller; MZM, mach-zehnder modulator; MS, microwave source; PD, photodetector; DUT, device under test; ESA, electrical spectrum analyzer.
Theoretical Basis
The schematic diagram of the proposed two-tone photonic sampling is shown in Figure 1. The ultrashort pulses with a repetition frequency of fr from the MLLD is modulated by the two-tone signal at the frequencies of f1 and f2 via the MZM. After two-tone electro-optical modulation, upper- and lower-optical sidebands will be generated at both sides of the optical comb teeth of the MLLD. The two-tone sampling optical signals are then detected by the PD under test, and analyzed by an electrical spectrum analyzer (ESA). After photodetection, the two-tone upper- and lower-optical sidebands will mix with each other and generate sum- and difference-frequency products at the offset frequency of f1 ± f2 (f1 > f2) of the comb tooth at the frequency of nfr. As we know, each pair of optical upper- and lower-sidebands will keep equalized in the optical domain, and their amplitude difference in the electrical domain only depends on the frequency response of PD. In our method, the two-tone frequencies f1 and f2 are carefully chosen so that the lower frequency of Δf (= f1–f2) is fixed and close to DC, and the frequency response of the PD at the frequency of nfr + f1 + f2 with respect to the frequency of nfr + Δf can be calculated through the amplitude ratio between these two frequency components, which is shown in Figure 1(I). Then, through subtly varying f1 + f2 from 0 to fr while keeping f1–f2 constant, the relative frequency response of the PD at any frequency point between nfr + Δf (≈nfr) and nfr + f1 + f2 (≈(n + 1)fr) can be extracted in the n-th segment. As is presented in Figure 1(II), the frequency response at the frequency of nfr + f1 + f2 is normalized to that at the frequency of nfr + Δf in every segment. In order to obtain the whole frequency response of PD in ultra-wide frequency range, in our case, a specific two-tone frequency is carefully chosen to be f1' = fr/4 and f2' = fr/4-Δf to ensure all the frequency responses at the frequencies of nfr + Δf are referenced to the same fixed low-frequency of Δf as illustrated in Figure 1(III). Therefore, the segmental frequency responses are seamlessly stitched, as shown in Figure 1(IV), allowing for the self-calibrated measurement of frequency response of PDs within ultra-wide frequency range of (n + 1)fr.
Mathematically, the ultrashort optical pulses from the MLLD can be expressed in the optical domain as
Thereinto, f0 and ql are the central frequency of the amplitude of the optical comb from the MLLD, respectively. N represents the effective order of the optical comb tooth. The ultrashort optical pulses are injected into the MZM onto which two closely spaced tones v1(t) = v1sin2πf1t and v2(t) = v2sin2πf2t (f1 > f2, f1≈f2, and 0 < f1, f2 ≤ fr/2) are applied. The output optical field from the MZM can be written by [26].
with the asymmetric factor γ and the phase bias φb of the MZM. m1 and m2 are the modulation indices at the modulation frequencies of f1 and f2, respectively. Then, the photonic sampling signal is sent into the PD under test, and is then converted into electrical domain, which can be written as
where R is the responsivity of PD, Jp(·) and Jq(·) are the pth and qth-order Bessel function of the first kind, respectively. The coefficient pn represents the intensity of the comb tooth from the MLLD, expressed by
The two-tone signal will mix with each comb tooth and generate frequency up- and down-conversion components quantified as
where the bias status of the MZM is the same for these desired frequency components.
In our method, the whole measuring frequency range are divided into several segments by the repetition frequency fr of the MLLD. The frequency component at nfr + f1 + f2 is served as the probe signal to extract the high frequency response of PD under test, meanwhile the frequency component at nfr + Δf (Δf = f1–f2) is taken as the reference signal. Therefore, the frequency response of PD at the frequency of nfr + f1 + f2 relative to the frequency of nfr + Δf can be obtained in the n-th intra-segment measurement by
It is easily seen from Eqs. (4) and (5) that phase bias and the uneven response of the MZM is totally canceled out through the amplitude ratios of these frequency components, indicating the intra-segment measurement can be self-calibrated.
To characterize the PD in the whole frequency range, the frequency responses of PD at the frequency of nfr + Δf are required to be referenced to that at the same low-frequency of Δf (n = 0) so that all the segmental frequency responses can be seamlessly stitched. According to Eq. (4a), the frequency response of PD at the frequency of nfr + Δf (= nfr + f1'–f2') relative to the frequency of Δf (= f1'–f2') is written by
where the term p0/pn represents the uneven comb intensity of the MLLD. For the inter-segment stitching, the two-tone frequencies are carefully set to be f1' = fr/4 and f2' = fr/4-Δf, to have the assumptions of ifr + f1' + f2'≈(i + 1)fr–f1'–f2' and R(ifr + f1' + f2')≈R[(i + 1)fr–f1'–f2'] (i = 0~n−1) stand. In this case, the uneven comb intensity of the MLLD can be obtained by comparing these two frequencies, given by
Through substituting Eq. (7) into Eq. (6), any frequency response of PD at the frequency of nfr + Δf can be uniformly referenced to the same low-frequency of Δf. It is easily seen from Eqs. (4–6) that the uneven comb intensity of the MLLD is totally subtracted, indicating the inter-segment stitching can be self-referenced. Moreover, through slightly sweeping the two-tone frequencies from 0 to fr/2, the relative frequency response of PD at any frequency can be extracted within the measuring frequency range of (n + 1)fr.
Results and Analysis
In our experiment, the ultrashort optical pulses come from a MLLD with the repetition frequency of 9.953 GHz (fr) and the output power of 0.58 dBm. The two-tone signal provided by two microwave sources (MSs, R&S SMB100A) is loaded onto a MZM (EOSPACE AX-0MSS-10) through a microwave combiner. The optical sampling signal after the MZM is detected by the PD under test (DSC 10H), and the output electrical spectrum is acquired and analyzed by an ESA (R&S FSU50). In the measurement, the whole measuring frequency range of 49.765 GHz is divided into five segments (= 5 × fr, n = 0~4) by the repetition frequency of 9.953 GHz (fr). The two-tone frequency is chosen to be f1–f2 = 1 MHz (Δf = 1 MHz), where Δf can be taken other smaller values as long as the desired frequency component can be distinguished by the employed ESA, and it will not affect the measurement results. In this case, the frequency response of PD at the frequency of nfr + f1 + f2 with respect to the frequency of nfr + Δf can be calculated in the intra-segment measurement. Figure 2 shows typical electrical spectra around nfr + f1 + f2 and nfr + Δf in the initial (n = 0), first (n = 1), second (n = 2) and third (n = 3) segment under different two-tone modulations, where the resolution bandwidth (RBW) of the ESA is set as 500 Hz. For example, when the two-tone frequencies of f1 and f2 are set to be 4.97 GHz and 4.969 GHz, the electrical powers at the frequencies of 1 MHz (Δf) and 9.939 GHz (f1 + f2) are measured to be −59.07 dBm and −60.63 dBm in the initial segment (n = 0). According to Eq. (5), the frequency response of PD at the frequency of 9.939 GHz (f1 + f2) with respect to the frequency of 1 MHz (Δf) is calculated as−1.56 dB (= −60.63+59.07). Under the same condition, the electrical powers at the frequencies of 9.954 GHz (fr + Δf) and 19.892 GHz (fr + f1 + f2) are measured to be −62.99 dBm and −60.65 dBm in the first segment (n = 1). Thus, the frequency response of PD at the frequency of 19.892 GHz (fr + f1 + f2) with respect to the frequency of 9.954 GHz (fr + Δf) is solved to be 2.34 dB (= −60.65+62.99) in the first segment (n = 1). Similarly, the frequency response of PD at the frequency of nfr + f1 + f2 with respect to the frequency of nfr + Δf can be obtained for other segments (n = 2, 3, 4). In addition, through slightly sweeping the two-tone frequencies from 0 to 4.9765 GHz (fr/2), the frequency response of PD at any frequency with respect to the reference frequency in each segment can be obtained, as displayed in Figure 4.
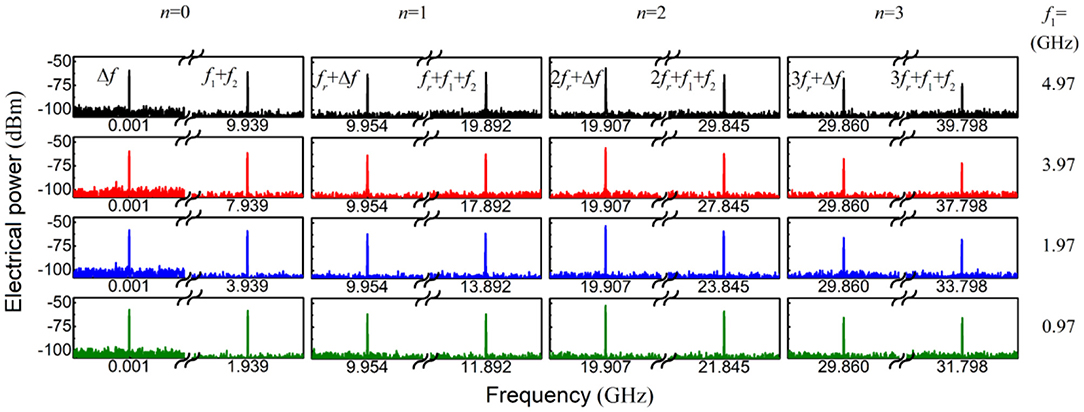
Figure 2. Measured electrical spectra around nfr + f1 + f2 and nfr + Δf in the initial (n = 0), first (n = 1), second (n = 2) and third (n = 3) segment under different two-tone modulations.
To stitch the five segments, the two-tone frequencies are carefully set to be f1' = 2.48825 GHz (fr/4) and f2' = 2.48725 GHz (fr/4-Δf), and the measured electrical spectra around nfr + Δf, ifr + f1' + f2' and (i + 1)fr–f1'–f2' are illustrated in Figure 3 for different segments. For example, the desired frequency components are measured to be −56.70 dBm at 1 MHz (Δf),−59.21 dBm at 9.954 GHz (fr + Δf),−58.79 dBm at 4.9755 GHz (f1' + f2') and −59.82 dBm at 4.9775 GHz (fr–f1'–f2'), respectively. According to Eqs. (6) and (7), the uneven comb intensity p0/p1 of the MLLD can be determined to be 1.03 dB, and then the frequency response of PD at the frequency of 9.954 GHz (fr + Δf) relative to the low-frequency of 1 MHz (Δf) can be solved to be −1.48 dB in the initial segment (n = 0). Therefore, the frequency response of PD at the frequency of 19.892 GHz (fr + f1 + f2) in the first segment (n = 1) can be referenced to that at the low-frequency of 1 MHz (Δf) in the initial segment (n = 0), and is calculated as 0.86 dB (2.34–1.48). Similarly, the uneven comb intensity p0/p2 of the MLLD can be solved to be 2.85 dB, and the frequency response of PD at the frequency of 19.907 GHz (2fr + Δf) in the second segment (n = 2) relative to the frequency of 1 MHz (Δf) in the initial segment (n = 0) can be determined to be 0.46 dB. In this case, the frequency response of PD at any frequency of nfr + f1 + f2 relative to the same low-frequency of Δf can be extracted, and the frequency responses of all five segments can be stitched together, as shown in Figure 4.
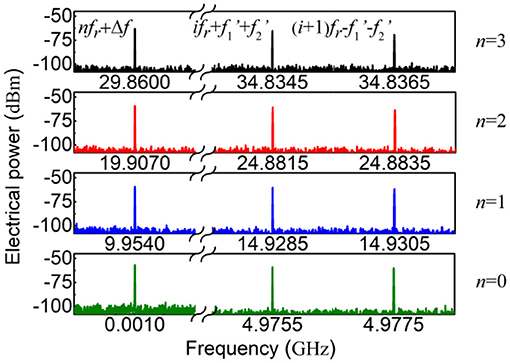
Figure 3. Measured electrical spectra around nfr + Δf, ifr + f1' + f2' and (i + 1)fr–f1'–f2' for different segments.
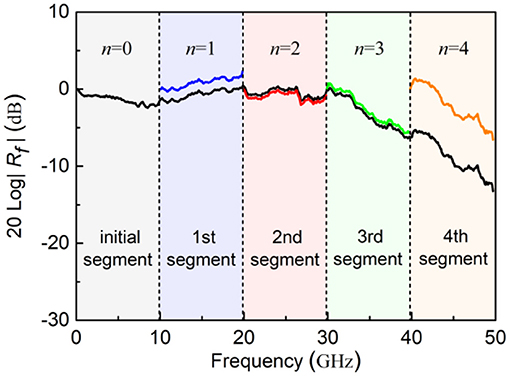
Figure 4. Measured frequency response of PD before and after inter-segment stitching.
Figure 5 shows the measured results with the proposed method and the method in [23] as well as the manufacturer data. The good consistency between these results verifies the effectiveness of the proposed method. To further demonstrate hyperfine measurement, the frequency response of PD has been finely measured at around 32.51 GHz, as shown in the Figure 5. It can be seen that there are only four data points in the frequency range of 300 MHz based on the method in [23], which is limited by the repetition frequency of 96.9 MHz of the employed MLLD. In contrast, our method enables hyperfine measurement with different frequency steps, such as 300 kHz, 10 kHz and 10 Hz, which is mainly limited by the coherence characteristics of the ultrashort optical pulses, the tuning step of the MS and the RBW of the ESA. As displayed in Figure 2, the output electrical spectra from PD show extremely narrow spectral lines, indicating the inherent coherence of the ultrashort optical pulse source. The tuning step of the MS is 1 Hz, and the minimum RBW of the ESA is 10 Hz. Therefore, our method can be qualified by the hyperfine measurement of 10 Hz level.
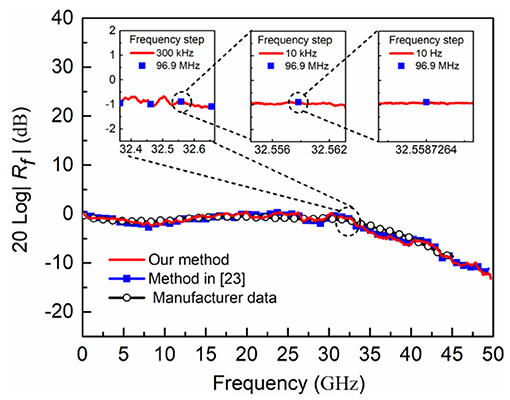
Figure 5. Measured frequency response of PD with different methods and resolutions.
Measurement Uncertainty
For the accuracy, the measurement uncertainty of the proposed method is investigated. In the intra-segment measurement, the uncertainty of the relative frequency response of PD in the n-th segment can be derived by the total derivative of Eq. (5)
According to the specification of ESA, the measurement uncertainty of amplitude is 0.05 dB when the range of RBW is from 10 Hz to 100 kHz. Therefore, the relative frequency response of PD in the n-th segment would have an uncertainty of <0.1 dB (= 0.05 × 2). It means that the uncertainty of the relative frequency response of PD in the initial segment (n = 0) is 0.1 dB, corresponding to a relative error of 1.16% [= (100.1/20-1) × 100%].
In the inter-segment stitching, the uncertainty of the frequency response of PD at the frequency of nfr + Δf relative to the frequency of Δf can also be obtained by the total derivative of Eq. (6)
Thereinto, the uncertainty of the uneven response p0/pn induced by the MLLD is mainly determined by the assumption of PD responsivity, that is R(ifr + f1' + f2')≈R[(i + 1)fr–f1'–f2'] (i = 0~n−1). In the experiment, the frequency difference of these two components is set to be 2 MHz (= 2 × Δf), and an uncertainty of the PD responsivity fluctuation introduced by the frequency difference is 0.05 dB based on the PD's specification. Thus, the uncertainty of the uneven response p0/pn from the MLLD would be 0.05 × n dB. This uncertainty can be reduced by further reducing the frequency difference. Meanwhile, the measurement amplitude uncertainty of ESA is 0.05 dB. Therefore, the frequency response of PD at the frequency of nfr + Δf relative to the frequency of Δf will have an uncertainty of <0.05 × (n + 2) dB based on Eq. (9).
Finally, the frequency response of PD at the frequency of nfr + f1 + f2 relative to the fixed low frequency of Δf has a total uncertainty of no more than 0.05 × (n + 4) dB (n = 1, 2, 3, 4), which is directly related to the number of the frequency segments. t means that the maximum uncertainty in the experiment is 0.4 dB (= 0.05 × 8), and the corresponding relative error is 4.71% [= (100.4/20-1) × 100%].
Discussion and Conclusions
In the proposed method, the measuring frequency range of PD is related to the repetition frequency and the effective tooth number of the ultrashort optical pulses from the MLLD, which can be theoretically extended up to (2n + 1)fr. In the proof-of-concept experiment, the measurement of PD is only performed up to 49.765 GHz (= 5 × fr, fr = 9.953 GHz), which is mainly limited by the operation bandwidth of the ESA (20 Hz~50 GHz). In addition, the method is also applicable for the MLLD with low or higher repetition frequency. If a MLLD with lower repetition frequency is used as the ultrashort optical pulse source, the sweeping frequency range of the two-tone signal can be further reduced, which is only half of the repetition frequency. However, a lower repetition frequency of MLLD will result in more frequency segments and larger measurement uncertainty, so in practical applications, the repetition frequency of MLLD should be compromised in terms of the sweeping frequency range of MS and the measurement uncertainty. If the measurement uncertainty is to be reduced and a higher sweeping frequency range of the two-tone signal can be acceptable, a higher repetition frequency MLLD is better for measurement. In addition, the influence introduced by the phase bias of the MZM can be canceled out by the relative amplitudes of the desired frequency components. However, for a better signal-to-noise ratio (SNR), it is recommended to adjust the phase bias φb of MZM to make |cosφb| as large as possible.
In conclusion, we have demonstrated a self-calibrated method for measuring frequency response of broadband PDs through two-tone photonic sampling. The two-tone microwave signal mixes with the optical comb of MLLD, and generates the sum- and difference-frequency products, working as the probing signal to extract the frequency response of PDs. Hyper-fine frequency response of PDs at any frequency point in intra-segment measurement is obtained by subtly varying the center frequency of the two-tone signal. Moreover, the frequency response of the PD can be obtained in ultra-wide frequency range by inter-segment stitching. In our method, the uneven responses of the MLLD and the MZM are completely eliminated through carefully setting the two-tone photonic sampling, enabling ultra-wideband, hyperfine and self-calibrated measurement for high-speed PDs.
Data Availability Statement
The raw data supporting the conclusions of this article will be made available by the authors, without undue reservation.
Author Contributions
MW discussed with YZ, ZZ, HL, and YL, and drafted the content of the manuscript. MW and YX completed the experiment. YH and ZL participated in the analysis and discussion of the experimental results. SZ guided and revised the manuscript. All authors contributed to the article and approved the submitted version.
Funding
This work was supported by the National Key Research and Development Program of China (2019YFB2203500), the National Natural Science Foundation of China (NSFC) (61927821), the Joint Research Fund of Ministry of Education of China (6141A02022436), and the Fundamental Research Funds for the Central Universities (ZYGX2019Z011).
Conflict of Interest
The authors declare that the research was conducted in the absence of any commercial or financial relationships that could be construed as a potential conflict of interest.
References
1. Yao JP. Microwave photonics. J Lightwave Technol. (2009) 27:314–35. doi: 10.1109/JLT.2008.2009551
2. Minasian RA, Chan EHW, Yi X. Microwave photonic signal processing. Opt Express. (2013) 21:22918–36. doi: 10.1364/OE.21.022918
3. Capmany J, Li GF, Lim C, Yao JP. Microwave photonics: current challenges towards widespread application. Opt Express. (2013) 21:22862–7. doi: 10.1364/OE.21.022862
4. Winzer PJ. High-spectral-efficiency optical modulation formats. J Lightwave Technol. (2012) 30:3824–35. doi: 10.1109/JLT.2012.2212180
5. Li Q, Li K, Fu Y, Xie X, Yang Z, Beling A, et al. High-power flip-chip bonded photodiode with 110 GHz bandwidth. J Lightwave Technol. (2016) 34:2139–44. doi: 10.1109/JLT.2016.2520826
6. Baumgartner Y, Caimi D, Sousa M, Hopstaken M, Salamin Y, Baeuerle B, et al. High-speed CMOS-compatible III-V on Si membrane photodetectors. Opt Express. (2021) 29:509–16. doi: 10.1364/OE.414013
7. Tan TS, Jungerman RL, Elliott SS. Optical receiver and modulator frequency response measurement with a Nd:YAG ring laser heterodyn technique. IEEE T Microw Theory. (1989) 37:1217–22. doi: 10.1109/22.31081
8. Wang LX, Zhu NH, Ke JH, Li W, Chen SF, Xie L. Improved peak power method for measuring frequency responses of photodetectors in a self-heterodyne system. Microw Opt Technol Lett. (2010) 52:2199–203. doi: 10.1002/mop.25448
9. Feng XJ, Yang P, He LB, Niu F, Zhong B, Xu H. Heterodyne system for measuring frequency response of photodetectors in ultrasonic applications. IEEE Photon Technol Lett. (2016) 28:1360–2. doi: 10.1109/LPT.2016.2542839
10. Feng XJ, Yang P, He LB, Xing GZ, Wang M, Ke W. Improved heterodyne system using double-passed acousto-optic frequency shifters for measuring the frequency response of photodetectors in ultrasonic applications. Opt Express. (2020) 28:4387–97. doi: 10.1364/OE.381107
11. Eichen E, Schlafer J, Rideout W, Mccabe J. Wide-bandwidth receiver photodetector frequency response measurements using amplified spontaneous emission from a semiconductor optical amplifier. J Lightwave Technol. (1990) 8:912–6. doi: 10.1109/50.54509
12. Baney DM, Sorin WV. Broadband frequency characterization of optical receivers using intensity noise. Hewlett Packard J. (1995) 46:6–12.
13. Baney DM, Sorin WV, Newton SA. High-frequency photodiode characterization using a filtered intensity noise technique. IEEE Photon Technol Lett. (1994) 6:1258–60. doi: 10.1109/68.329656
14. Xie FZ, Kuhl D, Bottcher EH, Ren SY, Bimberg D. Wide-band frequency response measurements of photodetectors using low-level photocurrent noise detection. J Appl Phys. (1993) 73:8641–6. doi: 10.1063/1.353397
15. Uehara S. Calibration of optical modulator frequency response with application to signal level control. Appl Opt. (1978) 17:68–71. doi: 10.1364/AO.17.000068
16. Humphreys DA, Harper MR, Smith AJA, Smith IM. Vector calibration of optical reference receivers using a frequency-domain method. IEEE Trans Instrum Meas. (2005) 54:894–7. doi: 10.1109/TIM.2004.843325
17. Ye Q, Yang C, Chong Y. Measuring the frequency response of photodiode using phase-modulated interferometric detection. IEEE Photon Technol Lett. (2014) 26:29–32. doi: 10.1109/LPT.2013.2280767
18. Wu XM, Man JW, Xie L, Liu JG, Liu Y, Zhu NH. A new method for measuring the frequency response of broadband optoelectronic devices. IEEE Photonics J. (2012) 4:1679–85. doi: 10.1109/JPHOT.2012.2213297
19. Wu XM, Man JW, Xie L, Liu Y, Qi XQ, Wang LX, et al. Novel method for frequency response measurement of optoelectronic devices. IEEE Photon Technol Lett. (2012) 24:575–7. doi: 10.1109/LPT.2012.2183122
20. Yoshioka M, Sato S, Kikuchi T. A method for measuring the frequency response of photodetector modules using twice-modulated light. J Lightwave Technol. (2005) 23:2112–7. doi: 10.1109/JLT.2005.846905
21. Zhang SJ, Wang H, Zou XH, Zhang YL, Lu RG, Li HP, et al. Optical frequency-detuned heterodyne for self-referenced measurement of photodetectors. IEEE Photon Technol Lett. (2015) 27:1014–7. doi: 10.1109/LPT.2015.2405253
22. Wang H, Zhang SJ, Zou XH, Zhang YL, Lu RG, Zhang ZY, et al. Two-tone intensity-modulated optical stimulus for self-referencing microwave characterization of high-speed photodetectors. Opt Commun. (2016) 373:110–3. doi: 10.1016/j.optcom.2015.08.028
23. Zhang SJ, Zhang C, Wang H, Zou XH, Zhang YL, Liu Y, et al. Self-calibrated microwave characterization of high-speed optoelectronic devices by heterodyne spectrum mapping. J Lightwave Technol. (2017) 35:1952–61. doi: 10.1109/JLT.2017.2678978
24. Zhang SJ, Wang H, Zou XH, Zhang C, Zhang YL, Zhang ZY, et al. Electrical probing test for characterizing wideband optical transceiving devices with self-reference and on-chip capability. J Lightwave Technol. (2018) 36:4326–36. doi: 10.1109/JLT.2018.2822944
25. Wang MK, Zhang SJ, He YT, Liu Z, Zhang XY, Wang H, et al. Self-referenced frequency response measurement of high-speed photodetectors through segmental up-conversion based on low-speed photonic sampling. Opt Express. (2019) 27:38250–8. doi: 10.1364/OE.382798
Keywords: frequency response, photodetectors, photonic sampling, optical fiber communication, microwave photonics
Citation: Wang M, Xu Y, He Y, Liu Z, Zhang Y, Zhang Z, Li H, Zhang S and Liu Y (2021) Self-Calibrated Measurement of Frequency Response for Broadband Photodetectors Based on Two-Tone Photonic Sampling. Front. Phys. 9:678777. doi: 10.3389/fphy.2021.678777
Received: 10 March 2021; Accepted: 14 April 2021;
Published: 13 May 2021.
Edited by:
Jinjin Li, Shanghai Jiao Tong University, ChinaReviewed by:
Xie Liang, Institute of Semiconductors (CAS), ChinaZizheng Cao, Eindhoven University of Technology, Netherlands
Copyright © 2021 Wang, Xu, He, Liu, Zhang, Zhang, Li, Zhang and Liu. This is an open-access article distributed under the terms of the Creative Commons Attribution License (CC BY). The use, distribution or reproduction in other forums is permitted, provided the original author(s) and the copyright owner(s) are credited and that the original publication in this journal is cited, in accordance with accepted academic practice. No use, distribution or reproduction is permitted which does not comply with these terms.
*Correspondence: Shangjian Zhang, c2p6aGFuZ0B1ZXN0Yy5lZHUuY24=